Abstract
Typhoon-induced hazards in South Korea exhibit strong spatial heterogeneity, requiring localized assessments to support impact-based early warning. This study develops a district-level typhoon hazard framework by integrating high-resolution meteorological fields with structural and hydrological vulnerability indicators. Two impact-oriented indices were formulated: the Strong Wind Risk Index (SWI), based on 3 s gust wind intensity and building-age fragility, and the Heavy Rainfall Risk Index (HRI), combining probable maximum precipitation with permeability and river-network density. Hazard levels were classified into four categories, Attention, Caution, Warning, and Danger, using district-specific percentile thresholds consistent with the THIRA methodology. Nationwide analysis across 250 districts revealed a pronounced coastal–inland gradient: mean SWI and HRI values in Busan were approximately 1.9 and 6.3 times higher than those in Seoul, respectively. Sub-district mapping further identified localized hotspots driven by topographic exposure and structural vulnerability. By establishing statistically derived, region-specific thresholds, this framework provides an operational foundation for integrating localized hazard interpretation into Korea’s Typhoon Ready System (TRS). The results strengthen the scientific basis for adaptive, evidence-based early warning and climate-resilient disaster-risk governance.
1. Introduction
Meteorological hazards associated with tropical cyclones in the Northwest Pacific Basin repeatedly disrupt infrastructure, public health, and socio-economic systems across East Asia [1,2]. South Korea is particularly vulnerable to these hazards due to its location along the recurving pathways of Western North Pacific typhoons, whose intensity and frequency have exhibited significant long-term variability driven by climate change and large-scale ocean–atmosphere interactions [3,4]. These typhoon events frequently generate destructive winds and short-duration extreme rainfall, producing cascading impacts such as urban flooding, landslides, transportation disruption, and widespread infrastructure damage [5,6].
Despite these substantial impacts, most typhoon risk assessments in Korea have relied on coarse administrative units or post-event case studies, which do not adequately capture the fine-scale spatial heterogeneity of hazard exposure and vulnerability [7,8]. In practice, disaster preparedness and emergency response in Korea are implemented at the si/gun/gu and eup/myeon/dong levels. However, existing national warning thresholds assume homogeneous hazard environments across the country, overlooking well-documented differences between inland areas such as Seoul and coastal metropolitan regions such as Busan [9,10,11,12]. This mismatch reduces the operational relevance of early-warning systems and limits the ability of local authorities to implement risk-sensitive disaster management strategies.
Recent advances in numerical weather prediction, high-resolution environmental datasets, and geospatial modeling have enabled district-level evaluation of typhoon-induced wind and rainfall hazards [13,14,15]. These developments align with global trends toward impact-based early-warning systems, particularly the Threat and Hazard Identification and Risk Assessment (THIRA) methodology [16,17,18] and the Sendai Framework for Disaster Risk Reduction [19], both of which emphasize localized, consequence-oriented hazard classification. However, in the Korean context, a unified district-scale framework that integrates meteorological intensity with structural and hydrological vulnerability has not yet been established.
To address this gap, the present study develops a nationwide, district-level typhoon hazard assessment for South Korea using high-resolution meteorological observations, urban infrastructure data, and geospatial datasets [20,21,22,23]. Two complementary indicators are introduced:
- (1)
- The Strong Wind Risk Index (SWI), which integrates estimated 3 s gust winds derived from meteorological observations and gust-factor methodology with district-level structural vulnerability; and
- (2)
- The Heavy Rainfall Risk Index (HRI), which combines short-duration extreme rainfall, impervious-surface characteristics, and river-network density to quantify local hydrological susceptibility.
Both indices are constructed consistently across all 250 si/gun/gu districts, enabling comparative evaluation of wind- and rainfall-related hazards.
The contributions of this study are threefold.
First, it provides the first national-scale, district-level hazard maps for typhoon-induced wind and rainfall in South Korea.
Second, it establishes percentile-based hazard thresholds consistent with THIRA principles, offering a localized and operationally transparent classification system.
Third, by contrasting Seoul (inland, topographically sheltered) and Busan (coastal, high-exposure) at the eup/myeon/dong level, the study demonstrates the limitations of uniform national thresholds and highlights the need for region-specific early-warning criteria for Korea’s emerging Typhoon Ready System (TRS).
Overall, this work offers a scientifically grounded and operationally scalable foundation for localized hazard assessment, risk-informed planning, and next-generation impact-based typhoon early-warning services in South Korea.
2. Data and Methods
2.1. Study Domain and Spatial Units
This study covers the entire Korean Peninsula, which is frequently affected by typhoons generated in the Northwest Pacific Basin. All primary spatial analyses were conducted at the si/gun/gu administrative district level (n = 250), the operational unit used for disaster response, impact-based forecasting, and resource allocation in South Korea. The use of this district scale enables hazard assessments that reflect the administrative framework through which preparedness and emergency measures are implemented.
To examine finer-scale spatial variability within highly populated urban areas, supplementary analyses were performed at the gu and eup/myeon/dong sub-district levels for two representative metropolitan regions: Seoul, an inland city with relatively sheltered topographic conditions, and Busan, a coastal city with high exposure to landfalling and recurving typhoons. These two regions exhibit fundamentally different climatological hazard environments and vulnerability characteristics, making them suitable case studies for evaluating intra-urban contrasts.
Administrative boundary shapefiles for national, district, and sub-district units were obtained from the National Spatial Data Infrastructure (NSDI) of Korea [19], which provides standardized geospatial datasets for land administration, hydrological mapping, and urban planning. All spatial datasets were projected to the national coordinate system (EPSG:5179) prior to analysis.
2.2. Data Source
Historical typhoon records and associated meteorological variables including 10min sustained wind speed, derived 3 s gust wind speed, and event-total precipitation were obtained from the Korea Meteorological Administration (KMA) Weather Data Service [19]. Typhoon events affecting South Korea during 2002–2021 were identified based on official advisories and best-track information provided by KMA. Maximum 3 s gust wind speed was calculated from sustained wind data using a gust-factor conversion method widely applied in Korean typhoon hazard studies [20].
District-level vulnerability and exposure indicators were compiled from multiple national datasets. Building age distributions, used as a proxy for structural fragility, were obtained from the Ministry of Land, Infrastructure and Transport (MOLIT) building registry [21]. Land-cover and surface-permeability information were acquired from thematic datasets provided by Statistics Korea and the National Spatial Data Infrastructure (NSDI) portal [22], enabling consistent derivation of impermeable-surface ratios for each administrative district. River-network density was estimated from NSDI hydrographic geospatial layers [23] using standard linear-density calculations (length per area).
All datasets were spatially harmonized to si/gun/gu administrative boundaries for national-scale analyses and to gu- and eup/myeon/dong-level boundaries for the metropolitan analyses in Seoul and Busan. Data preprocessing, spatial overlays, and variable tabulations were performed within a GIS environment to ensure consistent spatial resolution and comparability across all variables. Data preprocessing, spatial overlays, and variable tabulations were performed using ArcGIS Pro 3.1 (Esri, Redlands, CA, USA) to ensure consistent spatial resolution and comparability across all variables.
2.3. Strong Wind Risk Index (SWI)
The Strong Wind Risk Index (SWI) quantifies district-level wind hazard by integrating typhoon-induced peak wind intensity with the relative structural fragility of the built environment. The index is defined as:
: the maximum 3 s gust wind speed associated with typhoon passage in district i (unit: m s−1), derived from 10-min sustained winds using a widely applied gust-factor conversion method.
the number of buildings constructed before 1990 in district i.
: the total number of buildings in district i.
Because the structural vulnerability ratio is dimensionless, SWI retains the physical units of gust wind speed (m s−1). This formulation explicitly reflects the empirical evidence that older structures built prior to the widespread implementation of modern wind-resistant design standards exhibit substantially higher failure probabilities under extreme winds [21,22,23].
The SWI therefore captures the interaction between meteorological forcing (gust wind intensity) and exposure-driven fragility (age-based structural vulnerability). As a result, two districts experiencing comparable meteorological winds may yield widely different SWI values depending on the age distribution of their building stocks. This enables SWI to represent wind hazard in a manner that is both physically interpretable and operationally meaningful for district-level preparedness and impact-based typhoon risk assessment.
2.4. Heavy Rain Risk Index (HRI)
The Heavy Rainfall Risk Index (HRI) represents district-level rainfall hazard by integrating hydrometeorological extremes with surface- and drainage-driven flood susceptibility. The index is formulated as:
: the Probable Maximum Precipitation (PMP) in district i (unit: mm), estimated using moisture-maximization and storm-transposition methods widely applied in Korean PMP assessments [24,25].
: a dimensionless permeability weight derived from the impervious-surface ratio of district i, calculated from NSDI 30-m land-cover datasets. The weight ranges from 0.5 for highly permeable districts (e.g., forested or rural areas) to 2.0 for highly impervious urban districts.
: river-network density (unit: km km−2), defined as the total length of hydrographic channels divided by the district’s area, derived from NSDI hydrographic layers [18] following standard linear-density calculations.
This multiplicative formulation reflects the physical mechanisms through which extreme rainfall generates damaging hydrological responses. Districts characterized by dense drainage networks and extensive impervious surfaces exhibit faster runoff generation, reduced infiltration capacity, and higher flash-flood potential—even under comparable rainfall totals. Because the permeability weight is dimensionless, the resulting HRI maintains the composite unit of mm km−1, allowing the index to represent both meteorological forcing and hydrological susceptibility.
The inclusion of permeability and drainage-network terms is consistent with empirical evidence showing that typhoon-related flood impacts in Korea are strongly modulated by urbanization intensity, drainage connectivity, and catchment geometry rather than precipitation magnitude alone [26]. Accordingly, HRI provides a more realistic spatial representation of potential typhoon-driven flood severity than precipitation-only metrics.
2.5. Hazard Classification Framework
To ensure consistent interpretation of typhoon-related hazard intensity and to enable operational impact-based early warning, this study classifies SWI- and HRI-derived hazard levels into four categories: Attention, Caution, Warning, and Danger. The Threat and Hazard Identification and Risk Assessment (THIRA) framework, developed by the U.S. Federal Emergency Management Agency (FEMA), does not prescribe universal numerical thresholds; instead, it emphasizes scalable, consequence-based categorization that can be tailored to local hazard environments [18]. This flexibility is particularly important for South Korea, where typhoon exposure and vulnerability differ markedly across coastal, urban, and inland regions.
Following THIRA principles, a percentile-based statistical classification scheme was developed using the empirical distributions of SWI and HRI across the 250 administrative districts. Each district is assigned to a hazard category according to its percentile rank (Table 1):

Table 1.
Percentile-based hazard classification criteria used in this study.
This percentile-based approach avoids the limitations of fixed national thresholds, which may underestimate high-exposure coastal hazards or overestimate inland risks. Instead, it reflects the actual hazard climatology experienced at the district scale and allows consistent, evidence-based comparisons across diverse regional environments. Furthermore, adopting this percentile-centered framework provides a standardized yet locally adaptive basis for integrating hazard levels into Korea’s emerging Typhoon Ready System (TRS), supporting clearer communication, targeted preparedness, and more efficient emergency-response decision-making.
2.6. Spatial Analysis and Visualization
Spatial analyses of the Strong Wind Risk Index (SWI) and Heavy Rainfall Risk Index (HRI) were conducted for all 250 si/gun/gu administrative districts to characterize national-scale hazard patterns and inter-regional contrasts across the Korean Peninsula. Additional high-resolution analyses were performed for Seoul and Busan at the gu sub-district level to capture intra-urban variability representative of inland and coastal metropolitan environments, respectively.
Administrative boundary shapefiles were obtained from the National Spatial Data Infrastructure (NSDI) platform [18] and standardized for spatial overlays, attribute joining, and projection consistency. SWI and HRI values were spatially linked to each administrative unit using unique district identifiers to ensure accurate georeferencing and district-level comparability.
Hazard distributions were visualized using GIS-based thematic mapping. Color scales, class breaks, and legend structures were standardized according to the percentile-based hazard categories (Attention, Caution, Warning, Danger) defined in Section 2.5, enabling direct comparison between wind- and rainfall-related hazard patterns. For Seoul and Busan, detailed sub-district maps were produced to reveal localized hotspots that cannot be identified at broader administrative levels.
All maps include north arrows, scale bars, clearly delineated administrative boundaries, and units (m s−1 for SWI; mm km−1 for HRI), ensuring interpretability and adherence to cartographic quality requirements. This visualization framework provides district-level hazard information suitable for integration into Korea’s Typhoon Ready System (TRS), supporting impact-based early-warning communication and preparedness planning.
3. Results
3.1. Spatial Distribution of SWI and HRI Across South Korea
Figure 1 presents the nationwide spatial distribution of the Strong Wind Risk Index (SWI; unit: m s−1) and Heavy Rainfall Risk Index (HRI; unit: mm km−1) across all 250 si/gun/gu administrative districts. Both indices exhibit pronounced spatial heterogeneity, reflecting regional differences in typhoon exposure, topography, land-surface conditions, and structural vulnerability.
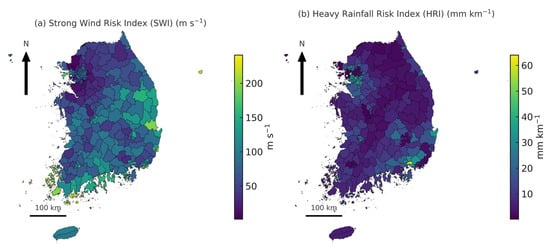
Figure 1.
Spatial distribution of (a) the Strong Wind Risk Index (SWI; unit: m s−1) and (b) the Heavy Rainfall Risk Index (HRI; unit: mm km−1) across 250 administrative districts (si/gun/gu) in South Korea. Both indices exhibit pronounced spatial heterogeneity driven by regional differences in typhoon exposure, terrain, land use, and vulnerability conditions. Maps include standardized color scales, administrative boundaries, a north arrow, and a 100 km scale bar to support cross-panel comparison and geographic interpretation.
SWI values are highest along the southern and southeastern coastal regions—including Jeju Island, the Gyeongsang coastal belt, and districts bordering the Korea Strait—where recurrent typhoon landfalls produce intense gust winds. These coastal areas also contain relatively older and more structurally fragile buildings, elevating SWI through the vulnerability-weighted formulation. Conversely, most central and northern inland districts display lower SWI values due to reduced exposure to typhoon-induced winds and comparatively modernized building stocks.
HRI displays a more spatially distributed pattern. High values occur not only along southern and southwestern coasts but also across major inland lowland basins such as the Nakdong River basin and the Jeolla plains. These inland hotspots reflect the combined influence of orographic enhancement, hydrological convergence zones, extensive imperviousness, and dense drainage networks—demonstrating that rainfall-related hazards are not limited to coastal districts. This pattern highlights the importance of accounting for local surface and hydrological conditions rather than relying solely on precipitation magnitude.
Table 2 summarizes the number of districts assigned to the four hazard levels (Attention, Caution, Warning, Danger) based on the percentile-based classification framework established in Section 2.5. Both SWI and HRI exhibit nearly identical distributions across categories, 63 districts each in Attention and Danger, and 62 in Caution and Warning, indicating substantial spatial variability in typhoon-related wind and rainfall hazards at the national scale.
Table 2.
Number of administrative districts classified into four hazard categories (Attention, Caution, Warning, Danger) for SWI and HRI based on percentile-based thresholds (P5, P15, P50, P85).
These patterns are consistent with typical typhoon tracks, which frequently make landfall along the southern coast before progressing northward, producing severe coastal wind hazards and widespread inland rainfall impacts. The results underscore the need for regionally adaptive preparedness strategies, particularly when comparing inland metropolitan areas such as Seoul with highly exposed coastal cities such as Busan (examined in Section 3.2).
3.2. District-Level Contrasts Within Seoul and Busan
Figure 2 illustrates the spatial distribution of the Strong Wind Risk Index (SWI; unit: m s−1) and Heavy Rainfall Risk Index (HRI; unit: mm km−1) across eup/myeon/dong sub-districts in Seoul and Busan, while Table 3 summarizes their descriptive statistics. Clear and systematic contrasts emerge between the two metropolitan regions, reflecting fundamentally different exposure environments, terrain characteristics, and structural or hydrological vulnerability profiles.
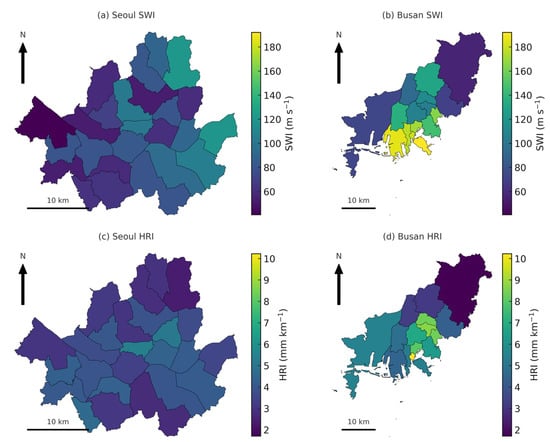
Figure 2.
Spatial distribution of the Strong Wind Risk Index (SWI; unit: m s−1) and Heavy Rainfall Risk Index (HRI; unit: mm km−1) across eup/myeon/dong sub-districts in Seoul and Busan. Panels (a,b) show SWI patterns, while panels (c,d) depict HRI patterns. Busan exhibits substantially higher hazard intensity and stronger intra-urban variability for both indices due to direct coastal exposure to landfalling typhoons, whereas Seoul demonstrates lower and more spatially homogeneous values consistent with its inland geographic setting. These contrasting spatial signatures emphasize the need for region-specific hazard assessment, preparedness planning, and localized impact-based early-warning strategies.
Table 3.
Summary statistics of the Strong Wind Risk Index and Heavy Rainfall Risk Index for sub-districts in Seoul and Busan. Busan shows significantly higher mean and maximum values, as well as greater variability (standard deviation), for both indices compared with Seoul, indicating stronger coastal exposure and pronounced intra-urban heterogeneity in typhoon-related wind and rainfall hazards.
For SWI (Figure 2a,b), Busan exhibits substantially higher values and steeper spatial gradients than Seoul. The maximum SWI in Busan (182.8 m s−1) is nearly three times greater than that of Seoul (108.7 m s−1), and Busan’s mean SWI (119.5 m s−1) is almost double that of Seoul (64.3 m s−1). Elevated SWI values are concentrated along the eastern and southern coastal districts of Busan, where landfalling and recurving typhoons frequently produce strong gusts. The presence of older building stocks in several Busan neighborhoods further amplifies SWI through the vulnerability-weighted index formulation. In contrast, Seoul, located inland and partially sheltered by surrounding topography, shows lower and more spatially homogeneous SWI patterns, reflecting reduced exposure to typhoon-induced winds and a larger proportion of comparatively modern structures.
For HRI (Figure 2c,d), Busan again demonstrates markedly higher intensity and substantially greater spatial variability than Seoul. The maximum HRI in Busan (157.9 mm km−1) is nearly four times that of Seoul (40.8 mm km−1), while Busan’s mean HRI (75.9 mm km−1) exceeds Seoul’s mean (12.1 mm km−1) by more than six-fold. Busan also shows much higher intra-urban variability, with a standard deviation (36.8) over ten times that of Seoul (3.5). This variability reflects Busan’s steep terrain, densely connected drainage networks, and highly impervious urban surfaces, all of which contribute to heightened hydrological susceptibility. In contrast, Seoul’s flatter topography, more uniform land-surface conditions, and lower imperviousness lead to reduced HRI values and more spatially consistent rainfall-related hazard levels.
Together, these findings highlight distinct metropolitan hazard profiles. Seoul experiences relatively modest and spatially uniform hazard conditions consistent with its inland geographic setting, whereas Busan faces substantially higher hazard intensity and localized hotspots for both wind- and rainfall-related risks. These contrasting patterns underscore the operational need for city-specific preparedness measures, differentiated early-warning criteria, and localized impact-based hazard management within Korea’s Typhoon Ready System (TRS).
3.3. District-Level Hazard Thresholds
Figure 3 presents the spatial distribution of the Caution-level (P15) thresholds for the Strong Wind Risk Index (SWI) and Heavy Rainfall Risk Index (HRI) across all si/gun/gu administrative districts in South Korea. Within the THIRA framework, the Caution tier marks the earliest stage of preparedness activation, and the P15 threshold represents the district-specific hazard intensity at which exceedance becomes sufficient to warrant heightened readiness. Because both SWI and HRI are composite indices that incorporate vulnerability and surface characteristics, the threshold values do not represent actual wind speeds or rainfall magnitudes; instead, they reflect risk-weighted hazard intensity calibrated to each district’s historical exposure environment.
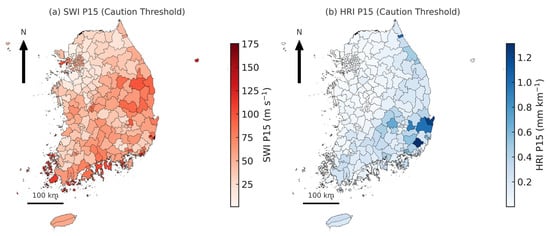
Figure 3.
Spatial distribution of the Caution-level (P15) thresholds for (a) the Strong Wind Risk Index (SWI; unit: m s−1) and (b) the Heavy Rainfall Risk Index (HRI; unit: mm km−1) across 250 administrative districts (si/gun/gu) in South Korea. Each district’s P15 threshold represents the minimum hazard intensity required to trigger a Caution alert under the THIRA framework. Higher thresholds along southern and southeastern coastal regions indicate stronger baseline exposure to typhoon-related winds and rainfall, whereas lower thresholds in inland regions reflect greater sensitivity to moderate-intensity events.
For SWI (Figure 3a), caution thresholds exhibit clear coastal–inland contrasts. The highest values appear along the southern and southeastern coastal regions, including Busan, Ulsan, eastern Gyeongsang Province, and Jeju Island, where recurving and landfalling typhoons frequently impose strong gust wind conditions. In these districts, P15 values commonly exceed 140 m s−1 (index units), more than double the thresholds of most northern inland districts. These elevated thresholds indicate that coastal jurisdictions require substantially greater hazard intensity to transition from routine monitoring to Caution status, reflecting both their climatological wind exposure and structural adaptation to wind loading through building design, construction type, and long-standing regional typhoon experience.
For HRI (Figure 3b), high P15 thresholds are not limited to coastal regions. Prominent threshold elevations also occur in major inland basins such as the Nakdong River valley, the Jeolla lowlands, and the Geum River system. These spatial patterns correspond with well-documented hydrometeorological amplification mechanisms in Korea, including orographic rainfall enhancement on windward slopes, hydrological convergence along dendritic river networks, and rapid surface runoff within flood-prone lowlands. Conversely, many northern inland districts show markedly lower P15 values, indicating that even moderate rainfall-related hazard intensity is sufficient to necessitate preparedness actions in these areas, partly due to limited drainage capacity and higher susceptibility despite lower precipitation climatology.
Table 4 and Table 5 provide district-level thresholds for Seoul and Busan and further illustrate the regional contrasts depicted in Figure 3. In Busan, the mean SWI Caution threshold (82.8 m s−1) is nearly twice that of Seoul (45.8 m s−1), and Busan’s maximum district value (189.0 m s−1) far exceeds the maximum in Seoul (106.6 m s−1). These differences confirm that baseline typhoon hazard environments differ fundamentally between coastal and inland metropolitan areas due to the combined influences of exposure, topography, drainage structure, and built-environment characteristics.
Table 4.
District-level thresholds of the Strong Wind Risk Index (SWI, unit: m s−1) in Seoul for the four THIRA hazard categories—Attention, Caution, Warning, and Danger. Thresholds represent percentile-based hazard levels derived from historical typhoon wind exposure and structural vulnerability at the gu administrative scale.
Table 5.
District-level thresholds of the Strong Wind Risk Index (SWI, unit: m s−1) in Busan for the four THIRA hazard categories—Attention, Caution, Warning, and Danger. Higher thresholds relative to Seoul reflect Busan’s greater climatological exposure to strong winds and coastal structural vulnerability.
By integrating percentile-based thresholds with the SWI and HRI distributions, this study establishes a locally adaptive hazard classification system fully aligned with THIRA principles. This approach enhances the operational relevance of early-warning criteria within the Typhoon Ready System (TRS) by reducing the likelihood of under-warning in high-exposure coastal areas and over-warning in more sensitive inland regions, ultimately improving warning credibility, preparedness efficiency, and hazard-mitigation decision-making.
3.4. Comparative Insights and Regional Implications
The comparative analysis of typhoon-related wind and rainfall hazards between Seoul and Busan reveals pronounced regional contrasts driven by differences in climatological exposure, topography, land-surface conditions, and vulnerability structures. These contrasts underscore the necessity of adopting regionally adaptive hazard thresholds rather than nationwide uniform criteria.
Busan consistently exhibits higher values and greater intra-urban variability for both the Strong Wind Risk Index (SWI) and the Heavy Rainfall Risk Index (HRI). This spatial signature aligns with Busan’s location along recurrent typhoon tracks, where landfalling and recurving storms generate strong gust fields and intense rainbands. Steep coastal topography and complex shoreline geometry further amplify hazard levels by enhancing terrain-induced convergence, orographic rainfall enhancement, and localized wind channeling. Consequently, district-level thresholds in Busan show wide ranges, particularly across eastern and southern districts, indicating substantial heterogeneity in baseline exposure and structural vulnerability.
In contrast, Seoul displays lower and more spatially homogeneous SWI and HRI values. As an inland metropolitan region partially sheltered by surrounding mountain ranges, Seoul experiences weaker meteorological forcing from typhoons. Accordingly, spatial variation in hazard intensity is more strongly influenced by socio-environmental and built-environment characteristics such as building-age distribution, land-cover patterns, drainage capacity, and urban density than by storm intensity alone. These conditions imply that even moderate hazard levels may produce relatively larger impacts in specific districts, particularly those with older building stocks or limited hydrological resilience.
The threshold comparison between the two cities further highlights the limitations of uniform national hazard standards. Caution-level SWI thresholds in Busan are nearly twice those of Seoul, and HRI thresholds show similarly amplified contrasts. Applying identical warning triggers across both cities would therefore distort true exceedance probabilities—leading to under-warning in high-exposure coastal districts and over-warning in inland areas where vulnerability-sensitive impacts can emerge at lower hazard levels. District-calibrated thresholds derived from local distributions provide a more scientifically defensible basis for equitable and operationally meaningful early warnings.
Collectively, these results demonstrate that administrative-district-level differences arise not only from storm climatology but also from structural fragility, hydrological susceptibility, and land-use configurations. Incorporating these locally differentiated hazard characteristics into Korea’s Typhoon Ready System (TRS) strengthens early-warning activation, improves spatial targeting of preparedness measures, and enhances resource prioritization. This district-specific approach supports climate-resilient governance by enabling metropolitan areas, both coastal and inland, to anticipate risk more accurately and respond more effectively to extreme typhoon events.
4. Discussion
This study quantified district-level spatial heterogeneity in typhoon-related hazards across South Korea using two integrated indices—the Strong Wind Risk Index (SWI) and the Heavy Rainfall Risk Index (HRI). The national-scale findings demonstrate persistent climatological contrasts between coastal and inland regions. Busan, situated along recurving and landfalling typhoon tracks, consistently recorded higher SWI and HRI values and exhibited stronger intra-urban gradients. These elevated hazard levels reflect the combined influence of frequent storm exposure, steep coastal terrain, and wind–rainband intensification near the shoreline. In contrast, Seoul displayed lower and more spatially uniform values for both indices, indicating that its inland setting reduces meteorological forcing and that vulnerability-driven factors such as building age, drainage capacity, and land-cover patterns play a comparatively greater role in shaping district-level risk.
These spatial contrasts mirror findings from other typhoon- and hurricane-prone regions, where coastal cities maintain higher operational thresholds due to stronger baseline wind and rainfall intensities. Applying uniform nationwide thresholds has been shown to produce biased warning outcomes: coastal districts may be under-warned despite high exposure, while inland districts may experience over-warning, diminishing public trust and reducing early-warning effectiveness. The results of this study reinforce the necessity of regionally adaptive hazard criteria within the Korean operational context.
Integrating percentile-based thresholds from the Threat and Hazard Identification and Risk Assessment (THIRA) framework into SWI and HRI offers a practical pathway toward adaptive early warning. Percentile-derived Attention, Caution, Warning, and Danger levels reflect localized exceedance probabilities grounded in each district’s empirical hazard climatology. This calibration enhances the credibility of impact-based forecasting and helps guide targeted preparedness measures such as structural retrofitting in districts with a high proportion of pre-1990 buildings (elevated SWI) or drainage enhancement in districts marked by dense river networks and impervious surfaces (elevated HRI).
It is important to clarify that SWI and HRI are risk indices, not direct physical observations of wind speed or rainfall depth. Although SWI retains the physical unit of gust wind speed (m s−1), the inclusion of structural vulnerability makes the index unsuitable for direct comparison with operational hurricane intensity scales such as the Saffir–Simpson categories. SWI reflects potential structural stress amplified by vulnerability, not meteorological wind speed alone; therefore, extremely high values in some districts represent index-driven hazard amplification rather than unrealistically high wind speeds. This distinction is essential for accurate interpretation and avoids miscommunication to stakeholders and the public.
While the framework demonstrates strong operational potential, several limitations should be acknowledged. The vulnerability indicators building age, permeability, and river-network density are practical and nationally available but do not fully capture the complexity of district-level exposure. Additional factors such as construction materials, building codes, maintenance quality, microtopographic drainage pathways, and population mobility may further influence hazard amplification. Moreover, the rainfall component of HRI is derived from PMP-based estimates, which reflect upper-bound hydrometeorological scenarios rather than observed rainfall extremes. Future work integrating real-time observations, remote sensing products, coupled atmosphere–hydrology modeling, and machine-learning-based hazard estimation could enhance operational performance.
To aid interpretation for non-specialist readers, it is important to clarify that the SWI values presented in this study do not represent raw instantaneous wind speeds, but a vulnerability-weighted hazard index. Therefore, direct comparison with the Saffir–Simpson hurricane wind scale (Categories 1–5; 119–251+ km h−1) may lead to misunderstanding. For contextual reference, Category 1 represents 119–153 km h−1 (minimal damage), Category 3 corresponds to 178–208 km h−1 (devastating damage), and Category 5 exceeds 252 km h−1 (catastrophic destruction). While some high-index districts exhibit SWI values numerically comparable to these categories, these values reflect amplified vulnerability due to older building stocks rather than meteorological wind speed itself. This clarification is added to prevent misinterpretation of SWI as a direct measurement of typhoon gust intensity.
Despite these limitations, the proposed framework provides a scientifically robust foundation for regionally calibrated early warning within the Typhoon Ready System (TRS). By quantifying district-specific hazard distributions, identifying spatial hotspots, and deriving adaptive thresholds, this study supports more precise warning activation, prioritization of preparedness investments, and evidence-based disaster governance. The results advance the development of climate-resilient coastal and inland metropolitan systems and offer a scalable model for other typhoon-exposed countries seeking to implement impact-based forecasting.
5. Conclusions
This study developed a district-level typhoon hazard assessment framework for South Korea by integrating high-resolution meteorological observations, structural and environmental vulnerability indicators, and percentile-based thresholds derived from the Threat and Hazard Identification and Risk Assessment (THIRA) methodology. By quantifying strong wind (SWI) and heavy rainfall (HRI) hazards across 250 administrative districts and examining fine-scale contrasts in Seoul and Busan, the analysis revealed pronounced spatial heterogeneity in typhoon-related risk. Busan, located directly along recurrent typhoon pathways, exhibited substantially higher hazard intensity and greater intra-urban variability than inland Seoul, demonstrating the limitations of applying uniform national thresholds to regions with fundamentally different exposure and vulnerability characteristics.
The proposed framework provides a scientifically rigorous and operationally scalable basis for impact-based early warning. By linking meteorological hazard intensity with localized structural and hydrological susceptibility and adopting district-specific percentile thresholds, the methodology improves the precision of hazard interpretation, enhances the relevance of warning activation levels, and supports targeted preparedness planning. These improvements directly strengthen the operational foundation of Korea’s Typhoon Ready System (TRS), which requires fine-scale, regionally calibrated hazard criteria to support timely and credible early-warning decisions.
Several avenues for future research can further advance this framework. The integration of additional hazard components—such as storm surge, compound coastal–river flooding, landslides, and cascading infrastructure failures—would provide a more comprehensive representation of multi-hazard typhoon impacts. Incorporating higher-resolution dynamic exposure datasets, real-time hydrometeorological assimilation, and coupled atmosphere–hydrology models would also enhance forecast sensitivity and expand applicability for operational decision support. Advancing these components will contribute to the development of climate-resilient coastal and inland metropolitan systems and strengthen localized disaster risk governance across South Korea.
Author Contributions
Conceptualization, H.N. and W.-S.J.; Methodology, H.N. and W.-S.J. Writing—original draft, H.N.; Writing—review and editing, W.-S.J. All authors have read and agreed to the published version of the manuscript.
Funding
This work was supported by a National Research Foundation of Korea (NRF) grant funded by the Korean government (MSIT) (No. RS-2023-00212688).
Institutional Review Board Statement
Not applicable.
Informed Consent Statement
Not applicable.
Data Availability Statement
Data is contained within the article.
Conflicts of Interest
The authors declare no conflicts of interest.
References
- Peduzzi, P.; Chatenoux, B.; Dao, H.; De Bono, A.; Herold, C.; Kossin, J.; Mouton, F.; Nordbeck, O. Global Trends in Tropical Cyclone Risk. Nat. Clim. Change 2012, 2, 289–294. [Google Scholar] [CrossRef]
- Park, D.-S.R.; Ho, C.-H.; Kim, J.-H. Growing Threat of Intense Tropical Cyclones to East Asia over the Period 1977–2010. Environ. Res. Lett. 2014, 9, 014008. [Google Scholar] [CrossRef]
- Moon, I.-J.; Kim, S.-H.; Chan, J.C.L. Climate Change and Tropical Cyclone Trend. Nature 2019, 570, E3–E5. [Google Scholar] [CrossRef]
- Chang, M.; Ho, C.-H.; Ho, J.; Cha, E.-J. Centennial analysis in tropical cyclone-induced precipitation in Korea. Weather Clim. Extrem. 2023, 39, 100534. [Google Scholar] [CrossRef]
- Basconcillo, J.; Moon, I.-J. Increasing peak intensity of tropical cyclones passing through the Korean Peninsula. Sci. Rep. 2023, 13, 1303. [Google Scholar] [CrossRef] [PubMed]
- Son, C.-Y.; Kim, J.-S.; Moon, Y.-I.; Lee, J.-H. Characteristics of tropical cyclone–induced precipitation over Korean river basins according to evolution patterns of the Central-Pacific El Niño. Stoch. Environ. Res. Risk Assess. 2014, 28, 869–884. [Google Scholar] [CrossRef]
- Choi, H.-I. Spatial assessment of damage vulnerability to storms in Korea using damage index. Sustainability 2019, 11, 6051. [Google Scholar] [CrossRef]
- Kim, J.M.; Kim, T.; Kim, G.; Son, J.; Kim, J. Identifying risk indicators of building damage due to typhoons: Focusing on Cases of South Korea. Sustainability 2018, 10, 3947. [Google Scholar] [CrossRef]
- Ryu, J.-E.; Nam, W.; Lee, D. Assessment of the vulnerability of industrial parks to flood damage in South Korea. Nat. Hazards 2016, 81, 151–172. [Google Scholar] [CrossRef]
- Jee, H.-W.; Seo, S.B.; Ko, K.; Cho, J.; Chae, Y. Macroscale impact assessment of flood damage reduction from climate change adaptation policies. J. Flood Risk Manag. 2024, 17, e12969. [Google Scholar] [CrossRef]
- Lee, S.; Choi, Y.; Ji, J.; Lee, E.; Yi, S.; Yi, J. Flood Vulnerability Assessment of an Urban Area: A Case Study in Seoul, South Korea. Water 2023, 15, 1979. [Google Scholar] [CrossRef]
- Adelodun, B.; Odey, G.; Lee, S.; Choi, K.S. Investigating the causal relationship between flood damage cost, flooded area, and extreme precipitation indices: A case study of the Chungcheong region in South Korea. Sustain. Cities Soc. 2023, 90, 104298. [Google Scholar] [CrossRef]
- Lee, M.; Jeong, C.; Lee, J. Estimating damage costs from natural disasters in Korea. Nat. Hazards Rev. 2017, 18, 04017007. [Google Scholar] [CrossRef]
- Na, H.; Jung, W.-S. Paradigm shift in typhoon forecasting for the Korean Peninsula: A case study on the applicability of the Typhoon-Ready System. Atmosphere 2025, 16, 77. [Google Scholar] [CrossRef]
- Na, H.N.; Jung, W.S. Construction of typhoon impact-based forecast in Korea—Current status and composition. J. Environ. Sci. Int. 2023, 32, 543–553. [Google Scholar] [CrossRef]
- Na, H.; Jung, W.-S. A Study on the Pre-Survey and Plan for the Establishment of the Korean Typhoon Impact-Based Forecast. Atmosphere 2024, 15, 1236. [Google Scholar] [CrossRef]
- Lee, K.; Kang, D.H.; Jung, H.C.; Park, G.; Gye, C.; Kumar, S.; Kim, E.J.; Peters-Lidard, C.D.; Hwang, E. Toward a ground-based and long-term meteorological forcing dataset for hydrological applications in South Korea. Theor. Appl. Climatol. 2022, 152, 1423–1442. [Google Scholar] [CrossRef]
- Park, M.-S. Quality Management System for an IoT Meteorological Sensor Network—Application to Smart Seoul Data of Things (S-DoT). Sensors 2023, 23, 2554. [Google Scholar] [CrossRef]
- Kim, B.Y.; Cha, J.W.; Chang, K.-H.; Lee, C. Estimation of the Visibility in Seoul, South Korea, Based on Particulate Matter and Weather Data, Using Machine-learning Algorithm. Aerosol Air Qual. Res. 2023, 22, 220125. [Google Scholar] [CrossRef]
- Seo, G.Y.; Min, S.-K.; Lee, D.; Son, S.-W.; Park, C.; Cha, D.-H. Hourly extreme rainfall projections over South Korea using convection-permitting climate simulations. npj Clim. Atmos. Sci. 2025, 8, 30. [Google Scholar] [CrossRef]
- Federal Emergency Management Agency (FEMA). Threat and Hazard Identification and Risk Assessment (THIRA) Guide, 3rd ed.; U.S. Department of Homeland Security: Washington, DC, USA, 2018. [Google Scholar]
- United Nations Office for Disaster Risk Reduction (UNDRR). Sendai Framework for Disaster Risk Reduction 2015–2030; United Nations: Geneva, Switzerland, 2015. [Google Scholar]
- UNDRR. What Is the Sendai Framework for Disaster Risk Reduction? United Nations Office for Disaster Risk Reduction: Geneva, Switzerland.
- Wang, Y.; Yin, Y.; Song, L. Risk assessment of typhoon disaster chains in the Guangdong–Hong Kong–Macau Greater Bay Area, China. Front. Earth Sci. 2022, 10, 839733. [Google Scholar] [CrossRef]
- Statistics Korea. Population and Housing Census Microdata; KOSTAT: Daejeon, Republic of Korea, 2023. [Google Scholar]
- National Spatial Data Infrastructure Portal (NSDI). Administrative Boundaries and Land-Cover Spatial Datasets; Ministry of Land, Infrastructure and Transport & Ministry of the Interior and Safety: Sejong, Republic of Korea.
Disclaimer/Publisher’s Note: The statements, opinions and data contained in all publications are solely those of the individual author(s) and contributor(s) and not of MDPI and/or the editor(s). MDPI and/or the editor(s) disclaim responsibility for any injury to people or property resulting from any ideas, methods, instructions or products referred to in the content. |
© 2025 by the authors. Licensee MDPI, Basel, Switzerland. This article is an open access article distributed under the terms and conditions of the Creative Commons Attribution (CC BY) license (https://creativecommons.org/licenses/by/4.0/).