Abstract
Heatwaves are intensifying across Mediterranean cities, where the Urban Heat Island (UHI) effect amplifies thermal stress. This study updates the spatial characterization of the Surface Urban Heat Island (SUHI) in Tarragona using multi-sensor remote sensing data within a Local Climate Zone (LCZ) framework. Land surface temperature, albedo, and the Normalized Difference Vegetation Index (NDVI) were analyzed during heatwaves from 2015–2025 to assess spatial patterns and drivers of urban heating. Results reveal a daytime urban cool island associated with low albedo and scarce vegetation, and a nocturnal SUHI caused by heat retention in dense built-up areas. High-resolution mapping identifies industrial and commercial zones as hotspots, while vegetated and water-covered areas act as cooling sites. These findings clarify the spatial dynamics and key biophysical controls of SUHI and provide an actionable basis for prioritizing locally tailored adaptation strategies in Mediterranean coastal cities.
1. Introduction
Heatwaves are prolonged periods of abnormally high temperature relative to local climate norms. The World Meteorological Organization defines them as sequences of unusually hot days and nights. Under climate change, they have become more frequent, longer, and more intense, even as baseline temperatures rise. The IPCC reports with high confidence that further warming will intensify heatwaves. Recent summers confirm this: 2022 was Europe’s hottest on record, with Spain enduring 42 heatwave days, nearly half the summer [1]. July 2025 averaged 23.8 °C in mainland Spain, +0.7 °C above 1991–2020 norms, ranking as the 12th warmest July since 1961 [2]. Heatwaves already rank among the deadliest natural hazards, responsible for tens of thousands of deaths [3], with high nighttime temperatures particularly dangerous due to cumulative stress [4] and links to cardiovascular [5,6], respiratory [7] and excess mortality.
Urban areas experience significantly higher temperatures than their rural surroundings due to the Urban Heat Island (UHI) effect, particularly during calm nights [8,9]. During heatwaves, this effect exacerbates thermal stress and increases health risks [10]. When derived from satellite-based land surface temperature (LST), this phenomenon is referred to as the Surface Urban Heat Island (SUHI), and its magnitude is expressed as SUHI intensity [11,12]. Urbanization contributes to this warming by replacing vegetation with impervious materials that store heat and suppress evapotranspiration, while urban geometry traps longwave radiation, elevating both daytime and nocturnal temperatures.
The thermal behavior of urban materials and structures plays a key role in shaping SUHI intensity. Hard surfaces such as asphalt and concrete possess high heat capacity, increasing surface temperatures. Building orientation also influences microclimatic conditions: east- and west-facing facades of north–south-oriented buildings receive intense solar radiation throughout the day, intensifying localized heating. These factors emphasize the importance of material choice and building layout in urban planning and design [13]. Similarly, dense urban fabrics, high building compactness, and intense anthropogenic activity obstruct air flow and generate additional heat, producing significant thermal discomfort, as observed in Akure, Nigeria. Areas with fewer green spaces experience reduced thermal comfort and higher risks of heat-related illness [14].
Beyond surface composition, the structural complexity of the urban environment exerts strong control over thermal behavior. At the city scale, it determines how large-scale wind flows associated with weather systems interact with the urban surface to create turbulence, influence the depth of the urban boundary layer, and produce downwind effects. Structural complexity also regulates overall urban albedo: the more intricate the morphology, the greater the probability that reflected shortwave radiation is intercepted and reabsorbed before escaping to the atmosphere. At the intra-urban scale, geometry affects local radiative exchange through the sky view factor—the openness of spaces to the sky. Deep, narrow streets, or urban canyons, trap heat by repeatedly reflecting and emitting radiation within confined areas [15]. Compact cities, although efficient in terms of transport and land use, often experience reduced ventilation, limited solar access, and intensified UHI effects due to low vegetation cover and restricted airflow [16]. Also, intermediate urban densities generally provide the most balanced outcomes—combining energy efficiency in buildings with improved outdoor comfort and public health [17]. Thus, urban form mediates the interaction between atmospheric processes, surface materials, and human activity, ultimately shaping the intensity and persistence of SUHI.
In contrast, soil type and vegetation strongly modulate surface cooling. Fine-textured, organic-rich soils retain moisture and enhance evaporative cooling, while sandy soils heat more rapidly [18]. A study demonstrated that depleted soil moisture, combined with an intense subtropical ridge, amplified the 2023 western Mediterranean heatwave, and that wetter soils would have markedly reduced surface temperatures [19]. Moist soils and vegetated surfaces dissipate heat through evapotranspiration, channeling energy into latent rather than sensible heat flux [20]. However, vegetation type critically determines this effect: grasslands may initially cool the surface but can intensify heating once soil moisture is depleted, whereas forests, through conservative water use, maintain cooling during prolonged heat events [21]. Under dry soils and persistent anticyclonic conditions, evapotranspiration is suppressed, creating a self-reinforcing feedback loop that prolongs heatwave intensity [15].
Vegetation is one of the most effective tools for urban climate regulation. Moreover, vegetation modifies local microclimates by controlling radiation exchange, airflow, humidity, temperature, and pollutant dispersion. Trees lower air temperature both directly—through shading and evapotranspiration—and indirectly by modifying air humidity as it passes through the canopy. The cooling efficiency depends on air moisture deficit and wind speed: lower wind enhances localized cooling, while higher wind expands its spatial influence [16]. The effectiveness of vegetation, however, varies across urban topographies. In valleys, where soils are deeper and more humid, dense tree cover provides sustained cooling, whereas on plateaus or ridges—where soils are shallow, rocky, and exposed to stronger winds—the cooling effect is weaker and more localized. These variations arise from the interaction between terrain, water availability, and urban form, suggesting that tree species and planting design should be adapted to local topographic and microclimatic conditions.
Vegetation also operates across multiple spatial scales. At the microscale, individual trees provide localized shading, while at the mesoscale, parks and vegetated corridors create extended cooling through temperature gradients and “park-breeze” effects, which can extend several hundred meters under calm, hot conditions [22]. The three-dimensional structure of vegetation—crown size, canopy density, and roughness—determines its capacity to intercept radiation, enhance convective and evaporative cooling, and promote turbulence, especially in humid climates where evaporation alone may be insufficient.
Nature-based solutions, particularly urban green infrastructure (UGI), mitigate UHI through shading and evapotranspiration, reducing LST and associated health risks [23,24]. The cooling effect extends beyond green patches but weakens with distance [25,26]. Numerous studies show a consistent negative correlation between the Normalized Difference Vegetation Index (NDVI) and LST [22,23,24], reinforcing vegetation’s role in thermal regulation. Nonetheless, the magnitude of this cooling depends on patch size, shape, and connectivity [27,28], vegetation type [29,30], and local context [31,32]. Peri-urban areas also contribute to regulating city heat: in Agrinio (Greece), urban centers were approximately 6 °C warmer than rural surroundings at night but cooler during 35% of daytime hours due to rural soil desiccation [33]. In Nicosia (Cyprus), rural vegetation enhanced temperature contrasts by ~1 °C [34]. Preserving peri-urban green belts thus enhances ventilation and reduces metropolitan heat burdens [35,36].
Nonetheless, the magnitude of urban cooling varies widely and depends on multiple interacting factors, including patch size, shape, connectivity [27,28], vegetation type [30,37], and local bioclimatic context [31,32]. Recent research highlights that the thermal performance of urban greenspaces exhibits pronounced scale dependence. A study identified a clear scaling effect linking greenspace configuration to its cooling efficiency, emphasizing that analyses restricted to individual parks or isolated case studies overlook the spatial continuity of thermal processes [37]. By examining multiple spatial scales, they found that larger and better-connected greenspaces not only experience greater internal cooling but also extend their influence into adjacent urban areas, especially when configured in mainland–island spatial patterns where smaller patches benefit from proximity to larger vegetated cores. These findings suggest that coordinated networks of greenspaces, rather than fragmented or isolated patches, maximize overall urban cooling potential.
The shape complexity and boundary conditions of greenspaces also affect their efficiency. Urban encroachment increases land surface temperatures along the perimeters of green areas, while the adjacency of water bodies can amplify the cooling footprint through synergistic evapotranspiration and enhanced air mixing [37]. Hence, spatial planning that minimizes edge heat exchange and maintains landscape coherence is critical for sustaining cooling functions.
Beyond spatial configuration, multi-functional urban green infrastructure (UGI) plays a pivotal role in mitigating heat but also yields co-benefits across ecological, hydrological, and social dimensions. Green roofs, green facades, and other unconventional vegetated surfaces can substantially contribute to urban temperature regulation, carbon sequestration, pollutant absorption, and runoff management [38]. However, they stress that the magnitude and reproducibility of these benefits depend strongly on local climatic and morphological contexts. Moreover, the thermal and social effectiveness of UGI varies across scales and among social groups, calling for integrated approaches that balance physical cooling outcomes with social equity and long-term resilience.
Temporal and qualitative aspects of vegetation further determine the effectiveness of temperature mitigation. Landscape quality—including vegetation type, evapotranspiration rate, and soil albedo—is as important as landscape quantity in determining cooling capacity [32]. They demonstrate that simply expanding green coverage does not guarantee equivalent thermal benefits; the cooling service evolves as vegetation matures and stabilizes its physiological functioning. Thus, the timescale of ecosystem development and maintenance must be considered when evaluating long-term cooling outcomes. Overestimating benefits by focusing solely on green area metrics risks underrepresenting the importance of biophysical quality and hydrological conditions in sustaining cooling effects.
Finally, regional background climate exerts a controlling influence on the intensity and efficiency of surface cooling. A study [31] demonstrated that the local convection efficiency—the ability of urban and rural areas to dissipate heat into the lower atmosphere—explains much of the variability in UHI and SUHI magnitudes across North America. In humid climates, reduced convection efficiency in urban areas leads to stronger daytime temperature differentials (ΔT ≈ 3 K higher than in dry climates), while in arid environments, higher urban roughness can enhance convective cooling, occasionally producing “urban heat sink” effects. This indicates that the same urban design may yield contrasting thermal outcomes under different climatic regimes. Furthermore, variations in precipitation modulate this relationship over time, with drier years intensifying the UHI due to suppressed evaporative and convective fluxes.
Together, these findings demonstrate that the magnitude of urban cooling is not solely a function of vegetation presence but emerges from a dynamic interplay between spatial configuration, vegetation quality and maturity, atmospheric convection, and background climate. Effective urban heat mitigation, therefore, requires an integrated multi-scale perspective that accounts for both the spatial heterogeneity and climatic context of cities, ensuring that green infrastructure strategies are adapted to local environmental and morphological conditions.
Remote sensing enables systematic monitoring of SUHI and its drivers. Landsat provides ~30–100 m thermal infrared, MODIS offers higher temporal frequency, and Sentinel adds complementary resolution and revisit [39]. Albedo and NDVI complement LST, linking reflectivity and vegetation vigor to thermal patterns [40,41]. Field data confirm large contrasts: asphalt can exceed grass by ~12 °C in surface temperature and ~7 °C in near-surface air [42]. Urban morphology further modulates exposure: compact forms retain heat, while intermediate densities improve comfort [17]. To interpret these patterns, the Local Climate Zone (LCZ) system standardizes classification of urban and natural zones [43].
The LCZ classification system provides a standardized, objective framework for categorizing the urban and natural landscape based on underlying physical properties, facilitating meaningful comparisons of the SUHI effect across global contexts [16,43]. The comprehensive system comprises 17 standard classes defined by parameters such as building height, density, and surface permeability. These classes are divided into 10 Built Types—including LCZ 1 (Compact High-Rise) through LCZ 9 (Sparsely Built), and LCZ 10 (Heavy Industry)—and 7 Natural Types which range from LCZ A (Dense Trees) to LCZ G (Water), encompassing categories like Scattered Trees (B), Bush/Scrub (C), Low Plants (D), Bare Rock or Paved (E), and Bare Soil or Sand (F). This detailed typology allows for the assessment of urban planning decisions on local climate, moving “beyond the simple distinction between urban and rural area” [30]. While its strength lies in its objectivity and global applicability for climate-sensitive design, its limitations are evident in the challenge of accurate large-scale mapping due to dependency on reliable urban data and the time-consuming manual identification of training areas [44]. Furthermore, the scheme’s static and multi-level nature prevents it from capturing fine temporal dynamics within highly heterogeneous urban environments [45].
This standardized approach is critical because research consistently shows that not all neighborhoods heat equally, with variations of several degrees directly attributable to building density, surface materials, and greenery. LCZ-based studies show compact built types consistently hotter than vegetated zones [46,47,48], and LCZ mapping also links heat exposure to social impacts: in Barcelona, densely built LCZs correlated with extreme hot days and ~80% higher heat-related mortality risk [49]. Therefore, a key adaptation priority is identifying intra-urban “hotspots.” Not all neighborhoods heat equally, with variations of several degrees due to building density, surface materials, and greenery. Mapping these variations guides targeted interventions in areas where residents face the highest heat stress. Identifying hot zones enables urban authorities to implement targeted cooling strategies in areas where they are most needed.
Tarragona, a medium-sized coastal city in Catalonia, Spain, is the focus of this study (Figure 1). The city experiences a hot-summer Mediterranean climate (Köppen Csa), with mild, wet winters and long, hot summers. Data from the nearby Vila-seca station (~14 km southwest) indicate average summer maximums of 29–30 °C and nighttime lows of 22–23 °C. The Mediterranean Sea moderates local conditions, with sea breezes raising humidity and reducing temperature extremes, significantly shaping daily air temperature and precipitation [50]. For long-term climate characterization, the CADTEP dataset provides quality-controlled daily records from 1950–2021, including stations around Tarragona [51].
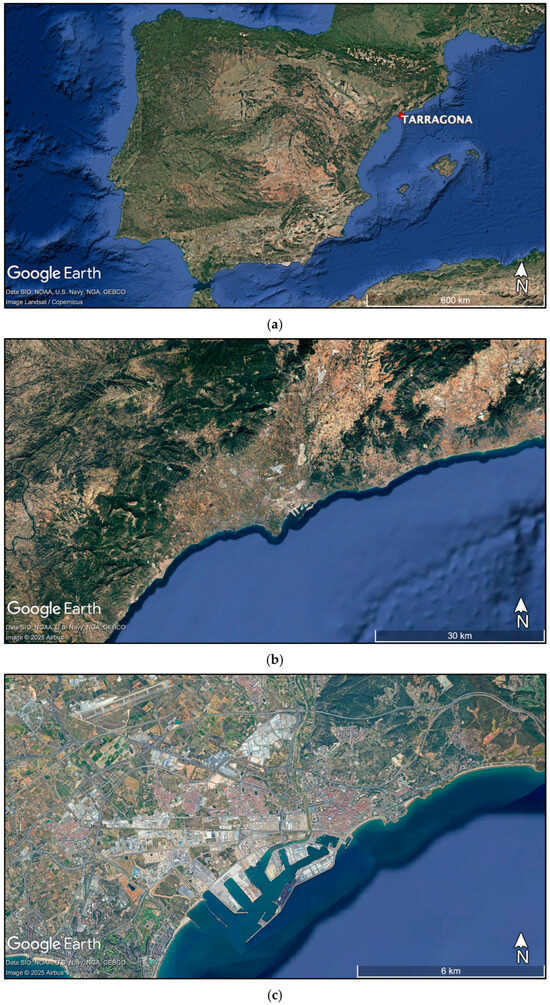
Figure 1.
Geographical location of Tarragona at different scales: (a) the city’s position on the Iberian Peninsula, (b) the regional setting along the Catalan Mediterranean coast, and (c) a detailed view of the urban core and port area of Tarragona. Location of the study area obtained from Google Earth Pro (desktop application, accessed on 6 November 2025).
This work addresses a key research gap by analyzing the Surface Urban Heat Island (SUHI) in Tarragona during heatwave events. The objective is to examine the spatial distribution of land surface temperature (LST) and its relationship with Local Climate Zones (LCZ), as well as other surface characteristics such as albedo and NDVI. Although UHI was documented decades ago [52], no comprehensive reassessment has been made despite major urban growth, land-cover changes, and increasing heatwave intensity reported by AEMET and SMC. Regional projections further indicate continued rises in mean summer temperatures and more frequent extreme heat days, with the Mediterranean Basin warming about 20% faster than the global average. This study combines Landsat- and Sentinel-derived LST with LCZ classification to identify urban heat hotspots, providing an updated evidence base for adaptation strategies such as tree canopy expansion, reflective materials, and preservation of coastal ventilation corridors.
Historical climatological research has documented the presence of a well-defined nocturnal UHI in Tarragona. A study [44] conducted a comparative analysis of 25 years of temperature records (1960–1984) between an urban observatory in the city and a rural station at Reus Airport. The study found minimal or inverted urban–rural temperature differences during daytime, largely due to the cooling influence of sea breezes and urban shading, but markedly higher nocturnal temperatures in the urban core—up to 5 °C warmer in winter and autumn under stable atmospheric conditions. These patterns were attributed to heat retention by dense urban structures and additional heat release from the petrochemical industry surrounding the city, and they are consistent with broader Mediterranean evidence showing weak or negative daytime SUHI but pronounced nocturnal warming in cities such as Barcelona, Andalusian capitals, and Salamanca [53,54,55].
More recent assessments, such as the Atles Climàtic de Catalunya 1991–2020 [56], confirm that Tarragona has experienced a greater mean temperature increase than the Catalan average, with the UHI effect contributing to this warming. In Mediterranean coastal cities, persistent nocturnal heat has been shown to heighten health vulnerability during heatwaves, as limited nighttime cooling hampers physiological recovery and adaptation [57]. Over the last decades, climate records from both the Servei Meteorològic de Catalunya (Meteocat) and the State Meteorological Agency (AEMET) reveal a clear upward trend in extreme heat events across Catalonia, including Tarragona. Meteocat’s Butlletí Anual d’Indicadors Climàtics documents a marked intensification in the intensity, duration, and frequency of heatwaves, as well as increases in hot extremes such as tropical nights and daytime maxima, while cold extremes have diminished [58]. AEMET similarly reports that Spain has warmed by approximately 1.5 °C since 1961, with heatwaves lengthening by about three days per decade, extending over larger areas, and becoming more intense temperatures rising around 2.7 °C per decade during such episodes [59]. These regional and national observations converge with paleoclimatic evidence showing that the summer of 2022 was exceptional: record-breaking heat across much of Spain, the hottest summer in at least 700 years, and the driest in northeastern Spain in nearly three centuries [60]. Such findings underscore the growing vulnerability to heatwaves and the urgent need for enhanced resilience and adaptation strategies to mitigate their health and societal impacts.
2. Materials and Methods
The methodological framework for this study builds upon the workflow proposed by a previous work [61] which integrates data from three satellite platforms to characterize the spatial distribution of land surface temperature (LST) and examine its relationship with urban characteristics. This approach combines the strengths of different sensors in terms of spatial, temporal, and spectral resolution, enabling a comprehensive assessment of thermal patterns during extreme heat events. By leveraging multi-source remote sensing datasets, the method captures both the fine-scale heterogeneity of urban environments and the broader regional thermal context.
In the present work, this integrated framework is applied to the city of Tarragona, focusing on the identification and characterization of urban heat islands during documented heatwave periods. The workflow incorporates MODIS products for consistent temporal monitoring, Landsat imagery for medium-resolution LST estimation, and Sentinel-2 data for high-resolution mapping of urban form, vegetation cover, and surface albedo. The combination of these datasets allows for a multi-scalar analysis, linking LST variability to Local Climate Zone classifications and specific urban surface properties. This synergy between datasets facilitates a robust evaluation of the thermal behavior of different land-use types, supporting evidence-based strategies for urban heat mitigation.
2.1. Determination of Heatwave Periods in Tarragona
Heatwave periods for the Tarragona region were identified from the AEMET, primarily from its heatwave statistics for 1975–2022 expressed at the province level and from the climate monitoring summaries [62] and others [2,63,64,65]. The identification followed AEMET’s operational criteria for heatwave declaration, which considers daily maximum temperatures significantly exceeding the climatological threshold for at least three consecutive days. Table 1 presents all the heatwave events identified based on the information made available by AEMET on its official website [62,66,67]. Shows heatwaves events between 2015 and 2025, including their duration, mean temperature anomaly, notable thermal intensity, and whether Tarragona was affected.

Table 1.
Major heatwave events affecting Tarragona and the Iberian Peninsula (2015–2025).
2.2. Determination of the Surface Urban Heat Island (SUHI) in Tarragona
Land surface temperature (LST) analysis during identified heatwave periods was performed using Google Earth Engine (GEE) and the Moderate Resolution Imaging Spectroradiometer (MODIS) daily L3 global products MOD21A1D (daytime) and MOD21A1N (nighttime). Each product has a 1 km spatial resolution and daily temporal coverage, suitable for regional-scale thermal characterization. Data were processed using the physics-based split-window algorithm, which corrects for atmospheric water vapor and surface emissivity effects [68].
For each heatwave period, image collections were filtered by date and the region of interest, corresponding to four land-use categories: urban, industrial, rural, and natural. Filtered scenes were mosaicked, clipped to land-use geometries, and compiled into multi-band datasets, enabling inter-period and inter-category comparisons. Daytime and nighttime LST differences among land cover types were assessed using the Kruskal–Wallis rank-sum test, due to non-normality and heteroscedasticity in the data. Post-hoc multiple comparisons were performed with Dunn’s test [69], applying Bonferroni correction to control type I error.
To identify intra-urban thermal contrasts, we first derived an LST map for all heatwave events analyzed. From this dataset, pixels above the 90th percentile and below the 10th percentile were selected, representing the hottest and coolest locations, respectively. These thresholds were calculated considering the full set of heatwave periods included in the study. For the sites thus identified, we subsequently extracted and examined albedo and NDVI values. The distributions of these variables are presented in Section 3.
2.3. Local Climate Zone (LCZ) Mapping
Pilot zones representing each LCZ category (Figure 2) were visually identified for Tarragona following the World Urban Database and Access Portal Tools protocol [70] using the LCZ Generator developed by [30]. These zones were used as training areas to classify the entire study region. Given social, economic, and structural variability, LCZ definitions may vary slightly compared to other cities. Not all LCZ classes were present in Tarragona.
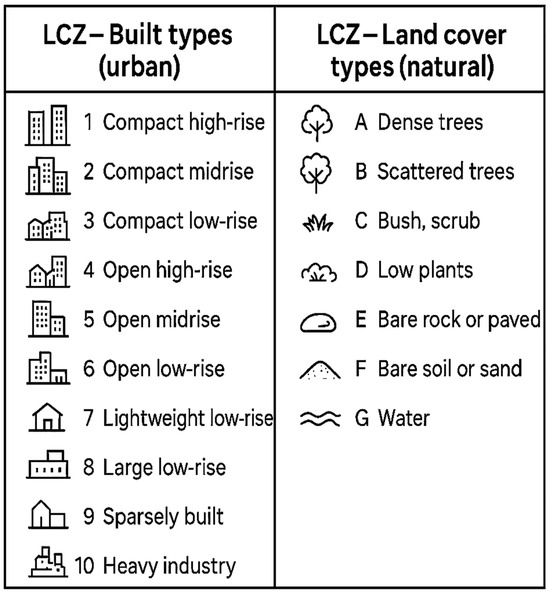
Figure 2.
Local Climate Zone (LCZ) classification. The figure was generated using an artificial intelligence image tool (ChatGPT-5 Pro, OpenAI).
2.4. LST Calculation per LCZ
Landsat 8 Collection 2, Level-2 imagery (LANDSAT/LC08/C02/T1_L2) and Landsat 9 Collection 2, Level-2 imagery (LANDSAT/LC09/C02/T1_L2) were acquired for the selected heatwave periods. LST was retrieved from the Level-2 surface temperature band derived from the Thermal Infrared Sensor (TIRS; ST_B10, 30 m spatial resolution). Due to the limited temporal availability of cloud-free Landsat scenes, suitable imagery was available for ten heatwave events.
For each image, digital number (DN) values were converted to physical temperature units on a per-pixel basis following the USGS scale and offset:
After this, we converted all values to Celsius as LST [°C] = LST [K] − 273.15 [71].
For each scene, LST was summarized by LCZ class. Each class mean and standard deviation were computed in R, and—given the non-normal distribution of temperatures—differences among LCZs were assessed using the Kruskal–Wallis test with Dunn’s post-hoc comparisons.
2.5. High-Resolution Thematic Mapping
Using satellite images from the heatwave dates listed in Table 1, mean-value maps were generated for three key variables: Landsat-derived land surface temperature (LST), Sentinel-2 surface albedo and NDVI. To create a high-resolution (10 m) LST map, the 30 m Landsat LST product was statistically downscaled via a multiple linear regression model using Sentinel-2 predictors (NDVI, NDBI and NDWI), following the method described by [72]. Data availability was limited; however, by combining both Landsat and Sentinel products, we were able to obtain imagery for six heatwave periods. The details of the images used are provided in Appendix A. This composite allowed us to better capture and analyze the fine-scale spatial patterns of the SUHI effect in the city of Tarragona. These downscaled layers were used solely for visualization and not for statistical inference.
Surface albedo was derived from Sentinel-2 Surface Reflectance data using a weighted combination of bands B2, B3, B4, and B8 [73]. Pixel values were first converted to reflectance using the catalog-provided scale factor (0.0001), after which eleven cloud-free scenes were composited through a per-pixel mean to generate the final albedo map of the study region.
Vegetation greenness was characterized using NDVI, calculated from six Landsat 8 scenes (30 m) with bands SR_B5 (NIR) and SR_B4 (red) according to:
After this, the resulting NDVI composites were averaged per pixel. Based on the LST, NDVI, and albedo maps, and taking into account the hottest and coolest locations identified (see Section 2.2), we delineated the most relevant sectors, which are subsequently presented in Section 3.
All cloud-screened scenes for surface albedo, NDVI, and downscaled LST were then integrated into a composite dataset, enabling direct comparison of how these variables vary within each LCZ. An LCZ-resolved diagnostic figure was developed to jointly display the thermal–biophysical signature of each class. For visualization, up to 200,000 pixels were randomly sampled to maintain readability. Albedo was plotted on the x-axis and LST on the y-axis, with points colored by NDVI. Each LCZ panel includes: (i) dashed guide-lines at the class-specific means of albedo and LST; (ii) a class-mean marker (star, shape 18) at their intersection, shown in orange-red; and (iii) an 80% covariance ellipse (bivariate normal approximation) summarizing within-class dispersion. Axes were standardized across panels—albedo ranging from 0 to 0.60 and LST from 25 to 60 °C—to ensure direct visual comparability.
3. Results
3.1. SUHI Detection
The distribution of surface temperatures in Tarragona is not homogeneous; some areas are hotter during the day and others at night. Therefore, it is very important to understand how heatwaves affect cities, considering their heterogeneity. One of the most important variables to consider when studying heatwaves in cities is the SUHI for day and night. Figure 3 presents LST values for four land-cover categories: urban, industrial, rural, and natural. The urban category refers to built-up areas within the city of Tarragona and nearby localities such as Constantí and Bonavista. The industrial category encompasses industrial clusters and areas of heavy industry, including refineries. The rural category comprises both perennial and annual croplands, which may exhibit low or no vegetation cover depending on the season. The natural category primarily corresponds to forested areas located near the coastline and in proximity to the urban core. The Kruskal–Wallis test indicated significant differences in daytime LST among the four land-cover categories (p < 0.05). Bonferroni-adjusted Dunn post-hoc tests identified significant differences between natural and rural areas (Z = −2.70, p value = 0.0415) and between rural and urban zones (Z = 3.63, p value = 0.00173). No other pairwise comparisons retained significance after correction.
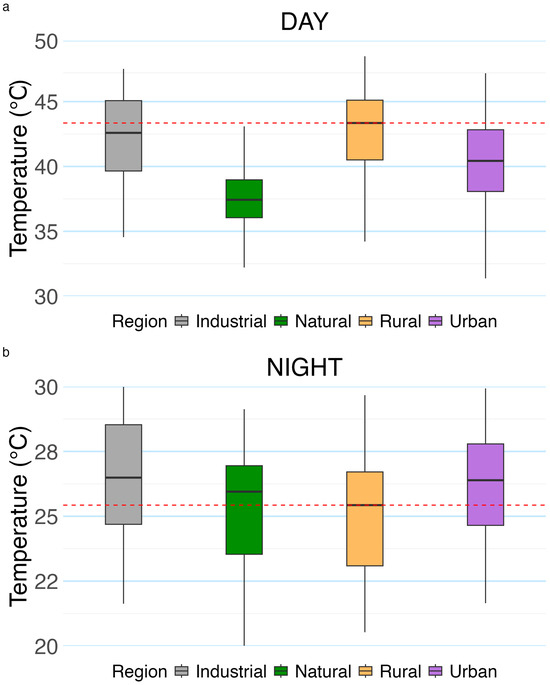
Figure 3.
Boxplots of land surface temperature (LST) in the four defined zones of Tarragona (industrial, urban, rural, and natural) under daytime (a) and nighttime (b) conditions. The red dashed line denotes the rural median LST, while the light blue grid lines indicate temperature intervals to assist visual comparison across zones.
Median daytime LST values reveal a clear thermal gradient: rural areas, with 43.4 °C (SD = 3.38), registered the highest surface temperatures, followed by industrial areas with 42.6 °C (SD = 3.49), urban zones with 40.4 °C (SD = 3.47), and natural areas with 37.4 °C (SD = 2.94) showing the lowest values. These values translate into daytime SUHII magnitudes (urban—other category) of −3.0 °C for rural areas, −2.2 °C for industrial areas, and +3 °C for natural areas. Thus, during the day, the urban core is cooler than rural and industrial zones, but warmer than forested natural areas. The elevated daytime temperatures in rural zones, surpassing even those observed in industrial areas, likely reflect bare or sparsely vegetated soils combined with low soil moisture. Natural areas, dominated by dense vegetation, exhibited the lowest daytime values, evidencing the cooling effect of evapotranspiration and canopy shading.
Nighttime LST patterns also varied significantly among land-cover categories (p < 0.05). Dunn tests confirmed that industrial areas were warmer than natural areas (Z = 3.37, p value = 0.00457), urban areas were warmer than natural areas (Z = 4.08, p value = 0.00027), and the rural–urban difference approached but did not reach adjusted significance (p value = 0.072). Median nighttime values showed a narrower thermal range than daytime: industrial areas registered 26.9 °C (SD = 2.33), urban areas 26.7 °C (SD = 2.37), natural areas 25.9 °C (SD = 2.26), and rural areas 25.4 °C (SD = 2.00). Corresponding nighttime SUHI magnitudes (urban—other category) were −0.2 °C for industrial areas, +1.3 °C for rural areas, and +0.8 °C for natural areas, indicating that urban and industrial zones retain similar heat levels overnight, while rural and natural zones cool more rapidly.
3.2. Surface Temperature Variation by Local Climate Zone (LCZ)
The LCZ map (Figure 4) reveals a compact urban core along the central coastal strip, primarily characterized by LCZ 2 (Compact Mid-Rise) and surrounded by industrial areas (LCZ 8—Large Low-Rise and LCZ 10—Heavy Industry), which are distributed in the immediate periphery and along the main transportation corridors. Further inland, extensive areas of scattered vegetation (12-LCZ B—Scattered Trees) are observed, corresponding to rural landscapes dominated by perennial crops such as olive or hazelnut groves, as well as low-vegetation zones associated with LCZ D (14-Low Plants), which likely represent annual crops and exhibit greater soil exposure. In the northern and mountainous interior regions, dense forests (11-LCZ A—Dense Trees) prevail. This spatial arrangement reflects a clear transition from the high-density, human-dominated coastal environment toward a predominantly agricultural landscape and, ultimately, forested areas in the interior.
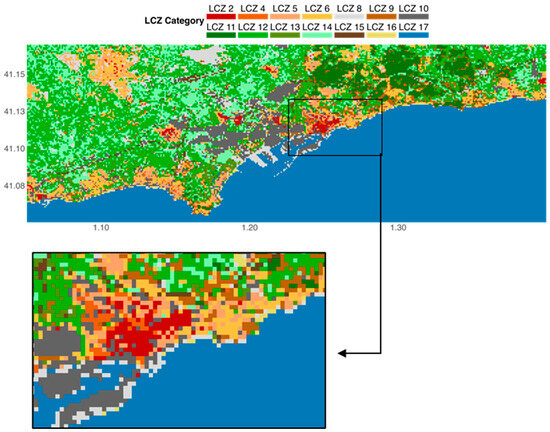
Figure 4.
LCZ Classification for Tarragona.
LST (in °C) varied significantly across LCZ classes in Tarragona (Kruskal–Wallis χ2 = 152.58; df = 13; p < 2.2 × 10⁻¹⁶); see Figure 5. The warmest LCZs were LCZ 14 (Me = 44.12 °C, SD = 4.22) and LCZ 8 (Me = 43.80 °C, SD = 5.44). Other hot categories included LCZ 15 (Bare rock/paved) (Me = 43.36 °C, SD = 3.63), LCZ 12 (Scattered trees) (Me = 42.94 °C, SD = 3.98), and LCZ 10 (Heavy industry) (Me = 42.80 °C, SD = 3.42). Intermediate mean values occurred in LCZ 2 (Me = 42.05 °C, SD = 3.05), LCZ 5 (Me = 41.52 °C, SD = 3.97), LCZ 13 (Me = 41.33 °C, SD = 3.36), LCZ 6 (Me = 41.43 °C, SD = 4.05), and LCZ 4 (Me = 40.31 °C, SD = 2.77). Cooler categories included LCZ 9 (Sparsely built) (Me = 38.64 °C, SD = 3.43), LCZ 11 (Dense trees) (Me = 36.19 °C, SD = 2.45), and LCZ 16 (Bare soil/sand) (Me = 36.50 °C, SD = 4.14). LCZ 17 (Water bodies) was by far the coolest (Me = 27.58 °C, SD = 2.78).
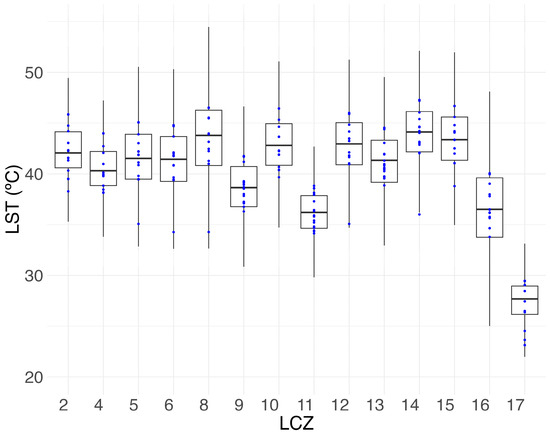
Figure 5.
A boxplot illustrating the Land Surface Temperature (LST) distribution in degrees Celsius (°C) for each LCZ. Blue dots represent the average temperatures for each heatwave period used in the analysis.
Dunn’s test with Bonferroni adjustment revealed significant differences between water (LCZ 17) and almost all built-up, bare, and low-vegetation classes (p < 0.001 in many cases). Dense trees (LCZ 11) and bare soil/sand (LCZ 16) were significantly cooler than several industrial and built-up LCZs (e.g., LCZ 2, 5, 6, 8, 10, 12, 14, 15; p < 0.05 in multiple contrasts). The relatively lower temperatures observed in LCZ 16 may be attributed to its representation of sandy beaches located near the sea, where higher moisture content is likely to occur. Sparsely built areas (LCZ 9) were also cooler than certain large low-rise and industrial categories (LCZ 8, 10, 12, 14, 15; p < 0.05). In contrast, heavily built or bare-surface LCZs often did not differ significantly among themselves, indicating a shared high thermal profile. This hierarchy highlights the protective role of vegetation and water against extreme surface heating.
3.3. High-Resolution Maps
To better understand the spatial dynamics of land surface temperature (LST) and its environmental drivers in the Tarragona region, we analyzed and compared three geospatial datasets derived from remote sensing: land surface temperature (Landsat-derived), surface albedo, and the normalized difference vegetation index (NDVI). All datasets were projected and clipped to the same spatial extent, allowing direct visual and analytical comparison. Finally, maps will be provided with two different extents: one showing the region where the city of Tarragona is located (extent: 1.050° E, 1.400° E, 41.050° N, 41.170° N) and another focusing on the city center (extent: 1.225° E, 1.288° E, 41.095° N, 41.132° N).
The satellite basemap imagery (Figure 1) was captured from the Google Earth Pro to provide a high-resolution, visually interpretable context for the quantitative layers analyzed in this study—LST, NDVI, and albedo. Specifically, the following extents were used: (a) the Tarragona area (1.050° E–1.400° E, 41.050° N–41.170° N) and (b) the Tarragona city center (1.225° E–1.288° E, 41.095° N–41.132° N). Because this basemap is a composite of scenes from multiple sensors and acquisition dates, it is used here strictly for qualitative interpretation of land cover; color tones and textural patterns may not be temporally synchronized with the dates used for the quantitative products.
To understand how heatwaves affect the city of Tarragona, it is essential to examine the types of land-cover surfaces within the city and its surrounding areas, and to assess how these surfaces influence LST. Such analysis provides insights into which zones are most exposed to extreme heat events. Across the study area, built-up zones—most prominently the city of Tarragona and its surrounding urban fabric—appear in mottled brown and gray tones, reflecting impervious surfaces with minimal vegetation. Port installations and adjacent industrial clusters are characterized by extensive, uniform, light-colored rooftops and paved yards. Rural landscapes form a heterogeneous mosaic of agricultural plots, ranging from bare or senescent soils (brown) to actively growing crops (light green), consistent with seasonal phenology. Forested and natural areas in the northern and northeastern sectors display dark-green hues indicative of dense canopy cover. The Mediterranean coastline is clearly delineated, with water bodies represented in deep blue to near-black depending on depth, seabed type, and turbidity. All these surfaces play a critical role in shaping the spatial distribution of LST during periods of extreme heat.
The LST maps (Figure 6), derived from satellite data acquired during heatwave events, reveal a clear thermal gradient ranging from cooler areas (purple) to hotter areas (red). The highest temperatures are primarily associated with bare soils and industrial zones. Urban areas also display elevated LST, particularly on surfaces covered with heat-absorbing materials such as asphalt and metal roofing. The port, major transportation corridors, and densely built residential neighborhoods consistently register high LST values, underscoring the influence of impervious materials on heat retention.
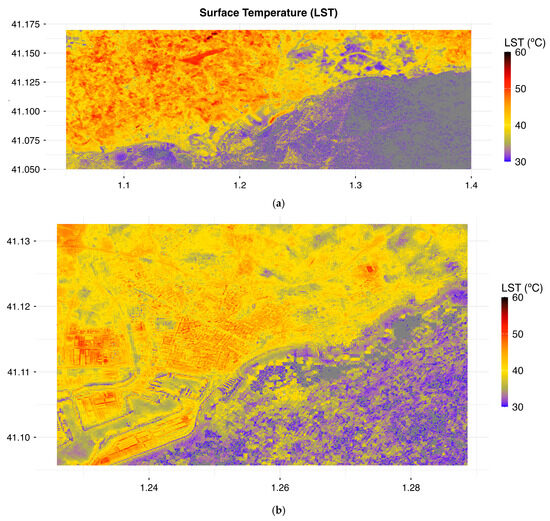
Figure 6.
Downscaled LST (LANDSAT-derived) for (a) the Tarragona area and (b) the Tarragona city center. The downscaled LST was generated by aggregating Landsat scenes over the heatwave periods analyzed to compute mean values, which were subsequently resampled to a finer spatial scale. Landsat and Sentinel data were obtained from Google Earth Engine Data Catalog [74].
Within the city of Tarragona (Figure 6b), thermal hotspots are clearly visible in the industrial cluster adjacent to the urban core, in port facilities, and across several locations within the city fabric. Notable examples include a commercial center and a sports complex in the northeastern sector of the map. A distinct cool zone is also observed on the eastern side of the city, corresponding to a forested tract that effectively mitigates heat accumulation. Coastal and marine environments show the lowest LST values, functioning as thermal buffers that moderate local temperatures.
Building on these general patterns, Figure 7 examines four representative urban sectors in greater detail, linking LST with surface albedo. The selected sites—an industrial cluster, a shopping mall with an extensive rooftop, a paved urban square near the Imperial Tarraco roundabout, and the coastal train station—illustrate how surface materials condition heat exposure. The locations of all sites mentioned in the manuscript are shown on the map in Appendix B. In all cases, low-albedo surfaces correspond to elevated LST, while light-colored rooftops display higher albedo and comparatively lower temperatures. Vegetated zones show lower LST despite their relatively low albedo values, underscoring the cooling role of vegetation through shading and evapotranspiration.
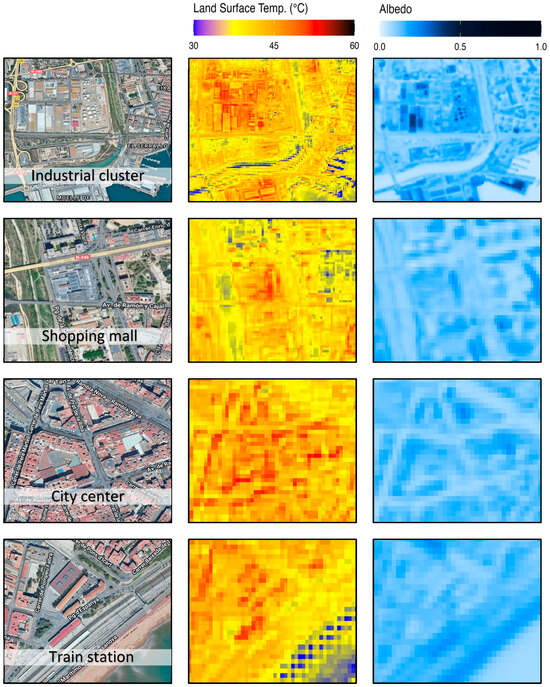
Figure 7.
Examples of urban areas in Tarragona illustrating the spatial relationship between albedo and LST. The first column shows satellite basemaps visualized via Google Earth Engine (imagery from multiple providers), the second column depicts downscaled LST derived from Landsat data, and the third column presents surface albedo derived from Sentinel-2 imagery. Basemaps and satellite data were accessed through the Google Earth Engine platform [75].
Complementary insights are provided in Figure 8, which focuses on NDVI patterns and their relationship with LST. Appendix B shows a map of Tarragona with the points mentioned below. Dense vegetation in northern and northeastern forested areas, as well as cultivated fields with high canopy cover, exhibits high NDVI and correspondingly low LST. Within the city, two major parks—the central park and the linear park along the Francolí River—stand out as cool islands with high NDVI values. In contrast, built-up and industrial areas with minimal vegetation cover display low NDVI and high LST. The rural example highlights how differences in crop cover directly influence temperature, while the football stadium illustrates sharp contrasts between a natural grass pitch (high NDVI, low LST) and adjacent artificial surfaces (low NDVI, high LST).
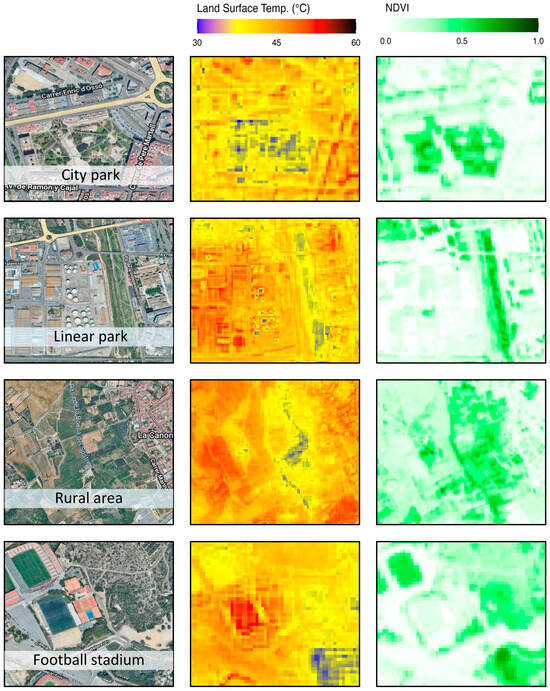
Figure 8.
Examples of urban areas in Tarragona illustrating the spatial relationship between NDVI and LST. The first column shows satellite basemaps visualized via Google Earth Engine (imagery from multiple providers), the second column depicts downscaled LST derived from Landsat data, and the third column presents NDVI derived from Sentinel-2 imagery. Basemaps and satellite data were accessed through the Google Earth Engine platform [75].
Satellite basemap imagery from Google Earth Engine further supports these interpretations by clearly delineating urban, industrial, agricultural, and natural zones. Visual identification of impervious structures, urban sprawl, vegetated corridors, and bare soils aligns with the spectral indicators (NDVI, albedo) and their thermal signatures. Impervious surfaces consistently correspond to low NDVI, low albedo, and high LST, while vegetated areas display high NDVI and moderate LST despite their darker appearance in true-color imagery.
A spatial cross-analysis reveals several consistent and ecologically meaningful relationships among the datasets:
- LST-NDVI: A strong inverse association is evident. Areas with high NDVI generally exhibit lower LST due to evapotranspirative cooling and shading, particularly in forested zones and cultivated lands.
- LST-Albedo: Although not strictly linear, a clear tendency emerges: low-albedo surfaces (e.g., urban and industrial materials) absorb more solar energy and exhibit higher LST, while low albedo values in vegetated areas may also be associated with lower temperatures.
- NDVI-Albedo: Vegetation modifies the relationship between LST and albedo. Vegetated areas, which typically have moderate to low albedo, tend to be cooler, whereas bare soils, with higher albedo, reach higher temperatures in the absence of vegetation.
3.4. Relationships Between LCZ, LST, NDVI and Albedo
Figure 9 shows the joint distribution of albedo, NDVI, and land surface temperature (LST) across the Local Climate Zones (LCZs) of Tarragona during heatwave conditions. A consistent pattern emerges: greener pixels (higher NDVI) are systematically associated with lower LST, highlighting the dominant cooling effect of vegetation. This relationship is strongest in tree-dominated classes, where pixel clusters shift downward along the temperature axis as NDVI increases. Albedo plays a secondary, context-dependent role—higher reflectance reduces LST in natural or sparsely built zones, but in compact and industrial fabrics this effect is overshadowed by low evapotranspiration and the heat storage of impervious materials.
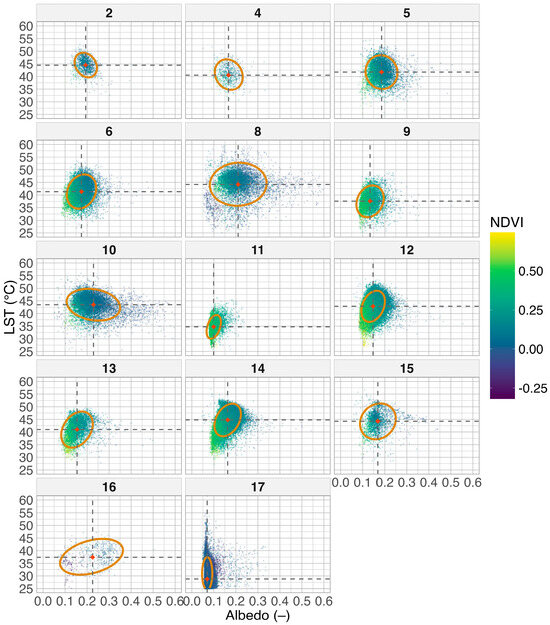
Figure 9.
LCZ-resolved bivariate signatures of surface albedo versus land surface temperature (LST) for Tarragona. Each panel corresponds to one LCZ class; points are pixels colored by NDVI. Vertical and horizontal dashed lines mark the LCZ-specific means of albedo and LST, respectively; the orange/red star indicates the bivariate mean; the orange ellipse encloses the 80% covariance of the pixel cloud.
The intra-class variability depicted by the covariance ellipses illustrates how urban form shapes heat exposure. Dense built-up and warehouse-dominated zones form tight clusters at high LST, whereas shrub and low-plant classes show broader distributions reflecting mixed soil–vegetation states. This thermal hierarchy aligns with land-cover composition: vegetation-poor surfaces are consistently warmer, while vegetated and aquatic environments remain cooler.
When considering average LST values by LCZ (Figure 5), the hottest classes are LCZ 14 (Low Plants) and LCZ 8 (Large Low-Rise), both characterized by limited vegetation cover. Compact or industrial categories (e.g., LCZ 2, 10, 15) also cluster at high temperatures, while dense-tree zones show the lowest LST values. Water (LCZ 17) provides the coolest baseline, underscoring its role as a thermal buffer.
Together, Figure 5 and Figure 9 demonstrate that vegetation cover is the primary driver of temperature differences across LCZs, with albedo acting as a secondary control. Identifying these patterns is crucial for urban heatwave resilience: zones with low NDVI and low albedo consistently emerge as thermal hotspots, whereas vegetated areas moderate surface heating through shading and evapotranspiration.
4. Discussion
The SUHII results reveal a clear diurnal asymmetry in Tarragona’s thermal behavior. During the day, the urban core was approximately 3 °C cooler than surrounding rural croplands and 2.2 °C cooler than industrial zones yet remained 3 °C warmer than forested natural areas. At night, however, the pattern reversed, with the city registering 1.3 °C warmer than rural areas and 0.8 °C warmer than natural zones, while maintaining similar temperatures to industrial surfaces. This duality—a daytime “cool island” relative to arid rural zones and a nocturnal heat island driven by heat retention—mirrors patterns reported in other Mediterranean cities [33,34]. The underlying mechanisms can be explained by the contrasting thermal inertia of urban and rural surfaces [16]. Rural soils, characterized by low heat capacity and admittance, heat rapidly under intense solar radiation, producing high daytime surface temperatures but cooling quickly after sunset. In contrast, dense urban materials such as concrete and asphalt exhibit high thermal admittance, allowing deep heat penetration and delayed nocturnal release, thereby sustaining elevated nighttime temperatures.
In addition to material properties, urban geometry and microclimatic dynamics further shape this diurnal contrast. The low sky-view factors typical of dense urban canyons reduce longwave radiative losses and promote heat trapping, intensifying nighttime warming [16,17]. Limited nocturnal ventilation and localized micro-wind recirculation, modulated by Tarragona’s coastal breeze regime, restrict convective cooling and prolong stored heat release [15,50]. During the day, vegetation mitigates heat accumulation through evapotranspiration, lowering the sensible heat flux and contributing to the observed daytime cool-island effect [16]. Conversely, drought-stressed croplands with depleted soil moisture experience reduced latent heat exchange and stronger heating [18]. The concentration of nocturnal hotspots in industrial estates and dense built-up LCZs aligns with evidence that impervious, vegetation-poor areas maintain the highest residual heat loads [46,47].
Although this study does not directly measure atmospheric composition or anthropogenic emissions, it is relevant to acknowledge their complementary role in shaping urban thermal environments. Air pollutants can enhance longwave radiation absorption, adding up to 0.7 ± 0.26 °C of nighttime warming and often surpassing the effect of water vapor and other greenhouse gases [76,77]. Likewise, persistent greenhouse gas emissions—particularly CO2—elevate baseline urban temperatures and increase the sensitivity of UHIs to human-induced forcing [78]. Although transient phenomena such as volcanic eruptions may cause short-term anomalies, sustained anthropogenic heat emissions from energy use, impervious materials, and reduced vegetation remain dominant. These factors often compound during heatwaves, exacerbating nocturnal heat stress, straining cooling infrastructure, and increasing health risks for vulnerable urban populations [79,80].
Overall, these findings emphasize that SUHI dynamics in Tarragona emerge from the combined effects of surface properties, urban morphology, and local climatic context, while also being indirectly influenced by broader atmospheric and anthropogenic processes. Although this study does not explicitly account for seasonality, we recognize that factors such as seasonal vegetation cover and soil moisture can significantly influence the intensity and spatial extent of the heat island effect. Addressing these temporal dynamics represents an important direction for future research, which will allow a more comprehensive understanding of how phenological and hydrological variability modulate urban thermal behavior. Understanding these interactions provides a necessary foundation for interpreting the spatial organization of heat patterns across the city and assessing how land cover and urban structure modulate LST variability under extreme heat conditions.
This study provides the first comprehensive assessment of LST variability across Tarragona during heatwave conditions, revealing both the spatial configuration of the SUHI and the mechanisms driving local thermal contrasts. About the LCZ classification, its principal advantage lies in providing a comparable and globally applicable structure for analyzing urban climates [30,43]. By classifying cities into 17 standardized types, LCZs allow consistent cross-city comparisons and offer a valuable tool for understanding and analyzing the thermal behavior of complex urban systems. However, several limitations have been identified. Accurate large-scale LCZ mapping remains challenging, as manual delineation of training zones in satellite imagery is labor-intensive and prone to human error. The precision of results also depends on the availability and consistency of urban datasets, including elevation models and vegetation inventories, while the spatial and temporal resolution of satellite data may be insufficient for highly heterogeneous areas [44]. Moreover, the LCZ scheme is inherently static, relying on discrete classes that may overlook fine spatial gradients and temporal dynamics in rapidly changing urban landscapes [45]. Notably, a study reported remarkable spatial variability of temperature within the same LCZ, which they linked to micro-scale differences in building density and surface cover [81]. In addition, microclimate is influenced by urban metabolism related to human activities as well as structural effects, yet the LCZ classification does not incorporate these functional aspects [82]. Recent reviews therefore emphasize the need to improve automated mapping techniques and integrate higher-resolution, multi-temporal, and morphometric data to enhance the applicability and precision of LCZ-based urban climate analyses [44].
By employing the LCZ framework [43], we identified a clear thermal hierarchy across urban, industrial, rural, and natural environments, consistent with findings from other Mediterranean and European cities [46,47]. Hotspots were concentrated in industrial clusters (e.g.,Francolí Cluster), large commercial complexes (e.g., shopping mall), and extensive paved areas such as sports facilities and parking lots. These areas—primarily LCZ 8 (Large Low-Rise), LCZ 10 (Heavy Industry), and LCZ 14 (Low Plants, often bare soil)—showed persistently high LST due to the predominance of impervious materials, low vegetation cover, and high thermal inertia. At the opposite end of the spectrum, vegetated areas—especially dense forests, peri-urban parks, and riparian corridors—exhibited the lowest daytime LST values, underscoring the critical thermoregulatory role of urban green infrastructure (UGI). The effectiveness of UGI depends not only on vegetation type but also on the size, shape, and connectivity of green patches [35,36]. Larger and more compact patches, such as the forested zones north of Tarragona, provided stronger cooling benefits, consistent with earlier findings that trees outperform shrubs and grasses in mitigating heat [37,38]. Importantly, the clustering and continuity of green areas enhance the distribution of cooling effects [11,13], suggesting that the relative freshness of forest belts and riverine vegetation in Tarragona is amplified by their spatial configuration. These results align with broader evidence that the spatial arrangement of vegetation often matters more than total green area, and that synergies with nearby water bodies can further boost cooling [83,84].
The NDVI analysis confirms that vegetation is the dominant control on surface temperature, with greener pixels consistently aligned with lower LST values [40,85]. Figure 9 illustrates this clearly: tree-dominated LCZs occupy the coolest end of the albedo–LST space, while compact and industrial LCZs remain hot regardless of reflectance values. Beyond urban greenery, agricultural systems also contribute to the local thermal environment. Perennial crops, with continuous canopy cover and deeper rooting systems, provide stronger cooling compared to annual crops, which often leave soil exposed during dry summer months. In annual systems, the presence of soil cover—through crop residues or service crops—plays a critical role in reducing surface heating, conserving soil moisture, and enhancing organic matter, thereby supporting both thermal regulation and long-term ecosystem resilience. These insights highlight the dual role of agriculture in peri-urban landscapes: moderating local microclimates while sustaining soil health during recurrent heatwaves.
Albedo exerted a secondary but notable influence. Higher reflectance reduced LST in natural and sparsely built zones, but its effect was muted in dense urban and industrial LCZs where evapotranspiration is limited. Nevertheless, Figure 9 demonstrates that light-colored rooftops can produce localized cooling even within industrial clusters, where vegetation is scarce. Promoting reflective surfaces—such as high-albedo roofing materials or light pavements—is particularly relevant in large-scale facilities, logistics zones, and transport corridors. While not a substitute for vegetation-driven cooling, these measures represent complementary strategies to reduce heat accumulation in the most impervious parts of the urban fabric [9,41].
Taken together, the patterns identified across LCZs highlight that vegetation density and evapotranspiration remain the primary buffers against extreme surface heating, while albedo provides an additional control where greenery is absent. The scatterplots in Figure 9 confirm that LCZs with both low NDVI and low albedo are systematically associated with the highest LST, marking them as critical targets for adaptation. Conversely, vegetated and water-dominated LCZs provide the strongest cooling, reinforcing the importance of safeguarding natural assets. Understanding these class-specific signatures is crucial for climate-sensitive urban planning. Identifying LCZs where low NDVI and low albedo coincide with high LST allows planners to target the most vulnerable hotspots during heatwaves. Conversely, the cooling benefits of vegetated LCZs emphasize the potential of increasing urban greenery and preserving natural areas as a strategy to buffer extreme heat. By linking land cover properties to thermal performance. Figure 9 provides an evidence base for prioritizing interventions—such as expanding tree canopies, promoting perennial and service crops in peri-urban agriculture, or deploying high-albedo materials in industrial clusters —according to the morphological and functional context of each LCZ. These findings reinforce that vegetation-driven cooling generally outweighs reflectivity in regulating LST, but that both mechanisms must be integrated to design effective adaptation strategies [23,46,47]. Future research should complement satellite-based analyses with in situ measurements of air temperature and humidity across different neighborhoods of Tarragona and its surroundings. Such monitoring would allow a more precise evaluation of human exposure to heat stress during extreme events and provide critical information for designing locally tailored adaptation strategies.
While we propose several adaptation options, this study does not provide a detailed assessment of their combined benefits or potential trade-offs. We consider such evaluation essential for future work, particularly through the incorporation of targeted field measurements and local environmental monitoring. This would allow a more robust understanding of the feasibility, synergies, and limitations of each intervention in real urban contexts. Future research should complement satellite-based analyses within situ measurements of air temperature and humidity across different neighborhoods of Tarragona and its surroundings. Such monitoring would allow a more precise evaluation of human exposure to heat stress during extreme events and provide critical information for designing locally tailored adaptation strategies.
5. Conclusions
This study provides the first comprehensive update of Tarragona’s urban effect in temperatures in more than three decades, applying a multi-sensor remote sensing framework that integrates MODIS, Landsat, and Sentinel-2 data within the LCZ classification. The results reveal a characteristic dipole pattern: a daytime urban cool island relative to croplands—driven by soil desiccation and low evapotranspiration in rural areas—and a positive nocturnal SUHI linked to heat retention in built-up districts. Industrial clusters, commercial complexes, and large paved surfaces consistently emerged as thermal hotspots, whereas forests and water bodies provided the strongest cooling. By explicitly linking LST with albedo and NDVI, the study highlights the decisive role of vegetation cover and surface reflectivity in regulating intra-urban thermal variability.
Beyond filling a major research gap for Tarragona, the methodological integration of multi-source satellite data and LCZ mapping demonstrates a robust and transferable approach for diagnosing spatial heat risks in Mediterranean cities. The findings provide a solid evidence base for targeted adaptation strategies such as expanding tree canopy cover, re-greening industrial clusters, incorporating reflective and low-inertia materials, and preserving coastal ventilation corridors.
Ultimately, this work underscores that high-resolution SUHI assessments are not only of academic value but also of urgent practical importance. As climate change intensifies and heatwaves become longer, hotter, and more frequent, cities like Tarragona require precise, spatially explicit evidence to guide adaptation. By identifying where and why urban heat accumulates, this study equips planners and policymakers with actionable insights to protect vulnerable populations and design more resilient, livable, and climate-ready urban environments.
Author Contributions
Conceptualization, C.C. and E.A.; methodology, C.C.; formal analysis, C.C.; investigation, C.C.; data curation, C.C.; writing—original draft preparation, C.C.; writing—review and editing, C.C. and E.A.; visualization, C.C.; supervision, E.A. All authors have read and agreed to the published version of the manuscript.
Funding
This research was funded by the Martí i Franquès Research Grants Program, grant number 2021PMF-PIPF-25. The APC was funded by the Martí i Franquès Research Grants Program.
Institutional Review Board Statement
Not applicable.
Informed Consent Statement
Not applicable.
Data Availability Statement
The data presented in this study are available on request from the corresponding author. Nevertheless, all datasets used (originating from publicly available satellite imagery) can be freely accessed through the official platforms of the respective providers; thus, the authors do not distribute them directly.
Acknowledgments
During the preparation of this manuscript, the authors used ChatGPT (GPT-5, OpenAI) for the purpose of assisting in the design of one of the images included in the graphical abstract.
Conflicts of Interest
The authors declare no conflicts of interest. The funders had no role in the design of the study; in the collection, analyses, or interpretation of data; in the writing of the manuscript; or in the decision to publish the results.
Abbreviations
The following abbreviations are used in this manuscript:
| LCZ | Local Climate Zone |
| LST | Land Surface Temperature |
| NDVI | Normalized Difference Vegetation Index |
| SUHI | Surface Urban Heat Island |
| UHI | Urban Heat Island |
| Meteocat | Servei Meteorològic de Catalunya |
| AEMET | State Meteorological Agency |
Appendix A
The following table (Table A1) presents the Landsat 8 and Landsat 9 scenes used to calculate the land surface temperature (LST) values for each Local Climate Zone (LCZ) category analyzed in this study. The table includes the corresponding metadata for each scene, namely the Scene ID, Cloud Cover (%), Acquisition Date (Europe/Madrid time), and Product ID.
All imagery was accessed and processed through the Google Earth Engine platform, using datasets available in the Earth Engine Data Catalog, as detailed below:
- USGS Landsat 8 Level 2, Collection 2, Tier 1: This dataset provides atmospherically corrected surface reflectance (SR) and land surface temperature (ST) products derived from the Operational Land Imager (OLI) and Thermal Infrared Sensor (TIRS) aboard Landsat 8. It includes five visible and near-infrared (VNIR) bands and two shortwave infrared (SWIR) bands processed to generate orthorectified surface reflectance, as well as one thermal infrared (TIR) band processed to produce orthorectified surface temperature. Intermediate and QA bands used in the computation of the LST products are also included.
- USGS Landsat 9 Level 2, Collection 2, Tier 1: This dataset provides atmospherically corrected surface reflectance (SR) and land surface temperature (ST) products derived from the OLI and TIRS sensors aboard Landsat 9. It contains five VNIR and two SWIR bands processed to obtain orthorectified surface reflectance, together with one TIR band used to derive orthorectified surface temperature. The dataset also includes intermediate and QA bands relevant to LST computation.
Table A1.
Landsat 8 and Landsat 9 Level 2, Collection 2, Tier 1 products; metadata include Scene ID, Cloud Cover, Acquisition Date (Europe/Madrid), and Product ID.
Table A1.
Landsat 8 and Landsat 9 Level 2, Collection 2, Tier 1 products; metadata include Scene ID, Cloud Cover, Acquisition Date (Europe/Madrid), and Product ID.
| Scene ID | Cloud Cover | Date (EU-Madrid) | Product ID |
|---|---|---|---|
| LC81980322016250LGN01 | 0.22 | 6 September 2016 12:37 | LC08_L2SP_198032_20160906_20200906_02_T1 |
| LC81980322019178LGN00 | 0.09 | 27 June 2019 12:36 | LC08_L2SP_198032_20190627_20200827_02_T1 |
| LC81980322020213LGN00 | 3.46 | 31 July 2020 12:36 | LC08_L2SP_198032_20200731_20200908_02_T1 |
| LC81980322022202LGN00 | 1.2 | 21 July 2022 12:37 | LC08_L2SP_198032_20220721_20220726_02_T1 |
| LC81980322022218LGN00 | 0.55 | 6 August 2022 12:37 | LC08_L2SP_198032_20220806_20220818_02_T1 |
| LC81980322023221LGN00 | 1.66 | 9 August 2023 12:36 | LC08_L2SP_198032_20230809_20230812_02_T1 |
| LC81980322024224LGN00 | 0.82 | 11 August 2024 12:36 | LC08_L2SP_198032_20240811_20240815_02_T1 |
| LC81980322025226LGN00 | 0.05 | 14 August 2025 12:37 | LC08_L2SP_198032_20250814_20250821_02_T1 |
| LC91980322022194LGN01 | 0.03 | 13 July 2022 12:36 | LC09_L2SP_198032_20220713_20230407_02_T1 |
| LC91980322023229LGN00 | 10.39 | 17 August 2023 12:36 | LC09_L2SP_198032_20230817_20230822_02_T1 |
Table A2 lists the Product IDs of the Sentinel-2 and Landsat images used for the downscaling process, in which the Landsat-derived LST was refined from a 30 m to a 10 m spatial resolution. The date ranges shown in the table (start and end dates) correspond to the heatwave events identified according to the information provided by AEMET (see Table 1 in Section 2).
Table A2.
Product IDs of Sentinel-2 and Landsat images used for the downscaling process. The date ranges correspond to heatwave events identified (see Table 1 in Section 2).
| Date Start | Date End | Sentinel | Landsat |
|---|---|---|---|
| 26 June 2019 | 1 July 2019 | 20190627T104029_20190627T104030_T31TCF | LC08_198032_20190627 |
| 25 July 2020 | 2 August 2020 | 20200729T105031_20200729T105032_T31TCF | LC08_198032_20200731 |
| 9 July 2022 | 26 July 2022 | 20220721T103629_20220721T104848_T31TCF | LC08_198031_20220721 |
| 30 July 2022 | 14 August 2022 | 20220810T103629_20220810T104933_T31TCF | LC08_198032_20220806 |
| 30 July 2022 | 14 August 2022 | 20220803T104629_20220803T105906_T31TCF | LC08_198032_20220806 |
| 4 August 2024 | 12 August 2024 | 20240809T103629_20240809T104820_T31TCF | LC08_198031_20240811 |
Appendix B
Figure A1 shows the spatial distribution of the study sites within the city of Tarragona (Spain). These sites were selected to analyze the spatial variability of land surface temperature (LST) in relation to NDVI and surface albedo, across different urban and non-urban environments.
The symbols on the map differentiate the two groups of reference sites illustrated in the main figures:
- Numbers (1–4) correspond to the sites shown in Figure 7, representing predominantly urban areas: (1) Industrial cluster, (2) Shopping mall, (3) City center, and (4) Train station.
- Letters (A–D) correspond to the sites displayed in Figure 8, representing green and non-urban areas: (A) City park, (B) Linear park, (C) Rural area, and (D) Football stadium.
These locations were used to examine how variations in vegetation cover and surface materials influence both NDVI and albedo, helping to interpret the patterns of land surface temperature observed across the different Local Climate Zone (LCZ) categories.

Figure A1.
Location of the study sites in Tarragona (Spain). Numbers indicate the urban areas shown in Figure 8: (1) Industrial cluster, (2) Shopping mall, (3) City center, and (4) Train station. Letters indicate the green and non-urban areas shown in Figure 9: (A) City park, (B) Linear park, (C) Rural area, and (D) Football stadium.
References
- AEMET El Verano de 2022: Balance y Episodios de Ola de Calor En España. Available online: https://www.aemet.es/documentos/es/serviciosclimaticos/vigilancia_clima/resumenes_climat/estacionales/2022/Est_verano_22.pdf (accessed on 9 September 2025).
- AEMET Climatic Report. July 2025. Available online: https://www.aemet.es/documentos/es/serviciosclimaticos/vigilancia_clima/resumenes_climat/mensuales/2025/res_mens_clim_2025_07.pdf (accessed on 8 September 2025).
- Ballester, J. The Burden of Heat-Related Mortality in Europe during the Summer of 2022. Nat. Med. 2023, 29, 2504–2511. [Google Scholar] [CrossRef]
- Murage, P.; Hajat, S.; Kovats, R.S. Effect of Night-Time Temperatures on Cause and Age-Specific Mortality in London. Environ. Epidemiol. 2017, 2, e005. [Google Scholar] [CrossRef]
- Cheng, X.; Su, H. Effects of Climatic Temperature Stress on Cardiovascular Diseases. Eur. J. Intern. Med. 2010, 21, 164–167. [Google Scholar] [CrossRef]
- Silveira, I.H.; Oliveira, B.F.A.; Cortes, T.R.; Junger, W.L. The Effect of Ambient Temperature on Cardiovascular Mortality in 27 Brazilian Cities. Sci. Total Environ. 2019, 691, 996–1004. [Google Scholar] [CrossRef]
- Linares, C.; Diaz, J.; Tobías, A.; Carmona, R.; Mirón, I.J. Impact of Heat and Cold Waves on Circulatory-Cause and Respiratory-Cause Mortality in Spain: 1975–2008. Stoch. Environ. Res. Risk Assess. 2015, 29, 2037–2046. [Google Scholar] [CrossRef]
- Oke, T.R. The Energetic Basis of the Urban Heat Island. Q. J. R. Meteorol. Soc. 1982, 108, 1–24. [Google Scholar] [CrossRef]
- Voogt, J.A.; Oke, T.R. Thermal Remote Sensing of Urban Climates. Remote Sens. Environ. 2003, 86, 370–384. [Google Scholar] [CrossRef]
- Heaviside, C.; Macintyre, H.; Vardoulakis, S. The Urban Heat Island: Implications for Health in a Changing Environment. Curr. Environ. Health Rep. 2017, 4, 296–305. [Google Scholar] [CrossRef]
- Zhou, D.; Xiao, J.; Bonafoni, S.; Berger, C.; Deilami, K.; Zhou, Y.; Frolking, S.; Yao, R.; Qiao, Z.; Sobrino, J.A. Satellite Remote Sensing of Surface Urban Heat Islands: Progress, Challenges, and Perspectives. Remote Sens. 2019, 11, 48. [Google Scholar] [CrossRef]
- Peng, J.; Qiao, R.; Wang, Q.; Yu, S.; Dong, J.; Yang, Z. Diversified Evolutionary Patterns of Surface Urban Heat Island in New Expansion Areas of 31 Chinese Cities. NPJ Urban Sustain. 2024, 4, 14. [Google Scholar] [CrossRef]
- Zhang, Y.; Murray, A.T.; Turner, B. Optimizing Green Space Locations to Reduce Daytime and Nighttime Urban Heat Island Effects in Phoenix, Arizona. Landsc. Urban Plan. 2017, 165, 162–171. [Google Scholar] [CrossRef]
- Balogun, I.A.; Daramola, M.T. The Outdoor Thermal Comfort Assessment of Different Urban Configurations within Akure City, Nigeria. Urban Clim. 2019, 29, 100489. [Google Scholar] [CrossRef]
- McGregor, G. Heatwaves. In Heatwaves: Causes, Consequences and Responses; Springer International Publishing: Cham, The Switzerland, 2024; pp. 3–28. [Google Scholar]
- Oke, T.R.; Mills, G.; Christen, A.; Voogt, J.A. Urban Climates; Cambridge University Press: Cambridge, UK, 2017. [Google Scholar]
- Martilli, A. An Idealized Study of City Structure, Urban Climate, Energy Consumption, and Air Quality. Urban Clim. 2014, 10, 430–446. [Google Scholar] [CrossRef]
- Rempel, A.R.; Rempel, A.W. Intrinsic Evaporative Cooling by Hygroscopic Earth Materials. Geosciences 2016, 6, 38. [Google Scholar] [CrossRef]
- Lemus-Cánovas, M.; Insua-Costa, D.; Trigo, R.M.; Miralles, D.G. Record-Shattering 2023 Spring Heatwave in Western Mediterranean Amplified by Long-Term Drought. Clim. Atmos. Sci. 2024, 7, 25. [Google Scholar] [CrossRef]
- Forzieri, G.; Miralles, D.G.; Ciais, P.; Alkama, R.; Ryu, Y.; Duveiller, G.; Zhang, K.; Robertson, E.; Kautz, M.; Cescatti, A.; et al. Increased Control of Vegetation on Global Terrestrial Energy Fluxes. Nat. Clim. Change 2020, 10, 356–362. [Google Scholar] [CrossRef]
- Li, J.; Tam, C.-Y.; Tai, A.P.K.; Lau, N.-C. Vegetation–Heatwave Correlations and Contrasting Energy Exchange Responses of Different Vegetation Types to Summer Heatwaves in the Northern Hemisphere during the 1982–2011 Period. Agric. Meteorol. 2021, 296, 108208. [Google Scholar] [CrossRef]
- Gunawardena, K.R.; Wells, M.J.; Kershaw, T. Utilising Green and Bluespace to Mitigate Urban Heat Island Intensity. Sci. Total Environ. 2017, 584–585, 1040–1055. [Google Scholar] [CrossRef]
- Santamouris, M.; Pavlou, K.; Synnefa, A.; Niachou, K.; Kolokotsa, D. Recent Progress on Passive Cooling Techniques: Advanced Technological Developments to Improve Survivability Levels in Low-Income Households. Energy Build. 2007, 39, 859–866. [Google Scholar] [CrossRef]
- Akbari, H.; Kolokotsa, D. Three Decades of Urban Heat Islands and Mitigation Technologies Research. Energy Build. 2016, 133, 834–842. [Google Scholar] [CrossRef]
- Oke, T.R. Boundary Layer Climates, 2nd ed.; Routledge: London, UK, 2002. [Google Scholar]
- Yu, Z.; Guo, X.; Jørgensen, G.; Vejre, H. How Can Urban Green Spaces Be Planned for Climate Adaptation in Subtropical Cities? Ecol. Indic. 2017, 82, 152–162. [Google Scholar] [CrossRef]
- Al-Saadi, L.M.; Jaber, S.H.; Al-Jiboori, M.H. Variation of Urban Vegetation Cover and Its Impact on Minimum and Maximum Heat Islands. Urban Clim. 2020, 34, 100707. [Google Scholar] [CrossRef]
- Ke, X.; Men, H.; Zhou, T.; Li, Z.; Zhu, F. Variance of the Impact of Urban Green Space on the Urban Heat Island Effect among Different Urban Functional Zones: A Case Study in Wuhan. Urban Urban Green. 2021, 62, 127159. [Google Scholar] [CrossRef]
- Kong, J.; Zhao, Y.; Carmeliet, J.; Lei, C. Urban Heat Island and Its Interaction with Heatwaves: A Review of Studies on Mesoscale. Sustainability 2021, 13, 10923. [Google Scholar] [CrossRef]
- Demuzere, M. LCZ Generator: A Web Application to Create Local Climate Zone Maps. Urban Clim. 2021, 35, 100734. [Google Scholar] [CrossRef]
- Zhao, L.; Lee, X.; Smith, R.B.; Oleson, K. Strong Contributions of Local Background Climate to Urban Heat Islands. Nature 2014, 511, 216–219. [Google Scholar] [CrossRef]
- Sun, R.; Chen, L. Effects of Green Space Dynamics on Urban Heat Islands: Mitigation and Diversification. Ecosyst. Serv. 2017, 23, 38–46. [Google Scholar] [CrossRef]
- Vardoulakis, E.; Karamanis, D.; Fotiadi, A.; Mihalakakou, G. The Urban Heat Island Effect in a Small Mediterranean City. Sol. Energy 2013, 94, 128–144. [Google Scholar] [CrossRef]
- Pyrgou, A.; Hadjinicolaou, P.; Santamouris, M. Urban-Rural Moisture Contrast: Regulator of the Urban Heat Island and Heatwaves’ Synergy over a Mediterranean City. Environ. Res. 2020, 182, 109102. [Google Scholar] [CrossRef]
- Xue, Z.; Hou, G.; Zhang, Z.; Lyu, X.; Jiang, M.; Zou, Y.; Shen, X.; Wang, J.; Liu, X. Quantifying the Cooling-Effects of Urban and Peri-Urban Wetlands Using Remote Sensing Data: Case Study of Cities of Northeast China. Landsc. Urban Plan. 2019, 182, 92–100. [Google Scholar] [CrossRef]
- Yu, Z.; Fryd, O.; Sun, R.; Jørgensen, G.; Yang, G.; Özdil, N.C.; Vejre, H. Where and How to Cool? An Idealized Urban Thermal Security Pattern Model. Landsc. Ecol. 2021, 36, 2165–2174. [Google Scholar] [CrossRef]
- Kong, F.; Yin, H.; James, P.; Hutyra, L.R.; He, H.S. Effects of Spatial Pattern of Greenspace on Urban Cooling in a Large Metropolitan Area of Eastern China. Landsc. Urban Plan. 2014, 128, 35–47. [Google Scholar] [CrossRef]
- Demuzere, M.; Orru, K.; Heidrich, O.; Olazabal, E.; Geneletti, D.; Orru, H.; Bhave, A.G.; Mittal, N.; Feliu, E.; Faehnle, M. Mitigating and Adapting to Climate Change: Multi-Functional and Multi-Scale Assessment of Green Urban Infrastructure. J. Environ. Manag. 2014, 146, 107–115. [Google Scholar] [CrossRef]
- European Space Agency. EUMETSAT Copernicus Sentinel 3 SLSTR Land User Handbook (Issue 1.4, 05/08/2024); European Space Agency: Paris, France, 2024. [Google Scholar]
- Weng, Q.; Lu, D.; Schubring, J. Estimation of Land Surface Temperature–Vegetation Abundance Relationship for Urban Heat Island Studies. Remote Sens. Environ. 2004, 89, 467–483. [Google Scholar] [CrossRef]
- Zhao, Q. The Retrieval of Ground NDVI (Normalized Difference Vegetation Index). Remote Sens. 2024, 16, 1212. [Google Scholar] [CrossRef]
- Yilmaz, H.; Toy, S.; Yilmaz, S.; Yildiz, N.D. Determination of Temperature Differences between Asphalt, Soil, and Grass Surfaces, and 2 m above Them. Atmósfera 2008, 21, 135–146. [Google Scholar]
- Stewart, I.D.; Oke, T.R. Local Climate Zones for Urban Temperature Studies. Bull. Am. Meteorol. Soc. 2012, 93, 1879–1900. [Google Scholar] [CrossRef]
- Han, J.; Mo, N.; Cai, J.; Ouyang, L.; Liu, Z. Advancing the Local Climate Zone Framework: Challenges and Opportunities. Humanit. Soc. Sci. Commun. 2024, 11, 538. [Google Scholar] [CrossRef]
- Lau, K.K.-L.; Ren, C.; Ng, E. A Literature Survey of Local Climate Zone Classification. Buildings 2019, 12, 1693. [Google Scholar] [CrossRef]
- Geletič, J.; Lehnert, M.; Dobrovolný, P. Land Surface Temperature Differences within LCZs in Two Central European Cities. Remote Sens. 2016, 8, 788. [Google Scholar] [CrossRef]
- Wei, L.; Sobrino, J.A. Surface Urban Heat Island Analysis Based on Local Climate Zones Using ECOSTRESS and Landsat Data: A Case Study of Valencia City (Spain). Int. J. Appl. Earth Obs. Geoinf. 2024, 130, 103875. [Google Scholar] [CrossRef]
- Fenner, D.; Meier, F.; Bechtel, B.; Otto, M.; Scherer, D. Intra- and Inter-Local Climate Zone Variability of Air Temperature. Urban Clim. 2017, 19, 64–79. [Google Scholar]
- Gilabert, J.; Deluca, A.; Lauwaet, D.; Ballester, J.; Corbera, J.; Carmen Llasat, M. Assessing Heat Exposure to Extreme Temperatures in Urban Areas Using the Local Climate Zone Classification. Nat. Hazards Earth Syst. Sci. 2021, 21, 375–391. [Google Scholar] [CrossRef]
- Alomar-Garau, G.; Grimalt-Gelabert, M. Impacts of Coastal Breezes on the Environment and Human Life: The Case of Mallorca (Western Mediterranean). Coasts 2022, 2, 17–35. [Google Scholar] [CrossRef]
- Prohom, M.; Domonkos, P.; Cunillera, J.; Barrera Escoda, A.; Herrero, M.; Busto, M.; Reynés, J. CADTEP: A New Daily Quality Controlled and Homogenized Climate Database for Catalonia (1950–2021). Int. J. Climatol. 2023, 43, 4771–4789. [Google Scholar] [CrossRef]
- Brunet India, M. La Magnitud y Fluctuaciones de La “Isla de Calor” En Tarragona. Tarraco Cuad. Geogr. 1992, 7, 19–29. [Google Scholar]
- Martin-Vide, J.; Moreno-Garcia, M.C. Probability Values for the Intensity of Barcelona’s Urban Heat Island (Spain). Atmos. Res. 2020, 240, 104877. [Google Scholar] [CrossRef]
- García, D.H. Analysis of Urban Heat Island and Heat Waves Using Sentinel-3 Images: A Study of Andalusian Cities in Spain. Earth Syst. Environ. 2022, 6, 199–219. [Google Scholar] [CrossRef] [PubMed]
- Alonso, M.S.; Labajo, J.L.; Fidalgo, M.R. Characteristics of the Urban Heat Island in the City of Salamanca, Spain. Atmósfera 2003, 16, 137–148. [Google Scholar]
- METEOCAT. Servei Meteorològic de Catalunya Atles Climàtic 1991–2020; Generalitat de Catalunya: Barcelona, Spain, 2020.
- Cuerdo-Vilches, T.; Díaz, J.; López-Bueno, J.A.; Luna, M.Y.; Navas, M.A.; Mirón, I.J.; Linares, C. Impact of Urban Heat Islands on Morbidity and Mortality in Heat Waves: Observational Time Series Analysis of Spain’s Five Cities. Sci. Total Environ. 2023, 890, 164412. [Google Scholar] [CrossRef] [PubMed]
- METEOCAT. Servei Meteorològic de Catalunya Butlletí Anual d’indicadors Climàtics (BAIC 2023); Generalitat de Catalunya: Barcelona, Spain, 2024.
- AEMET Anual Report 2023. Available online: https://www.aemet.es/documentos/es/conocenos/a_que_nos_dedicamos/informes/AEMET-InformeAnual-2023.pdf (accessed on 8 July 2025).
- Serrano-Notivoli, R.; Tejedor, E.; Sarricolea, P.; Meseguer-Ruiz, O.; de Luis, M.; Saz, M.A.; Longares, L.A.; Olcina, J. Unprecedented Warmth: A Look at Spain’s Exceptional Summer of 2022. Sci. Total Environ. 2023, 293, 163550. [Google Scholar] [CrossRef]
- Cimolai, C.; Aguilar, E. Assessing Argentina’s Heatwave Dynamics (1950–2022): A Comprehensive Analysis of Temporal and Spatial Variability Using ERA5-LAND. Theor. Appl. Clim. 2024, 155, 4925–4940. [Google Scholar] [CrossRef]
- AEMET Climate Monitoring Summaries. Available online: https://web2.aemet.es/es/serviciosclimaticos/vigilancia_clima/resumenes (accessed on 27 June 2025).
- METEOCAT Confirmem: Juny Del 2025 És El Mes Més Càlid Des Que Es Tenen Registres. Available online: https://govern.cat/salapremsa/notes-premsa/722802/confirmem-juny-del-2025-mes-mes-calid-des-que-tenen-registres (accessed on 8 September 2025).
- METEOCAT. Avanç Del Butlletí Climàtic De L’estiu Del 2025. Available online: https://www.meteo.cat/wpweb/wp-content/uploads/2025/09/ABCE_2025_est.pdf#:~:text=Juny%20molt%20c%C3%A0lid%2C%20juliol%20normal,al%20car%C3%A0cter%20c%C3%A0lid%20de%20l%E2%80%99estiu (accessed on 8 September 2025).
- GENCAT. L’onada Calor d’agost, de Les Més Llargues i Intenses; Generalitat de Catalunya: Barcelona, Spain, 2025.
- AEMET. Listado de Provincias Con Olas de Calor (1975–2022); Agencia Estatal de Meteorología, España: Madrid, Spain, 2023.
- AEMET Olas de Calor En España Desde 1975—Actualización Octubre 2023. Available online: https://www.aemet.es/documentos/es/conocermas/recursos_en_linea/publicaciones_y_estudios/estudios/Olas_calor/olas_calor_actualizacionoct2023.pdf (accessed on 7 June 2025).
- NASA. MODIS Terra/Aqua Land Surface Temperature/Emissivity Daily L3 Global 1 km SIN Grid (MOD21A1D/MOD21A1N); LP DAAC; NASA/GSFC/SED/ESD/TISL/MODAPS: Sioux Falls, SD, USA, 2023.
- Dunn, O.J. Multiple Comparisons Using Rank Sums. Technometrics 1964, 6, 241–252. [Google Scholar] [CrossRef]
- WUDAPT. World Urban Database and Access Portal Tools (WUDAPT); WUDAPT: Brussels, Belgium, 2025; Available online: https://www.wudapt.org/ (accessed on 11 September 2025).
- U.S. Geological Survey. Landsat Collection 2 Level-2 Surface Temperature Science Product. Available online: https://www.usgs.gov/landsat-missions/landsat-collection-2-level-2-science-products (accessed on 6 July 2025).
- Onačillová, K. Downscaling MODIS Land Surface Temperature Using Sentinel-2 Indices: A Case Study. Remote Sens. 2022, 14, 445. [Google Scholar] [CrossRef]
- Google LLC Sentinel-2 Surface Reflectance Products. Available online: https://developers.google.com/earth-engine/datasets/catalog/COPERNICUS_S2_SR_HARMONIZED?hl=es-419 (accessed on 6 June 2025).
- Google Earth Engine Data Catalog. Available online: https://developers.google.com/earth-engine/datasets (accessed on 6 July 2025).
- Gorelick, N.; Hancher, M.; Dixon, M.; Ilyushchenko, S.; Thau, D.; Moore, R. Google Earth Engine Code Editor. Planetary-Scale Geospatial Analysis for Everyone. Remote Sens. Environ. 2017, 202, 18–27. [Google Scholar] [CrossRef]
- Cao, C.; Lee, X.; Liu, S.; Schultz, N.; Xiao, W.; Zhang, M.; Zhao, L. Urban Heat Islands in China Enhanced by Haze Pollution. Nat. Commun. 2016, 7, 12509. [Google Scholar] [CrossRef] [PubMed]
- Jacobson, M.Z.; Nghiem, S.V.; Sorichetta, A. Short-Term Impacts of the Megaurbanizations of New Delhi and Los Angeles Between 2000 and 2009. J. Geophys. Res. Atmos. 2019, 124, 35–56. [Google Scholar] [CrossRef]
- Dogar, M.M. The Sensitivity of DTR to the Increased CO2 over Mid-Latitude Semi-Dry Regions. JOJ Hortic. Arboric. 2019, 2, 555584. [Google Scholar] [CrossRef]
- Dogar, M.M.; Sato, T. Regional Climate Response of Middle Eastern, African, and South Asian Monsoon Regions to Explosive Volcanism and ENSO Forcing. J. Geophys. Res. Atmos. 2019, 124, 7580–7598. [Google Scholar] [CrossRef]
- Yuan, Y.; Li, C.; Geng, X.; Yu, Z.; Fan, Z.; Wang, X. Natural-Anthropogenic Environment Interactively Causes the Surface Urban Heat Island Intensity Variations in Global Climate Zones. Environ. Int. 2022, 170, 107574. [Google Scholar] [CrossRef]
- Stewart, I.D.; Oke, T.R.; Krayenhoff, E.S. Evaluation of the’local Climate Zone’scheme Using Temperature Observations and Model Simulations. Int. J. Climatol. 2014, 34, 1062. [Google Scholar] [CrossRef]
- Park, S.; Lee, S.; Oh, K. Defining and Verifying New Local Climate Zones with Three-Dimensional Built Environments and Urban Metabolism. Land 2024, 13, 1461. [Google Scholar] [CrossRef]
- Yang, Z.; Witharana, C.; Hurd, J.; Wang, K.; Hao, R.; Tong, S. Using Landsat 8 Data to Compare Percent Impervious Surface Area and Normalized Difference Vegetation Index as Indicators of Urban Heat Island Effects in Connecticut, USA. Environ. Earth Sci. 2020, 79, 424. [Google Scholar] [CrossRef]
- Le, M.T.; Cao, T.A.T.; Tran, N.A.Q. The Role of Green Space in the Urbanization of Hanoi City. In Proceedings of the E3S Web of Conferences; EDP Sciences: Paris, France, 2019; Volume 97, p. 1013. [Google Scholar]
- Singh, P.; Verma, P.; Chaudhuri, A.S.; Singh, V.K.; Rai, P.K. Evaluating the Relationship between Urban Heat Island and Temporal Change in Land Use, NDVI and NDBI: A Case Study of Bhopal City, India. Int. J. Environ. Sci. Technol. 2024, 21, 3061–3072. [Google Scholar] [CrossRef]
Disclaimer/Publisher’s Note: The statements, opinions and data contained in all publications are solely those of the individual author(s) and contributor(s) and not of MDPI and/or the editor(s). MDPI and/or the editor(s) disclaim responsibility for any injury to people or property resulting from any ideas, methods, instructions or products referred to in the content. |
© 2025 by the authors. Licensee MDPI, Basel, Switzerland. This article is an open access article distributed under the terms and conditions of the Creative Commons Attribution (CC BY) license (https://creativecommons.org/licenses/by/4.0/).