Abstract
The present study, carried out in Gujarat (India) between 2005 and 2021, aims to prepare dew and rain maps of Gujarat over a long period (17 years, from 2005 to 2021) in order to evaluate the evolution of the potential for dew and rain in the state. The ratio of dew to precipitation is also determined, which is an important metric that quantifies the contribution of dew to the overall water resources. Global warming leads, in general, to a reduction in precipitation and non-rainfall water contributions such as dew. The study shows, however, a rare increase in the rainfall and dew condensation, with the latter related to an increase in relative humidity and a decrease in wind amplitudes. Rain primarily occurs during the monsoon months, while dew forms during the dry season. Although dew alone cannot resolve water scarcity, it nonetheless may provide an exigent and unignorable contribution to the water balance in time to come. According to the site, the dew–rain ratios, which are also, in general, well correlated with dew yields, can represent between 4.6% (Ahmedabad) and 37.2% (Jamnagar). The positive trend, observed since 2015–2017, is expected to continue into the future.
1. Introduction
Water scarcity in the world, in the context of global warming, has been under intense discussion and debate [1]. While such discussions give new insights about sustainability, it becomes prudent to look for non-conventional water resources, particularly in arid and semi-arid regions. A recently published technical report [2] says that one-fourth of world population is facing extreme high water stress. India ranks 13 among the 17 worst affected countries. This is also sounded by the WHO’s report that says that the per capita annual water availability in India has declined from 1820 cubic meters in 2001 to 1341 cubic meters, and it is likely to go further down to 1140 cubic meters by 2050. Many regions are much below the national average. The Composite Water Management Index maintained by Niti Ayog of India says that already 54% of India faces high to extremely high water stress conditions, which will move to a water scarcity level by 2050. Due to the high difficulty of land-surface modeling in semi-arid areas [3], the complexity of land–atmosphere coupling characteristics [4], and the uncertainty of regional precipitation forecasting [5,6], it is difficult to plan regional water resources. Therefore, local dew observations provide favorable empirical evidence for the study of land–atmosphere water resource transformation in arid areas.
Gujarat, a state in the western part of India, is currently reported to be facing extreme water stress levels, which may become worse in the coming years (Figure 1). Its annual rainfall is only around 600 mm, with about 60 rainy days around the year. In this context, atmospheric moisture in the form of dew can potentially be harvested in a way that can offer a respite, which otherwise is commonly ignored from the water budget. Dew is naturally used by plants and small animals, particularly during droughts (see [7] and Refs. therein). Note that dew, in this study, will be determined on standard artificial surfaces that are specially designed to harvest dew water. Dew on a canopy will be, in general, somewhat smaller and depends on the type of considered surfaces (vegetal, rock, pebble, etc.) [8,9]. In this paper, we are not considering fog because it is quite unusual in this region, while dew is more commonly encountered. However, fog is also undoubtedly an alternative and potential source of water in a water-starved region. We are, thus, focusing only on the dew yield in the current context of global warming, whose contribution may become significant for farming and partial watering when compared to rainfall [7,10,11,12,13,14,15,16,17,18,19,20,21]. The latter is always erratic, more so during the dry seasons.
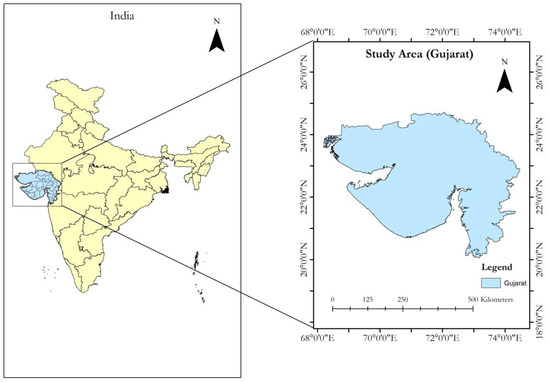
Figure 1.
Study area of our work.
Large dew condensers have been experimented with in Gujarat to show that the population can benefit from cost-effective fresh water [12,13,14,15,16] and even potable water [14]. These studies primarily focused on the process of dew harvesting and its collection at a specific location in Gujarat. In our paper, we target to find areas that have great potential for dew harvesting in the large geographical region of the whole state. It is shown that, of the 12 areas where we conducted our experiment, 4 have great potential for dew collection and use as a potable source of water in situations of dire need. We believe that such futuristic and proactive research will give trusted information of opportunity to the local government, non-government organizations, and industries for a policy framework and investment. Note that the research in Gujarat concerning dew that has been published so far [12,13,14,15,16] was carried out specifically in the Kutch district over a short time period and was related to specific experiments dealing with dew harvest devices. There were, up to now, no maps available for the whole of Gujarat, except the map by Raman et al. in 1968–1969 [17] (which, however, did not provide data for the NW of Gujarat). In contrast, this study focuses on the entire state of Gujarat, making it a unique and new contribution to the field, providing dew, rain, and dew–rain ratios maps for the whole state, during a long period (2005–2021). Such maps determined at different years allow, in addition, a trend to be defined in the context of climate change.
Dew formation depends largely upon specific temporal climatic conditions, such as clear sky, high relative humidity, and low wind speed. These conditions facilitate greater radiative cooling of the Earth’s surface and the surrounding air. Along with the meteorological factors mentioned above, the dew yield also depends on the material used as a condenser, as well as the orientation of the condenser to collect dew. The yield can vary by at least 20% at the same location depending on the condenser’s orientation with respect to the wind direction and the nearby obstacles [7,9,18,19].
We are witnessing a major shift in climatic conditions globally, which is attributed to global warming. Obviously, it has an impact on dew formation too. Climate change may reduce the rate of precipitation. The rate of precipitation is in most cases indirectly linked with dew yield, and hence, it is most likely that the dew yield might decrease with global warming. A study [20] predicts that, in the Mediterranean region, dew harvesting may decline (up to 27%) by the end of the twenty-first century during the dry season. However, the rate of decrease in the dew yield is comparatively less than the projected 40% decrease in precipitation during the same period. A negative trend in dew and rain has been predicted for the North African area in another recent study [21]. It reports that, for a century, a continuous decrease of the order of 14 mm per decade is expected in rain precipitation, and a clear decrease of up to 7% in the dew yields may be seen. In the SW of the tropical island of Madagascar, the evolutions of dew and rain are similar [22]. One observes an increase from 1991 to 2000, a decrease up to 2020, and a further increase till 2033. The overall trend for the period 1991–2033 is negative for dew and uncertain for rain.
In addition to the studies (maps) reported in the world [7,9,10,11,20,21,22,23,24,25], further efforts have been made to map the dew potential in India [17]. These efforts aim to alleviate water shortages in winter and enhance soil moisture for potential agricultural use. Dew was measured at 62 locations by a visual method (Duvdevani gauge, [25]) for a period of four years (1968–1971). More recent measurements were carried out at six stations in or near Gujarat [26] (see the Table in Section 4.4.3) in the winter (2006–2007). In this paper, it is aimed to prepare dew maps of Gujarat over a large period (17 years, from 2005 to 2021) in order to evaluate the evolution of the dew potential in this state. To compare and contrast, we also included the rain potential in this region to see if the effect of global warming was similar on both dew and rain or if it was different. From both dew and rain volumes, one can deduce the ratio of dew to precipitation, which is an important metric that quantifies the contribution of dew to the overall water resources in a given area. To achieve this objective, two things are required, namely obtaining past weather data that contributes to the dew yield and setting up dew water harvesters to collect real data for comparison with the model’s predictions. If similar condensation units to those reported in [12,13,14,15,16] were set up in various geographical locations, it would be possible to identify regions with a high yield of dew. The authors will finally conclude with the recommendations for regions of high potential for dew so that the state government or industry houses can harvest potable water from dew for drinking purposes [12,14]. This could prove to be a boon in water-scarce regions in the coming years.
The paper is presented as follows. Section 2 describes the Gujarat area of study. Section 3 discusses meteorological data, models, and the description of dew condensers used in this study. Section 4 and Section 6 present kriged maps for dew and rain yields, their temporal correlation, and the ratio for the past and recent data collected. A comprehensive discussion is included in Section 7. It is shown here that the monsoon plays a central role. A glossary with acronyms is given in an Appendix A.
2. Study Area
Gujarat is the fifth largest state in India in area and is located along the western coast, extending between latitude 20°06′ to 24°42′ N and longitude 68°10′ to 74°28′ E. The mean elevation of Gujarat is 137 m asl. The climate of Gujarat [27] is usually characterized by a subtropical steppe climate, according to the Köppen classification, with an average BSh (hot, semi-arid) and local BWh (hot, arid deserts) and BSh/Aw (Aw is tropical climate, see the Tables in Section 3. The mean daily temperature across the year is 29.55 °C. Gujarat receives a yearly mean of 589 mm of precipitation (rain), with 61 rainy days (16.66% of the whole year), which means that the days are usually sunny, and the sky is clear during the night. This allows dew to condense. However, the mean annual rainfall over Gujarat varies widely, from 300 mm in the western part of Kutch to 2100 mm in the southern part of Valsad and the Dangs (towards Mumbai) districts. The monsoon season extends from mid-June to September when the rain happens.
The plains of Gujarat are very hot and dry. Summer is milder on the coast and the hilly regions. The summer daytime temperature is around 46 °C and is no lower than 34 °C at night. The weather is mild and dry in winter. The average temperature during the daytime is 29 °C and 12 °C during the night. Before the monsoon, the temperatures rise, with an increased humidity in the air. It makes the dew season, when the relative humidity is high and the sky is clear, usually extending from October to April. There is no dew during the other monsoon season (June–September). May is a transitory month, with very little dew. In the following, one will, thus, sometimes use the word “yearly” for dew values relative to the October–April dry period, unless specified.
3. Meteorological Data and Methods
3.1. Dew Yield Estimation from Meteorological Data
The dew resource (mm) is investigated using the Beysens energy balance model [28]. This model is based on a balance energy equation between radiative cooling power and heat flux surface—air and latent heat of condensation. The only approximation is concerned with the calculation of the heat flux between the condensing surface and the ambient air, where the surface temperature is assumed to be the dew-point temperature of the air. A comparison with many measurement sites in the world leads to an accuracy within 20–30%, comparable with what is currently obtained with dew condensers at the same place but at different orientations with the zenith and local airflow [7,18,19]. Only a few classical meteorological data are needed for the model to calculate daily or hourly dew yields without adjustable parameters, including air temperature (Ta, in °C), dew-point temperature (Td, in °C), wind speed (V10, in ms−1, at 10 m from the ground), and cloud cover (N, in oktas). The results are shown in terms of the dew yield in mm per unit time ∆t, with , where ∆h, in mm, is the yield during the time period of the analyzed data and ∆t is in hour. The condenser substrate is assumed to be planar, tilted 30° from the horizontal, and thermally insulated from below. Its emissivity is assumed to be unity (which is close to the emissivity ≈ 0.98 of a wet substrate during dew condensation, see [29]). The details of the formulation are as follows:
The data for > 0 correspond to condensation and < 0 to evaporation, which have to be discarded. The measurement period of the data in the present study is ∆t = 0.5, 1, or 3 h, depending on the meteorological stations. The quantity HL of Equation (1) represents the convective heat losses between the air and the condenser. One notes the presence of a cut-off for wind speed V10 > V0 = 4.4 m·s−1, where condensation vanishes:
The quantity RE (measured in units: mm/∆t) is related to the available radiative cooling energy, which depends on the air’s water content (measured by Td, in °C), site elevation H (in km), and cloud cover N (in oktas):
By filtering the data without rain or fog events and integrating the time series on a daily time step corresponding to [ > 0], the calculated daily and monthly yields and their cumulated values can be readily obtained. When comparing the calculated values with the measurements, the agreement is better than 20–30% [24], with the deviation being mainly due to the unavoidable local differences in airflow geometries and the presence of nearby obstacles, as discussed in the Introduction.

Table 1.
Meteorological stations with dew volume statistics (measured, calculated from Equation (2) or extrapolated by kriging). Sum dew: cumulated (integral) dew volume during the dew season (October–April).
Table 1.
Meteorological stations with dew volume statistics (measured, calculated from Equation (2) or extrapolated by kriging). Sum dew: cumulated (integral) dew volume during the dew season (October–April).
| Sites | Start Date | End Date | Abbreviation | Köppen Geiger Climate | Lat. | Long. | Number of Dew Days | Sum Dew (Meas; mm) | Sum Dew (Kriging; mm) | Alt (m) | Distance from the Sea (km) |
|---|---|---|---|---|---|---|---|---|---|---|---|
| Panandhro 1 | 08/10/05 | 17/04/06 | PH | BWh | 23°40′01″ N | 68°46′01″ E | 69 | 11.7 8; 14.2 9 | - | 52 | 39 |
| Kothara 2 | 01/10/04 | 31/05/05 | KO | BWh | 23°13′23″ N | 68°45′00″ E | 72 3; 74 4 | 5.37 3; 7.24 4 | 5.74 | 5 | 21 |
| Mithapur 5 | 10/2006 | 05/2007 | MI | BWh | 22°25′30″ N | 69°01′26″ E | 89 | 4.03 | - | 4 | 2 |
| Suthari 10 | 01/10/05 | 31/05/06 | - | BWh | 23°02’02” N | 68°54’58″ E | - | 4.6 | 3.9 | 37 | 2 |
| DA_IICT, Gandhinagar 6 | 06/12/20 | 31/03/21 | - | BSh/Aw | 23°12′23″ N | 72°38′51″ E | 95 | 4.3 | - | 76 | 15 |
| DA_IICT, Gandhinagar 7 | 09/12/21 | 31/03/21 | - | BSh/Aw | 23°12′23″ N | 72°38′51″ E | 55 | 3.62 | - | 76 | 15 |
| Balva 6 | 22/12/20 | 31/03/21 | - | BSh/Aw | 23°14′35″ N | 72°26′15″ E | 82 | 7.62 | - | 69 | 15 |
| Mehsana 6 | 29/12/20 | 31/03/21 | - | BSh/Aw | 23°34′08″ N | 72°25′12″ E | 19 | 0.88 | - | 90 | 60 |
| Ahmadabad 6 | 14/01/21 | 31/03/21 | - | BSh/Aw | 23°00′16″ N | 72°37′33″ E | 11 | 0.11 | - | 55 | 8 |
| Rajkot 6 | 24/01/21 | 26/04/21 | - | BSh | 22°24′57″ N | 70°47′17″ E | 86 | 3.47 | - | 113 | 12 |
| Porbandar 6 | 25/01/21 | 30/04/21 | - | BSh | 21°38′51″ N | 69°39′40″ E | 92 | 8.24 | - | 4 | 0 |
| Junagadh 6 | 24/01/21 | 30/04/21 | - | BSh | 21°30′46″ N | 70°27′40″ E | 92 | 1.72 | - | 84 | 30 |
| Jamnagar 6 | 25/01/21 | 30/04/21 | - | BSh | 22°31′33″ N | 69°59′05″ E | 89 | 11.98 | - | 5 | 8 |
1 Condensing substrate is 1 m2 thermally isolated OPUR foil [14,30]; 2 condensing substrate is 18 m2 double slope non-isolated galvanized iron roof [16]; 3 roof west side; 4 roof west side; 5 [16]; 6 condensing substrate is 1 m2 transparent LDPE foil (this work; see text); 7 condensing substrate is 1 m2 thermally isolated black foil (this work; see text); 8 oriented east and north; 9 oriented west and south; 10 condensing substrate is 343 m2 double slope oriented east and west of non-isolated galvanized iron roof [12,16].
3.2. Extraction of Meteorological Data
The weather stations used in this study to determine the dew volume according to Equation (1) for kriging correspond to the international or national airports in India (14 stations) and Pakistan (one station) (Table 2). Typical meteorological parameters are systematically measured according to the standards of the World Meteorological Organization [31]. Air temperature (Ta, °C), relative humidity (RH, %), and atmospheric pressure (p, Pa) are measured in a meteorological shelter, 1.5 m from the ground. Wind speed (V, km·h−1, to be transformed into m·s−1 in Equation (1)) and direction (sectors or degrees) are measured at 10 m from the ground. Wind speed can be extrapolated at any height z above the ground by the classical logarithmic variation (see e.g., [32]):
where V10 is the wind speed at 10 m and zc is the roughness length where windspeed goes to zero (generally zc = 0.1 m in flat areas like airports). Available data on 15 sites were extracted from the online database Weather Underground (WU) [33] during the period 2005–2021 (Table 2). Since dew does not form before and during the monsoon cloudy season (June to September), the results presented in this article will, therefore, correspond to only the non-cloudy period, from October to April, unless specified. In order to assess the results of the kriging methods, we also worked with a network of ground stations, where daily dew yields were measured before sunrise at 6 am (Section 3.1, Table 1).

Table 2.
Meteorological sites (15 airports: 14 in India and 1 in Pakistan) where atmospheric data are collected with typical climate and distances from the sea.
It has to be noted that some measurement sites do not present cloud-cover measurements after 2014. For those stations, a dedicated study was made in Section 4.1 to validate the use of a mean cloud cover (N = 1) for those missing data.
Dew yields were computed from Equations (1)–(4) with time period ∆t = 0.5, 1, 3 h, depending upon the sites. The wind directions are computed from the sectors (N, NNE, NE, E, ESE, SE, S, etc.) by using a standard law of proportionality, which is 0° for north and 180° for south. Cloud cover in oktas was computed from the observation of sky cover using the correspondence from the National Weather Service glossary [35]: CLR (clear): N = 0; FEW (few): N = 1; SCT (scattered): N = 3; BKN (broken): N = 5; OVC (overcast): N = 8. The rainfall data, available on a daily time step, are extracted from the National Data Centre, Pune, for 11 cities, including the stations in Gujarat that are reported in Table 1, whose meteorological data are also used for the stations noted in Table 1. For Karachi, New Delhi, Jaipur, and Gwalior, rainfall data (2005–2021) are extracted from the ERA5/ECMWF model [34] using the historical land monthly averaged database from 1950 to the present (see Table 2). The study period is from 2005 to 2021.
3.3. Dew Volume Measurements
The theoretical evaluation of Equation (2) is compared with direct dew volume measurements at several locations in Gujarat for the ground truth and validation by using do-it-yourself planar dew condensers (Figure 2). Our DIY dew condenser, developed based on a study of the literature, has been evaluated to ensure that the materials used meet the relevant standards for dew observation. While DIY methods can sometimes raise questions about accuracy and reliability, we have taken several steps to address these concerns. We conducted a thorough review of existing standards and guidelines for dew observation equipment and carefully selected materials that comply with these requirements. Any potential discrepancies or controversies have been considered, and our findings have been documented to provide transparency and support the credibility of our approach.
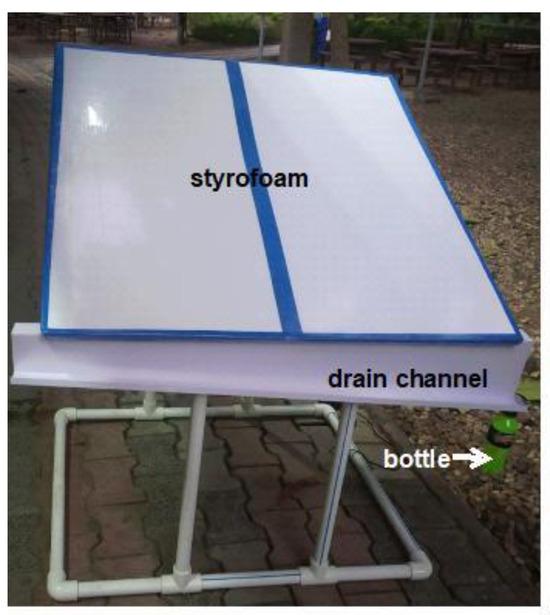
Figure 2.
The DIY dew condenser unit (with transparent polyethylene sheet).
The dew condenser is, thus, composed of three different parts. First, the surface area of the condensing panel is 1 m2. It is inclined at a 30° angle from horizontal at 1.05 m from the ground. The justification for this value is as follows. First, this height has to be above the roughness length where the wind speed becomes zero (typically here 0.1 m). Second, the condenser has to be above the influence of water vapor coming from the ground, called “distillation” [36]), with a length also on the order of 0.1 m. The studies [37,38] show that an angle near 30° is the optimal inclination, as this minimizes the heat-exchange effect caused by wind, while not reducing much radiative cooling and allowing water to be efficiently recovered by gravity. The panel includes the following parts: a condenser sheet, styrofoam, and a cardboard sheet. The condenser sheet is the most important part of the entire dew collector unit. Dew condenses based on the radiative cooling property of the condenser, and water drops slide down due to its wetting properties. Two different materials were used based on their availability on the market. One is a transparent polyethylene sheet, and the other is UV-stabilized black low-density polyethylene foil. Both were kept at DA-IICT ground to check their yield. The black foil has higher radiative cooling and, hence, a somewhat higher dew yield compared to the transparent polyethylene sheet, due mainly to its higher emissivity of ~0.98 [39] versus ~0.87 [7]. The emissivity difference matters only during the early times of condensation, when the surface is mostly dry. Later, surfaces are wet and exhibit the same emissivity close to that of water (0.98) [29].
The condenser is wrapped over a styrofoam sheet for insulation. A single styrofoam sheet of 1 m × 1 m is not available on the market. Therefore, we had to go for two 0.5 m × 1 m sheets and join them using adhesive. The cardboard sheet is used merely as a support over which the styrofoam sheets can be used. The main advantage of using a cardboard sheet is that it is not costly, easily available, and is lightweight. What is observed in this is that the dew water seeps from the hole made for zip ties (used for connecting the panel with the supporting frame), making the cardboard sheet wet. So, this could reduce durability. Therefore, we tried other variations, such as a plywood sheet, a PVC sheet, and a green fiber sheet. However, all of these are good in terms of durability but have their own disadvantages in terms of unnecessary increases in the cost of the collector unit and increased weight. Hence, a cardboard sheet was finalized. A lightweight frame structure was made using easily available low-cost PVC pipe material of 2.5 cm diameter.
Finally, the condensed dew drops slide down by gravity into the drain channel (as shown in Figure 2). The drain channel was made of galvanized iron material. In our initial phase of prototype development, we used it as it is. But over time, we found that it has a corrosion problem, which makes the surface rough and, hence, creates a hindrance to the flow. We decided to paint it to prevent corrosion. The drain channel was designed with a slope on the other end so that the dew water drops that came to this channel from the condenser surface ultimately were collected in a 250 mL bottle at that end. The cap of this bottle was fixed in a leak-free way at this end of the drain channel using an adhesive so that the bottle could be screwed easily into that cap to store the dew water at night. The bottle, later in the morning, could be unscrewed to remove it from the frame for taking the measurement of the daily yield. Dew resting on the condenser surface is not scraped in the morning.
In order to equip observers with a tool to measure the dew volumes, a kit was prepared. The kit includes all the necessary equipment for installation and measurement. A manual was prepared for easy installation. The locations to deploy the dew collector unit were finalized by keeping the following various factors. (i) A person was available at the location to take dew volume readings daily in the morning. A major struggle was faced at this stage, as it was important to find a volunteer who was willing to dedicatedly take the readings daily around 6 am before sunrise (to avoid the effect of evaporation). More so, the period of collecting the ground truth fell during the peak lockdown period of the COVID-19 pandemic. Despite this challenge, the research work continued. (ii) For conveyance, we planned transportation to deploy the dew collector unit at each of the location. Then, the readings were recorded daily by the observer either through a phone call or on a WhatsApp message. This process continued until March 2021. The dew collector units were deployed to eight locations (Table 1), i.e., the Dhirubhai Ambani Institute of Information and Communication Technology (DA-IICT, Gandhinagar), Balva, Mehsana, Ahmedabad, Rajkot, Porbandar, Junagadh, and Jamnagar.
3.4. Kriging Maps
In this study, we utilize geostatistics (kriging) for spatial interpolation to accurately estimate values at unsampled locations and to understand the spatial distribution of the variables of interest. This method offers several advantages in spatial interpolation, making it a powerful tool in geostatistics. One key benefit is its ability to provide accurate predictions at unsampled locations by considering both the distance and the degree of variation between known data points. This results in more reliable and precise spatial estimates compared to other interpolation methods. Additionally, kriging accounts for spatial autocorrelation, meaning it incorporates the inherent spatial relationships within the data, which enhances the accuracy of the interpolated surfaces.
There are many examples where kriging was used to determine spatial distributions, such as groundwater composition [40], dew volume maps integrating projected climate changes in the Mediterranean basin [20], space-time analysis of monthly precipitation in Colombia [41], soil water retention in tropical and temperate climates [42], and rainfall [43,44,45,46,47,48].
Kriging is, basically, a method of spatial interpolation. It allows the value of parameter data at non-sampled sites to be predicted by using the spatial correlation between sampled points to interpolate the values in the spatial field. The interpolation is based on the spatial arrangement of the empirical observations and does not refer to a supposed model of spatial distribution. The method presumes that a spatial correlation exists with the distance or direction between the sample points. The kriging weights are calculated in such a way that points close to the location of interest have more weight than those farther away. The kriging predictor relates a mathematical function to all or certain determined points located within a specific radius and defines the value for each location. The interpolated data are calculated at a specific location from a general formula consisting of a weighted sum of the data [49]:
Here, Z(si) is the measured value at the ith location, s0 is the predicted location, p is the number of the measured data, and λi is a weighing coefficient to determine and relate to the ith location. The weighing coefficients are not only built on the distance between the sampling points and the projection location but also on the spatial organization of the sampling points. The spatial autocorrelation is quantified in order to consider the spatial arrangement in the weighting, making it depend on the distance from the estimated location and the spatial interactions between the values documented around it. A semi-variogram can, thus, be estimated from the point pairs:
where
Here, Card represents the number of elements for the given condition. The projected semi-variograms are fitted by a spherical model already proposed for rainfall spatial estimation [45,46,47,48,49]. When the coordinates of the ground-measured stations (e.g., Kothara or Panandhro) do not correspond exactly to a kriging point, we have considered the nearest grid point to determine the estimated values.
4. Dew Results
This section is structured as follows. First, the maps of key meteorological data for dew formation are presented, with a focus on cloud-cover data, which has been incomplete at several sites since 2014. It will be demonstrated that using a mean value of N = 1 to fill in the missing data is justified. Next, the dew volume maps and their evolution from 2005 to 2021 will be presented, and the values will be compared with existing data, including our own measurements.
4.1. Significant Meteorological Data
As seen in Section 3.2, the important meteorological data that control dew formation are the cloud cover N, windspeed V10, and the difference Td − Ta between the dew-point temperature and the air temperatures. Relative humidity RH is nearly proportional to Td − Ta at constant Ta, with a coefficient that changes only smoothly with Ta [7].
Concerning cloud cover, several measurement sites do not have cloud-cover measurements after 2014. Thus, one separated our study into two sub-periods: 2005–2013 and 2014–2021. For all meteorological airports, the dew yields h were calculated and mapped (Figure 3) from Equations (1) and (2) using either the measured cloud cover (Nmeas) or a constant value (N = 0, 1, 1.5, 1.7). Table 3 also presents the statistical coefficients of the study. From 2005 to 2013, similar statistical parameters are observed for Nmeas (mean: 3.4 ± 2.3 mm; min/max: 0.7/8.4 mm; median: 2.1 mm) or N = 1 (mean: 3.4 ± 2.5 mm; min/max: 1/10.4 mm; median: 2.5 mm). The observed differences remain within the uncertainty of the physical model [28].
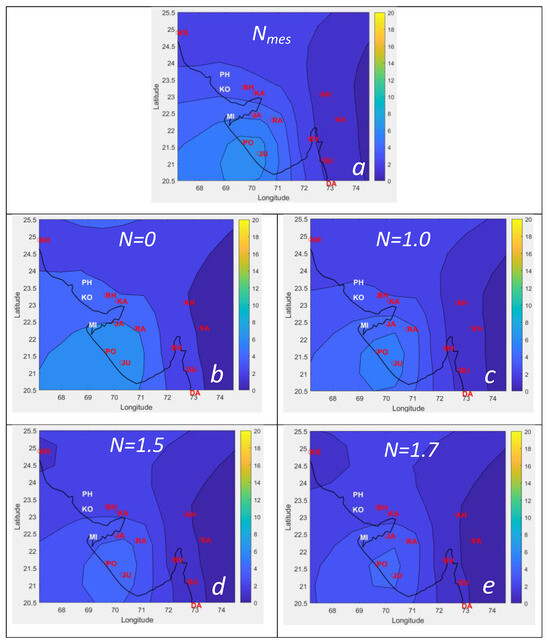

The mean dew volume ratio for the period 2005–2013, ϵ(N) = experiences the following results: = 1.40 ± 0.19; = 0.99 ± 0.18; = 0.83 ± 0.18; = 0.76 ± 0.17. The best comparison is obtained for N = 1.0, as seen in the maps of Figure 3. It leads to the conclusion that, in the period 2005–2013, the kriged map with N = 1 well corresponds to the map calculated with Nmeas. In the following calculations for the period of 2014, we will use a mean value of N = 1 whenever this parameter is missing.
Figure 4 reports the kriged meteorological conditions during the dew condensation periods corresponding to, respectively, RH, the difference Td − Ta between the dew-point temperature, and windspeed V10. One sees that, as expected, the RH and Td − Ta maps are quite similar, with an increase (RH) or decrease (Td − Ta) towards the west. The windspeed decreases towards SSE.
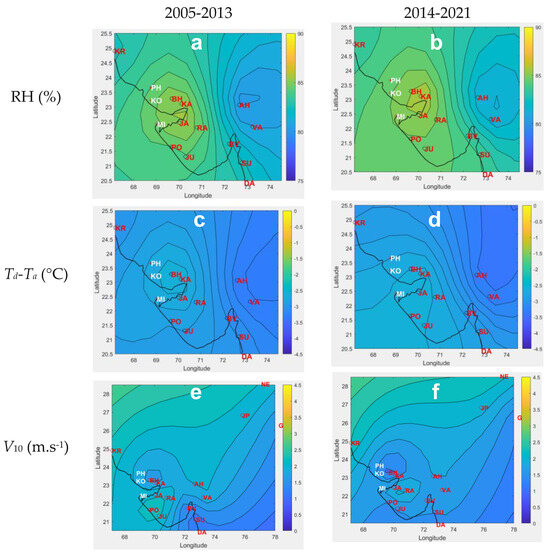
Figure 4.
Kriged map (zoomed on the Gujarat area) during dew condensation for (a,b): RH (%) values; (c,d): Td − Ta (°C); (e,f): V (ms−1). For 2005–2013 N = Nmeas (a,c,e); for 2014–2021: N = 1 imposed (b,d,f). Black circles: Meteorological airport stations for kriging; Panandhro (PH), Kothara (KO), and Mithapur (MI) are sites where dew yields are measured (see text). The other letters refer to the stations (see Table 1 and Table 2).
4.2. Dew Volume Maps
One separates the study into two periods starting from 2005, namely 2005–2013 and 2014–2021. The calculations for 2005–2013 are based on the observed cloud cover at the weather stations extracted from [33]. For 2014–2021, the mean value N = 1 was imposed when missing (see Section 4.1). The maps are shown in Figure 5; they are quite similar, with a rise in the whole period of 2005–2021 with respect to the period 2005–2013. This is also observed in Table 3 where the statistical coefficients are reported. This evolution is analyzed in detail in the next Section 4.3.
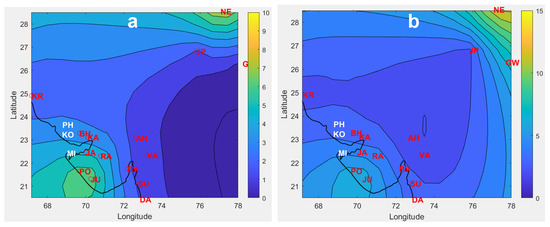
Figure 5.
Kriged map for yearly dew yields (mm). (a) 2005−2013 with Nmeas; (b) 2005−2021 with N = 1 for missing data. Red circles and letters: meteorological airport stations for kriging; white letters: dew measurement sites, Panandhro (PH), Kothara (KO), and Mithapur (MI).
Concerning the spatial distribution of the dew volumes, one observes an increase towards SSW for both periods as a result of the increasing RH towards the west and decreasing windspeed towards SSE (Figure 4). One also notes a dew volume rise towards the NE, due to the weight in the kriging of New Delhi, which exhibits a high dew potential, as well as Jaipur.
4.3. Dew Volume Evolution
In Table 3 are shown the dew yield statistics for two periods, 2005–2013 and 2014–2021, and the entire period 2005–2021. It is seen that there is a rise in the mean values, from 3.4 mm·yr−1 between (2005–2013) to 5.8 mm·yr−1 (2014–2021), with 4.6 mm·yr−1 for the whole period (2005–2021). This rise corresponds to the Figure 5 maps and is more evidently displayed in Figure 6, where the evolution between 2005 and 2021 is directly reported. The increase in dew yield is related to the corresponding (weak) increase in the relative humidity (Figure 4a,b) (2005–2013: mean RH = 83.6%; 2014–2021: mean RH = 84.4%) and the (slight) decrease in the wind regime (Figure 4e,f) (2005–2013: mean V = 1.9 m/s; 2014–2021: mean V = 1.7 m/s).
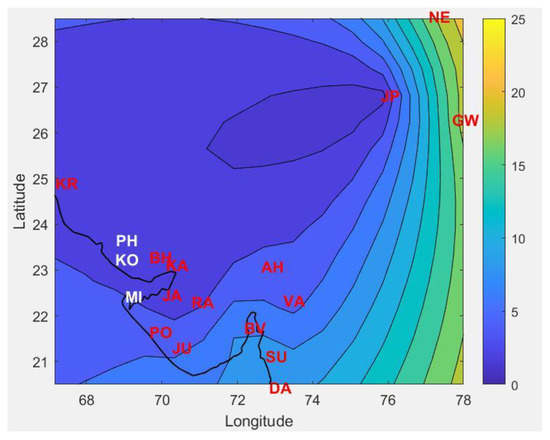
Figure 6.
Dew yield evolution (mm) between 2005 and 2021 (Nmeas if available and N = 1 on 2014–2021 whenever cloud cover is missing). Red letters: meteorological airport stations for kriging; white letters: dew measurement sites Panandhro (PH), Kothara (KO), and Mithapur (MI).
The increase in dew volumes is, nevertheless, heterogeneous when looking at Figure 6. With the exception of the city of Jaipur, where the increase is limited to about 2 mm, the areas of New Delhi and Gwalior show a stronger increase in dew yields (more than 15 mm over the period). These regions are already showing high dew yields; see Figure 5, which will then be reinforced. In the southern part of the region, coastal sites, such as Daman, Surat and Bhavnagar, exhibit yield increases of 5–8 mm over the period. The least advantaged micro-region remains the west coast and the northern part of Gujarat state (from Panandhro to Rajkot), where the increase is limited to a few mm. These regions, however, exhibit the largest yields in the area (see Figure 5). The main changes are, thus, observed on the axis SSW to NE, where only a weak increase is found for the Gujarat regions, such as near Porbandar and Junagadh, and a neat increase in the NE of the domain, near New Delhi.
4.4. Comparison with Direct Measurements
4.4.1. Map of Historical Dew Patterns in India
Raman et al. [17] developed from October 1968 a network of 62 sites to measure dew yields all over India. The method was visual (Duvdevani gauge [25]). A dew map was drawn concerning the dew season October 1969–March 1970. The region of Gujarat is shown in Figure 7a and compared to our data in Figure 7b for the same period corresponding approximately to the dew season, namely October 2005–March 2006. Although our study is 26 years later, it is remarkable that, although the measurement methodologies are different, the repartition is similar, with the largest yields in the S–SW (coastal area) and NE. One, however, notices a different repartition of dew yields in the center of Gujarat. The differences can be attributed to potential changes in land use and/or climate patterns. A detailed study of the difference is nevertheless difficult to estimate because the resolution of the 1968 study is different, and the map was not obtained by kriging. One particularly notices the lack of data in the NW (near the Pakistan border).
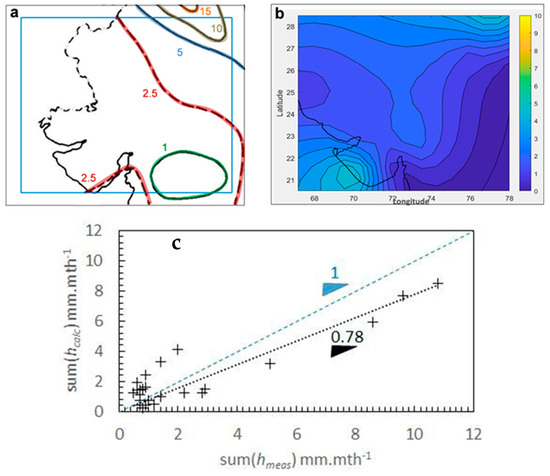
Figure 7.
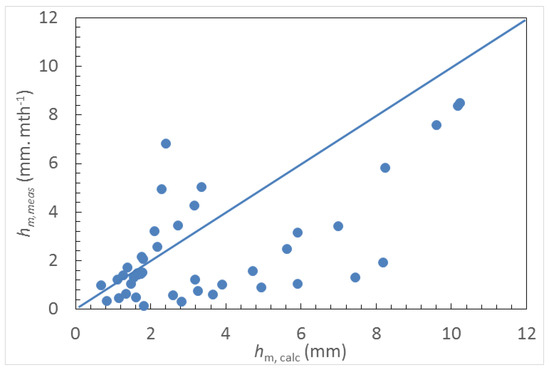
Cumulative dew yields (mm) in the Gujarat area between October and March. (a): Map adapted from [17] (1969−1970). The blue square corresponds to the map for (2005−2006 (this study)) in (b). (c): Cumulative dew yields (mm·mth−1) averaged between 2005 and 2013 (this study) and from the averaged values of New Delhi, Surat, Vadodara/Baroda, and Rajkot during 1969–1970 (data from [17]).
Four stations in [17] also appear in our database, namely, New Delhi, Surat, Vadodara (Baroda), and Rajkot. For the years 1969 and 1970, the dew deposition (mm) averaged at these sites was measured between October and March. Figure 7c compares the mean measured monthly dew yields (mm) versus the mean estimated monthly dew yield obtained in our study between 2005 and 2013. Even though the periods are different, modeled and measured data are in reasonable agreement, as shown by the ratio of time-summed values (integral) sum(hcalc)/sum(hmeas) = 0.78 (R2 = 0.79).
4.4.2. Kutch District
The experiments reported below were carried out between October and May. The May data being found always negligible, the cumulative yields during the period of October–May will be, thus, compared to the calculation performed on the period of October–April.
Between October 2004 and May 2005, Sharan et al. [15] studied dew events and dew yields on a galvanized roof. The condensing device was composed of two inclined surfaces (a total of 18 m2) at Kothara (see Table 1). With about 70 dew days, the cumulative measured dew yields represented, respectively, 5.4 mm and 7.2 mm for the east and the west sides of a non-thermally isolated steel roof (Table 1 and Table 2). Corrections for thermal isolation and use of radiative foil are expected to give a factor of 1.4 [15], corresponding to 7.5 mm (east side) and 10.1 mm (west side). According to the physical model Equation (1) (1 m2, 30° tilt angle, thermally isolated) and the local meteorological data, the expected yield was estimated to be 15 mm for the period [12], a value somewhat larger than the measurements but still within the uncertainties of both the model and the measurements.
During the same period (Figure S1), the dew yield estimated at the closest grid point from the measurement site (11.1 km distance) is 5.7 mm. Hence, the value estimated by kriging lies between the measurement of the east and west sides’ roofs without thermal isolation (5.4 mm and 7.2 mm). The mean meteorological conditions for dew deposition observed in Kothara between 1 October 2004 and 31 May 2005 are = 2.23 ± 1.59 m·s−1, = 91.8 ± 7.9% and = −1.46 ± 1.55 °C. According to kriging, between October 2004 to May 2005, the mean values are = 2.1 m·s−1, = 85.6%, and = −2.53 °C. All values are in fair agreement with the mean measured values.
A roof used as a condenser system (343 m2) was also studied during the period of October 2005–May 2006 at Suthari, 12 km from the above site of Kothara [12,16]. The condensing surface was galvanized iron plates for dew harvesting. The roof presented one slope facing W and the other E, with a tilt angle of 15°, and was not thermally isolated. The dew yield during the period was 4 mm (5.6 mm rescaled with temperature isolation). The corresponding kriging map in the same period (Figure S2) concludes with a close value of 3.9 mm per year for the nearest grid point, 35 km south of Suthari, which is in relatively good agreement with the measured values.
Between October 2006 and May 2007, measurements carried out at Mithapur (Table 1) gave 4.0 mm in total. The kriging process in the same period leads to 3.2 mm. One sees that the measured and calculated Kriging values, although somewhat smaller, agree relatively well within the uncertainties, which can go up to 30% in the model [28], due mainly to the different airflow configurations between the model and the experiments.
4.4.3. Other Data
Other unpublished data have been also reported by G. Sharan [26] in different cities during the dry dew season (October 2006–April 2007). Table 4 summarizes the results, and Figure 8 compares the mean of the calculated data during each month of the dry season, from October to April between 2005 and 2013.

Table 4.
Comparison between Sharan’s dew volume measurements (October 2006−April 2007 [26]) and this study (calculated dew volume averaged between 2005 and 2013), expressed in mm.
4.4.4. Present Study
Between 6 December 2020 and 30 April 2021, dew condensers were implemented in nine sites (see Table 1). The data are compared with a calculation using (i) daily dew yields hdew (mm.day−1) and (ii) number of dewy days tdew (in % of total investigated days) using the physical model Equation (1) with a time step (∆t = 12 h) and assuming N = 1 when the value was missing (see Section 3.1). The monthly (30 days) means are calculated as:
and
Here p represents the number of studied days for each site, which are different according to the measured and calculated sites. The comparison between the estimated (model) and the measured dew yields (mm·mth−1) and dewy days (%) are plotted in Figure 9 and Figure 10.
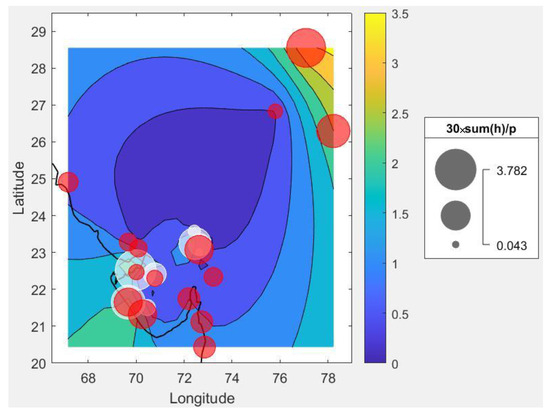
Figure 9.
Monthly dew volume mean (Equation (8); in mm·mth−1) for measured (white circles) and calculated (red circles) sites during the same time period. Mapping data are obtained by the kriging process using the WU database.
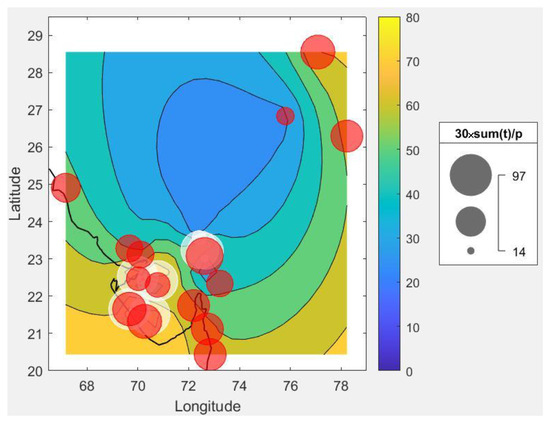
Figure 10.
Monthly dew days fraction (Equation (9); in %) for measured (white bubbles) and calculated (red bubbles) sites. Mapping data are obtained by the kriging process using WU database.
For the nine sites studied, the average monthly yields ranged from 0.043 to 3.782 mm·mth−1 (average = 1.454 mm·mth−1). The Balva and Gandhinagar sites (monthly mean 2.3 mm·mth−1, 83% of dewy days, OPUR white foil substrate) show the highest correlation with estimates obtained from Ahmedabad airport (1.8 mm·mth−1, 80% of dewy days, WU database). The other sites show fair correlations (Porbandar, measured 2.6 mm·mth−1 vs. 1.8 mm·mth−1 estimated). Some sites (Junagadh) overestimate the dew production (1.8 mm·mth−1 measured vs. 0.5 mm·mth−1 calculated), and others like Jamnagar underestimate this production (3.7 mm·mth−1 measured vs. 0.5 mm·mth−1 estimated). The main reasons for these differences are due to the fact that (i) the remaining dew in the morning was not scraped in the measurements, thus somewhat underestimating the experimental values and lowering the number of dew days and (ii), in contrast, the estimated number of dew days can be lower than the actual measurement. For instance, for Rajkot, Porbandar, Junagadh, and Jamnagar, the measured dew day percentages are between 93 and 97%, when the model estimates these rates to be between 42 and 70%. This difference is mainly due to the fact that meteorological data are not taken at the measurement site itself. Local variations of, e.g., RH and air flows can lead to substantial variations in the measured dew yield.
5. Rain Results
Except for a few cities where rainfall data are extracted from the ERA Copernicus database [34] (see Table 2), rain yield (mm) data were obtained from the Indian National Meteorological Network’s National Data Centre, Pune, on a daily time-step. These data are integrated on monthly and yearly bases (mm·mth−1, mm·yr−1) in order to compare the dew yields.
Figure 11a describes the rainfall profile for the Gujarat district during the dry season (October to April). Here we find a decreasing axis of rainfall between the NE and SSW of the region. The coastal area of the Arabian Sea is poorly supplied with rain, with less than 50 mm·yr−1, while cities located further from the coast, such as New Delhi or Jaipur, benefit from rainfall amounts that can reach 100 or even 150 mm·yr−1. The evolution of rainfall between 2005 and 2021 (Figure 11b) shows an average increase during the dry season. One notes an area around Ahmadabad where the amount of rainfall has not changed. Moving away by concentric circles from this area, the measurements show an increase in rainfall in the 15-year period, with variations that can reach 100 mm specifically in the coastal regions of Junagadh, Surat, and Daman but also inland, near New Delhi.
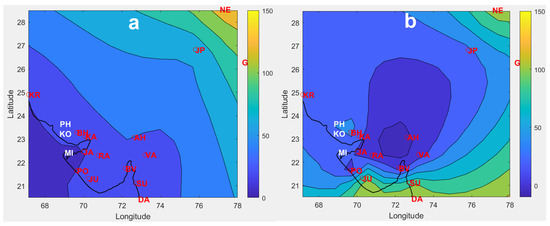
Figure 11.
(a) Mean yearly rainfall (mm) of 2005–2021 dry season (October–April, with zoom on the Gujarat area). (b) Variation of yearly rainfall (mm) between 2021 and 2005 dry season (October–April, with zoom on the Gujarat area).
6. Dew–Rain Correlations
6.1. Correlation in Dew and Rain Evolutions
One shows in Figure 12 the cumulative dew and rainfall volume evolutions. Choosing cumulative values smooths out the data scatter and makes trends more visible. One, thus, observes in Figure 12 that dew and rain volumes obey a generally similar behavior. One notes a near-constant rise between 2005 and 2017 and an acceleration later, from 2018 to 2021. One observes quite generally that, during the years where rain is abundant, the dew production does not increase. This is because dew formation is related to relative humidity, which does not come from rainfall. Dew occurs during the dry season, disconnected from and not correlated to the monsoon rainy season.
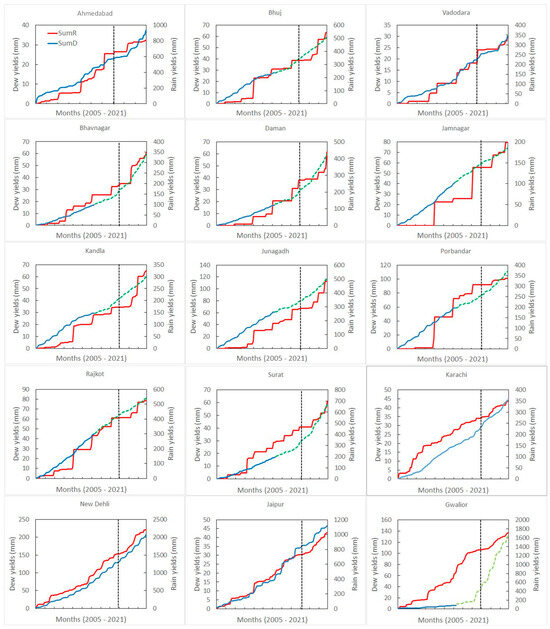
Figure 12.
Evolution of the summed values sum(hdew) (dew; full blue line for Nmeas and interrupted green line for imposed N = 1) and sum(hrain) (rain, mm, full red line) for the studied sites. The unit of dew and rain (ordinate) is mm. The abscissa is month, from 2005 to 2021. Year 2018 is indicated by a black vertical interrupted line.
Concerning specifically dew, a good example is New Delhi, where the mean dew rate between 2005 and 2017 was 1.44 mm·mth−1 and, from 2018 to 2021, 2.44 mm·mth−1. There are some exceptions, like Rajkot, where the acceleration is not observed, with the mean dew rate for 2005–2017 being 0.71 mm·mth−1 and the mean dew rate for 2018–2021 being 0.57 mm·mth−1. For 2005–2017, the monthly rates vary from 0.25 mm·mth−1 (Ahmedabad) to 1.44 mm·mth−1 (New Delhi), with the mean = 0.54 mm·mth−1. The acceleration during recent years (2018–2021) can be considered to be moderate for sites like, e.g., Ahmedabad– Vadodara (0.25 to 0.49 mm·mth−1), Bhuj (N = 1 assumed, 0.44 to 0.64 mm·mth−1), Kandla (N = 1 assumed, 0.46 to 0.61 mm·mth−1), or Karachi (0.32 to 0.48 mm·mth−1). It is much more obvious for sites like New Delhi (1.44 to 2.44 mm·mth−1), Gwalior (N = 1, 0.45 to 3.11 mm·mth−1), and Surat–Bhavnagar (N = 1, 0.33 to 1 mm·mth−1).
Concerning rain, the general trend is the same as dew. While most sites behave as with dew, with an acceleration after 2015–2017, some sites remain stable (Rajkot and Gwalior). One notes that some sites have undergone a decrease in rainfall since 2015, such as Karachi, Porbandar, Vadodara, and Ahmedabad.
6.2. Ratio of Dew and Rain Volume Contributions
The ratio of dew to precipitation volumes is an important metric that quantifies the contribution of dew to the overall water resources in a given area. By comparing the amount of water obtained from dew to the total amount from precipitation, one can better understand the significance of dew in the hydrological cycle. This ratio is particularly relevant in arid and semi-arid regions, where precipitation is limited. In these areas, even small amount of dew can provide crucial moisture for plants, soil, and small water bodies, supporting vegetation and agricultural activities during dry periods. Understanding and quantifying this ratio, thus, help in appreciating the role of dew as a supplementary water resource.
The ratio of dew to precipitation volumes is measured by the ratio of summed dew and rain volumes during the dry seasons of the period. Figure 13 presents the mean ratios at the different sites. The ratio varies between 4.5% (Jaipur) or 4.6% (Ahmedabad) to 37.2% (Jamnagar) or 32.8% (Porbandar). The high ratios combine large dew and low rain volumes and correspond to coastal sites, while, in contrast, the low ratios correspond to low dew and high rain volumes and are more inland.
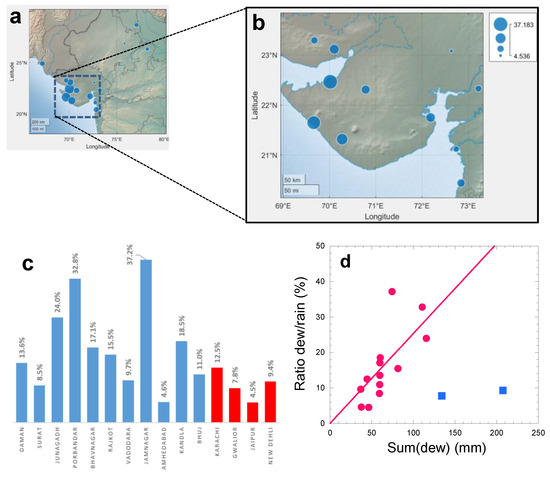
Figure 13.
Dew/rain ratio = sum (D)/sum (R) (%) from cumulative yields for dew (sum (D)) and rain (sum (R)) during the dry seasons of the period. (a) Location of the sites with (b) a zoom in the Kutch area. Blue circles centered on measurement sites have radius proportional to the dew/rain ratio. (c) Values. Red data are from ERA5 [34] and blue data from the Indian national meteorological network (National Data Centre, Pune). (d) Correlation between the dew–rain volume ratios (%) and the dew volume (mm) summed between 2005 and 2021. The line with slope (0.25 ± 0.03) mm−1 is a fit for all data without New Delhi and Gwalior (NNE and NE inland, blue squares), where rain is abundant.
It is interesting to compare the dew–rain volume ratios with the amount of dew volumes accumulated during the period (Figure 13c). A strong correlation is found between the dew–rain volume ratio and dew volumes, except for the two cities New Delhi, inland NNE, and Gwalior, inland NE, where rain is more abundant, thus lowering the ratio. In general, a high ratio also indicates abundant dew.
7. Discussion
In the following, one addresses the main parameters that affect dew formation and rainfall and their evolution in the context of global change. High relative humidity, which precedes and follows the monsoon, appears to be a key factor in dew formation.
7.1. Dew and Relative Humidity
The general findings of the present study are primarily concerned with the fact that dew occurs very regularly while precipitation is weak, unreliable, and irregular in the months outside the rainy monsoon season. Dew forms thanks to efficient radiative cooling on clear and calm nights, as long as the relative humidity of the atmosphere is high enough. Relative humidity is a key parameter. In the time period where dew forms (October–April), nevertheless, a close correlation is found between the areas of high relative humidity and the regions of large dew yield (coastal areas of Gujarat, see Figure 4). This correlation is quite general and is due to the fact that the radiative deficit cannot cool a surface open to air more than a few degrees below the surrounding air temperature. It is within these few degrees of cooling that the dew point has to be crossed for condensation to occur, which gives a lower limit for the relative humidity of about 70–80% for dew condensation [7].
7.2. Dew and Monsoon Interactions
The water resources in India are mostly ruled by the presence of the monsoon. The monsoon, indeed, particularly affects India and its surrounding seas. The wind blows from the NE during the cooler months of the year and reverses direction to blow from the SW during the warmest months. This process brings large rainfalls to the region during June and July and, to a lesser extent, August and September. Gujarat, however, often experiences erratic monsoon behavior, with some years receiving abundant rainfall and others facing droughts. El Niño–Southern Oscillation cycles tend to weaken the Indian monsoon, leading to reduced rainfall in Gujarat and other parts of India. Conversely, La Niña can enhance monsoon rains.
The monsoon is preceded and followed by a high atmospheric humidity [15], which is needed for dew to form (see Section 7.1 above). The presence of relative humidity and then of dew is correlated with the occurrence of the monsoon rains. It results that the future climatic variation in rainfall should induce the same variation trend for dew. It is also anticipated that the amplitude and evolution of the dew and rain precipitations can be generalized to other places in the world where the monsoon is present.
The water resources from dew, although small in amplitude, are nevertheless able to provide an important and reliable contribution during the dry season, up to 37% of the rain precipitation (Figure 13). This is a quite general result [28], not only observed in the regions of monsoon [48,50,51,52] but most generally in other areas of the world during the dry seasons [7]. Dew, therefore, provides, in general, a reliable and regular additional moisture resource for plants and also humans if proper collectors are set up.
7.3. Evolution and Tendencies for Future Years
One of the major results of this study, in addition to assessing the important role of dew in giving moisture during the dry season, is to detect an increase in dew and rain resources during the 2005–2021 period. This increase, also observed in South Africa for dew only [53], contrasts with what is observed in other regions of the world where dew and rain volumes are seen to decrease [7,20,21,23,24], an effect attributed to climate change. As a matter of fact, significant trends were found in calculated dew yields during the time period of 1979–2012 [24]. The trends were positive and negative, with values evolving in the range of ±15%. In particular, in agreement with the present study, a dew yield increase was found in the equatorial monsoon region [9] and, notably, in Madagascar [22].
The continuous increase in rainfall, which is observed during the period 2005–2021, can also be attributed to climate change [54]. This trend was similarly observed for the seasonal monsoon rain in Southeast Asia, accompanied by an increase in the variability of rainfall [55]. However, it remains very challenging to understand the situation as many parameters are present, such as the persistence of intense La Nina conditions, abnormal warming of the East Indian Ocean, negative Indian Ocean Dipole, southward movement of most of the monsoon depressions and lows, and pre-monsoon heating over the Himalayan region that is melting glaciers. Generally speaking, climate change is contributing to more extreme weather patterns, including more intense but less frequent rainfall events. In addition, rising temperatures can lead to increased evaporation rates, reducing soil moisture and water availability even during periods of adequate rainfall.
According to the climate scenarios, this trend for rain (increase of variability and amplitude) should then continue in the future years. Due to the increase in relative humidity induced by the monsoon rains’ enhancement, one expects the same trend for dew (volume increase) to continue in the future. Further works should refine this point by extracting, as it was conducted for the Mediterranean basin [20] and Northwest Africa [21], the meteorological data for the years up to 2100 from the low and high emissions representative concentration pathway scenarios (e.g., low global warming RCP 2.6 and high global warming RCP 8.5). These data allow for dew and rain yields to be estimated with more exactness.
This trend has important implications for water resource management. Given the erratic nature of rainfall, water scarcity is a major concern. Effective drought management strategies are essential, such as rainwater harvesting. As underlined in Section 6.2 above, the water resources from dew can provide a weak but reliable contribution during the dry season. One notes that the development of the infrastructure (reservoirs, canals, and pipelines) would be crucial to ensure water availability during dry periods, as well as modernizing irrigation systems to reduce water wastage. Shifting to climate-resilient agricultural practices can help mitigate the impacts of irregular rainfall. Strengthening policies and regulatory frameworks to enforce sustainable water usage and protect water resources is necessary for long-term water security.
8. Conclusions
The contribution of dew to the water balance was investigated in this work during the dry seasons of the past 17 years between 2005 and 2021. In addition to dry seasons, this contribution is considered as a potential in dry areas. It is seen that dew forms only during the dry season (October to April). By using classical meteorological data, one has determined from an energy-based model the dew potential at 15 airports (14 in India and 1 in Pakistan). This water resource was mapped over Gujarat by using a kriging process.
One observes high dew potential with low rain on the coast of the Arabian Sea. The situation is inversed for the inland sites, where the dew volume is less but the rain yield is greater. Interestingly, an overall increase in dew water volume over the whole area is observed during the period, with acceleration after 2015. This increase is, however, heterogeneous. With the exception of the city of Jaipur, where the increase is limited to about 2 mm, the areas of New Delhi and Gwalior show a stronger increase in yields (more than 15 mm). According to the site, the dew–rain volume ratios can represent between 4.5% (Jaipur) and 37.2% (Jamnagar) over the whole period of 17 years.
Concerning rain, one observes an increase from SW to NE. The general trend for evolution in the period is the same as dew, with an overall increase in volume, which accelerates after the years 2015–2017. However, while most sites behave as dew, with acceleration after 2015–2017, some sites remain stable (Rajkot and Gwalior). One even notes that some sites have undergone a decrease in rainfall since 2015, such as Karachi, Porbandar, Vadodara, and Ahmedabad.
Our work has some practical implications. In addition to giving in Gujarat the locations where dew is abundant and can be used for farming and drinking, it shows that the dew and rain characteristics are related to the presence of the monsoon and, thus, could be generalized to all areas around the equator where the monsoon is present. In particular, the observed increase in dew and precipitation volumes is a rather rare evolution in the context of global warming. This evolution, which has been observed since 2005 and has accelerated since 2015, is likely to continue in the future. The use of climate models should give more precise information for future trends until the end of the century and should be used for further investigation.
Supplementary Materials
The following supporting information can be downloaded at https://www.mdpi.com/article/10.3390/atmos15080989/s1. Figure S1: Kriging map of yearly dew yields (mm) in 2004–2005 (October to April). The letters refer to the stations (see Table 1 and Table 2); Figure S2: Kriging map of yearly dew yields (mm) in 2005–2006 (October to April). The city of Suthari is located with an arrow. The letters refer to the stations (see Table 1 and Table 2).
Author Contributions
Conceptualization, D.B. and A.K.R.; Data curation, M.M. and D.B.; Formal analysis, M.M. and D.B.; Funding acquisition, A.K.R.; Investigation, R.B. and A.K.R.; Methodology, A.K.R., D.B. and M.M.; Supervision, D.B.; Writing—original draft, M.M. and D.B.; Writing—review & editing, M.M., D.B., A.K.R. and R.B. All authors have read and agreed to the published version of the manuscript.
Funding
Climate Change Department, Government of Gujarat (India).
Institutional Review Board Statement
Not applicable.
Informed Consent Statement
Not applicable.
Data Availability Statement
The data presented in this study are available on request from the corresponding authors. The data are not publicly available due to privacy reasons.
Acknowledgments
We gratefully acknowledge the financial support of the Climate Change Department, Government of Gujarat (India), and NDC (Pune) for providing us with data.
Conflicts of Interest
The authors declare no conflicts of interest.
Appendix A. Glossary and Acronyms
| Latin Symbols | Units | Definition |
| L m−2 h−1 or mm h−1 | dew volumic rate per unit surface area rate during ∆t | |
| m s−1 | windspeed at 10 m above the ground | |
| m s−1 | windspeed at z above the ground | |
| ∆h | L m−2 or mm | dew volume per unit surface area per time ∆t |
| ∆t | hour h. | measurement period |
| Card | number of elements | |
| COVID-19 | COronaVIrus Disease of 2019 | |
| DA-IICT | Dhirubhai Ambani Institute of Information and Communication Technology | |
| h | L m−2 or mm | dew volume per unit surface area |
| H | km | site elevation |
| L m−2 h−1 or mm h−1 | convective heat losses air/condenser | |
| LDPE | low density polyethylene | |
| N | okta | cloud cover |
| p | number of measured data | |
| p | number of studied days | |
| PVC | polyvinyl chloride | |
| L m−2 h−1 or mm h−1 | radiative cooling energy | |
| S0 | m | predicted location |
| sum (value) | value unit × time unit | time cumulated values (integral) |
| t | hour h., days d., month mth., year yr. | time |
| tdew | % | fraction of dew days |
| Ta | °C | air temperature |
| Td | °C | dew point temperature |
| tdew | number of dewy days | |
| UV | Ultraviolet | |
| V10 | m s−1 | wind speed at 10 m elevation |
| WHO | World Health Organization | |
| WU | Weather Underground | |
| z | m | height above the ground |
| Z(si) | value unit | measured value at the ith location |
| zc | m | roughness length where V = 0 |
| Greek symbols | Units | Definition |
| semi-variogram | ||
| ϵ(N) | mean dew ratio | |
| λi | weighing coefficient |
References
- Mekonnen, M.M.; Hoekstra, A.Y. Four billion people facing severe water scarcity. Sci. Adv. 2016, 2, e1500323. [Google Scholar] [CrossRef]
- Kuzma, S.; Bierkens, M.F.P.; Lakshman, S.; Luo, T.; Saccoccia, L.; Sutanudjaja, E.H.; Van Beek, R. Aqueduct 4.0: Updated Decision-Relevant Global Water Risk Indicators; World Resources Institute: Washington, DC, USA, 2023. [Google Scholar] [CrossRef]
- Guo, Y.; Yuan, B.; Su, A.; Shao, C.; Gao, Y. Calibration for Improving the Medium-Range Soil Temperature Forecast of a Semiarid Region over Tibet: A Case Study. Atmosphere 2024, 15, 591. [Google Scholar] [CrossRef]
- Santanello, J.A., Jr.; Dirmeyer, P.A.; Ferguson, C.R.; Findell, K.L.; Tawfik, A.B.; Berg, A.; Ek, M.; Gentine, P.; Guillod, B.P.; Van Heerwaarden, C.; et al. Land–atmosphere interactions: The LoCo perspective. Bull. American Meteorol. Soc. 2018, 99, 1253–1272. [Google Scholar] [CrossRef]
- Ali, H.; Fowler, H.J.; Mishra, V. Global observational evidence of strong linkage between dew point temperature and precipitation extremes. Geophys. Res. Lett. 2018, 45, 12–320. [Google Scholar] [CrossRef]
- Guo, Y.; Shao, C.; Su, A. Comparative Evaluation of Rainfall Forecasts during the Summer of 2020 over Central East China. Atmosphere 2023, 14, 992. [Google Scholar] [CrossRef]
- Beysens, D. Dew Water; River Publishers: Gistrup, Denmark, 2018. [Google Scholar]
- Kidron, G.J.; Kronenfeld, R.; Starinsky, A.; Xiao, B.; Muselli, M.; Beysens, D. Even in a dew desert: Dewfall does not provide sufficient moisture for biocrust growth–Evidence from direct measurements and a meteorological model. J. Hydrol. 2023, 627, 130450. [Google Scholar] [CrossRef]
- Vuollekoski, H.; Vogt, M.; Sinclair, V.A.; Duplissy, J.; Järvinen, H.; Kyrö, E.M.; Makkonen, R.; Petäjä, T.; Prisle, N.L.; Räisänen, P.; et al. Estimates of global dew collection potential on artificial surfaces. Hydrol. Earth Syst. Sci. 2015, 19, 601–613. [Google Scholar] [CrossRef]
- Valjarević, A.; Filipović, D.; Valjarević, D.; Milanović, M.; Milošević, S.; Živić, N.; Lukić, T. GIS and remote sensing techniques for the estimation of dew volume in the Republic of Serbia. Meteorol. Appl. 2020, 27, e1930. [Google Scholar] [CrossRef]
- Valjarević, A.; Milanović, M.; Valjarević, D.; Basarin, B.; Gribb, W.; Lukić, T. Geographical information systems and remote sensing methods in the estimation of potential dew volume and its utilization in the United Arab Emirates. Arab. J. Geosci. 2021, 14, 1–15. [Google Scholar] [CrossRef]
- Sharan, G. Harvesting dew with radiation cooled condenser to supplement drinking water supply in semi-arid north-west India. Int. J. Serv. Learn. Eng. (IJSLE) 2011, 6, 132–152. [Google Scholar]
- Sharan, G.; Clus, O.; Singh, S.; Muselli, M.; Beysens, D. Very large dew and rain collector in the Kutch area (Gujarat, India). J. Hydrol. 2011, 405, 171–181. [Google Scholar] [CrossRef]
- Sharan, G.; Roy, A.K.; Royon, L.; Mongruel, A.; Beysens, D. Dew plant for bottling water. J. Cleaner Prod. 2017, 155, 83–92. [Google Scholar] [CrossRef]
- Sharan, G.; Beysens, D.; Milimouk-Melnytchouk, I. A study of dew water yields on Galvanized iron roofs in Kothara (North-West India). J. Arid Environ. 2007, 69, 259–269. [Google Scholar] [CrossRef]
- Sharan, G.; Shah, R.; Milimouk-Melnytchouk, I.; Beysens, D. Roofs as dew collectors: I. Corrugated galvanized iron roofs in Kothara and Suthari (NW India). In Proceedings of the 4th Conference on Fog, Fog Collection and Dew, La Serena, Chile, 23–27 July 2007; p. 301. [Google Scholar]
- Raman, C.R.V.; Venkataraman, S.; Krishnamurthy, V. Dew over India and its contribution to winter-crop water balance. Agric. Meteo. 1973, 11, 17–35. [Google Scholar] [CrossRef]
- Lekouch, I.; Lekouch, K.; Muselli, M.; Mongruel, A.; Kabbachi, B.; Beysens, D. Rooftop dew, fog and rain collection in southwest Morocco and predictive dew modeling using neural networks. J. Hydrol 2012, 448–449, 60–72. [Google Scholar] [CrossRef]
- Tuure, J.; Korpela, A.; Hautala, M.; Hakojärvi, M.; Mikkola, H.; Räsänen, M.; Duplissy, J.; Pellikka, P.; Petäjä, T.; Kulmala, M.; et al. Comparison of surface foil materials and dew collectors location in an arid area: A one-year field experiment in Kenya. Agric. Forest Meteorol. 2019, 276, 107613. [Google Scholar] [CrossRef]
- Tomaszkiewicz, M. Abou Najma, M.; Beysens, D.; Alameddine, L.; Bou Zeid, E.; El-Fadel. M. Projected climate change impacts upon dew yield in the Mediterranean basin. Sci. Total Environ 2016, 566–567, 1339–1348. [Google Scholar]
- Muselli, M.; Lekouch, I.; Beysens, D. Physical and Chemical Characteristics of Dew and Rain in North-West Africa with Focus on Morocco: Mapping Past and Future Evolution (2005–2100). Atmosphere 2022, 13, 1974. [Google Scholar] [CrossRef]
- Rasoafaniry, A.; Muselli, M.; Beysens, D. Climate Change and Dew and Rain Evolution in Semi-arid South-Western Madagascar between 1991 and 2033 (Extrapolated). Atmosphere 2024, 15, 784. [Google Scholar] [CrossRef]
- Atashi, N.; Rahimi, D.; Goortani, B.M.; Duplissy, J.; Vuollekoski, H.; Kulmala, M.; Vesala, T.; Hussein, T. Spatial and temporal investigation of dew potential based on long-term model simulations in Iran. Water 2019, 11, 2463. [Google Scholar] [CrossRef]
- Atashi, N.; Rahimi, D.; Al Kuisi, M.; Jiries, A.; Vuollekoski, H.; Kulmala, M.; Vesala, T.; Hussein, T. Modeling long-term temporal variation of dew formation in Jordan and its link to climate change. Water 2020, 12, 2186. [Google Scholar] [CrossRef]
- Duvdevani, S. An optical method of dew estimation. Q. J. R. Meteorol. Soc. 1947, 73, 282–286. [Google Scholar] [CrossRef]
- Sharan, G. Private communication. 2007. [Google Scholar]
- Weather and Climate. 2023. Available online: https://tcktcktck.org/india/gujarat#::text=Gujarat%20Cli-mate%20Summary,3.98%25%20higher%20than%20India’s%20averages (accessed on 1 April 2023).
- Beysens, D. Estimating dew yield worldwide from a few meteo data. Atmos. Res. 2016, 167, 146–155. [Google Scholar] [CrossRef]
- Trosseille, J.; Mongruel, A.; Royon, L.; Beysens, D. Effective surface emissivity during dew water condensation. Int. J. Heat Mass Transf. 2022, 183, 122078. [Google Scholar] [CrossRef]
- Available online: https://www.opur.cloud/ (accessed on 21 July 2024).
- World Meteorological Organization. 2024. Available online: https://wmo.int/about-us/governance/technical-commissions/standards-and-recommended-practices (accessed on 19 July 2024).
- Pal Arya, S. Introduction to Micrometeorology; Academic Press: San Diego, CA, USA, 1988; 307p. [Google Scholar]
- Weather Underground Database. 2022. Available online: https://www.wunderground.com (accessed on 13 February 2021).
- ERA/ECMWS Copernicus Database. Available online: https://cds.climate.copernicus.eu/cdsapp#!/dataset/reanalysis-era5-single-levels?tab=overview (accessed on 4 February 2021).
- NOAA. 2022. Available online: https://forecast.weather.gov/glossary.php (accessed on 13 February 2021).
- Monteith, J.L. Dew. Q. J. R. Meteorol. Soc. 1957, 83, 322–341. [Google Scholar] [CrossRef]
- Beysens, D.; Milimouk, I.; Nikolayev, V.; Muselli, M.; Marcillat, J. Using radiative cooling to condense atmospheric vapor: A study to improve water yield. J. Hydrol. 2003, 276, 1–11. [Google Scholar] [CrossRef]
- Howell, J.C.; Yizhaq, T.; Drechsler, N.; Zamir, Y.; Beysens, D.; Shaw, J.A. Generalized Nighttime Radiative Deficits. J. Hydrol. 2021, 603, 126971. [Google Scholar] [CrossRef]
- Maestre-Valero, J.F.; Ragab, R.; Martınez-Alvarez, V.; Baille, A. Estimation of dew yield from radiative condensers by means of an energy balance model. J. Hydrol 2012, 460–461, 103–109. [Google Scholar] [CrossRef]
- Belkiri, L.; Tiri, A.; Mouni, L. Spatial distribution of the groundwater quality using Kriging and Co-Kriging interpolations. Ground W. Sustain. Dev 2020, 11, 100473. [Google Scholar] [CrossRef]
- Martinez, W.A.; Melo, C.E.; Melo, O.O. Median Polish Kriging for space–time analysis of precipitation. Spat. Stat. 2017, 19, 1–20. [Google Scholar] [CrossRef]
- Pue, J.D.; Botula, Y.D.; Nguyen, P.M.; Meirvenne, M.V.; Cornelis, W.M. Introducing a Kriging-based Gaussian Process approach in pedotransfer functions: Evaluation for the prediction of soil water retention with temperate and tropical datasets. J. Hydrol. 2021, 597, 125770. [Google Scholar] [CrossRef]
- Amani, A.; Lebel, T. Lagrangian Kriging for the estimation of Sahelian rainfall at small time steps. J. Hydrol. 1997, 192, 125–157. [Google Scholar] [CrossRef]
- Lima, C.H.R.; Kwon, H.H.; Kim, Y.T. A Bayesian Kriging model applied for spatial downscaling of daily rainfall from GCMs. J. Hydrol. 2021, 597, 126095. [Google Scholar] [CrossRef]
- Bargaoui, Z.; Chebbi, A. Comparison of two Kriging interpolation methods applied to spatiotem-poral rainfall. J. Hydrol. 2009, 365, 56–73. [Google Scholar] [CrossRef]
- Lepioufle, J.M.; Leblois, E.; Creutin, J.D. Variography of rainfall accumulation in presence of advection. J. Hydrol 2012, 464–465, 494–504. [Google Scholar] [CrossRef]
- Van de Beek, C.Z.; Leijnse, H.; Torfs, P.J.J.F.; Uijlenhoet, R. Seasonal semi-variance of Dutch rainfall at hourly to daily scales. Adv. Water Resour. 2012, 45, 76–85. [Google Scholar] [CrossRef]
- Rahmawati, N. Space-time variogram for daily rainfall estimates using rain gauges and satellite data in mountainous tropical Island of Bali, Indonesia (Preliminary Study). J. Hydrol. 2020, 590, 125177. [Google Scholar] [CrossRef]
- Goovaerts, P. Geostatistics for Natural Resources Evaluation; Oxford University Press: New York, NY, USA, 1997; 500p. [Google Scholar]
- He, S.; Richards, K. The role of dew in the monsoon season assessed via stable isotopes in an alpine meadow in Northern Tibet. Atmos. Res. 2015, 151, 101–109. [Google Scholar] [CrossRef]
- Wenguang, Z.; Jingyi, M.; Bo, L.; Shichun, Z.; Jing, Z.; Ming, J.; Xianguo, L. Sources of monsoon precipitation and dew assessed in a semiarid area via stable isotopes. Hydrol. Proc. 2017, 31, 1990–1999. [Google Scholar] [CrossRef]
- Yang, K.; Guyennon, N.; Ouyang, L.; Tian, L.; Tartari, G.; Salerno, F. Impact of summer monsoon on the elevation-dependence of meteorological variables in the south of central Himalaya. Int. J. Clim. 2018, 38, 1748–1759. [Google Scholar] [CrossRef]
- Muselli, M.; Beysens, D. Mapping past, present and future dew and rain water resources for biocrust evolution in southern Africa. J. Hydrol. Hydromech. 2021, 69, 400–420. [Google Scholar] [CrossRef]
- Lal, M. Global climate change: India’s monsoon and its variability. J. Environ. Stud. Policy 2003, 6, 1–34. [Google Scholar]
- Loo, Y.Y.; Billa, L.; Singh, A. Effect of climate change on seasonal monsoon in Asia and its impact on the variability of monsoon rainfall in Southeast Asia. Geosci. Front. 2015, 6, 817–823. [Google Scholar] [CrossRef]
Disclaimer/Publisher’s Note: The statements, opinions and data contained in all publications are solely those of the individual author(s) and contributor(s) and not of MDPI and/or the editor(s). MDPI and/or the editor(s) disclaim responsibility for any injury to people or property resulting from any ideas, methods, instructions or products referred to in the content. |
© 2024 by the authors. Licensee MDPI, Basel, Switzerland. This article is an open access article distributed under the terms and conditions of the Creative Commons Attribution (CC BY) license (https://creativecommons.org/licenses/by/4.0/).
