Article

An Analysis of the Instability Conditions and Water Vapor Transport Characteristics during a Typical Rainstorm in the Tarim Basin

1
College of Geography and Remote Sensing Sciences, Xinjiang University, Urumqi 830002, China
2
Institute of Desert Meteorology, China Meteorological Administration, Urumqi 830002, China
3
Jinzhou Meteorological Bureau, Jinzhou 121000, China
4
Taklimakan Desert Meteorology Field Experiment Station of China Meteorological Administration, Urumqi 830002, China
5
Xinjiang Key Laboratory of Desert Meteorology and Sandstorm, Urumqi 830002, China
6
Collaborative Innovation Center on Forecast and Evaluation of Meteorological Disasters, Key Laboratory for Aerosol-Cloud Precipitation of China Meteorological Administration, Nanjing University of Information Science and Technology, Nanjing 210044, China
*
Author to whom correspondence should be addressed.
Atmosphere 2024, 15(2), 210; https://doi.org/10.3390/atmos15020210
Submission received: 3 January 2024 / Revised: 28 January 2024 / Accepted: 6 February 2024 / Published: 8 February 2024

Abstract

:
In order to deepen the understanding of the occurrence mechanism and water vapor transport characteristics of the heavy rain process in the extreme arid region of Xinjiang, a rare heavy rain process in the Tarim Basin during the period of 18–22 July 2021 was comprehensively analyzed by using multi-source data. The results show that the upper tropospheric South Asian high was distributed in a “west-high-east-low” pattern during the rainstorm process, and the rainstorm area was located on the right side of the upper jet stream entrance area, while the middle-level Iranian high pressure, Baikal high pressure and Central Asian low pressure formed a “two-highs and one-low” circulation situation. The coupling of the high and low air jets and the strong vertical upward motion provided favorable dynamic conditions. Rainstorm water vapor mainly comes from the Mediterranean Sea, Central Asia and the Indian Ocean, and it enters the basin in four paths: west, east to west, west to east, and southwest and south. The water vapor mainly flows into the middle layer of the western boundary and the southern boundary and the lower layer of the eastern boundary, and it flows out from the middle and upper layer of the eastern boundary. The negative moist potential vorticity region at a low level has a strong indicator significance for the occurrence and development of heavy rain, and the superposition of positive and negative moist potential vorticity regions at vertical height is conducive to the occurrence and development of heavy rain.

1. Introduction

The Tarim Basin is the largest inland basin in China, surrounded by the Tianshan Mountains, Pamir Plateau and Kunlun Mountains. In the middle, there is the Taklimakan Desert, which is the second largest flowing desert in the world. Due to the obstruction of the surrounding mountains and the distance from the ocean, it is difficult for water vapor to cross the mountains and enter the basin, so the average annual precipitation in most areas is less than 50 mm. The climate is very dry, as it is a typical temperate continental climate, and every year at the turn of spring and summer, there will often be sand and dust weather, which makes the ecosystem of the Tarim Basin very fragile. In the context of continuous global warming, the frequent occurrence of extreme events has caused irreversible damage to the ecological environment [1,2]. As one of the regions being the most sensitive to global climate change, heavy rain in the Tarim Basin has shown an obvious increasing trend in the past ten years [3,4,5], and the increase in the local heavy rain frequency is even more obvious [6,7,8,9]. Although the duration is short, the intensity is very high, and the precipitation in a single process can often exceed the local average annual precipitation [10,11]. Coupled with the low vegetation coverage in the basin, such a rainstorm is very likely to cause secondary disasters, such as debris flow, and huge casualties and economic losses [12,13]. The heavy precipitation that occurred in the Tarim Basin from 18 to 22 July 2021 caused 151 people to be affected in seven townships in Kashgar City, with 10.4 hectares of maize affected, 47 houses damaged, and a direct economic loss of CNY 363,000; 213.3 hectares of maize were affected in Shufu County, with 1500 chickens being swept away or drowned in the water, and 1990 m of flood control dams were washed away.
The occurrence of heavy rainfall is the result of the interaction of multi-scale systems [14,15], which is not only influenced by the configuration adjustment of large-scale circulation systems, but also by mesoscale systems and dynamic and thermodynamic structures. Large-scale weather systems affecting extreme precipitation in Xinjiang are very complex, mainly including South Asian High, subtropical trough, westerly jet stream and subtropical high [16,17,18,19,20]. Mesoscale weather systems mainly include Central Asian low vortex, plateau vortex and trough and ridge systems [21,22,23,24], and the coupling between these mesoscale vortices and large-scale circulation background will also affect the extreme precipitation in different regions of Xinjiang [25]. On the convective scale, the low-level easterly jet and the uplift of terrain will also affect the extreme precipitation in different regions of Xinjiang [26,27,28]. The structural changes in the physical quantities in the vertical direction, such as false equivalent potential temperature and wet potential vorticity, also affect the change in precipitation in the rainstorm area [29,30]. In addition to the complex weather system, water vapor transport is also an important factor affecting extreme precipitation in Southern Xinjiang. The transport of precipitation and water vapor in Southern Xinjiang is influenced by westerly wind and the South Asian monsoon, showing significant multi-scale temporal variation [31,32,33].
Unstable stratification is an important feature of severe convective weather [34]. Atmospheric instability includes dynamic instability and thermal instability. Dynamic instability is related to density discontinuity, horizontal wind shear and vertical wind shear, while thermal instability is related to the vertical profile distribution of temperature and humidity [35]. Convective available potential energy (CAPE) is an important index to characterize the development of convection, and the CAPE value reflects the potential energy of severe convective weather [36,37], and it is often used to assess the instability of the atmosphere [38]. Some scholars use the wet potential vorticity as a criterion to analyze the unstable conditions of a rainstorm process [39,40]. Studies have shown that the convective instability caused by positive vorticity superposition in the middle and upper tropospheres plays an important role in the occurrence of heavy rainfall [41]. By diagnosing saturation equivalent potential temperature and the geostrophic absolute momentum, Guo et al. showed that the instability mechanism of a rainstorm was caused by conditional symmetric instability [42]. In fact, convective instability and symmetric instability often coexist in the atmosphere, and the atmosphere can change from convective instability to symmetric instability during heavy precipitation [43,44].
It is not difficult to see from the above literature that some studies have been carried out in the past to analyze the characteristics of unstable energy and water vapor transport during heavy rainfall. However, how does the unstable energy change? Which quantities are good indicators of changes in unstable energy and the movement of strong convective systems? In addition, the selected typical process occurred at the same time as a typhoon rainstorm in Zhengzhou. Is the water vapor transport of rainstorm in the basin also related to the typhoon system? With these questions in mind, this paper starts with three conditions required for the occurrence of heavy rain, namely, unstable atmospheric stratification, continuous water vapor transport and strong upward movement, and analyzes the configuration of the system’s dynamic and thermal structures during this heavy rain, the change in unstable stratification, and the evolution of convective instability and its relationship with precipitation. It provides a reference to reveal the cause of the heavy rain and forecast subsequent heavy rain.

2. Materials and Methods

2.1. Data Introduction
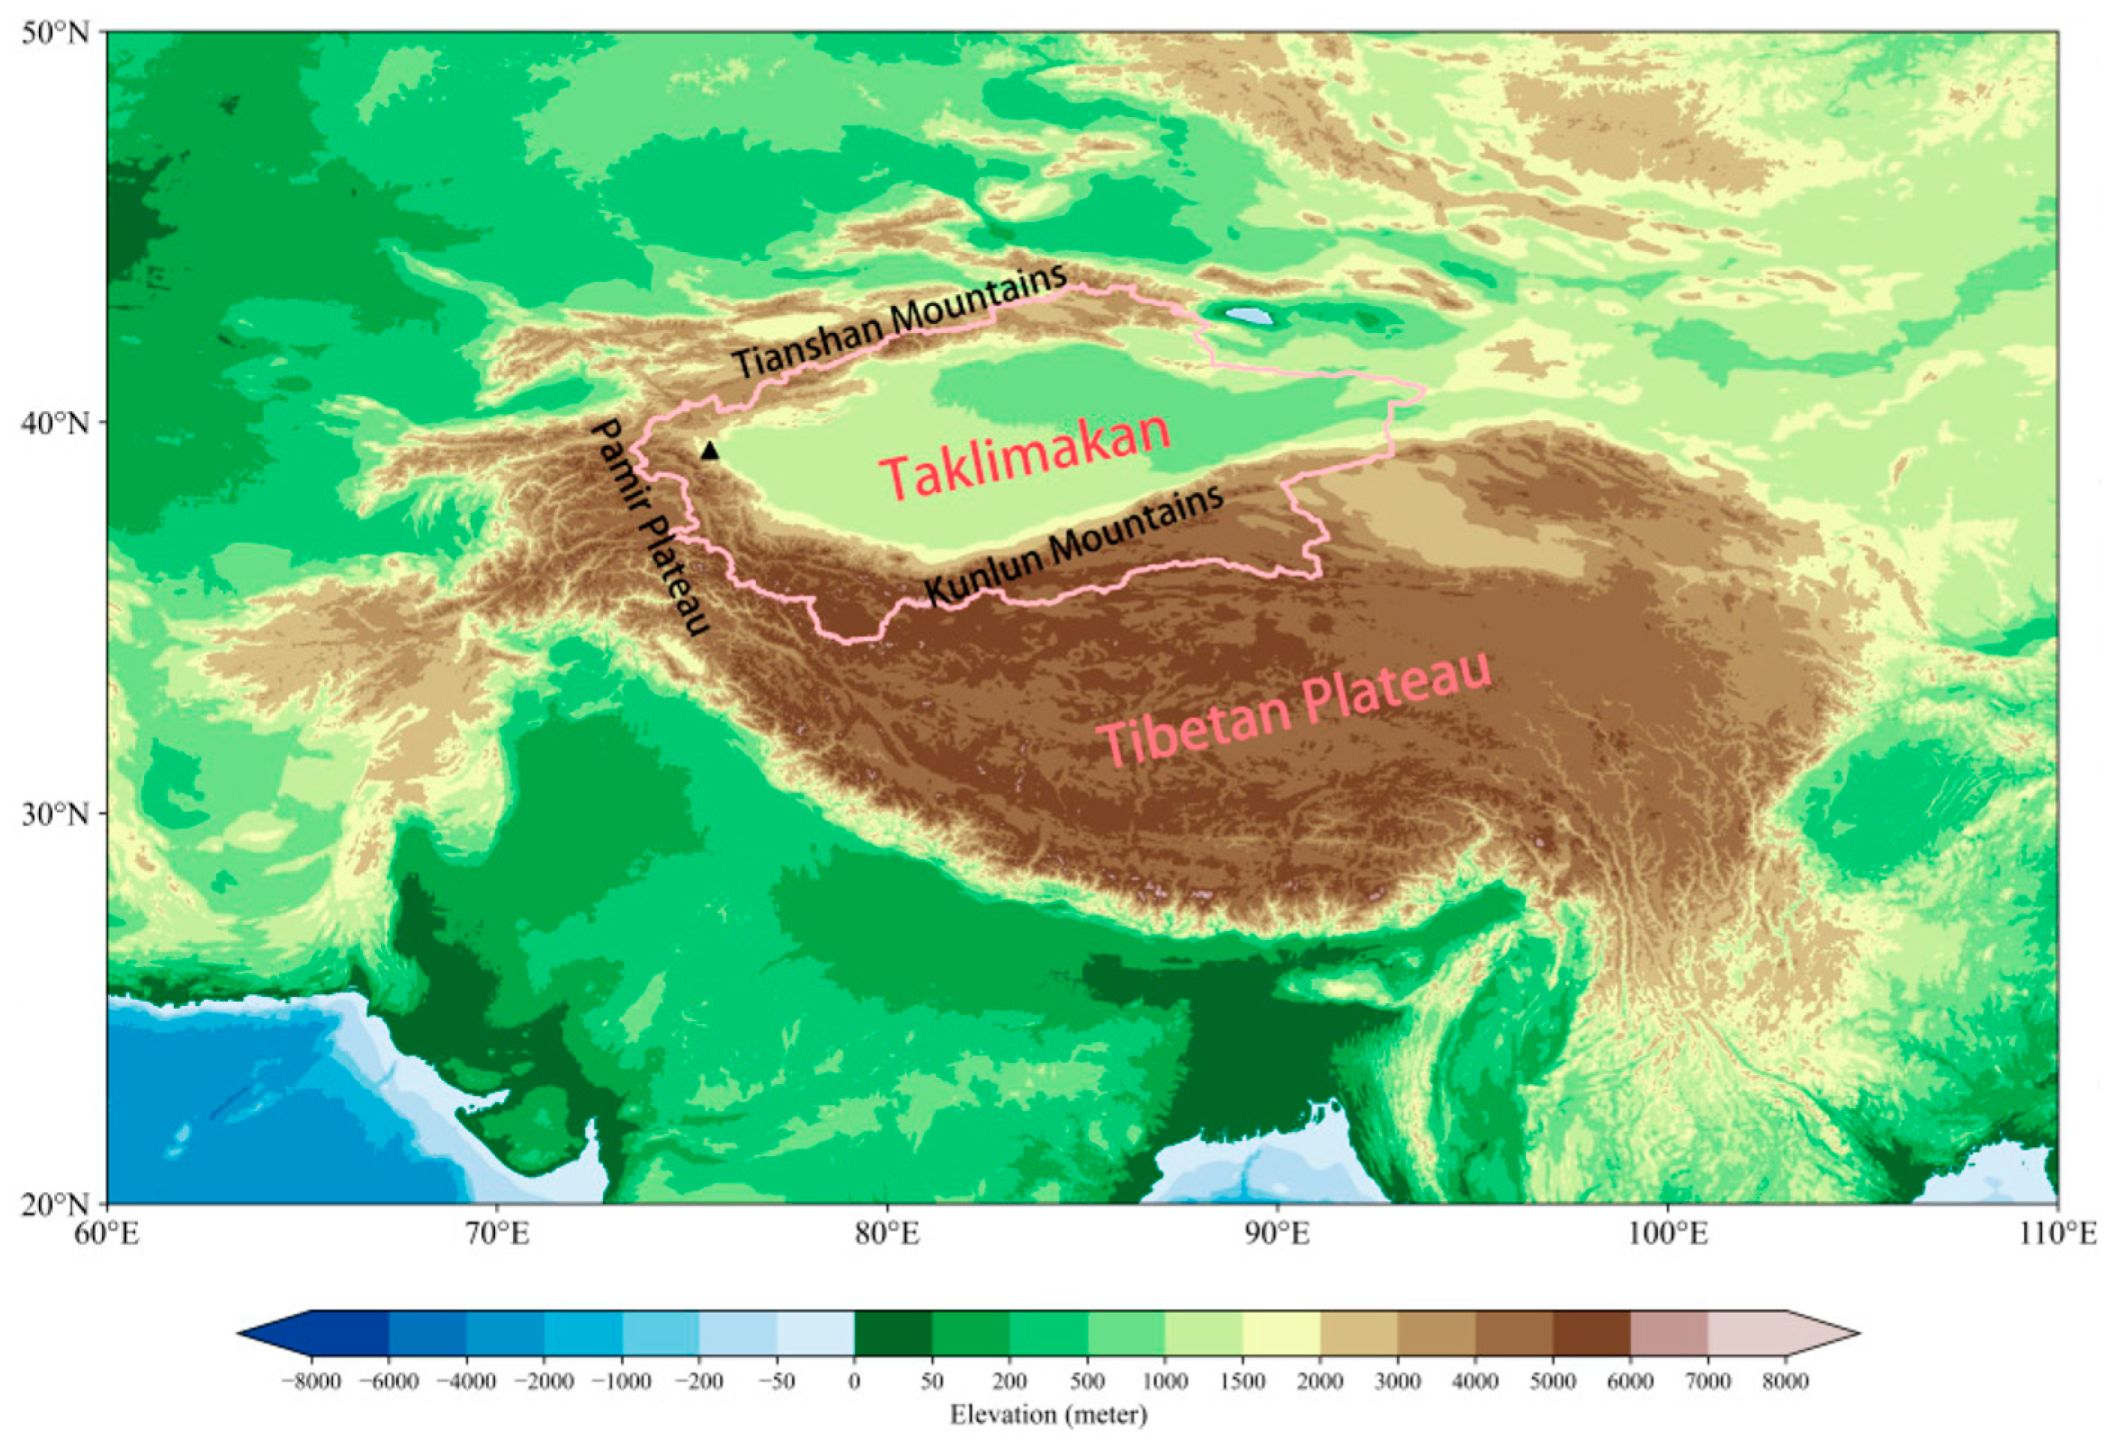
2.1.1. Study Area

The study area of this paper is the Tarim Basin (36–42° N, 75–93° E) (Figure 1), and the topographic data were obtained from the global topographic model developed by the National Geophysical Data Center (NGDC) of the National Oceanic and Atmospheric Administration (NOAA), including the global landforms and oceans, with a resolution of 2 min.

2.1.2. Ground Observation Data

Hourly precipitation data from encrypted automatic observation stations in Tarim Basin from 18 to 22 July 2021 were provided by Xinjiang Meteorological Information Center for fact analysis, which has passed the quality control check for climate limit value test and spatial consistency check [45].
The Kashgar sounding data are from the July 2021 outfield sounding observation experiment. Observations are made four times a day, namely at 01:15, 07:15, 13:15 and 19:15 (Beijing time), and the meteorological elements include the following: wind speed, wind direction, temperature, relative humidity, atmospheric pressure, a temporal resolution of 1 s and a spatial resolution of 10 m. The sounding data are used to analyze the vertical structural changes of the thermodynamic force of the rainstorm process.

2.1.3. Reanalysis Data

Hourly reanalysis data of ERA5 with spatial resolution of 0.25° × 0.25° was used to analyze circulation situation field, calculate water vapor transport flux, pseudo equivalent potential temperature and moist potential vorticity. Variables used included geopotential height, meridional wind and zonal wind, specific humidity, surface pressure, relative vorticity, temperature and relative humidity.
GDAS is the Global Data Assimilation System; meteorological reanalysis data were provided by the National Centers for Environmental Prediction (NCEP) in the U.S. GDAS runs four times a day, storing data at four moments of the day, i.e., 00, 06, 12 and 18 UTC, with a spatial resolution of 1° × 1°, and the meteorological elements include horizontal wind speed, temperature, humidity and barometric pressure. In this paper, the 3D meteorological field provided by GDAS data is used to drive the HYSPLIT-4 trajectory model.

2.1.4. Satellite Data

The hourly mean cloud top brightness temperature (TBB) data of FY-2G with a horizontal resolution of 0.1° × 0.1° provided by the National Satellite Meteorological Center [46] were used to analyze the evolution characteristics of mesoscale systems.

2.2. Model and Methods

2.2.1. Water Vapor Flux

The vertical whole-layer water vapor flux (Q) is calculated as follows [47]:
Q = 1 g P s P t q v   d p ,
where g is the acceleration of gravity, pt is set as 300 hPa, ps is the surface air pressure, q is the specific humidity, v is the wind field and p is the pressure.

2.2.2. Moist Potential Vorticity

Moist potential vorticity (MPV) is a comprehensive physical quantity that can simultaneously characterize water vapor, heat and dynamic properties. With reference to the research results of Wu et al. [48] (see Appendix A for a detailed derivation), the conservation formula of moist potential vorticity derived from the original motion equation in the P coordinate system is as follows:
MPV = g ( ξ p + f ) θ e / p + g ( v / p ) ( θ e / x ) g ( u / p ) ( θ e / y ) ,
The MPV of Formula (2) can be divided into vertical component MPV1 and horizontal component MPV2:
MPV 1 = g ( ξ p + f ) θ e / p ,
MPV 2   = g ( v / p ) ( θ e / x ) g ( u / p ) ( θ e / y ) ,
where f is the Koch parameter; ξ p is the relative vorticity; θ e is the equivalent potential temperature, u; v is the horizontal wind speed and g is the acceleration of gravity. MPV1 is also known as the positive pressure term of the wet potential vortex, which characterizes the roles of inertial stability and convective stability, and it is determined by the contribution of the vertical component of the absolute vorticity of the air mass and the vertical gradient of the equivalent potential temperature, which is usually positive for the Northern Hemisphere, so that when MPV1 < 0, it indicates that the atmosphere has convective instability. MPV2, also known as the oblique pressure term of the wet potential vortex, is determined by the contribution of the vertical shear of the wind and the horizontal gradient of the equivalent potential temperature. When MPV2 < 0, the atmosphere is characterized as conditionally symmetrically unstable.

2.2.3. HYSPLIT

The Hybrid Single Particle Lagrangian Integrated Trajectory Model (HYSPLIT) is a useful tool for establishing the spatial region of an air mass source to a receptor location, which can be used to calculate and analyze the transport and dispersion trajectories of air pollutants. The HYSPLIT model is one of the most widely used atmospheric transport and dispersion models in the atmospheric science community; it has a wide range of meteorological element input fields and is capable of physical process pollutant emission source processing, and it has been widely used in atmospheric pollutant transport analysis. In this paper, the HYSPLIT model was used to analyze the backward trajectory of storm water vapor.

3. Results

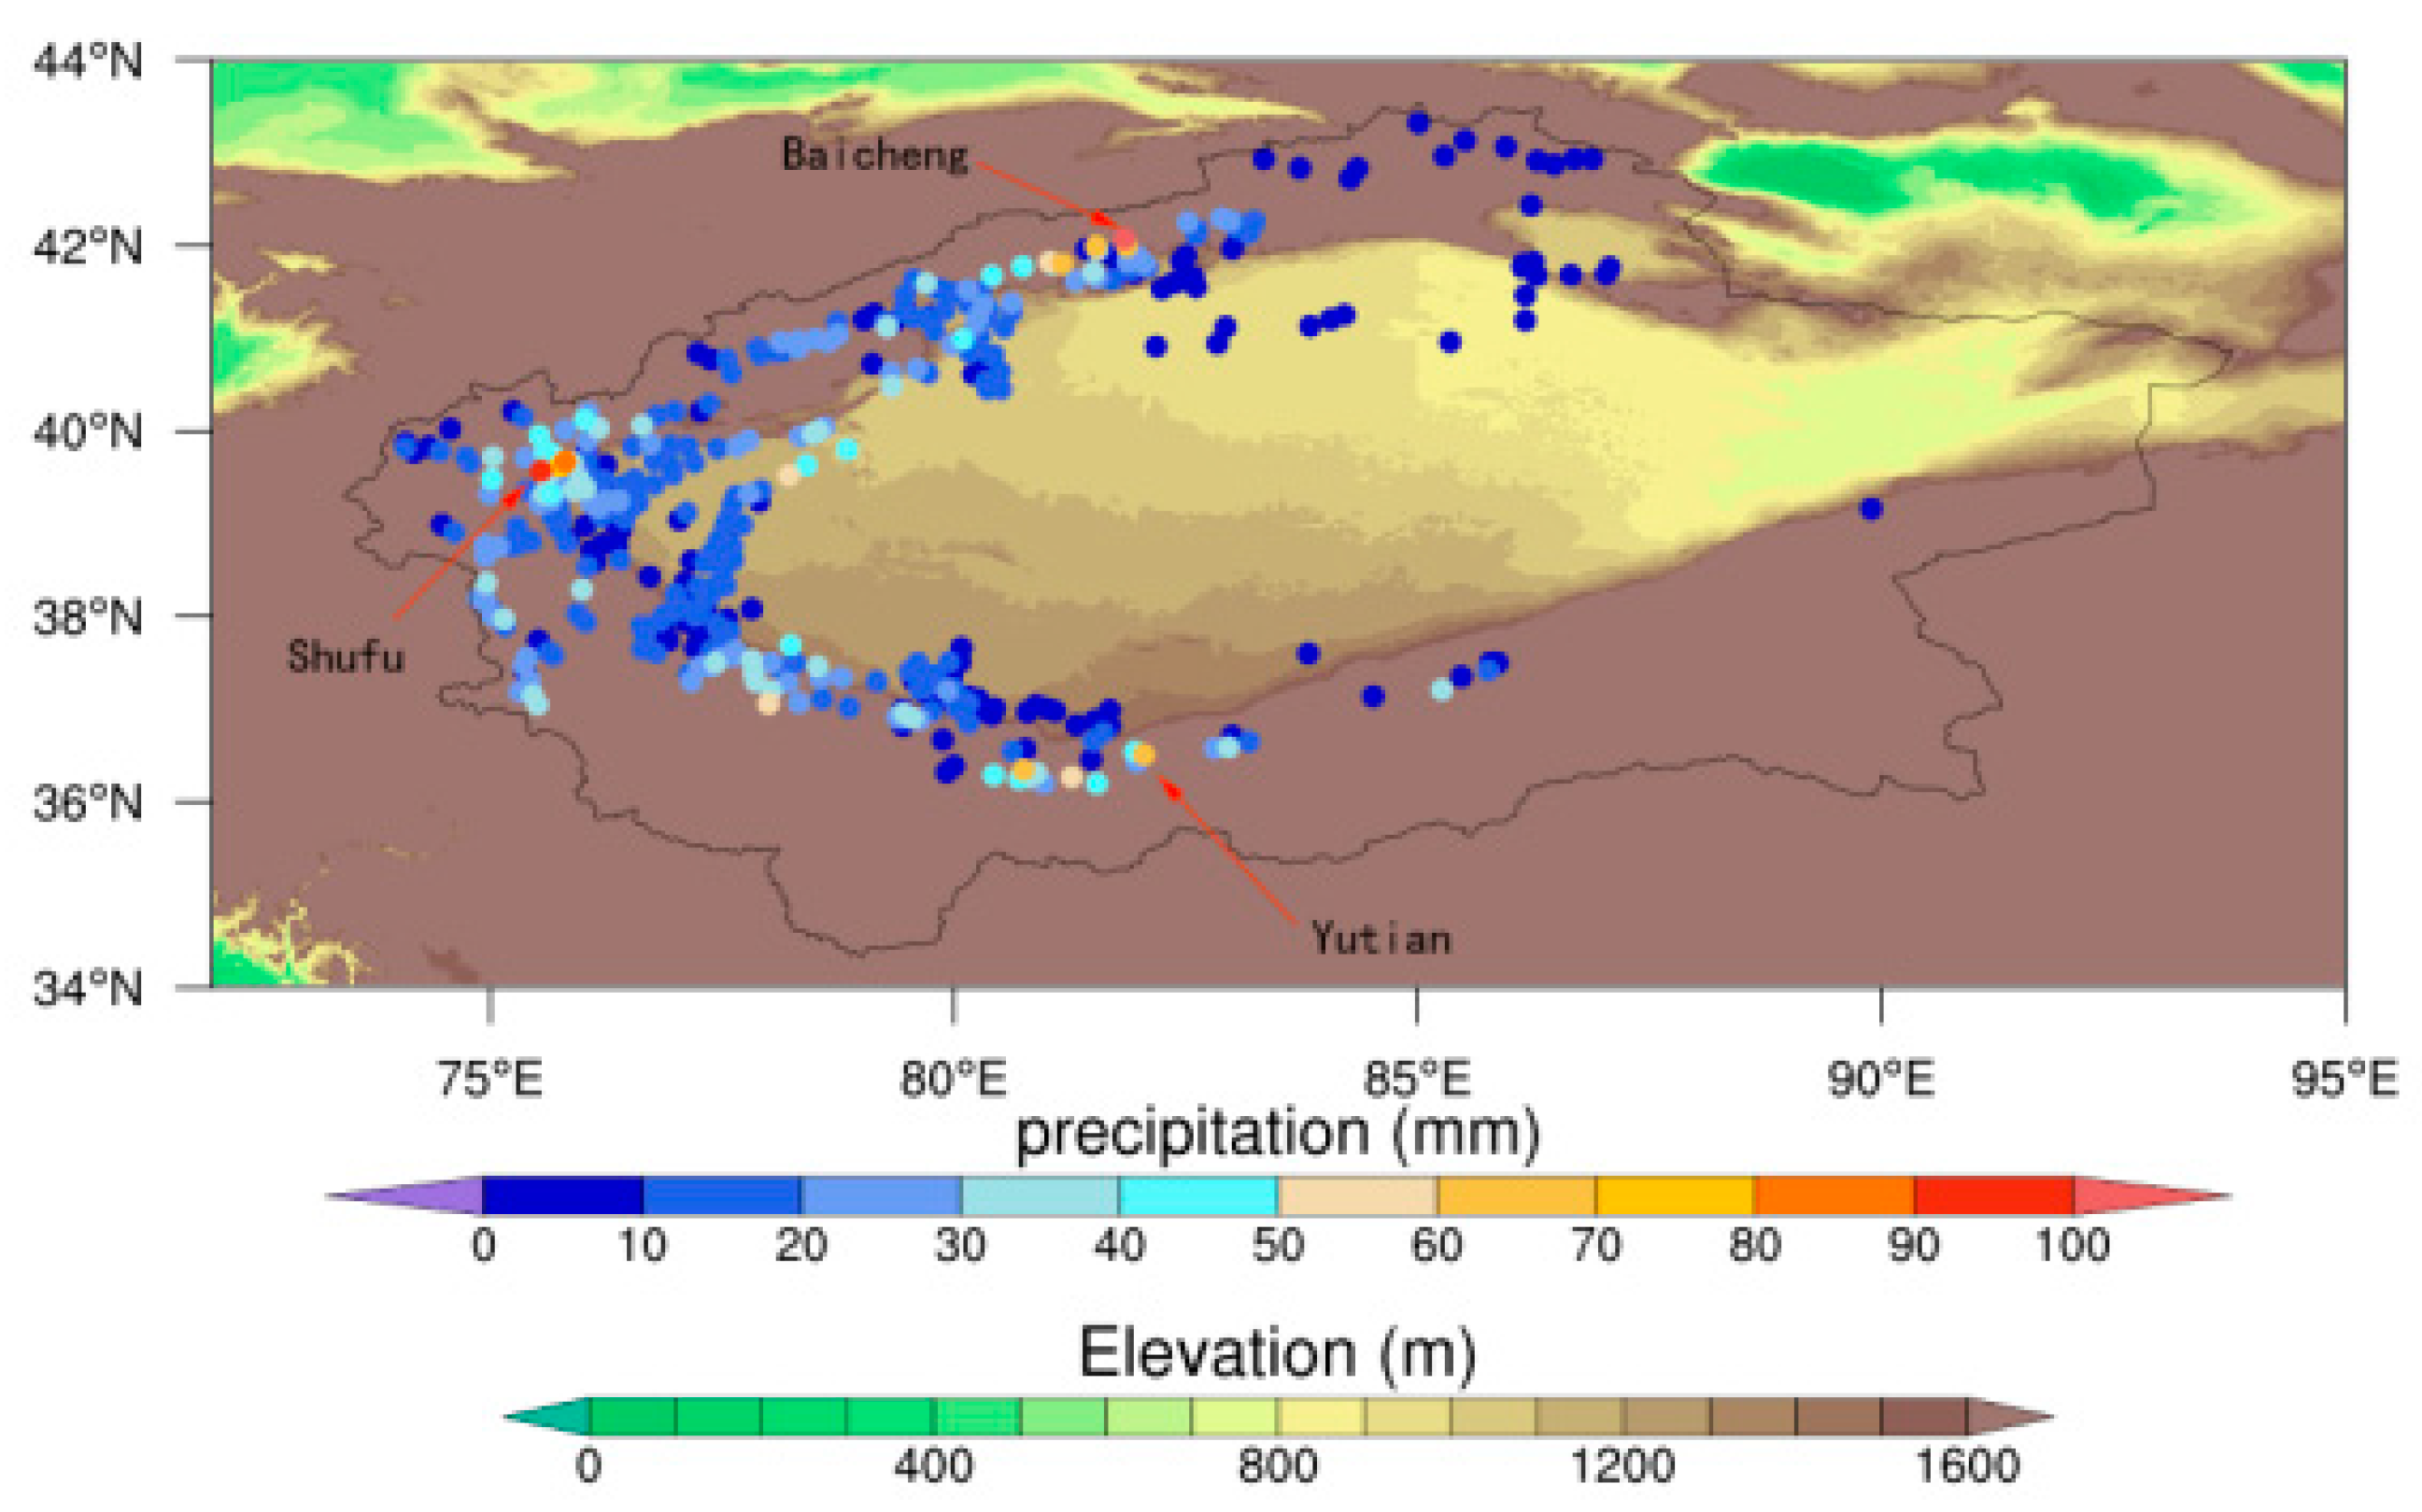
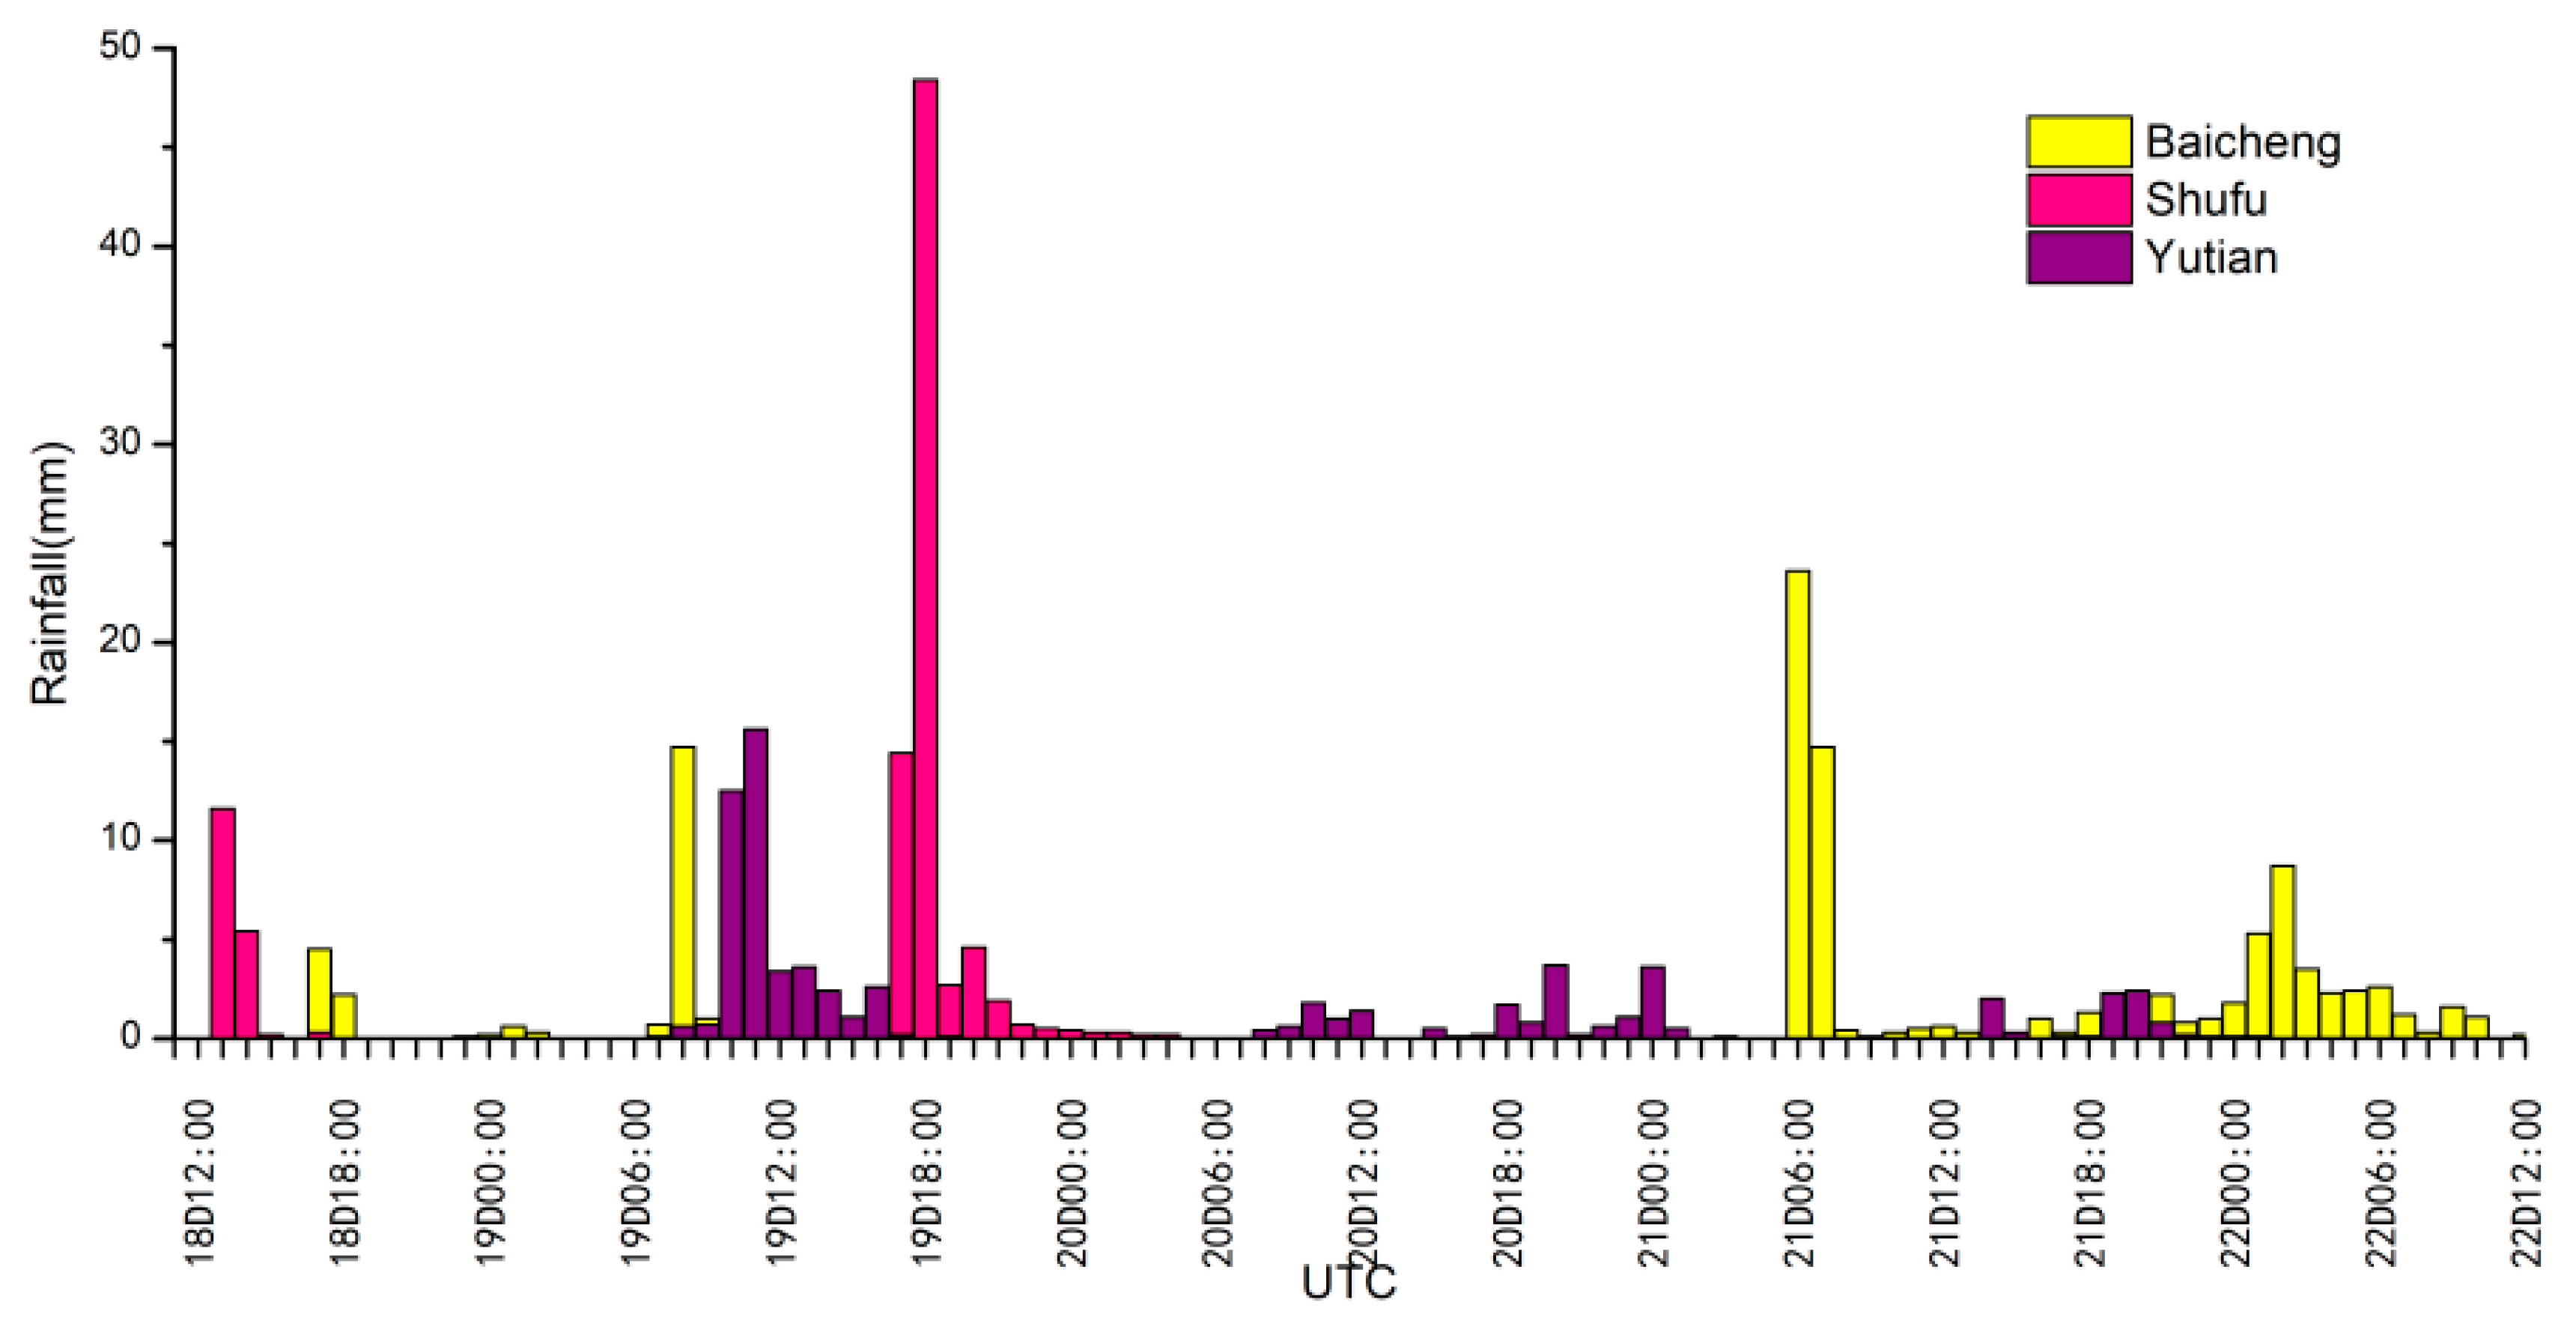
3.1. Rainfall Overview

From 12:00 (UTC, the same below) on July 18 to 12:00 on 22 July 2021, significant heavy precipitation occurred in the Tarim Basin of Xinjiang, and the precipitation process was wide-ranging, sustained for a long time and extreme, and it resulted in a large cumulative rainfall (Figure 2). The precipitation fallout area covered the Aksu, Kashgar and Hotan regions, with nine stations ranging from 51.2 to 92.2 mm and two stations exceeding 100 mm; the largest precipitation center had a cumulative rainfall of 107.3 mm, which was located in Baicheng County, Aksu region, and the largest hourly rainfall intensity of 48.4 mm was found in Shufu County, Kashgar region (Figure 3).

3.2. Weather Situation and Dynamic Mechanism

At 200 hPa, before the rainstorm occurred at 12:00 on 18 July, the South Asian High was distributed in a “double-body” shape, with two high-pressure centers located over the Iranian Plateau and the Tibetan Plateau, the subtropical trough located between the two centers, the Tarim Basin located in the westerly flow zone and the westerly jet axis located near 41° N (Figure 4a). At 18:00 on 19 July, when the rainstorm occurred, the Iranian high pressure developed and lifted to the north, the South Asian High turned into a “high in the west and low in the east” distribution, the subtropical trough extended south to the west side of the basin, the shear occurred at 60° E of the westerly jet and the jet axis moved south to 38°N. The basin was located on the right side of the entrance area of the westerly jet and was controlled by the southwest air flow (Figure 4b). At 500 hPa, a circulation pattern of “two ridges and one trough” was maintained before the rainstorm, with Europe and Lake Baikal as ridges and West Siberia as a trough (Figure 4c). When the rainstorm occurred, the Iranian high pressure strengthened to the north, the cold air in front of the ridge extended southward, the great trough of West Siberia extended south to form the Central Asian trough, the low-pressure trough extended southward to 31° N and the basin was located in front of the trough. Affected by the southwest air flow, the subtropical high extended from the east to the north, the typhoon “In-Fa” was generated and maintained on the south side and the rainstorm occurred under the circulation situation of “two high and one low” (Figure 4d). At 700 hPa, a stable “two ridges and one trough” circulation pattern existed in the middle and high latitudes before the rainstorm, with the Iran ridge guiding the northwest flow into the basin (Figure 4e). At the time of the heavy rainfall, the Iranian ridge retreated to the west, the southbound air flow shear occurred over northern India, the southwest air flow entered the basin, the Baikal ridge developed and the West Siberian trough deepened (Figure 4f). At 850 hPa, before the rainstorm occurred, there was an obvious easterly jet stream flowing into the basin. The core of the jet stream was located at the eastern edge of the basin, and the central wind speed of the jet stream exceeded 16 m/s. The jet stream extended along the north slope of the Kunlun Mountain to the west of the basin (Figure 4g). When heavy rainfall occurs, the easterly jet stream and the northwest air stream converge to form a clear local circulation, which is conducive to the development of the convergence upward movement (Figure 4h). From the vertical velocity profile taken along the Shufu station (39.5° N) of the rainstorm center, it can be seen that at 12:00 on the 18th, there was a sinking movement over the rainfall area before the rainstorm (Figure 5a); at 12:00 on the 19th, 6 h before the rainstorm, there was a weak rising movement from the ground level of the rainfall area to 700 hPa (Figure 5b). The ascending motion gradually strengthened and extended upward to 300 hPa, with 600–400 hPa as the ascending center. The enhanced ascending motion provided favorable dynamic conditions for the occurrence of heavy rain (Figure 5c).

3.3. Water Vapor Transport and Budget Characteristics

The occurrence of heavy rain requires a steady supply of water vapor. From the water vapor flux from the ground to 300 hPa (Figure 6), it can be seen that the water vapor in this heavy rain process mainly comes from the Mediterranean Sea, the Arabian Sea and the Bay of Bengal and Central Asia, and there are mainly four water vapor transport paths: westward, east to west, west to east and southwest and south. Three days before the rainstorm, water vapor from the Mediterranean Sea and its western surface was transported to the basin along westerly winds, and the water vapor flux divergence along the mountains on the south side of the basin was negative, indicating water vapor convergence (Figure 6a). Two days before the rainstorm, water vapor mainly came from the northern part of the Arabian Sea, and the easterly winds at the bottom of the Iranian high pressure transported the water vapor from the northern Arabian Sea ocean surface to the west, deflected northward to Central Asia, and then entered the basin with the west winds, and the water vapor converged in the western side of the basin (Figure 6b). The day before the rainstorm, water vapor from the western Mediterranean Sea was transported to the eastern side of the basin over a long distance, and then deflected and flowed towards the basin along the easterly jet stream. The negative value area of water vapor flux divergence increased on the west side of the basin, and the water vapor was converged and enhanced in the storm area (Figure 6c). During the stable phase of heavy rainfall, water vapor from the Mediterranean Sea and its west ocean surface was transported to Central Asia, with the southward extension of the Central Asian trough, and it merged with the water vapor from the ocean surface north of the Arabian Sea. Cyclonic shear occurred before the low pressure, and water vapor entered the basin along the southwest airflow. After the other water vapor flowed to the Bay of Bengal, it first moved north and then turned west under the action of the Indian Low and the plateau vortex, and then transported in a southerly path; the rainstorm over the area showed a strong convergence of water vapor (Figure 6d).
The HYSPLIT backward trajectory model was used to track the backward trajectories for 10 days along three rainstorm locations, namely Shufu (39.57° N, 75.55° E), Yutian (36.51° N, 82.05° E) and Baicheng (42.07° N, 81.84° E). By tracking the water vapor trajectories at the 1500–7000 m altitude of the rainstorm points, we also found four water vapor transport paths: westward, east to west, west to east and southwest. The southward path may not have been tracked because there was too little water vapor transport. The water vapor at 1500 m above the storm area was mainly transported from Central Asia in a west-to-east path (Figure 7a, trajectory 1), and then converged locally (Figure 7b, trajectory 1). Water vapor at a height of 3000 m mainly comes from the Mediterranean Sea–Black Sea–Caspian Sea area and is transported to the basin in a westward trajectory (Figure 7b, trajectory 2). Water vapor at a height of 5500 m comes from the Arabian Sea and the Bay of Bengal, and it enters the heavy rain area via an east-to-west path (Figure 7b, trajectory 3) and a southwest path (Figure 7c, trajectory 3), respectively.
In order to quantify the water vapor transport in the storm area and to understand the characteristics of the transport in the vertical direction on each boundary, we calculated the water vapor budget at the four boundaries of the storm area (35–42° N, 73–88° E) from 17 to 21 July. It can be seen that during the entire heavy rain process, water vapor transport at the western boundary played a large role. The water vapor transport volume in the entire layer was positive, and water vapor was mainly transported in the middle and upper layers of 700–300 hPa (Figure 8a). In the early stage of heavy rain, there is a large negative value in the lower troposphere on the eastern boundary, indicating that the low-level easterly jet stream brings strong water vapor transport, and water vapor continues to flow out of the middle and upper tropospheres (Figure 8b). Because the southern boundary is blocked by tall terrain, there is no water vapor transport in the lower levels. At 0:00 on the 19th, a weak water vapor input began above 500 hPa. It was enhanced to a certain extent during the occurrence of heavy rains. At this time, the contribution of water vapor transport at the southern boundary was greater than that at the western boundary (Figure 8c). Before 12:00 on the 18th, there was water vapor inflow in the lower troposphere on the northern boundary, and water vapor in the upper troposphere flowed out. The net balance was balanced, and the water vapor balance was weak (Figure 8d). The strength of stormwater vapor transport had a good correspondence with the precipitation amount and duration in the basin.

3.4. Mesoscale Convective Cloud Evolution

The mesoscale system is the most direct weather system that causes heavy rainfall, and satellite cloud maps can effectively monitor the generation, development and movement path of cloud systems around the heavy rainfall area [49]. Studies show that the region with TBB ≤ −32 °C can represent an active convection area, and the lower the TBB temperature, the more vigorous the convection [50]. At 12:00 on the 18th, convective clouds over the northern part of the Arabian Sea formed and continued to develop and strengthen, and the bright temperature center of the cloud top dropped to about −80 °C, moving northward toward the basin (Figure 9a). At 18:00 on the 18th, convectional cloud broke, and its front moved to the west side of the Tibetan Plateau. At the same time, a northeast–southwest-oriented cloud system was generated in the northern part of the basin, and the central intensity of the TBB was about −50 °C, at which time precipitation appeared in the northern part of the basin (Figure 9b). At 0:00 on the 19th, convective clouds on the west side of the plateau merged into sheets, developed vigorously, and gradually moved into the basin, and the convective cloud system in the north of the basin continued to strengthen and move to the northeast (Figure 9c). At 12:00 on the 19th, the cloud system on the western side of the plateau dispersed into multiple convective cells and cyclically moved into the basin, and precipitation was generated in the southern part of the basin (Figure 9d). At 18:00 on the 19th, a convective cell appeared in the western part of the basin. At this time, heavy precipitation occurred in the Shufu area, and convective clouds in the southern part of the basin moved slowly to the east, and the precipitation was maintained (Figure 9e). Subsequently, the convective cloud system in the southern part of the basin moved eastward and weakened, and the precipitation process also came to an end (Figure 9f).

3.5. Thermal Structure and Instability Conditions

The pseudo-equivalent potential temperature (θse) is a comprehensive physical quantity that characterizes temperature, humidity and pressure. θse can reflect the temperature and humidity characteristics of the atmosphere and the stability of the atmospheric layer junction, and the development of strong convection can be well understood through the analysis of its horizontal and vertical distribution characteristics [51]. From the horizontal distribution of the pseudo equivalent potential temperature of 850 hPa at 06:00 on 18 July 2021 and 18:00 on 19 July 2021, it can be seen that before the rainstorm, there was a θse isocontour dense zone in the southwest of the Tarim Basin, which reached 360 K, corresponding to the high temperature and high humidity area, and a large amount of unstable energy accumulated. The northeast of the Tarim Basin is the low-value area of θse, corresponding to the dry and cold air. There are great differences in temperature and humidity conditions on both sides, and cold and warm air flows converge at the intersection (Figure 10a). At 18:00 on the 19th, as the θse dense zone gradually extended to the basin, θse on the west side of the basin was 344 K, the temperature and humidity gradients on both sides increased and heavy precipitation occurred in the area with a larger θse gradient (Figure 10b).
θse decreases with an increasing altitude, indicating that the atmospheric junction is unstable; on the contrary, the atmospheric junction is stable. As can be seen from the vertical profile along the 39.5° N pseudo-equivalent potential temperature at 06:00 on 18 July and 18:00 on 19 July 2021, there was weak unstable stratification at 700–500 hPa on the west side of the rainfall area before the rainstorm occurred, unstable energy accumulated and precipitation formed once there was a convection triggering mechanism (Figure 11a). When a rainstorm occurs, the θse gradient over the rainstorm area increases continuously, forming a strong unstable stratification at the ground level to 700 hPa, and the atmosphere is in an unstable state, so the accumulated unstable energy can be easily released, which is conducive to the occurrence of a rainstorm (Figure 11b). It can be seen that the rain band range of the rainstorm in Southern Xinjiang had a good correspondence with the unstable region reflected in the vertical direction of θse.
Sounding temperature–wetness stratification curves can be used to analyze the changes in temperature and wetness conditions in the atmosphere before and after the appearance of heavy rainfall, and also to determine the stability of the atmospheric stratification [52,53]. The heavy precipitation process was captured by an outfield encrypted sounding experiment in Kashgar in July 2021. At 11:00 on 18 July, the whole layer of the storm area was wet, and the thickness of the wet layer varied from 700 hPa to 400 hPa, with the winds at the lower level from the easterly direction (Figure 12a). At 00:00 on July 19, the supply of water vapor from 500–400 hPa at the western boundary resulted in dryness in the middle and upper wet layers of the storm area, with a large direct temperature decrease, unstable energy generation and a smooth transition of winds in the lower level (Figure 12b). At 05:00 on 19 July, the transport of water vapor from the upper level of the southern boundary resulted in dryness in the lower part of the storm area, with a large vertical wind shear in the 850–600 hPa range, a warm advection at 750–600 hPa and a warm advection in the 600–400 hPa range (Figure 12c). At 11:00 on the 19th, the lower and middle layers were wet, and the upper layers were dry, the temperature and dew point curves were in the shape of a “trumpet”, the temperature direct reduction rate was large and the CAPE value increased to 588 J/kg (Figure 12d), which was favorable for the occurrence of heavy rainfall.
The moist potential vorticity (MPV) is a physical quantity that can comprehensively characterize the action of water vapor, power and heat, and it is often used to diagnose the unstable state during the occurrence of a rainstorm [39,40]. According to the MPV distribution of 850 hPa during the rainstorm process, a negative MPV zone existed in the Aksu and Kashgar regions at 18:00 on the 18th, the day before the rainstorm occurred, indicating that unstable energy existed in both regions, but the water vapor supply and dynamic uplift were lacking, and heavy precipitation did not occur temporarily. The two negative zones are basically consistent with the two heavy rain points at Shufu and Baicheng (Figure 13a). At 18:00 on the 19th, when the rainstorm was strong, the negative MPV region in the basin increased, the unstable energy was enhanced and there was a good correspondence between the precipitation region and the negative MPV region (Figure 13d). It can be seen that the intensity variation and movement direction of the negative MPV region at the low level have a strong indication significance for the fall area and the occurrence and development of heavy rainfall in the basin. The MPV can be further divided into a wet positive pressure term (MPV1), which represents inertial stability and convective stability, and the wet barocline term (MPV2), which represents symmetric stability. By separating MPV into MPV1 and MPV2, we can better understand the relationship between thermal instability and the occurrence and development of heavy rainfall. By comparing the distribution maps of 850 hPa MPV, MPV1 and MPV2, it can be seen that the distribution of MPV at the two times (Figure 13a,d) is basically consistent with that of MPV1 (Figure 13b,e), the symmetric instability energy is very weak and the rainstorm is mainly caused by convective instability. It is worth noting that MPV1 can only characterize the instability of atmospheric junctions, and it is not the only condition for the occurrence of heavy rain, but also depends on the dynamic and water vapor supply conditions.
From the vertical profiles of MPV, MPV1 and MPV2 along the 39.5° N precipitation center, it can be seen that at 18:00 on 18 July, the high-value area of the positive MPV was concentrated above 300 hPa, indicating that the upper atmosphere at this time was a convective stable area, and there was a negative area from 700 hPa to 300 hPa over the precipitation area, which was a convective unstable area. The vertical distribution of the negative MPV region is basically the same as that of the negative MPV2 region (Figure 14a–c), indicating that the symmetric instability predominates, and convective instability has little influence at this time. At 18:00 on the 19th, there was a high vortex tongue over the rainstorm area extending down to 400 hPa, and 700–400 hPa was a negative region with the same pattern of overlapping positive and negative regions. At this time, the vertical distribution of MPV was more consistent with MPV1 (Figure 14d–f), indicating that the rainstorm was mainly affected by convective instability. It can be seen that the instability conditions of the rainstorm process changed from symmetric instability to convective instability, and the superposition of positive and negative MPV regions at vertical height was conducive to the occurrence and development of the rainstorm.

4. Conclusions and Discussion

In this paper, using the hourly precipitation data from the Tarim Basin regional automatic station, the encrypted sounding data from the Kashgar outfield, the hourly reanalysis data from the ERA5 and the FY-2G blackbody bright temperature data, we conducted a preliminary analysis of the weather situation and the dynamical mechanism, the water vapor transport characteristics, the mesoscale characteristics, the thermal structure and the instability conditions of a heavy rainfall process that occurred in the Tarim Basin in the period of 18–22 July 2021, and we came up with the following main conclusions:
(1)
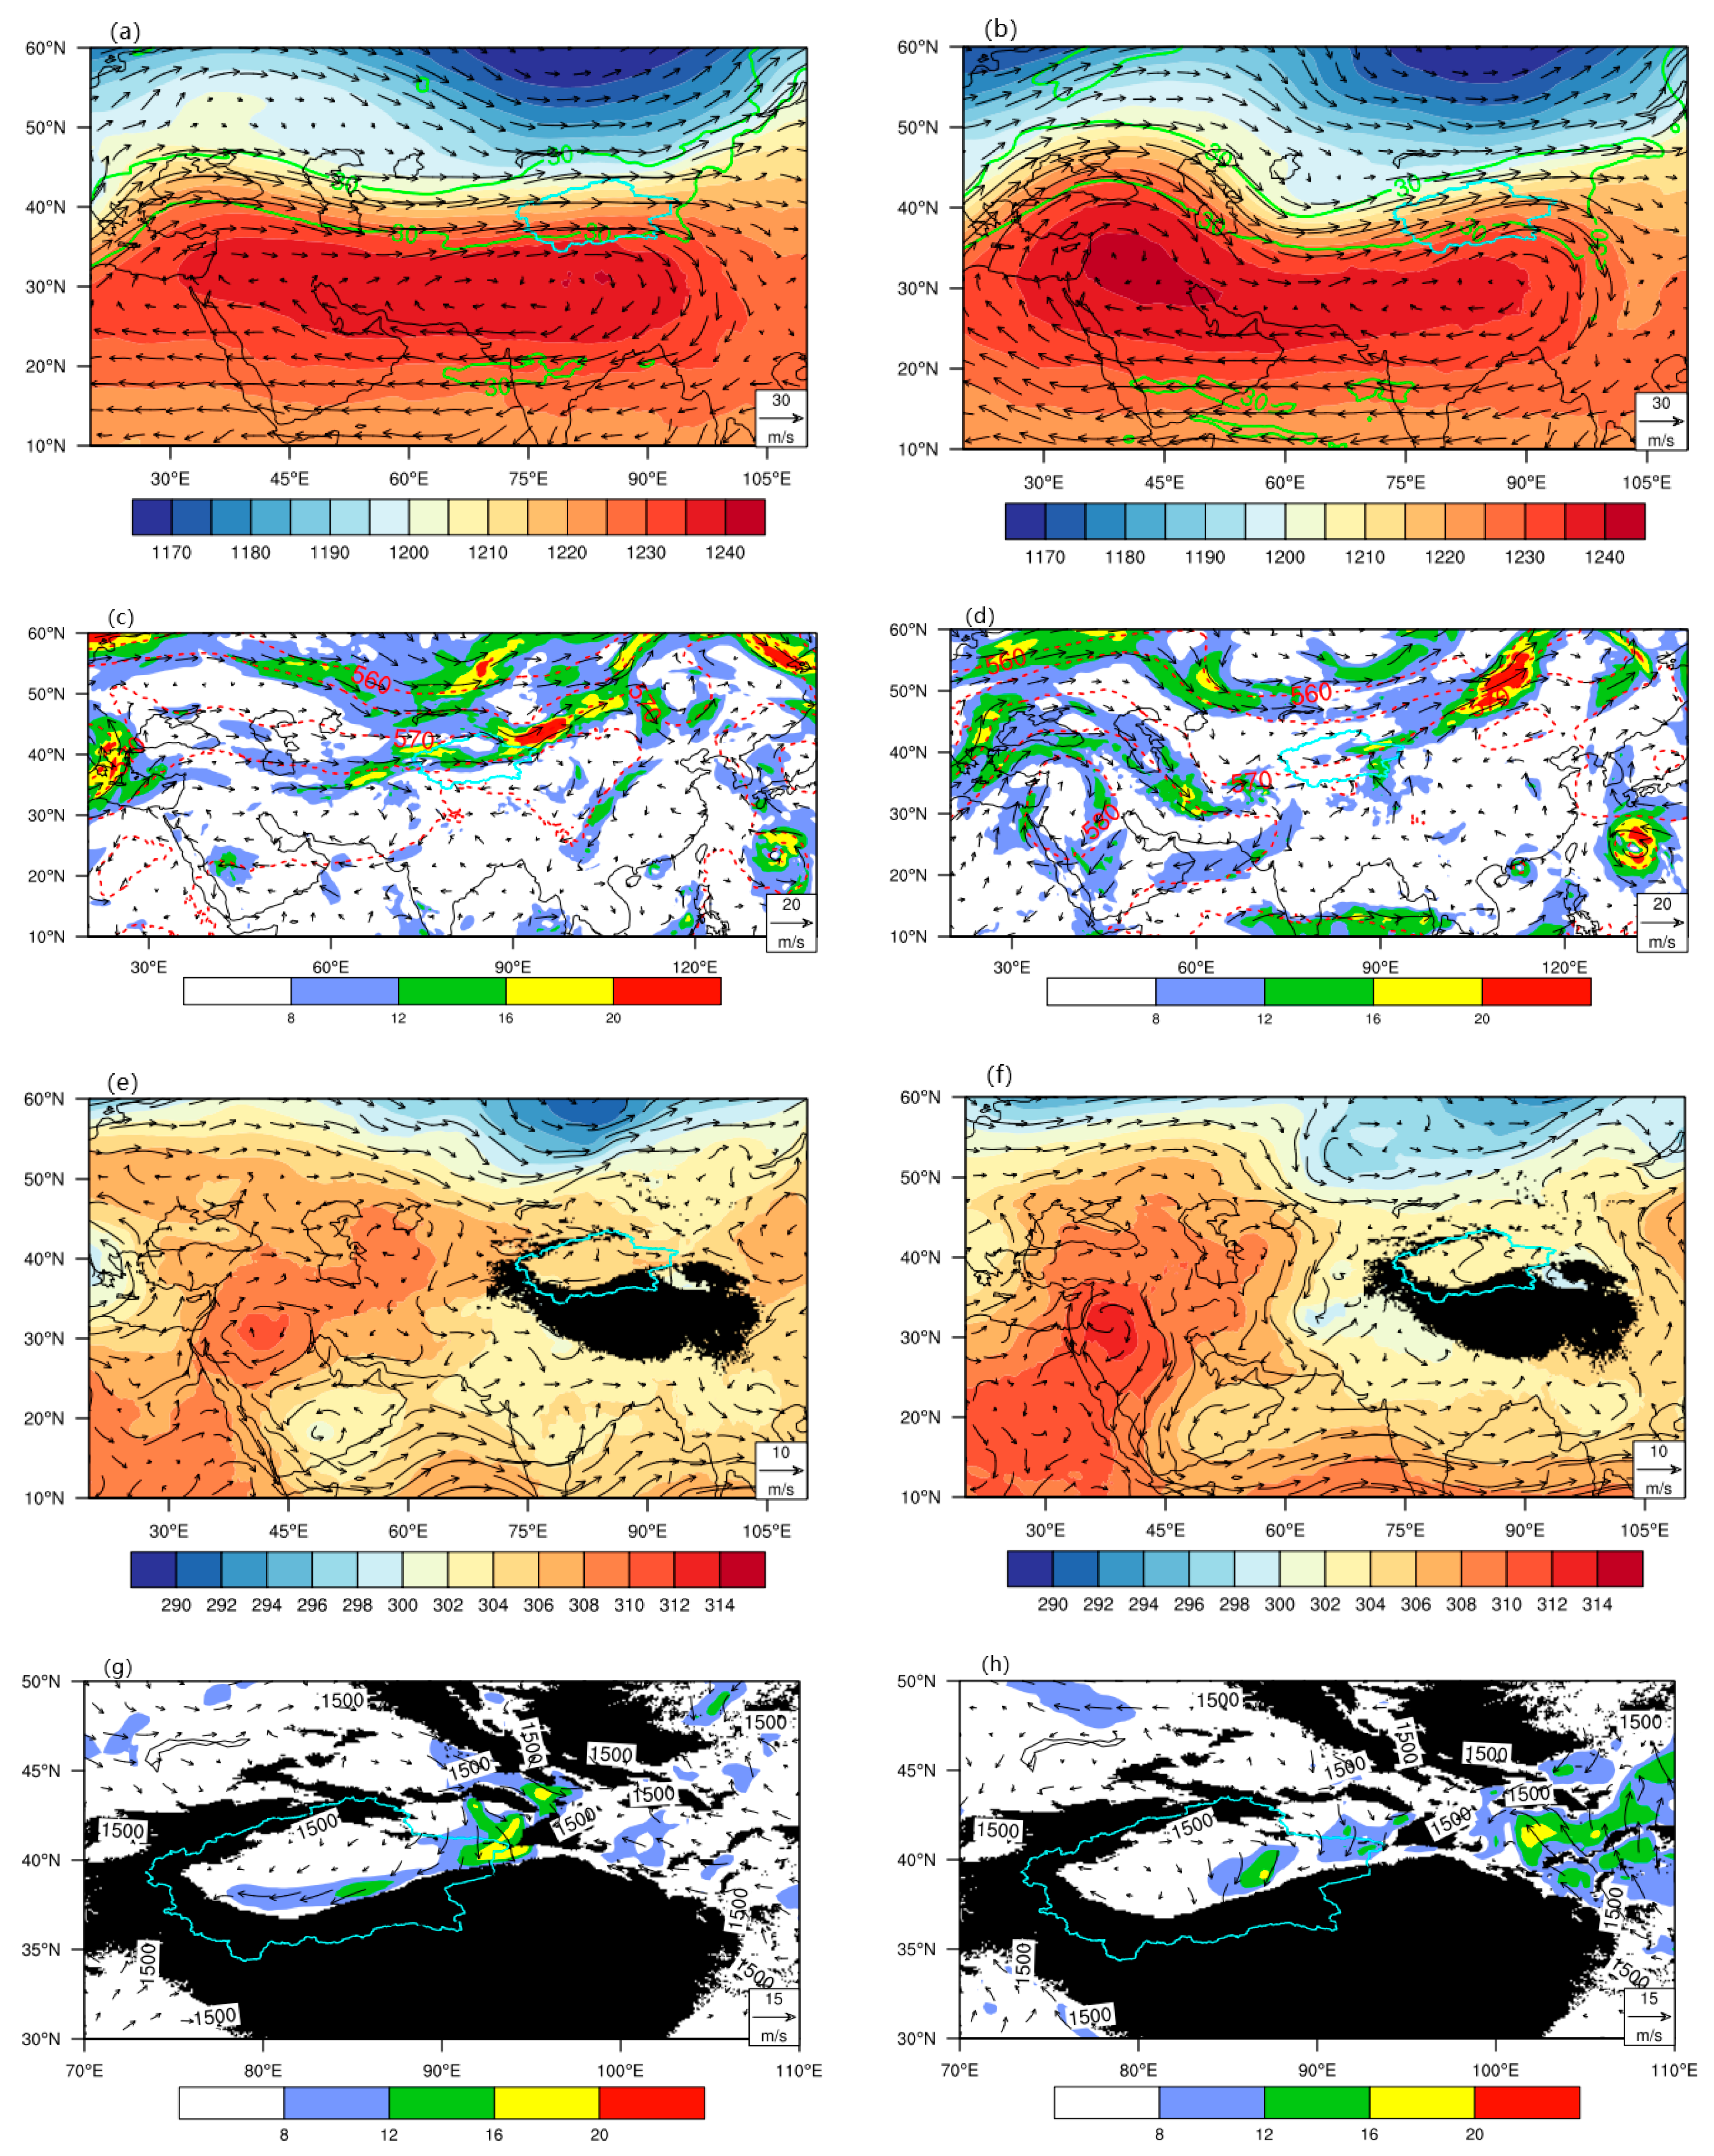
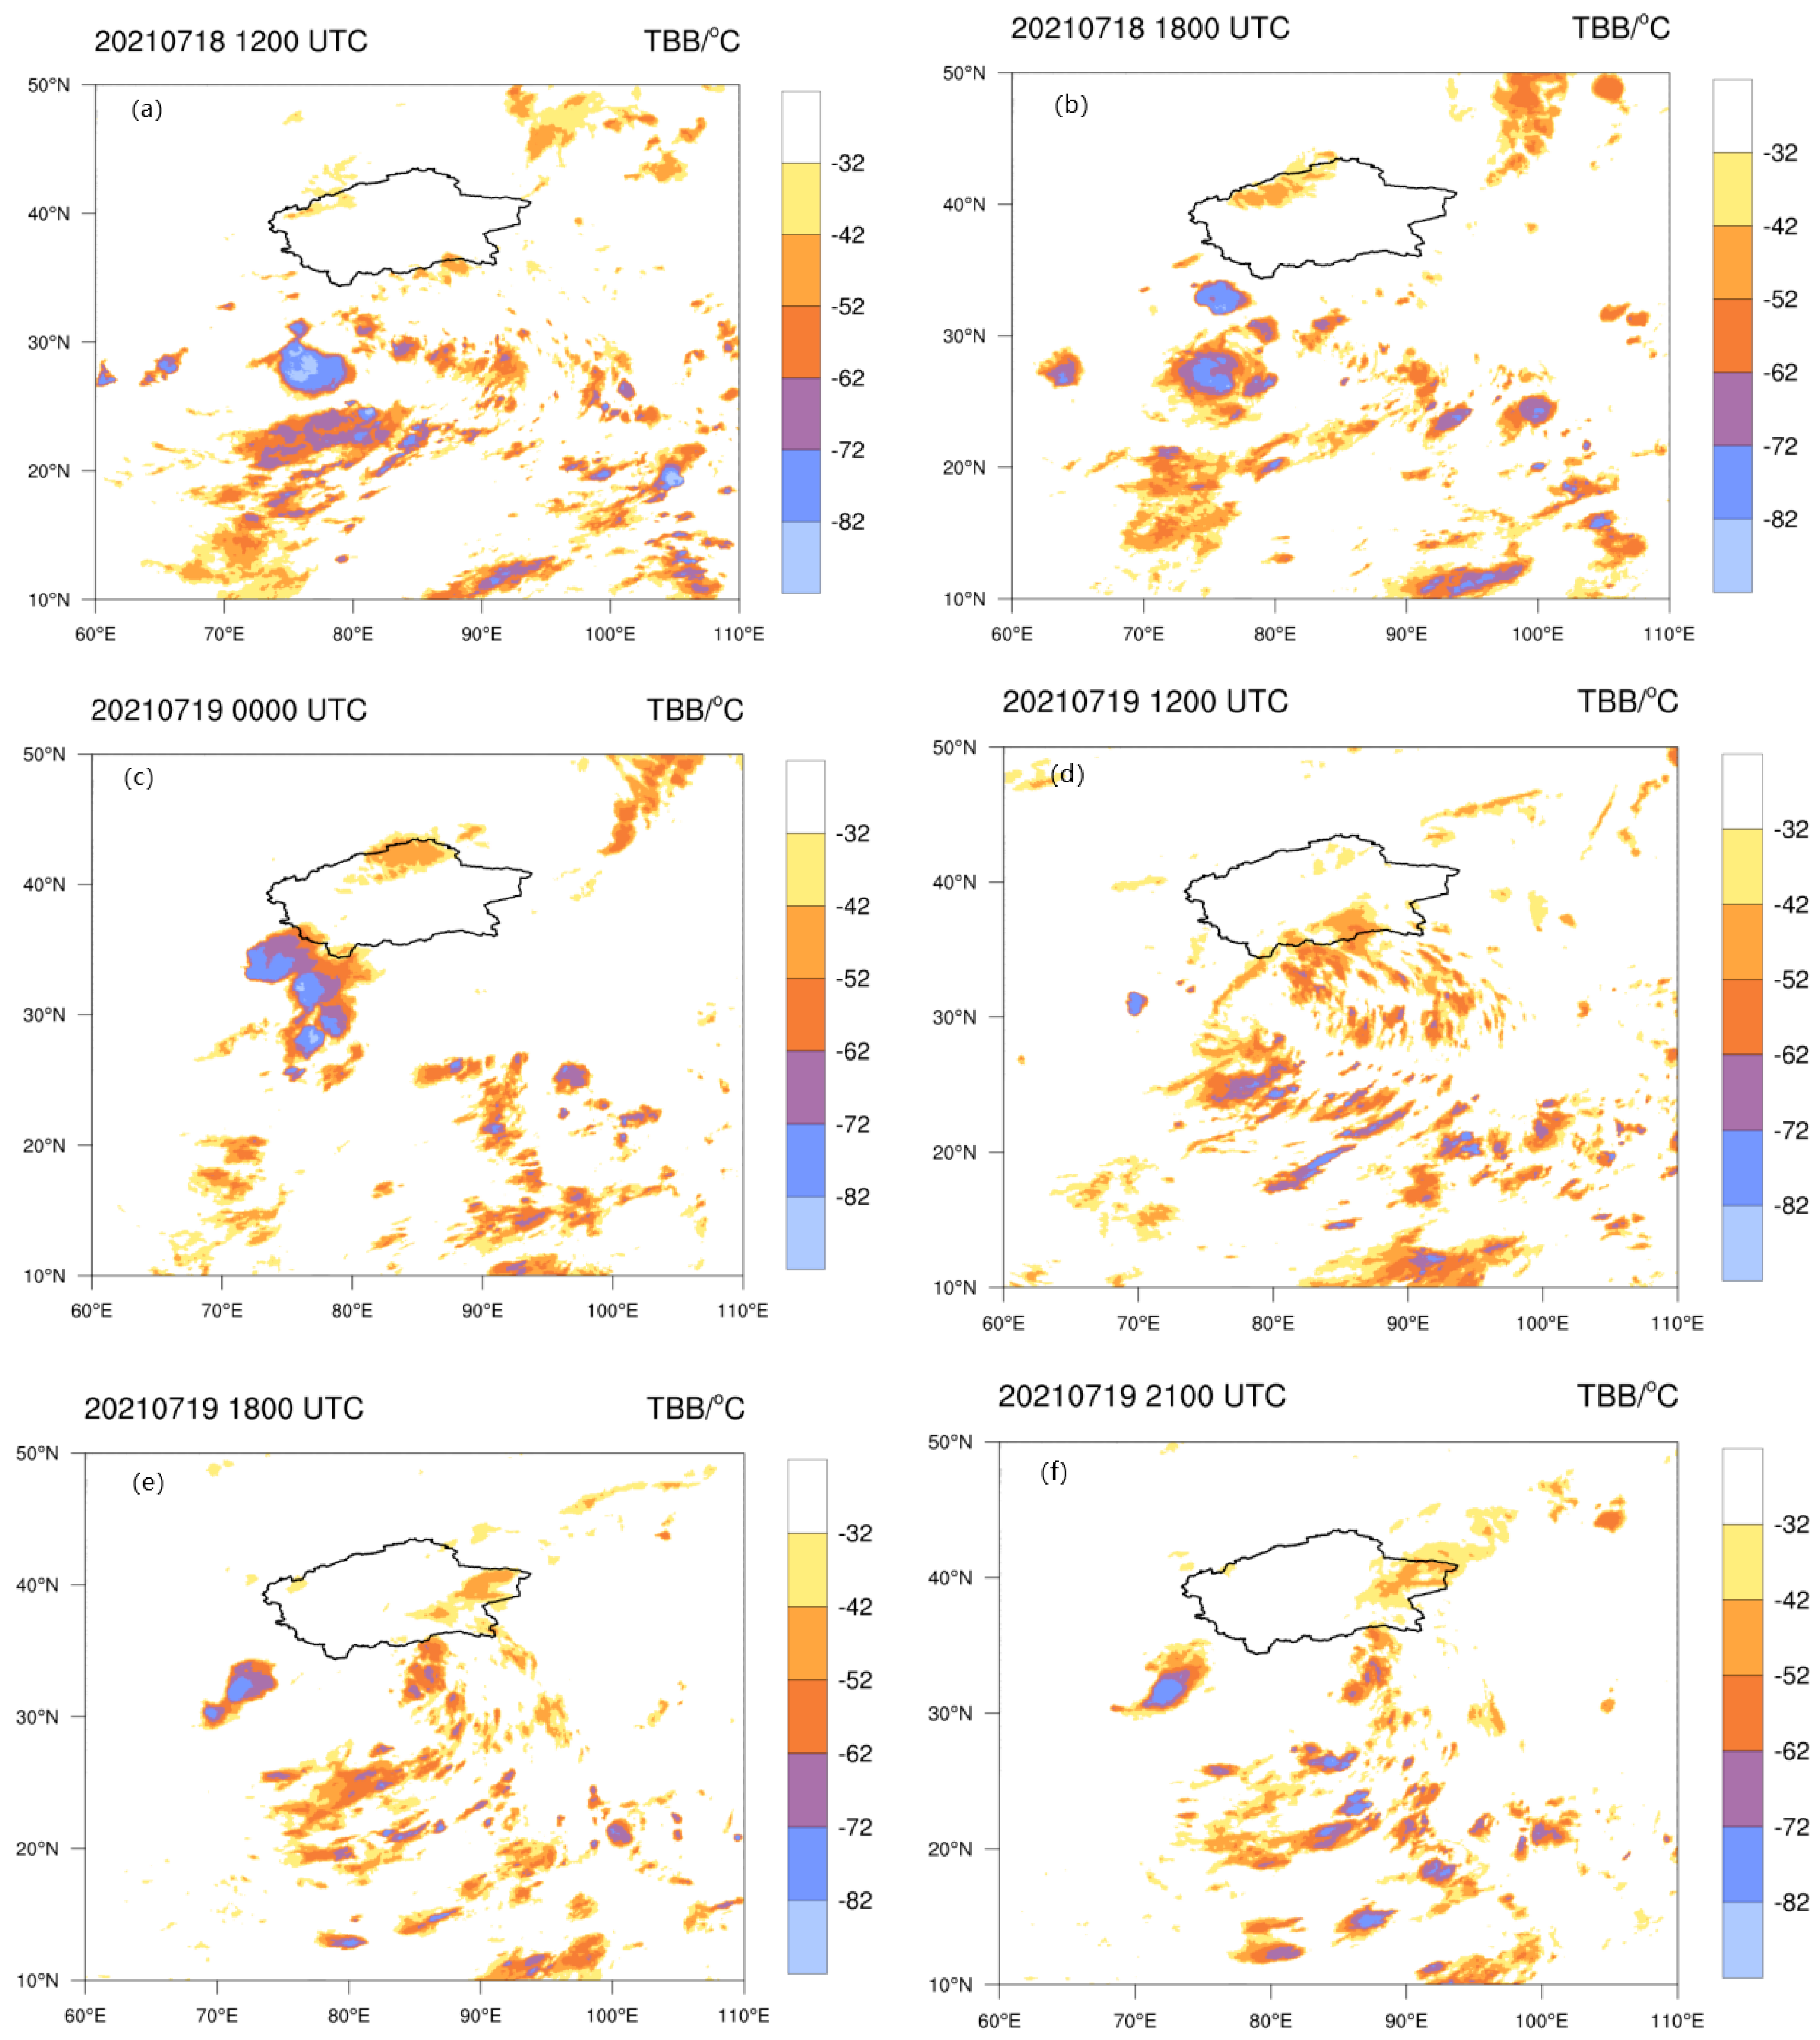
The rainstorm in the Tarim Basin occurred under the background of large-scale circulation with the distribution of a “uniform double body” of the South Asian High at 200 hPa to “high in the west and low in the east”. The upper westerly jet extended south; the upper Iran Ridge, the Central Asian Low Trough and the Baikal Lake Ridge extended at 500 hPa; and the southard extension of the low trough at 700 hPa combined with wind shear led to the rainstorm process. The coupling of the high, middle and low levels of the jet stream and the strong vertical upward movement provided favorable dynamic conditions for the rainstorm. The variation and movement of the TBB intensity are in good agreement with the occurrence and development of heavy rainfall in the basin.
(2)
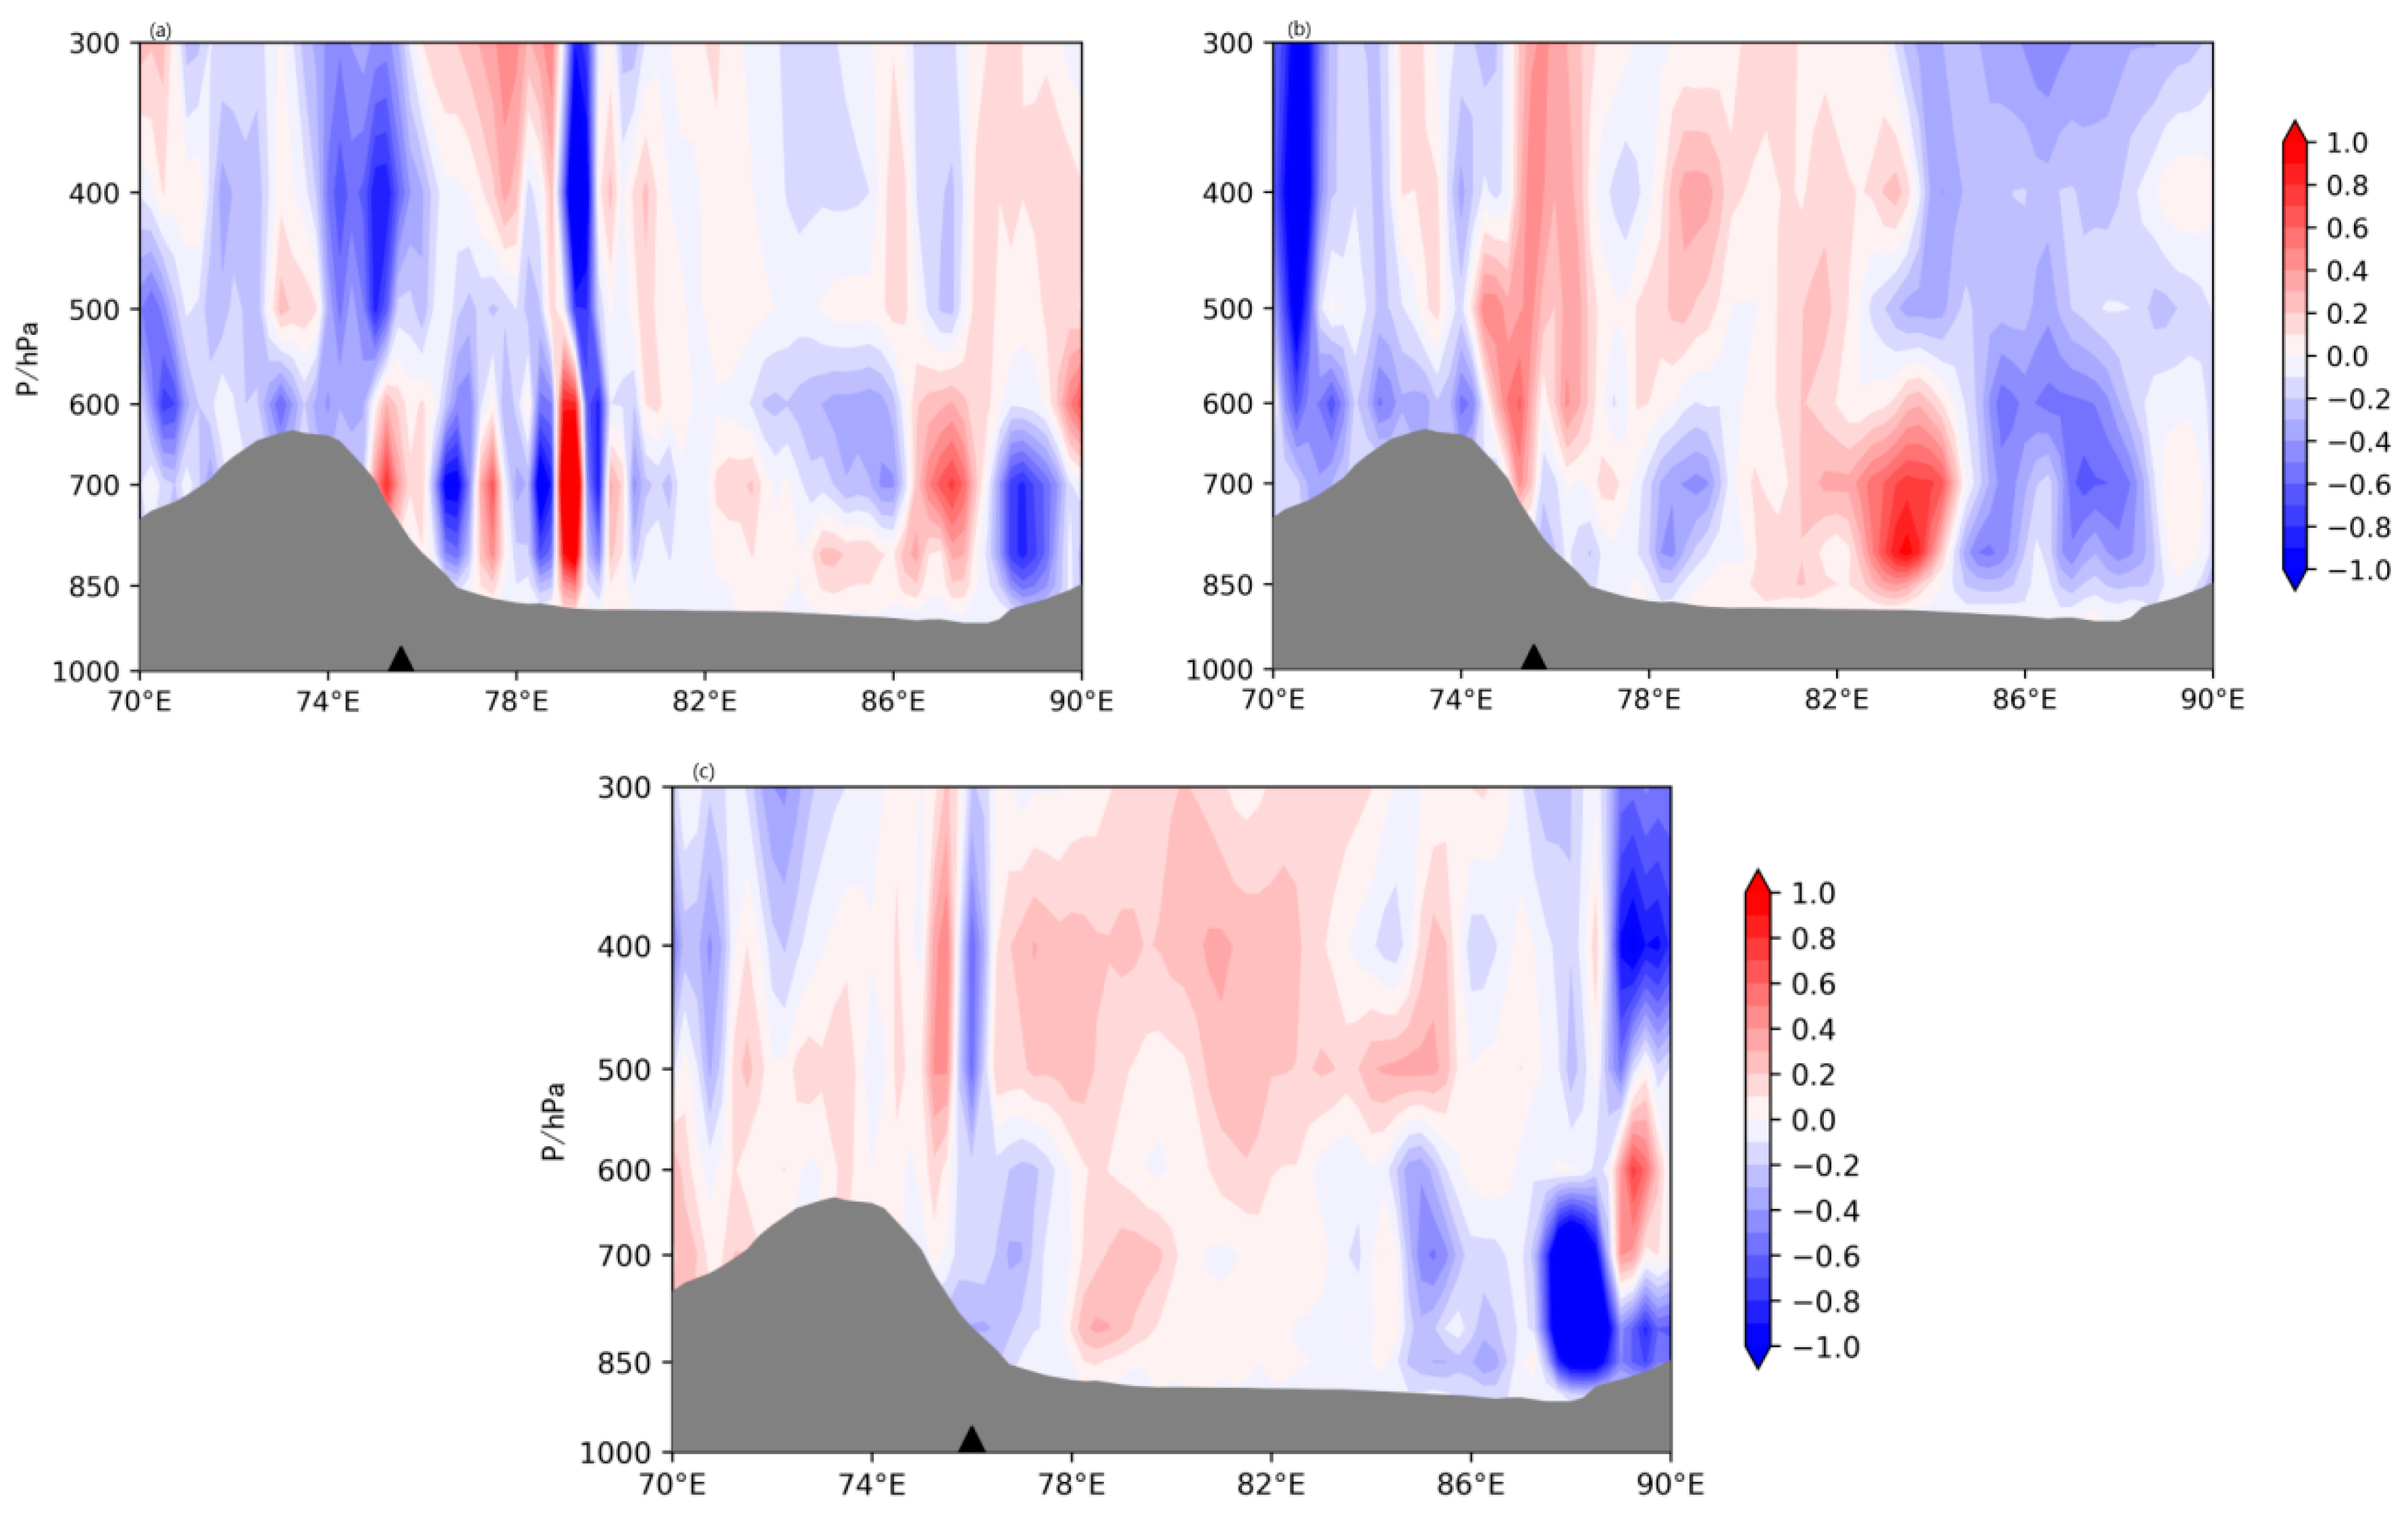
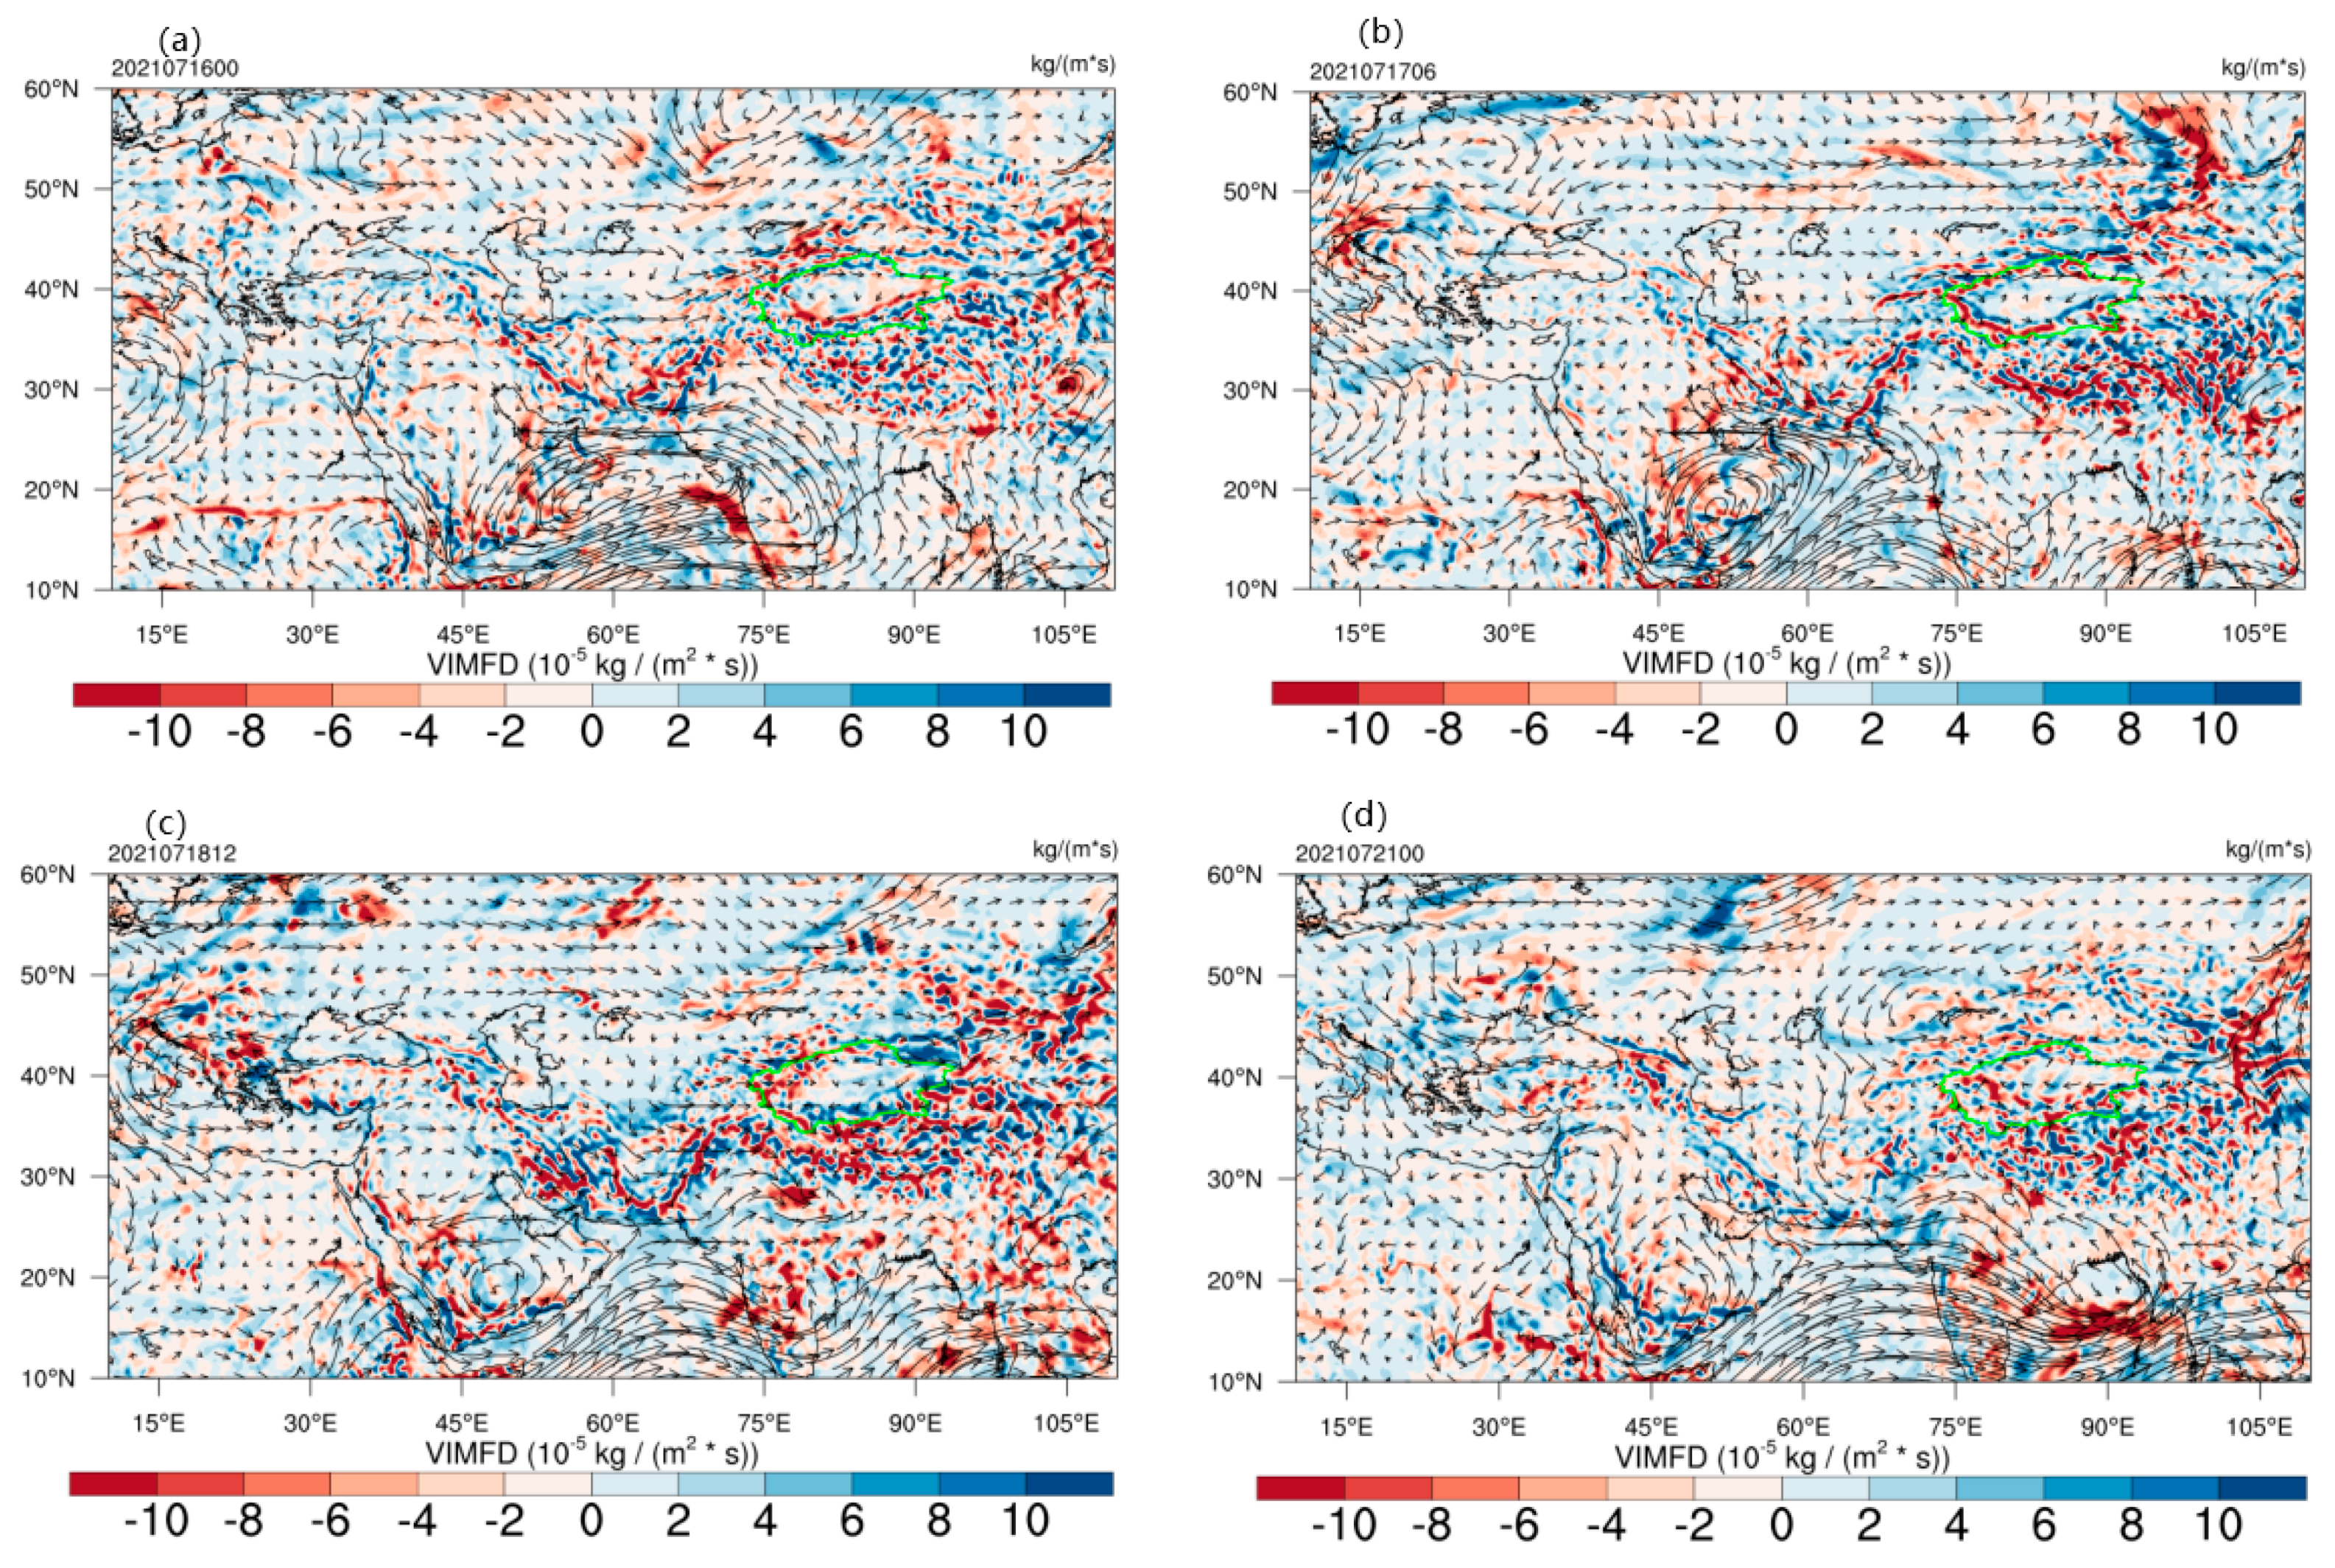
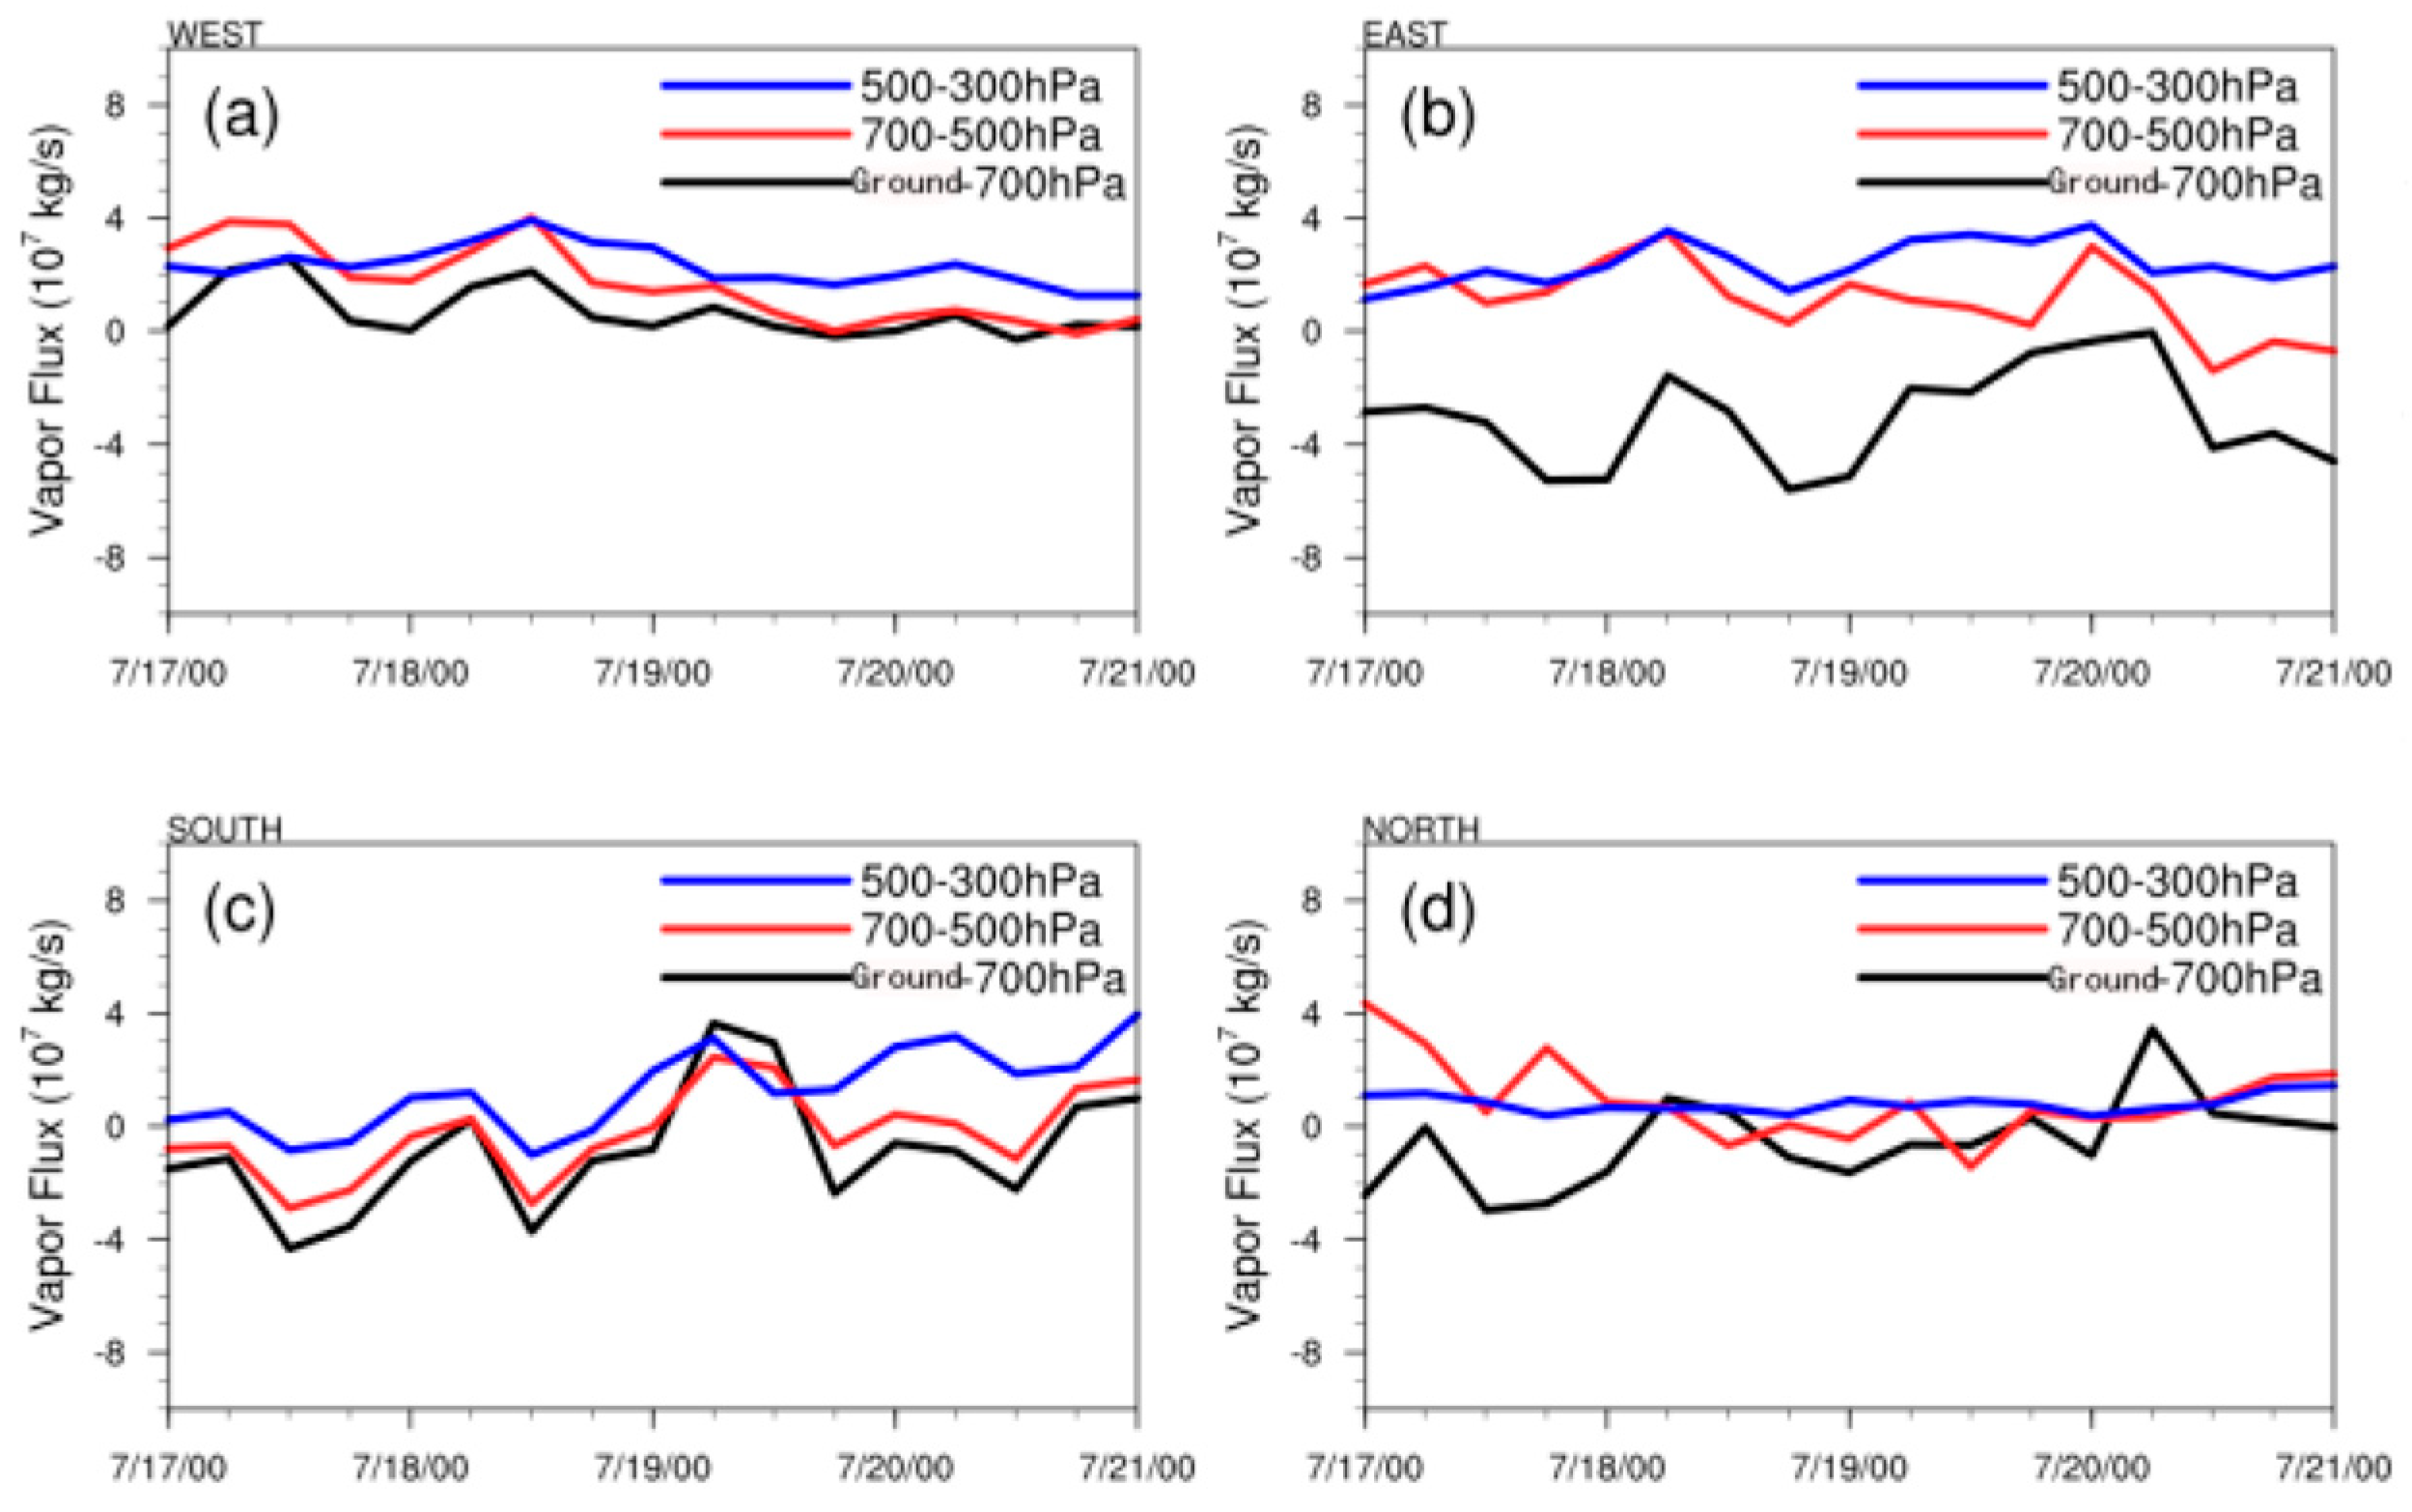
The rainstorm water vapor mainly comes from the Mediterranean Sea, the Arabian Sea, the Bay of Bengal and Central Asia, and it reaches the Tarim Basin along four paths: westward, east-to-west, west-to-east, and southwest and south. At 600–500 hPa, there is a better water vapor channel, and the strong convergence center is located at 500 hPa. Water vapor is mainly imported from 600 to 300 hPa in the west, from 500 to 400 hPa in the south and from 850 to 700 hPa in the east, and outflow is imported from 600 to 300 hPa in the east.
(3)
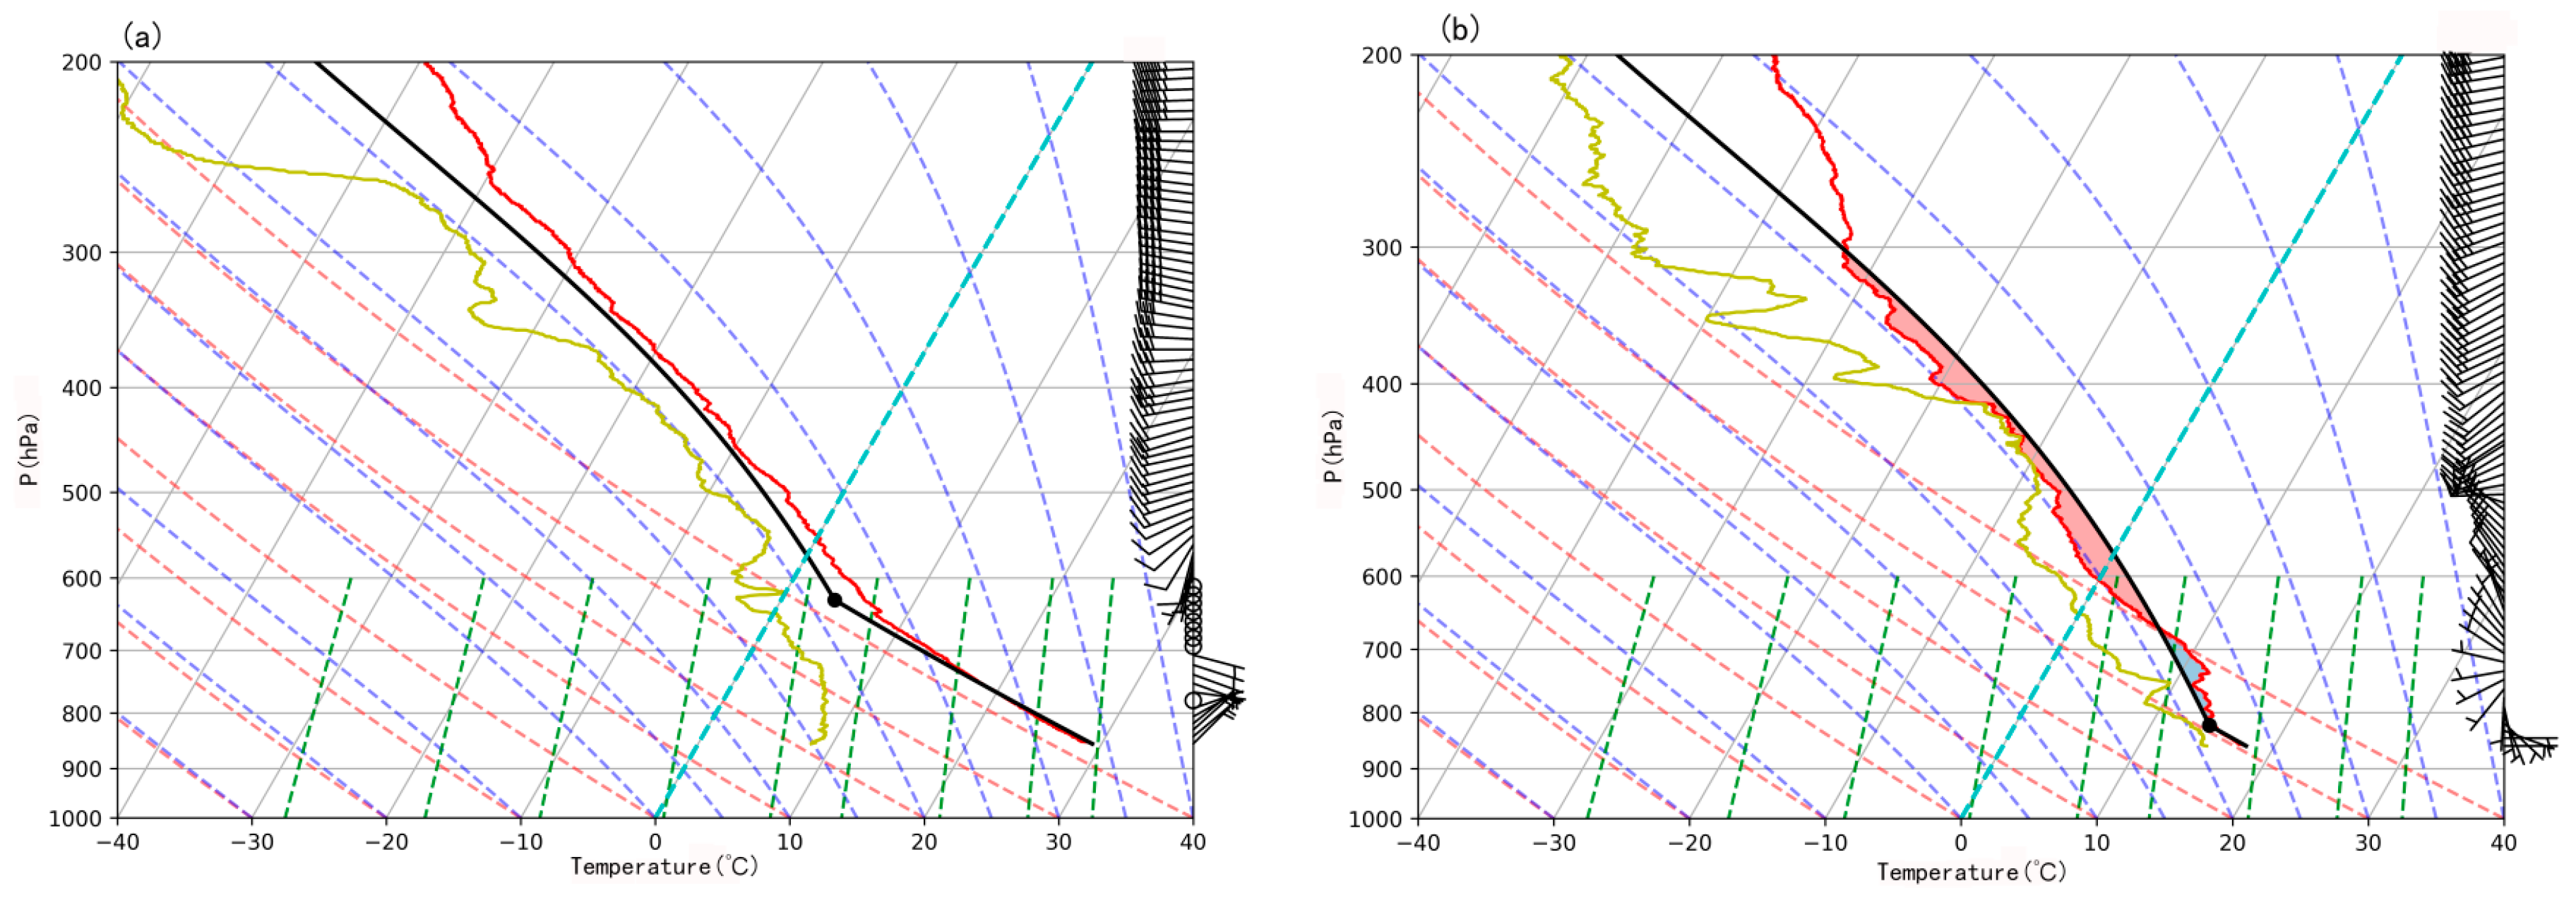
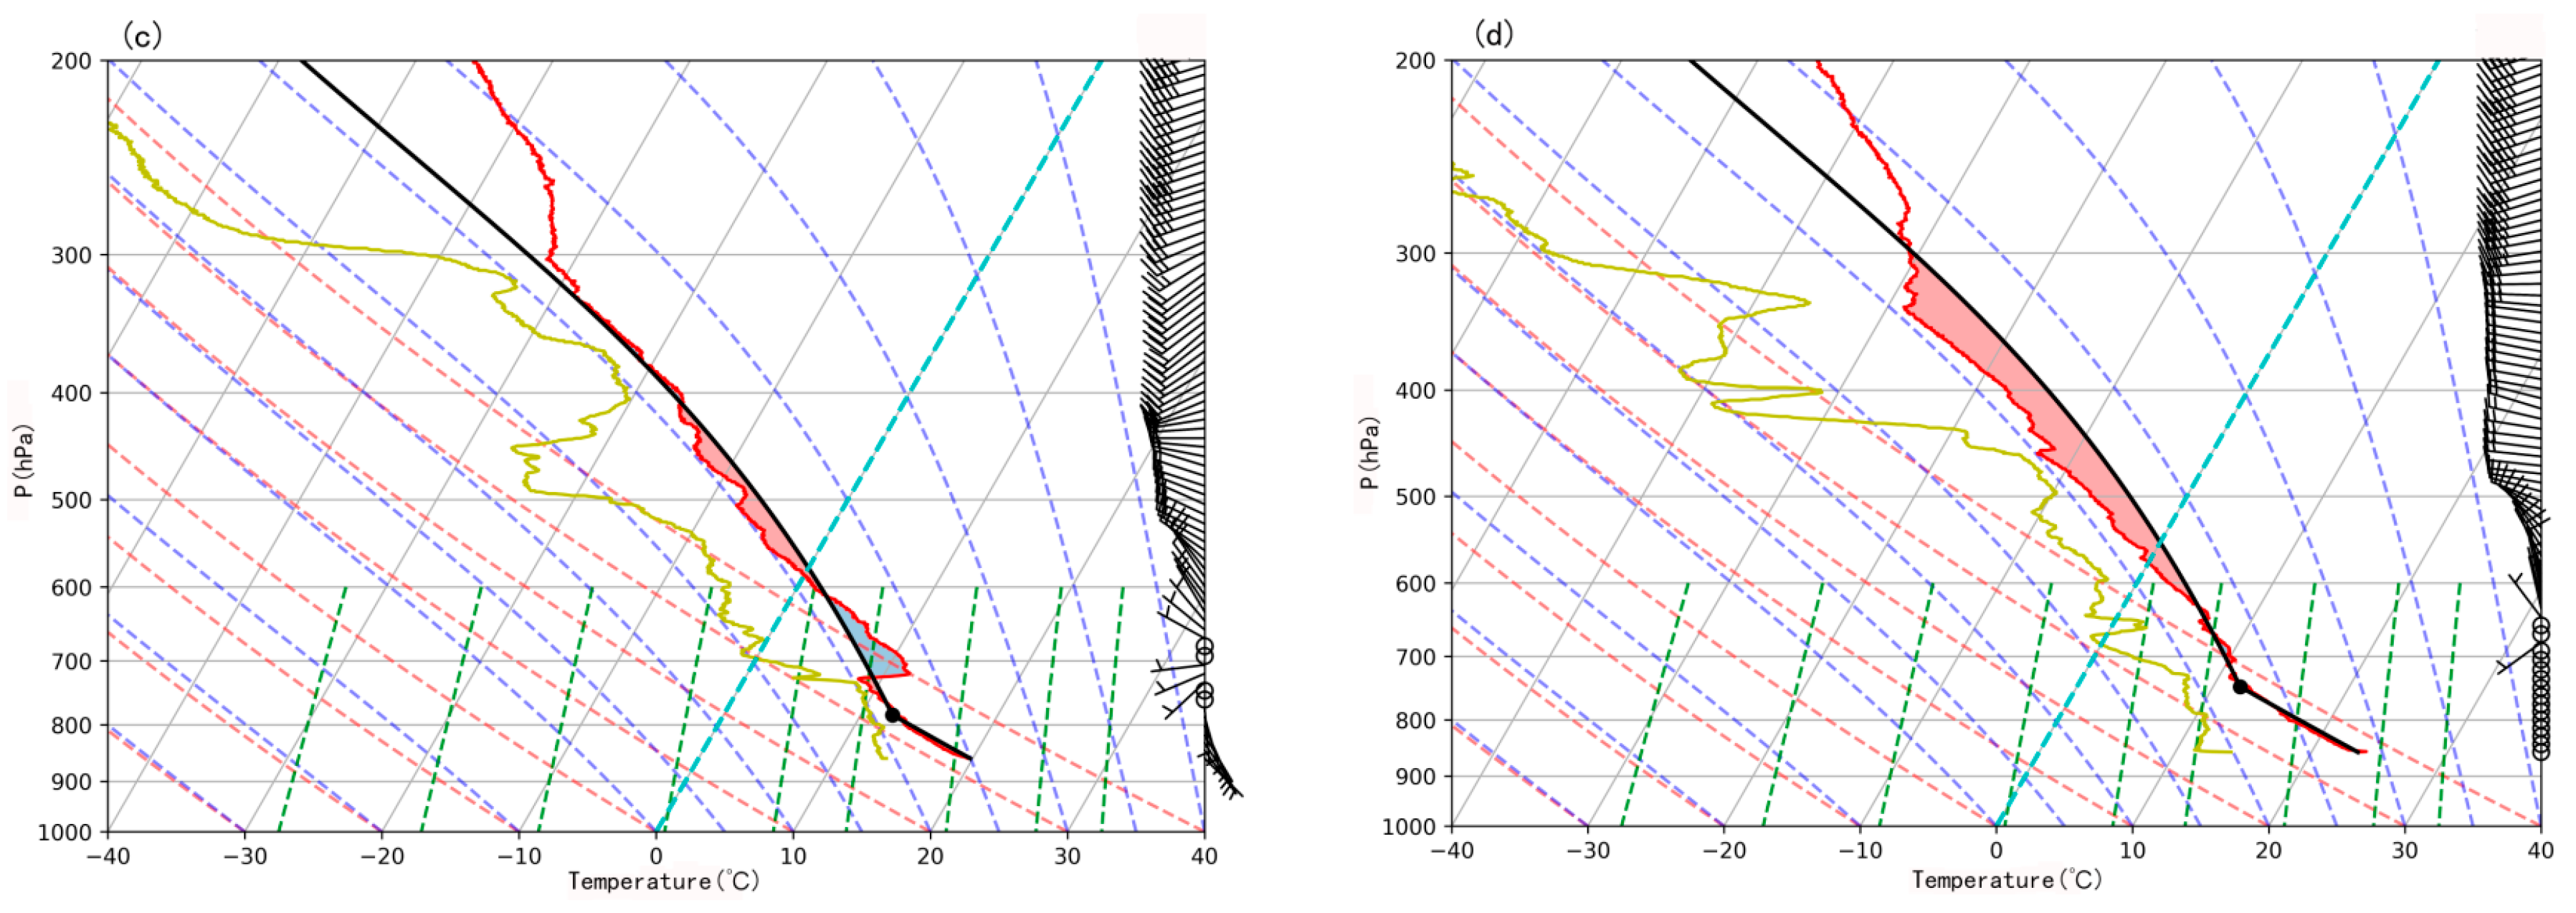
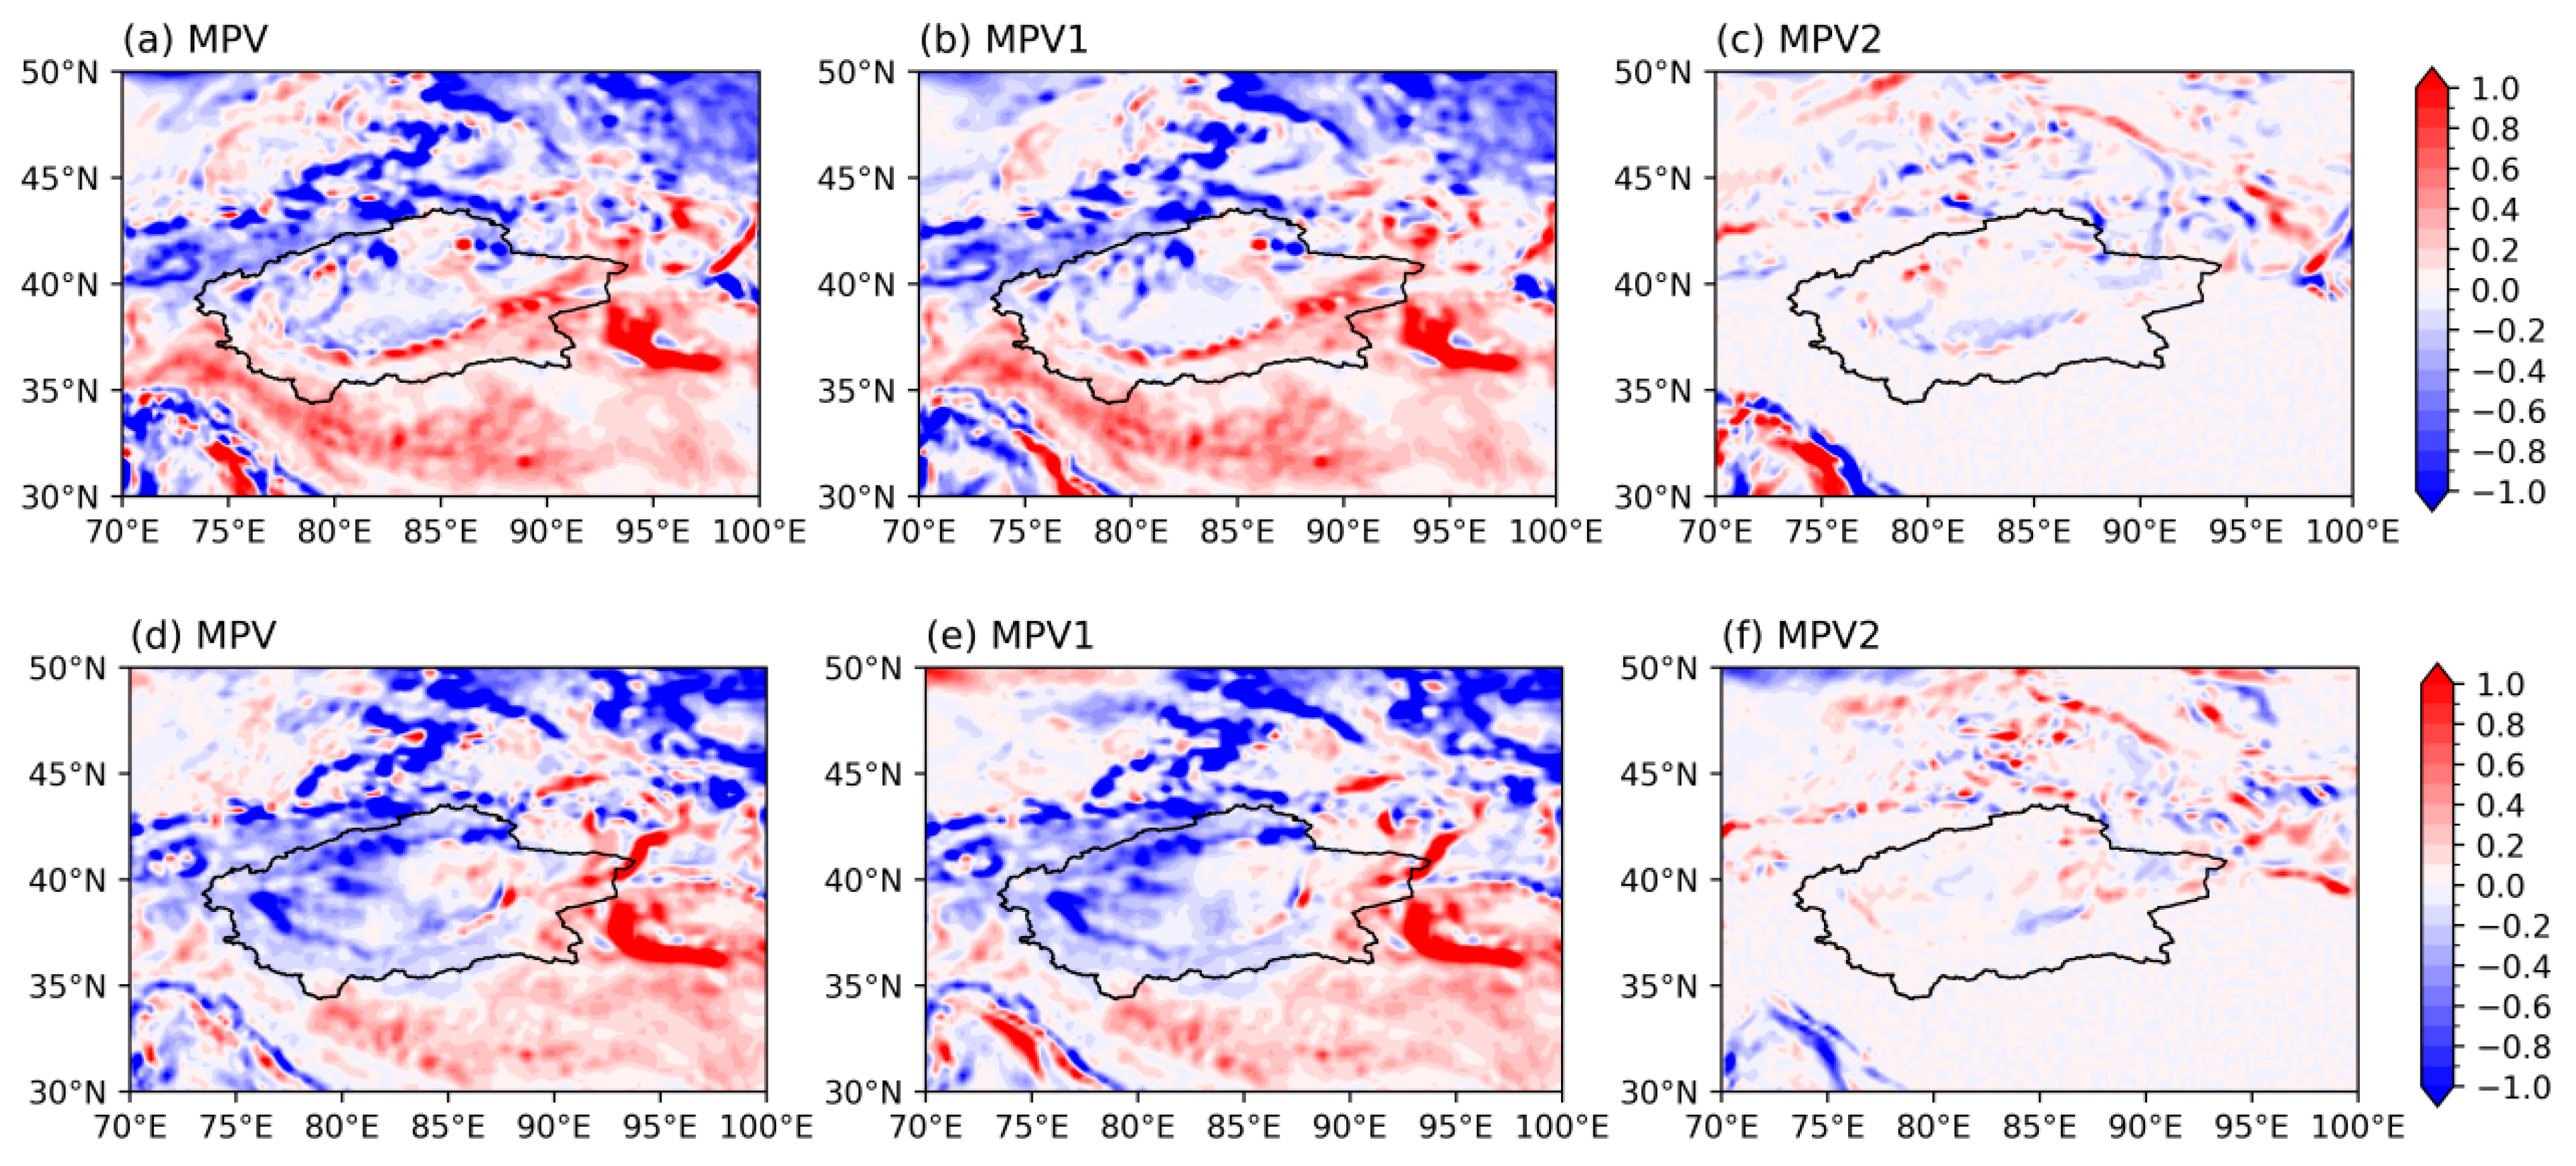
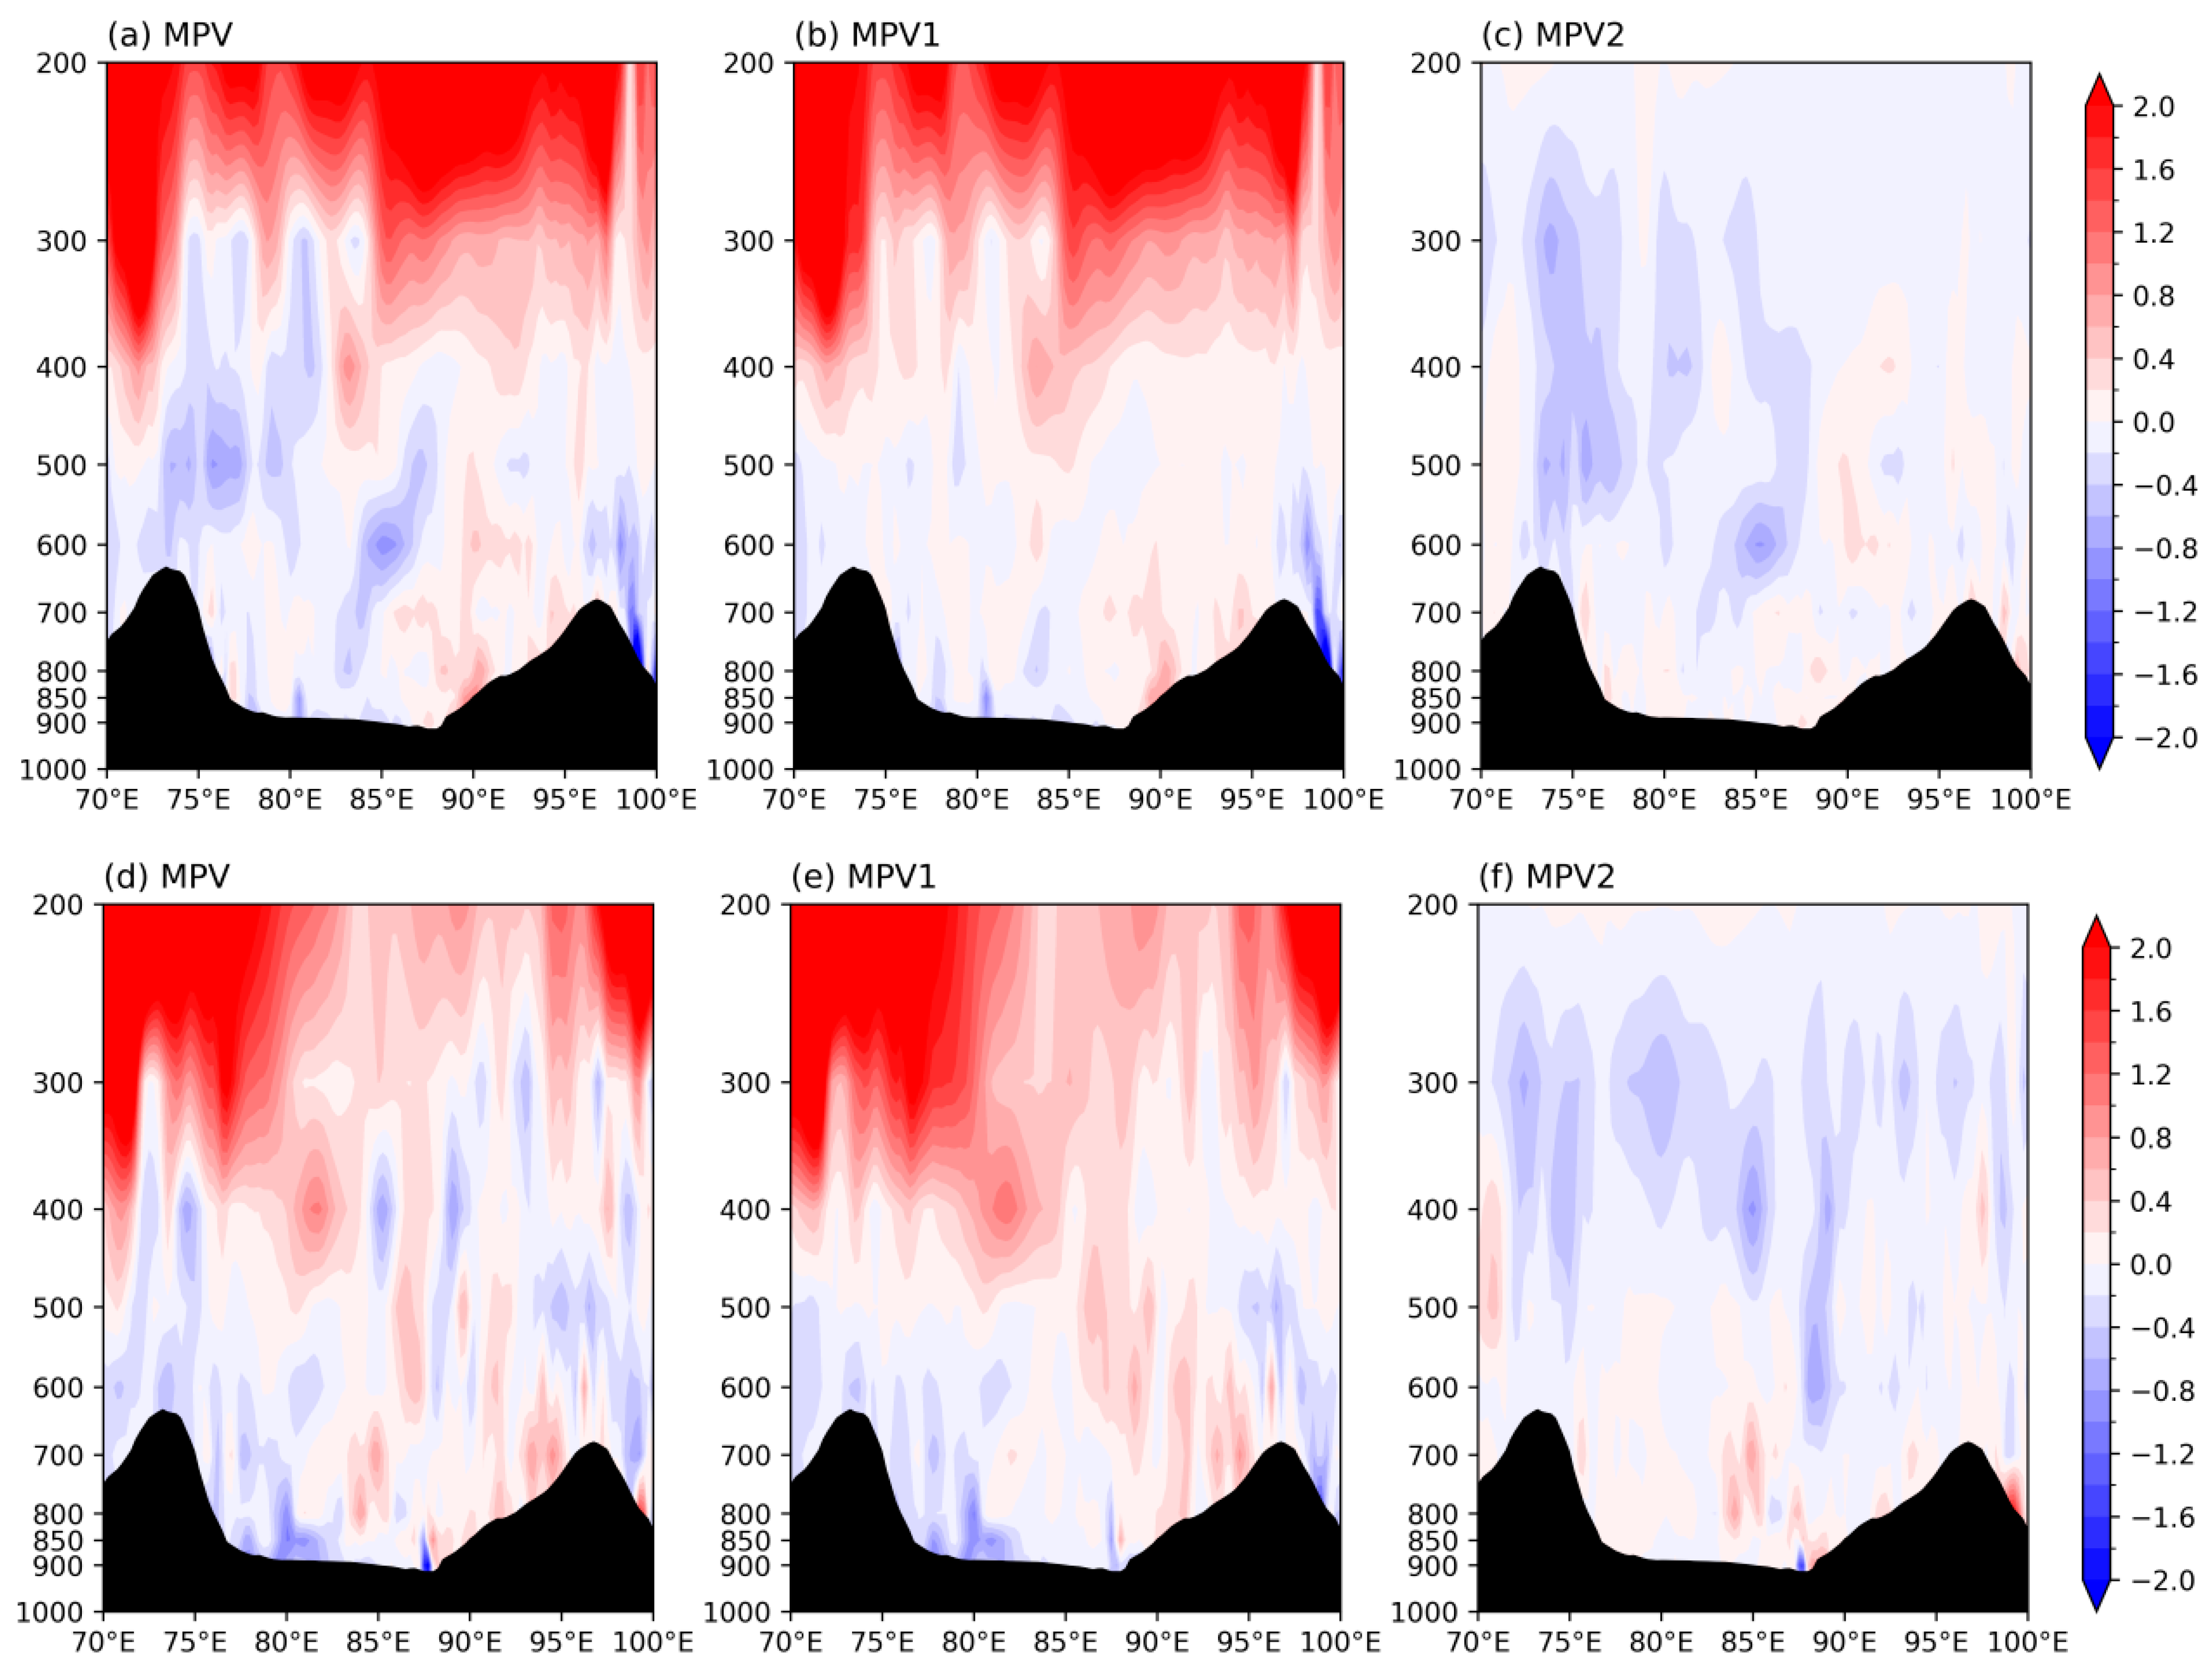
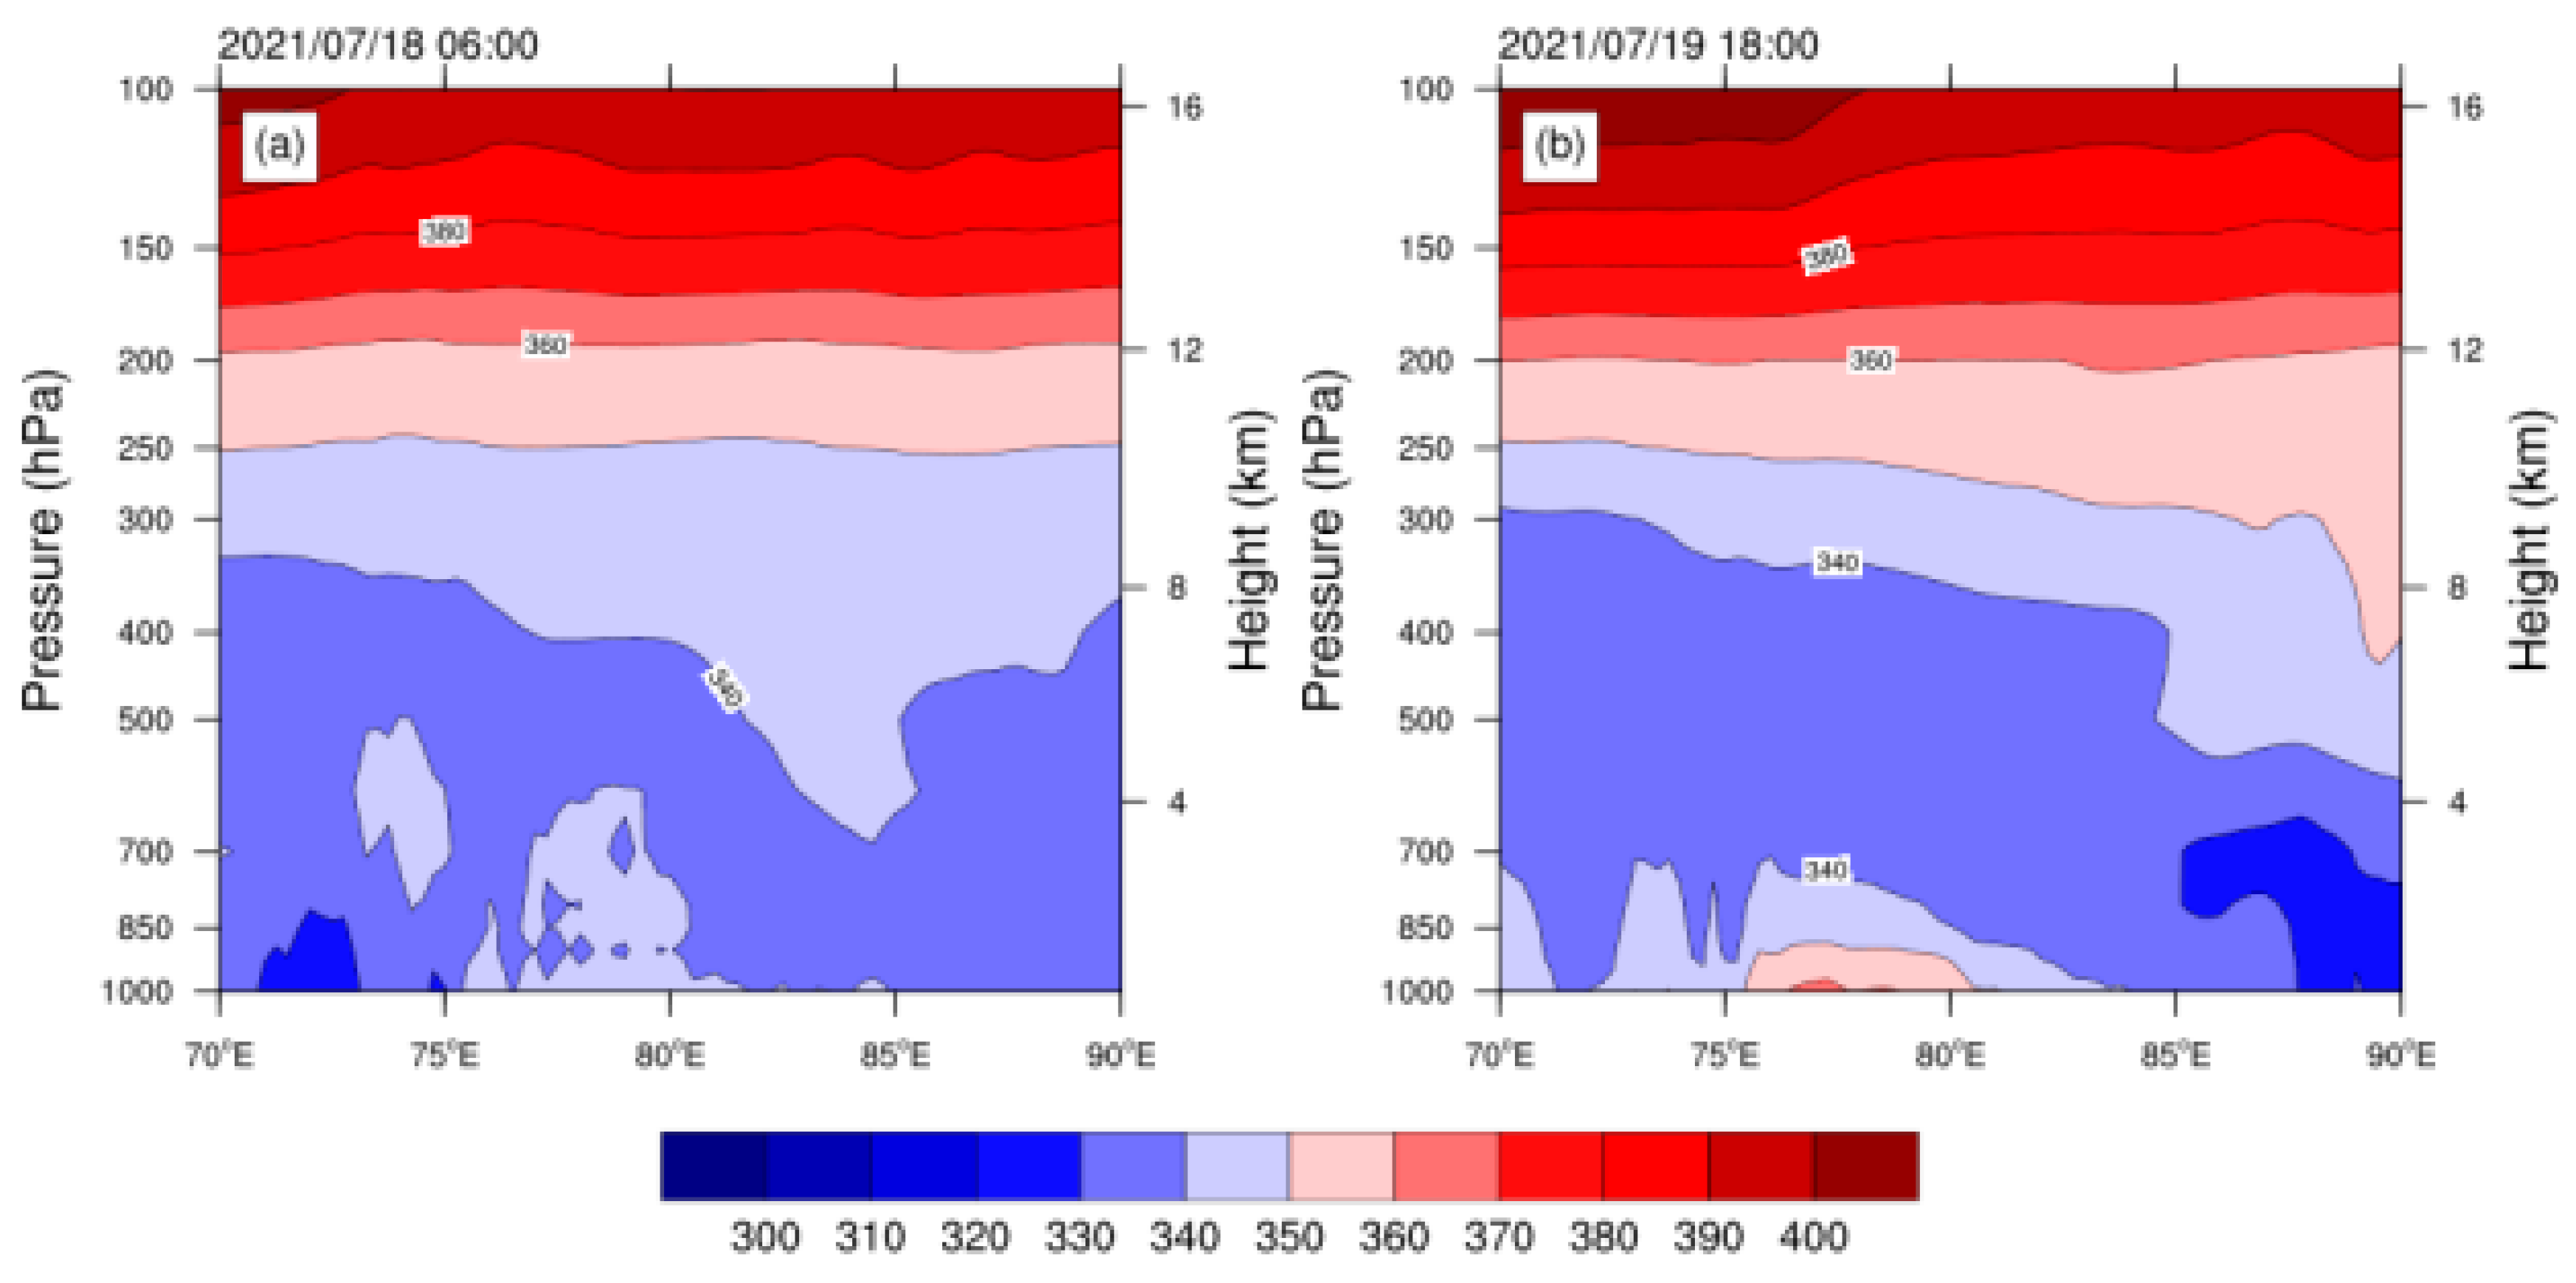
Heavy rainfall occurs in the area with large θse gradient, and the rain band range of heavy rainfall has a good correspondence with the unstable region reflected in the vertical direction of θse. The T-lnp map reflects strong unstable stratification in the vertical direction of the rainstorm area. The intensity variation and movement direction of the negative MPV at a low level have a strong indication on the fall area and occurrence and the development of a rainstorm in the basin, and the superposition of positive and negative MPV regions at vertical height is conducive to the occurrence and development of a rainstorm.
In this paper, the dynamic and thermal structures and water vapor transport characteristics of the rainstorm process in the Tarim Basin are systematically analyzed, but the triggering mechanism of the rainstorm formation is not deeply discussed. The basin is surrounded by mountains, the topography is complex and the effect of topographic uplift on the rainstorm is not clear; this will be the focus of attention in the future. Due to the high mountain, water vapor transport in rainstorm in basin is very complicated, so it needs to be further studied by various methods. The moist potential vortex analysis has a relatively ideal diagnostic effect on the large range of the rainstorm process. However, the indicator results of the moist potential vortex on the local rainstorm have not been analyzed for individual cases, and its indicator significance on the rainstorm needs more individual rainstorm statistics in the later period to prove its diagnostic and forecasting effect. In addition, this paper uses reanalysis data to analyze the system structure, and the obtained results are still based on the synoptic scale background. A more detailed rainstorm system structure needs to be analyzed using numerical simulation results. At present, high-resolution numerical simulation tests are being carried out, and the dynamic and thermodynamic mechanisms of this rainstorm process will continue to be further explored in a later stage.

Author Contributions

Conceptualization, C.J. and Q.H. (Qing He); methodology, C.J. and Q.H. (Qian Huang); software, Q.H. (Qian Huang); validation, C.J.; formal analysis, C.J. and Q.H. (Qing He); resources, Q.H. (Qian Huang); data curation, Q.H. (Qian Huang); writing—original draft preparation, C.J.; writing—review and editing, C.J. and Z.C.; visualization, C.J.; project administration, Q.H. (Qing He). All authors have read and agreed to the published version of the manuscript.

Funding

This research was funded by the National Natural Science Foundation of China, grant number 42030612; the Third Xinjiang Scientific Expedition and Research program, grant number 2021xjkk030501; and the Second Tibetan Plateau Scientific Expedition and Research (STEP) program, grant number 2019QZKK010206.

Institutional Review Board Statement

Not applicable.

Informed Consent Statement

Not applicable.

Data Availability Statement

Some observation data in this paper were obtained from the Xinjiang Meteorological Information Center and the Urumqi Desert Meteorological Institute of China Meteorological Administration. These data are limited and are available from the author with permission. The ERA5 reanalysis data are available at https://cds.climate.copernicus.eu/cdsapp#!/dataset/reanalysis-era5-pressure-levels (accessed on 4 December 2023). The FY-2G satellite data are available at http://satellite.nsmc.org.cn/Po-rtalSite/Data/DataView.aspx (accessed on 4 December 2023). The terrain data can be obtained from https://www.ngdc.noaa.gov/mgg/global/relief/ETOPO2/ETOPO2v2-2006/ETOPO2v2c/netCDF/ (accessed on 4 December 2023).

Acknowledgments

We would like to express heartfelt thanks to the Urumqi Desert Meteorological Institute of China Meteorological Administration and the Nanjing University of Information Science and Technology for their support.

Conflicts of Interest

The authors declare no conflicts of interest.

Appendix A

The Eulerian form of the momentum equation is as follows:
v t + ( v 2 2 + φ ) v × ξ a = α P + F v ,
By solving for vorticity, we can obtain the following vorticity equation:
t ξ a × ( v × ξ a ) = P × α + F ξ ,
In Equation (A2), v is the three-dimensional wind vector, φ is the potential function of the external force, F v is the surface friction, F ζ is the vorticity friction dissipation and ξ a is the absolute vorticity. Let Ω be the angular velocity of the Earth’s rotation,
ξ a = × v + 2 Ω ,
The heat equation, taking into account the release of latent heat and other forms of diabatic heating Q d , can be expressed as follows:
c p T θ d θ d t = L d q d t + Q d ,
The quantities in Equation (A4) are common meteorological quantities, and d d t is defined by the equivalent potential temperature:
θ e = θ exp ( L q c p T ) ,
By substituting this into Formula (A4) and omitting higher-order small quantities, we obtain the following:
d θ e d t = ( t + v   ) θ e = θ e c p T Q d Q ,
By multiplying Equation (A2) by θ e and using the vector relationship, we can obtain the following:
θ e   ×   ( v × ξ a ) =   { θ e × ( v × ξ a ) } ,
θ e × ( v × ξ a ) = v ( ξ a θ e ) + ξ a ( θ e t Q ) ,
We can obtain
( t + v ,   c d o t   , ) ( ξ a   θ e ) + ( ξ a   θ e ) = ( P × α ) θ e +   θ e   F ξ + ξ a   Q ,
Next, by multiplying both sides of the formula by the specific volume α and using the continuity equation, we obtain the following:
d α d t α   v = 0 ,
The following equation can then be obtained:
d P m d t = α ( p × α ) θ e + α θ e F ξ + α ξ a Q ,
In Formula (A9),
P m   = α ξ a     θ e ,
which is the potential vorticity of the moist air.

References

  1. Yuan, Y.F.; Zhai, P.M. Latest understanding of extreme weather and climate events under global warming and urbanization influences. Trans. Atmos. Sci. 2022, 45, 161–166. [Google Scholar]
  2. Sun, G.Q.; Wu, Y.; Li, B.L.; Guo, Y. Impacts of global warming on ecology and meteorology and the related physical mechanisms, evaluation and prediction. Front. Phys. 2022, 10, 1035. [Google Scholar] [CrossRef]
  3. Zeng, J.; Guo, F.; Zhao, C.; Sun, Z.Y.; Zhao, Y.J. Climate change of small oases in the southern margin of Taklimakan Desert in recent 50 years. Arid Zone Geogr. 2014, 37, 948–957. [Google Scholar]
  4. Han, Y.H.; Ma, Z.G.; Yang, Q.; Pan, Z.H. Changing characteristics of daytime and nighttime precipitation in Xinjiang under global warming. Clim. Environ. Res. 2014, 19, 763–772. [Google Scholar]
  5. Wang, S.P.; Jiang, F.Q.; Wu, X.B.; Hu, R.J. Temporal and spatial variability of the extreme precipitation indices overthe arid regions in Northwest China from 1961 to 2010. J. Glaciol. Geocryol. 2014, 36, 318–326. [Google Scholar]
  6. Yang, L.M. Climate Change of Extreme Precipitation in Xinjiang. Acta Geogr. Sin. 2003, 58, 577–583. [Google Scholar]
  7. Dai, X.G.; Ren, Y.Y.; Chen, H.W. Multi-scale feature of climate and climate shift in Xinjiang over the past 50 years. Acta Meteorol. Sin. 2007, 6, 1003–1010. [Google Scholar] [CrossRef]
  8. Wang, C.H.; Li, J.; Li, X.L.; Xu, X.G. Analysis on Quasi periodic Characteristics of Precipitation in Recent 50 Years and Trend in Next 20 Years in China. Arid Zone Res. 2012, 29, 1–10. [Google Scholar]
  9. Chen, C.Y.; Zhao, K.M.; Ablikim, A.; Li, N.; Yu, B.X. Temporal and spatial distributions of hourly rain intensity under the warm background in Xinjiang. Arid Land Geogr. 2015, 38, 692–702. [Google Scholar]
  10. Wang, J.; Li, R.Q.; Huang, Y.; Zhao, K.M.; Li, J.G.; Zhou, Y.M. Cause of a Rare Rainstorm in the West of Southern Xinjiang in 2013. J. Arid Meteorol. 2015, 33, 910–917. [Google Scholar]
  11. Jin, C.; He, Q.; Huang, Q. Effect of Water Vapor Transport on a Typical Rainstorm Process in the Arid Region of Southern Xinjiang: Observations and Numerical Simulations. Remote Sens. 2023, 15, 4082. [Google Scholar] [CrossRef]
  12. Lv, X.S.; Zhou, Y.M.; Yu, X.J.; Yu, B.X.; Wang, X. Temporal and Spatial Variation Characteristics of Rainstorm Flood Disaster Loss in Xinjiang during 1961–2019. Desert Oasis Meteorol. 2021, 15, 42–49. [Google Scholar]
  13. Wang, X.Q.; Wang, X. Spatial distribution and temporal variation characteristics of rainstorm flood disasters with different intensities in southern Xinjiang from 1980 to 2019. J. Glaciol. Geocryol. 2021, 43, 1818–1828. [Google Scholar]
  14. Shen, X.Y.; Sha, S.; Liu, L.K.; Li, X.F. 2018: Research progress on atmospheric multiscale interaction. Torrential Rain Disasters 2018, 37, 197–203. [Google Scholar]
  15. Chen, B.Y.; Min, J.Z. A study on the evolution of vortex system and multi-scale interaction mechanism during the “7·19” rainstorm in North China. J. Trop. Meteorol. 2020, 36, 85–96. [Google Scholar]
  16. Yang, L.M.; Zhang, Q.Y. Circulation characteristics of interannual and interdecadal anomalies of summer rainfall in north Xinjiang. Chin. J. Geophys. Chin. Ed. 2007, 50, 412–419. [Google Scholar]
  17. Zhang, Q.; Qian, Z.A.; Chen, M.L. The further study about South Asia High in summer Ⅰ. Statistic analysis of relationship between it and precipitation distribution over Northwest China. Plateau Meteorol. 1997, 1, 53–63. [Google Scholar]
  18. Zhao, Y.; Wang, Q.; Huang, A.N. Relationship between Iran High Pattern of South Asia High and Summer Precipitation in Xinjiang. Plateau Meteorol. 2018, 37, 651–661. [Google Scholar]
  19. Zhang, Y.; Kuang, X.; Guo, W.; Zhou, T. Seasonal evolution of the upper-tropospheric westerly jet core over East Asia. Geophys. Res. Lett. 2006, 33, L11708. [Google Scholar] [CrossRef]
  20. Zhao, Y.; Wang, M.; Huang, A.; Li, H.; Huo, W.; Yang, Q. Relationships between the West Asian subtropical westerly jet and summer precipitation in northern Xinjiang. Theor. Appl. Climatol. 2014, 116, 403–411. [Google Scholar] [CrossRef]
  21. Liu, Y.Y.; He, J.H.; Wang, Q.Q. Analysis of temporal spatial features and circulation characteristics of summer precipitation in Xinjiang. J. Nanjing Inst. Meteorol. 2006, 29, 24–32. [Google Scholar]
  22. Yang, L.M.; Shi, Y.G.; Tang, H. Characteristic of atmospheric circulation and water vapor spring precipitation anomaly in Xinjiang. Plateau Meteorol. 2010, 29, 1464–1473. [Google Scholar]
  23. Yang, L.M.; Guan, X.F.; Zhang, Y.X. Study on atmospheric circulation characteristics of precipitation anomalies in arid region of Central Asia. Arid Zone Res. 2018, 35, 249–259. [Google Scholar]
  24. Lu, X.; Zhao, Y.; Wang, T.Z. Analysis on the circulation differences of summer rainfall over Xinjiang. Desert Oasis Meteorol. 2021, 15, 84–90. [Google Scholar]
  25. Ma, Q.; Zhang, J.; Game, A.T.; Chang, Y.; Li, S. Spatiotemporal variability of summer precipitation and precipitation extremes and associated large-scale mechanisms in Central Asia during 1979–2018. J. Hydrol. X 2020, 8, 100061. [Google Scholar] [CrossRef]
  26. Li, M.J. Analysis of Precipitation Distribution over Xinjiang and the Dynamic Characteristics of Meso and Mirco Scale Precipitation. Master’s Thesis, Nanjing University of Information Science and Technology, Nanjing, China, 4 June 2014. [Google Scholar]
  27. Sun, Y.S. The Relationship between Low-Level Jet and Heavy Precipitation in Xinjiang. Master’s Thesis, Nanjing University of Information Science and Technology, Nanjing, China, 10 June 2019. [Google Scholar]
  28. Yang, X.; Zhou, H.K. Analysis of the Difference between Rainstorm Accompanied by Easterly Low-level Jet in Tarim and Rainstorm without Easterly Low-level Jet in Tarim in Southern Xinjiang. Plateau Meteorol. 2023, 42, 1492–1503. [Google Scholar]
  29. Feng, Y.; Niyazi, A.; Yunusi, R. Cause Analysis of an Extreme Heavy Rainstorm Process on July 31 of 2018 in Hami of Xinjiang. J. Arid Meteorol. 2021, 39, 426–435+456. [Google Scholar]
  30. Zeng, Y.; Yang, L.M. 2017: Comparative analysis on mesoscale characteristics of two severe short-time precipitation events in the west of southern Xinjiang. Torrential Rain Disasters 2017, 36, 410–421. [Google Scholar]
  31. Zhang, Q.; Zhu, B.; Yang, J.; Ma, P.; Liu, X.; Lu, G.; Wang, Y.; Yu, H.; Liu, W.; Wang, D. New characteristics about the climate humidification trend in Northwest China. Chin. Sci. Bull. 2021, 66, 3757–3771. [Google Scholar] [CrossRef]
  32. Zhang, Q.; Yang, J.; Duan, X.; Ma, P.; Lu, G.; Zhu, B.; Liu, X.; Yue, P.; Wang, Y.; Liu, W. The eastward expansion of the climate humidification trend in northwest China and the synergistic influences on the circulation mechanism. Clim. Dyn. 2022, 59, 2481–2497. [Google Scholar] [CrossRef]
  33. Zhang, J.L.; Li, H.Q.; Tang, H. Preliminary analysis of the synergistic influence of westerly wind and indian monsoon on rainstorm over Tarim Basin. Trans. Atmos. Sci. 2023, 46, 242–258. [Google Scholar]
  34. Wang, C.X.; Deng, L.T.; Fan, G.Z.; Li, Z.C.; Zhou, D.W. Diagnostic Analysis of Convective Symmetric Instability During a Banded Precipitation Process in North China. Meteor. Mon. 2018, 44, 1518–1528. [Google Scholar]
  35. Sun, J.S.; Tao, Z.Y. Some Essential Issues Connected with Severe Convective Weather Analysis and Forecast. Meteor. Mon. 2012, 38, 164–173. [Google Scholar]
  36. Zhang, J.C.; Wang, H.X.; Tao, Z.Y. Statistical analysis of predicting skill of Convective Available Potential Energy. Torrential Rain Disasters 2014, 33, 290–296. [Google Scholar]
  37. Ye, L.; Zhang, M.; Zhao, D.C.; Xu, S.Y.; Shao, X.F. The statistical analysis of thunderstorm convective available potential energy in East China. J. Anhui Agric. Sci. 2015, 43, 160–162+285. [Google Scholar]
  38. Liu, J.; Zhou, Y.M.; Yang, L.M.; Zeng, Y.; Liu, W. The Instability and its Trigger Mechanism of Extreme Precipitation Event in the Yili River Valley on 31 July 2016. Chin. J. Atmos. Sci. 2019, 43, 1204–1218. [Google Scholar]
  39. Li, J.N.; Pan, X.B.; Zang, Z.L.; Zhao, D.C.; Min, S. Diagnostic analysis of moist potential vorticity for a rainstorm in North China. Torrential Rain Disasters 2016, 35, 158–165. [Google Scholar]
  40. Xiao, Y.Q.; Shen, X.Y.; Zhang, X.L.; Yang, Y.Y.; Zhang, J.R.; Zhang, C.; Li, X.F. Diagnostic analysis of moist potential vorticity for two local rainstorm events on the eastern foot of Helan Mountain. Torrential Rain Disasters 2020, 39, 148–157. [Google Scholar]
  41. Zhang, J.; Zhou, Y.S.; Shen, X.Y.; Li, X.F. Evolution of Dynamic and Thermal Structure and Instability Condition Analysis of the Extreme Precipitation System in Beijing-Tianjin-Hebei on July 19 2016. Chin. J. Atmos. Sci. 2019, 43, 930–942. [Google Scholar]
  42. Guo, D.M.; Pan, L.J.; Shi, Y.Q.; Hu, Q.Y.; Wu, L.R.; Liu, J.H.M.; Tao, J.L. Analysis of a Rare Autumn Rainstorm behind Cold Front in Xi’an. Plateau Meteorol. 2020, 39, 986–996. [Google Scholar]
  43. Liu, L.; Ran, L.K.; Zhou, Y.S.; Gao, S.T. Analysis on the Instability and Trigger Mechanism of Torrential Rainfall Event in Beijing on 21 July 2012. Chin. J. Atmos. Sci. 2015, 39, 583–595. [Google Scholar]
  44. Huang, X.; Zhou, Y.S.; Ran, L.K.; Ullah, K.; Zeng, Y. Analysis of the Environmental Field and Unstable Conditions on A Rainstorm Event in the Ili Valley of Xinjiang. Chin. J. Atmos. Sci. 2021, 45, 148–164. [Google Scholar]
  45. Ren, Z.H.; Zhao, P.; Zhang, Q.; Zhang, Z.F.; CAo, L.J.; Yang, Y.R.; Zou, F.L.; Zhao, Y.F.; Zhao, H.M.; Chen, Z. Quality Control Procedures for Hourly Precipitation Data from Automatic Weather Stations in China. Meteor. Mon. 2010, 36, 123–132. [Google Scholar]
  46. Xu, X.H.; Yu, X.; Zhu, Y.N.; Liu, G.H.; Dai, J. Cloud Microphysical Properties of a Tornado Revealed by FY-2G Geostationary Satellite. Plateau Meteorol. 2018, 37, 1737–1748. [Google Scholar]
  47. Trenberth, K.E. Climate diagnostics from global analyses: Conservation of mass in ECMWF analyses. J. Clim. 1991, 4, 707–722. [Google Scholar] [CrossRef]
  48. Wu, G.X.; Cai, Y.P.; Tang, X.J. Moist potential voriticity and slantwise vorticity development. Acta Meteorol. Sin. 1995, 4, 387–405. [Google Scholar] [CrossRef]
  49. Yu, Q.H.; Lv, Z.Y.; Li, Z.X.; Yao, Y. Analysis of Satellite Cloud Images and Dual-Polarization Radar Features of the 20 July, 2021 Zhengzhou Extreme Torrential Rain. Meteorol. Environ. Sci. 2022, 45, 102–111. [Google Scholar]
  50. Qin, D.Y. A Case Study of Meso-α-scale Convective System Shape Differences Using Filtering Analysis. Chin. J. Atmos. Sci. 2010, 34, 154–162. [Google Scholar]
  51. Wang, L.M.; Luo, H.B. The basic dynamic equations and the main properties of the saturated moist air. Acta Meteorol. Sin. 1980, 1, 44–50. [Google Scholar] [CrossRef]
  52. Zhang, M. The Study About the Rainstorm Forecast In Hohhot With the High Resolution Model Radiosonde Data. Meteorol. J. Inn. Mong. 2017, 5, 12–14+45. [Google Scholar] [CrossRef]
  53. Gu, T.H.; Du, X.L.; Li, L.; Zhang, Y.M.; Shao, G.Y. Statistical analysis of the environmental parameters of heavy rainfall in Southwest China based on sounding observation. Mid-Low Latit. Mt. Meteorol. 2022, 46, 27–32. [Google Scholar]
Figure 1. Topography of the Tarim Basin (surrounded by the solid red line) and surrounding areas (units: m); the black triangle shows the location of the Kashgar sounding station.
Atmosphere 15 00210 g001
Figure 2. Cumulative rainfall (unit: mm) and topographic height (units: m) at stations in Tarim Basin from 12:00 on 18 July to 12:00 on 22 July 2021.
Atmosphere 15 00210 g002
Figure 3. Hourly precipitation at 3 storm centers from 12:00 on 18 July to 12:00 on 22 July 2021 (unit: mm).
Atmosphere 15 00210 g003
Figure 4. At 12:00 on 18 July 2021 (a,c,e,g) and 18:00 on 19 July, 2021 (b,d,f,h); 200 hPa (a,b) geopotential height field (shadow, unit: dagpm), wind field (arrow, unit: m·s1) and westerly jet (green contour; unit: m·s1); 500 hPa (c,d) geopotential height field (red contour line; unit: dagpm), wind field (arrow; unit: m·s1) and wind speed of ≥8 m/s area (shadow; unit: m·s1); 700 hPa (e,f) geopotential height field (shadow; unit: dagpm) and wind field (arrow; unit: m·s1); 850 hPa (g,h) wind field (arrow; unit: m·s1) and wind speed of ≥8 m/s area (shadow; unit: m·s1). The solid blue line is the boundary of the Tarim Basin, and the black shadow is the topographic shield.
Atmosphere 15 00210 g004
Figure 5. Vertical velocity (shading; unit: Pa/s) along 39.5°N at 12:00 on 18 July 2021 (a), vertical selection at 12:00 (b) and 18:00 (c) on 19 July 2021. The black triangle mark represents the location of Shufu station, and the gray shadow is the topography.
Atmosphere 15 00210 g005
Figure 6. Ground–300 hPa water vapor fluxes (arrows; unit: kg/(m·s)) and water vapor flux divergence (colored; unit: 10−5 kg/(m2·s)) for 16 July 2021 at 00:00 (a), 17 July at 06:00 (b), 18 July at 12:00 (c) and 21 July at 00:00 (d). The solid green line is the boundary of the Tarim Basin.
Atmosphere 15 00210 g006
Figure 7. Water vapor transport trajectories for 240 h along the backward thrust of the three storm sites of Shufu (a), Yutian (b) and Baicheng (c). (The five-pointed star represents the height of the starting point).
Atmosphere 15 00210 g007
Figure 8. Water vapor transport at different levels of the western boundary (a), eastern boundary (b), southern boundary (c) and northern boundary (d) from 17 to 21 July 2021, 6 h apart.
Atmosphere 15 00210 g008
Figure 9. Evolution of TBB (unit: °C) of FY–2G satellite at 12:00 (a) and 18:00 (b) on 18 July 2021 and at 00:00 (c), 12:00 (d), 18:00 (e) and 21:00 (f) on 19 July 2021.
Atmosphere 15 00210 g009
Figure 10. Horizontal distribution of 850 hPa pseudo-equivalent potential temperature at 06:00 (a) on 18 July 2021 and 18:00 (b) on 19 July 2021 (contour line; unit: K). The solid red line is the boundary of the Tarim Basin.
Atmosphere 15 00210 g010
Figure 11. Vertical profile along 39.5° N pseudo-equivalent potential temperature (unit: K) at 06:00 (a) on 18 July 2021 and 18:00 (b) on 19 July 2021.
Atmosphere 15 00210 g011
Figure 12. T-lnP diagram of Kashgar sounding station at 11:00 (a) on 18 July and 0:00 (b), 05:00 (c) and 11:00 (d) on 19 July 2021 (the solid red line is the temperature curve, the solid yellow line is the dew point curve, the solid black line is the status curve, the red dotted lines are dry adiabatic curve, the blue dotted lines are wet adiabatic curve, the green dotted lines is the isosaturated specific humidity curve and the wind barbs indicate the wind direction and wind speed).
Atmosphere 15 00210 g012aAtmosphere 15 00210 g012b
Figure 13. Horizontal distribution of 850 hPa for MPV, MPV1 and MPV2 at 18:00 (ac) and 18:00 (df) on 18 July 2021.
Atmosphere 15 00210 g013
Figure 14. Vertical profiles of MPV, MPV1 and MPV2 along 39.5° N at 18:00 (ac) on 18 July 2021 and 18:00 (df) on 19 July 2021.
Atmosphere 15 00210 g014
Disclaimer/Publisher’s Note: The statements, opinions and data contained in all publications are solely those of the individual author(s) and contributor(s) and not of MDPI and/or the editor(s). MDPI and/or the editor(s) disclaim responsibility for any injury to people or property resulting from any ideas, methods, instructions or products referred to in the content.

