
Synoptic-Scale Wildland Fire Weather Conditions in Mexico


Abstract
1. Introduction
2. Materials and Methods
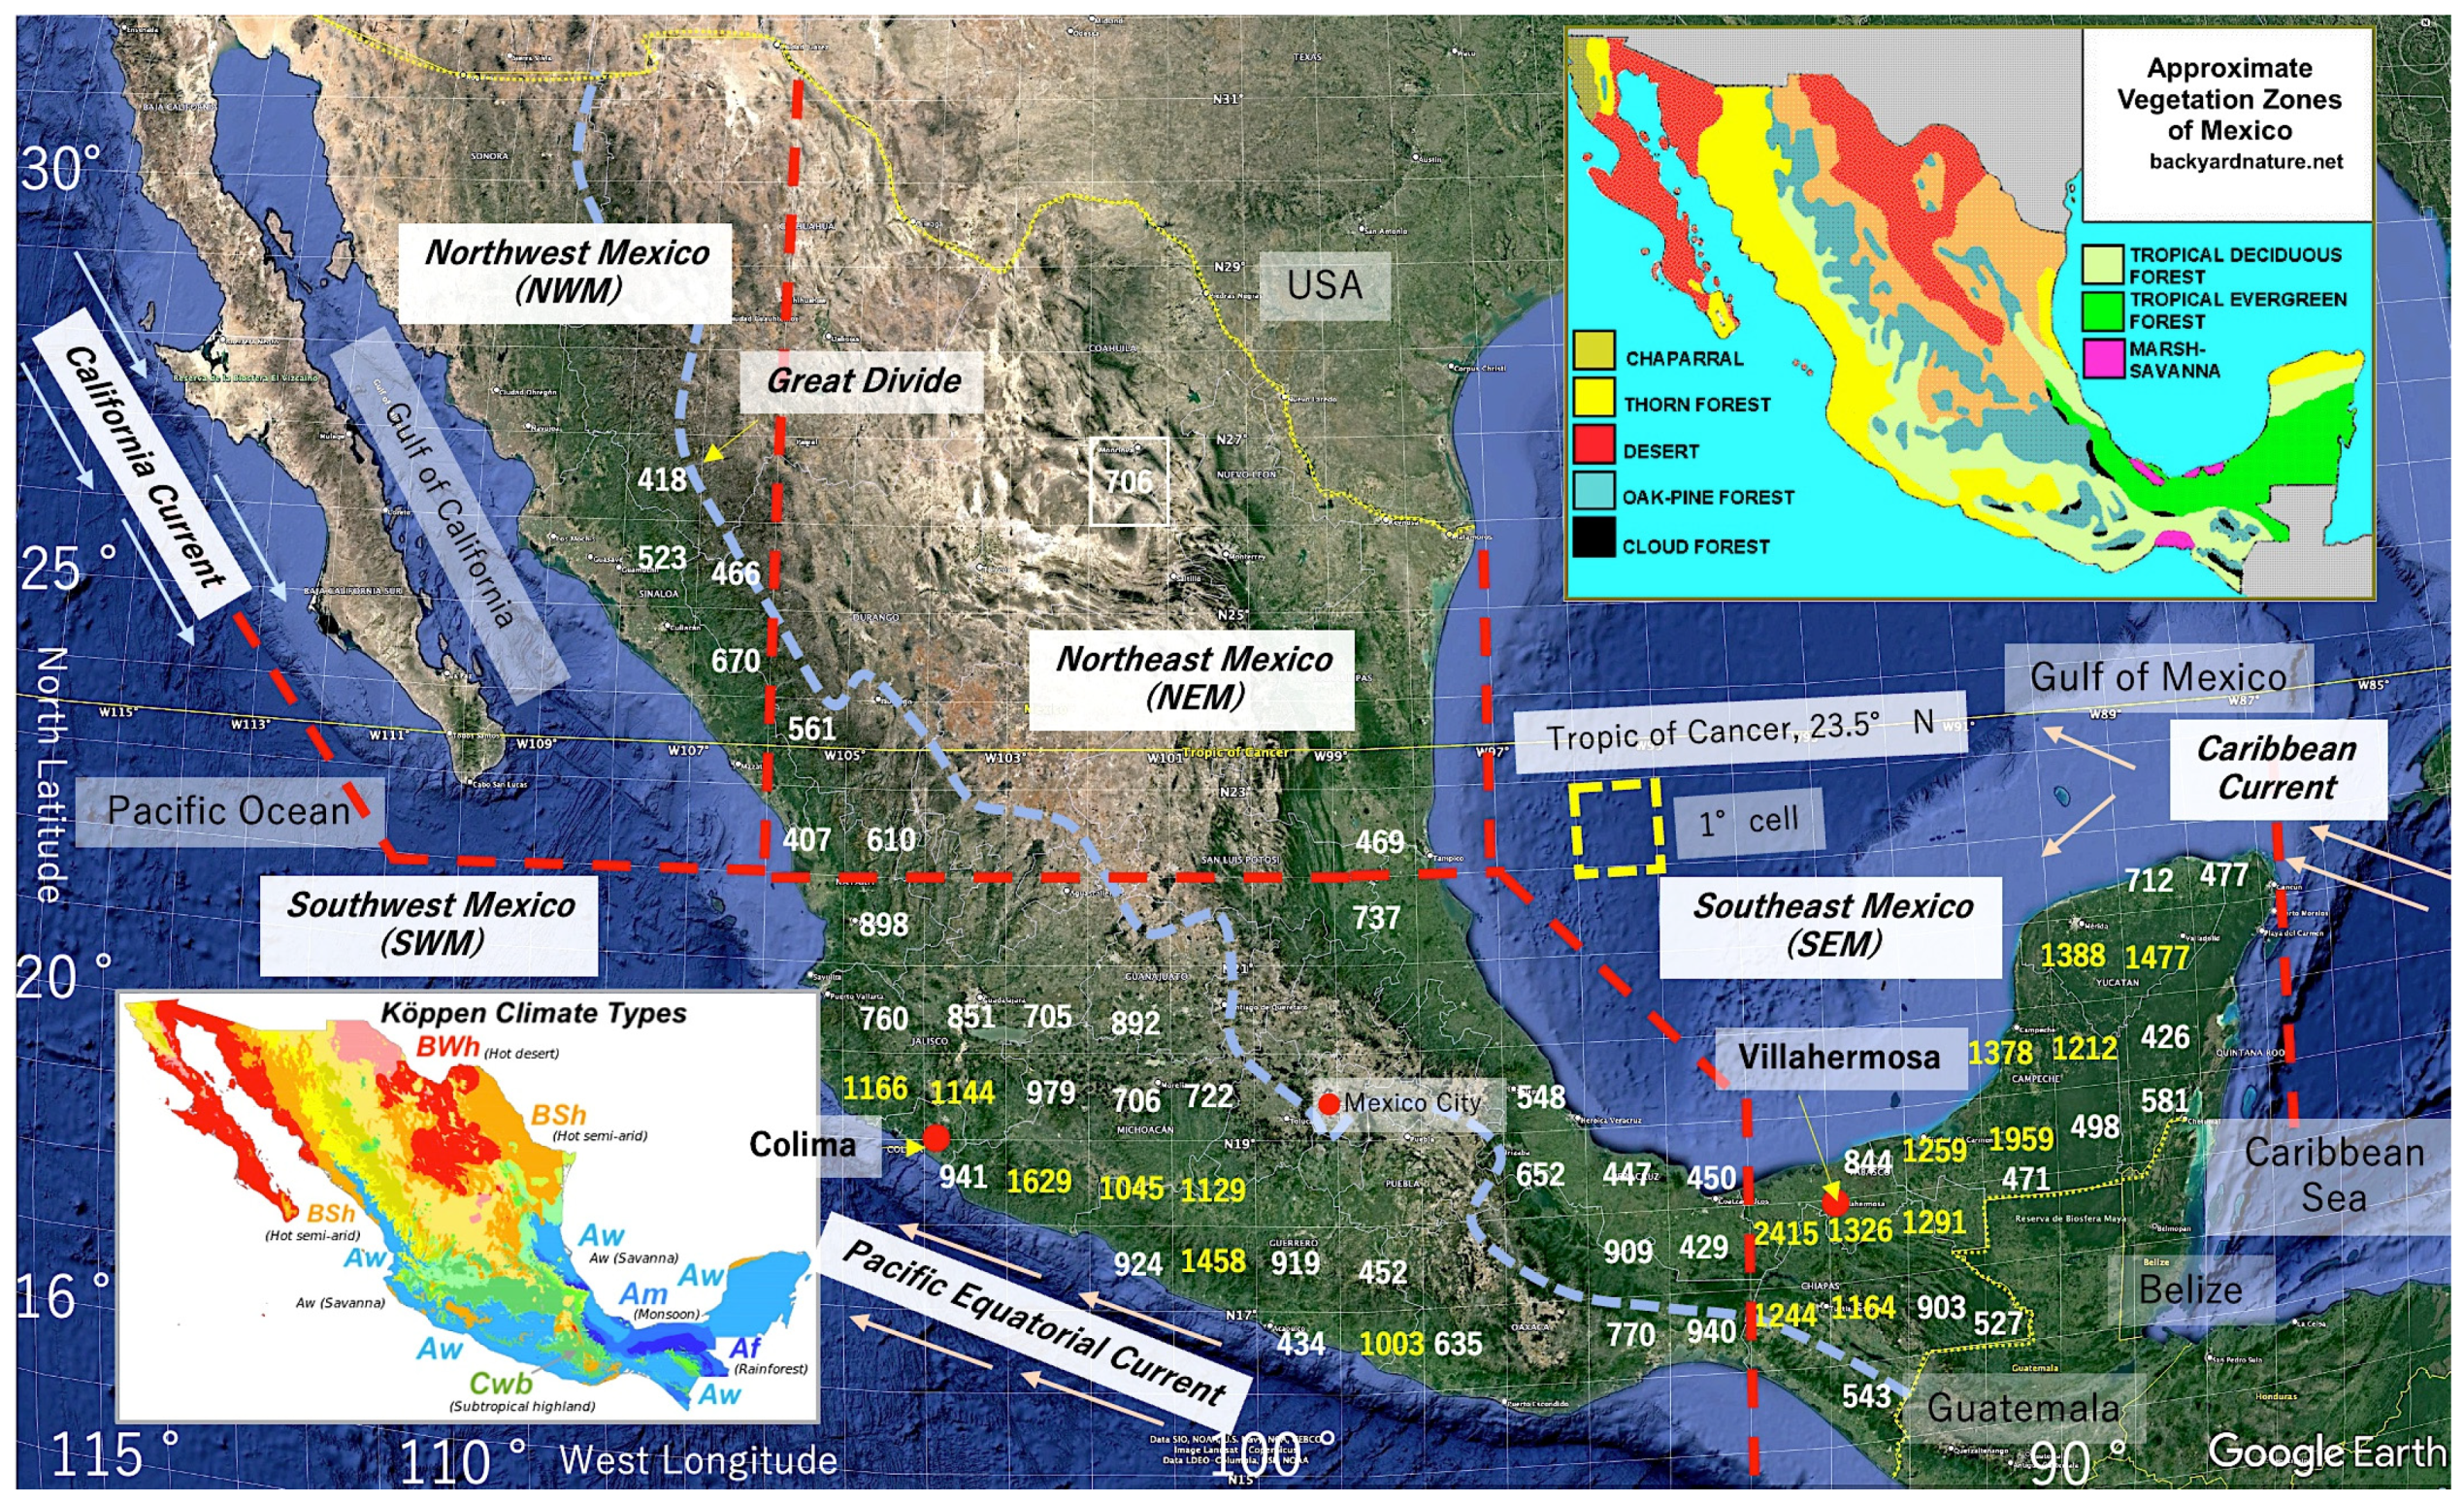
2.1. Study Area
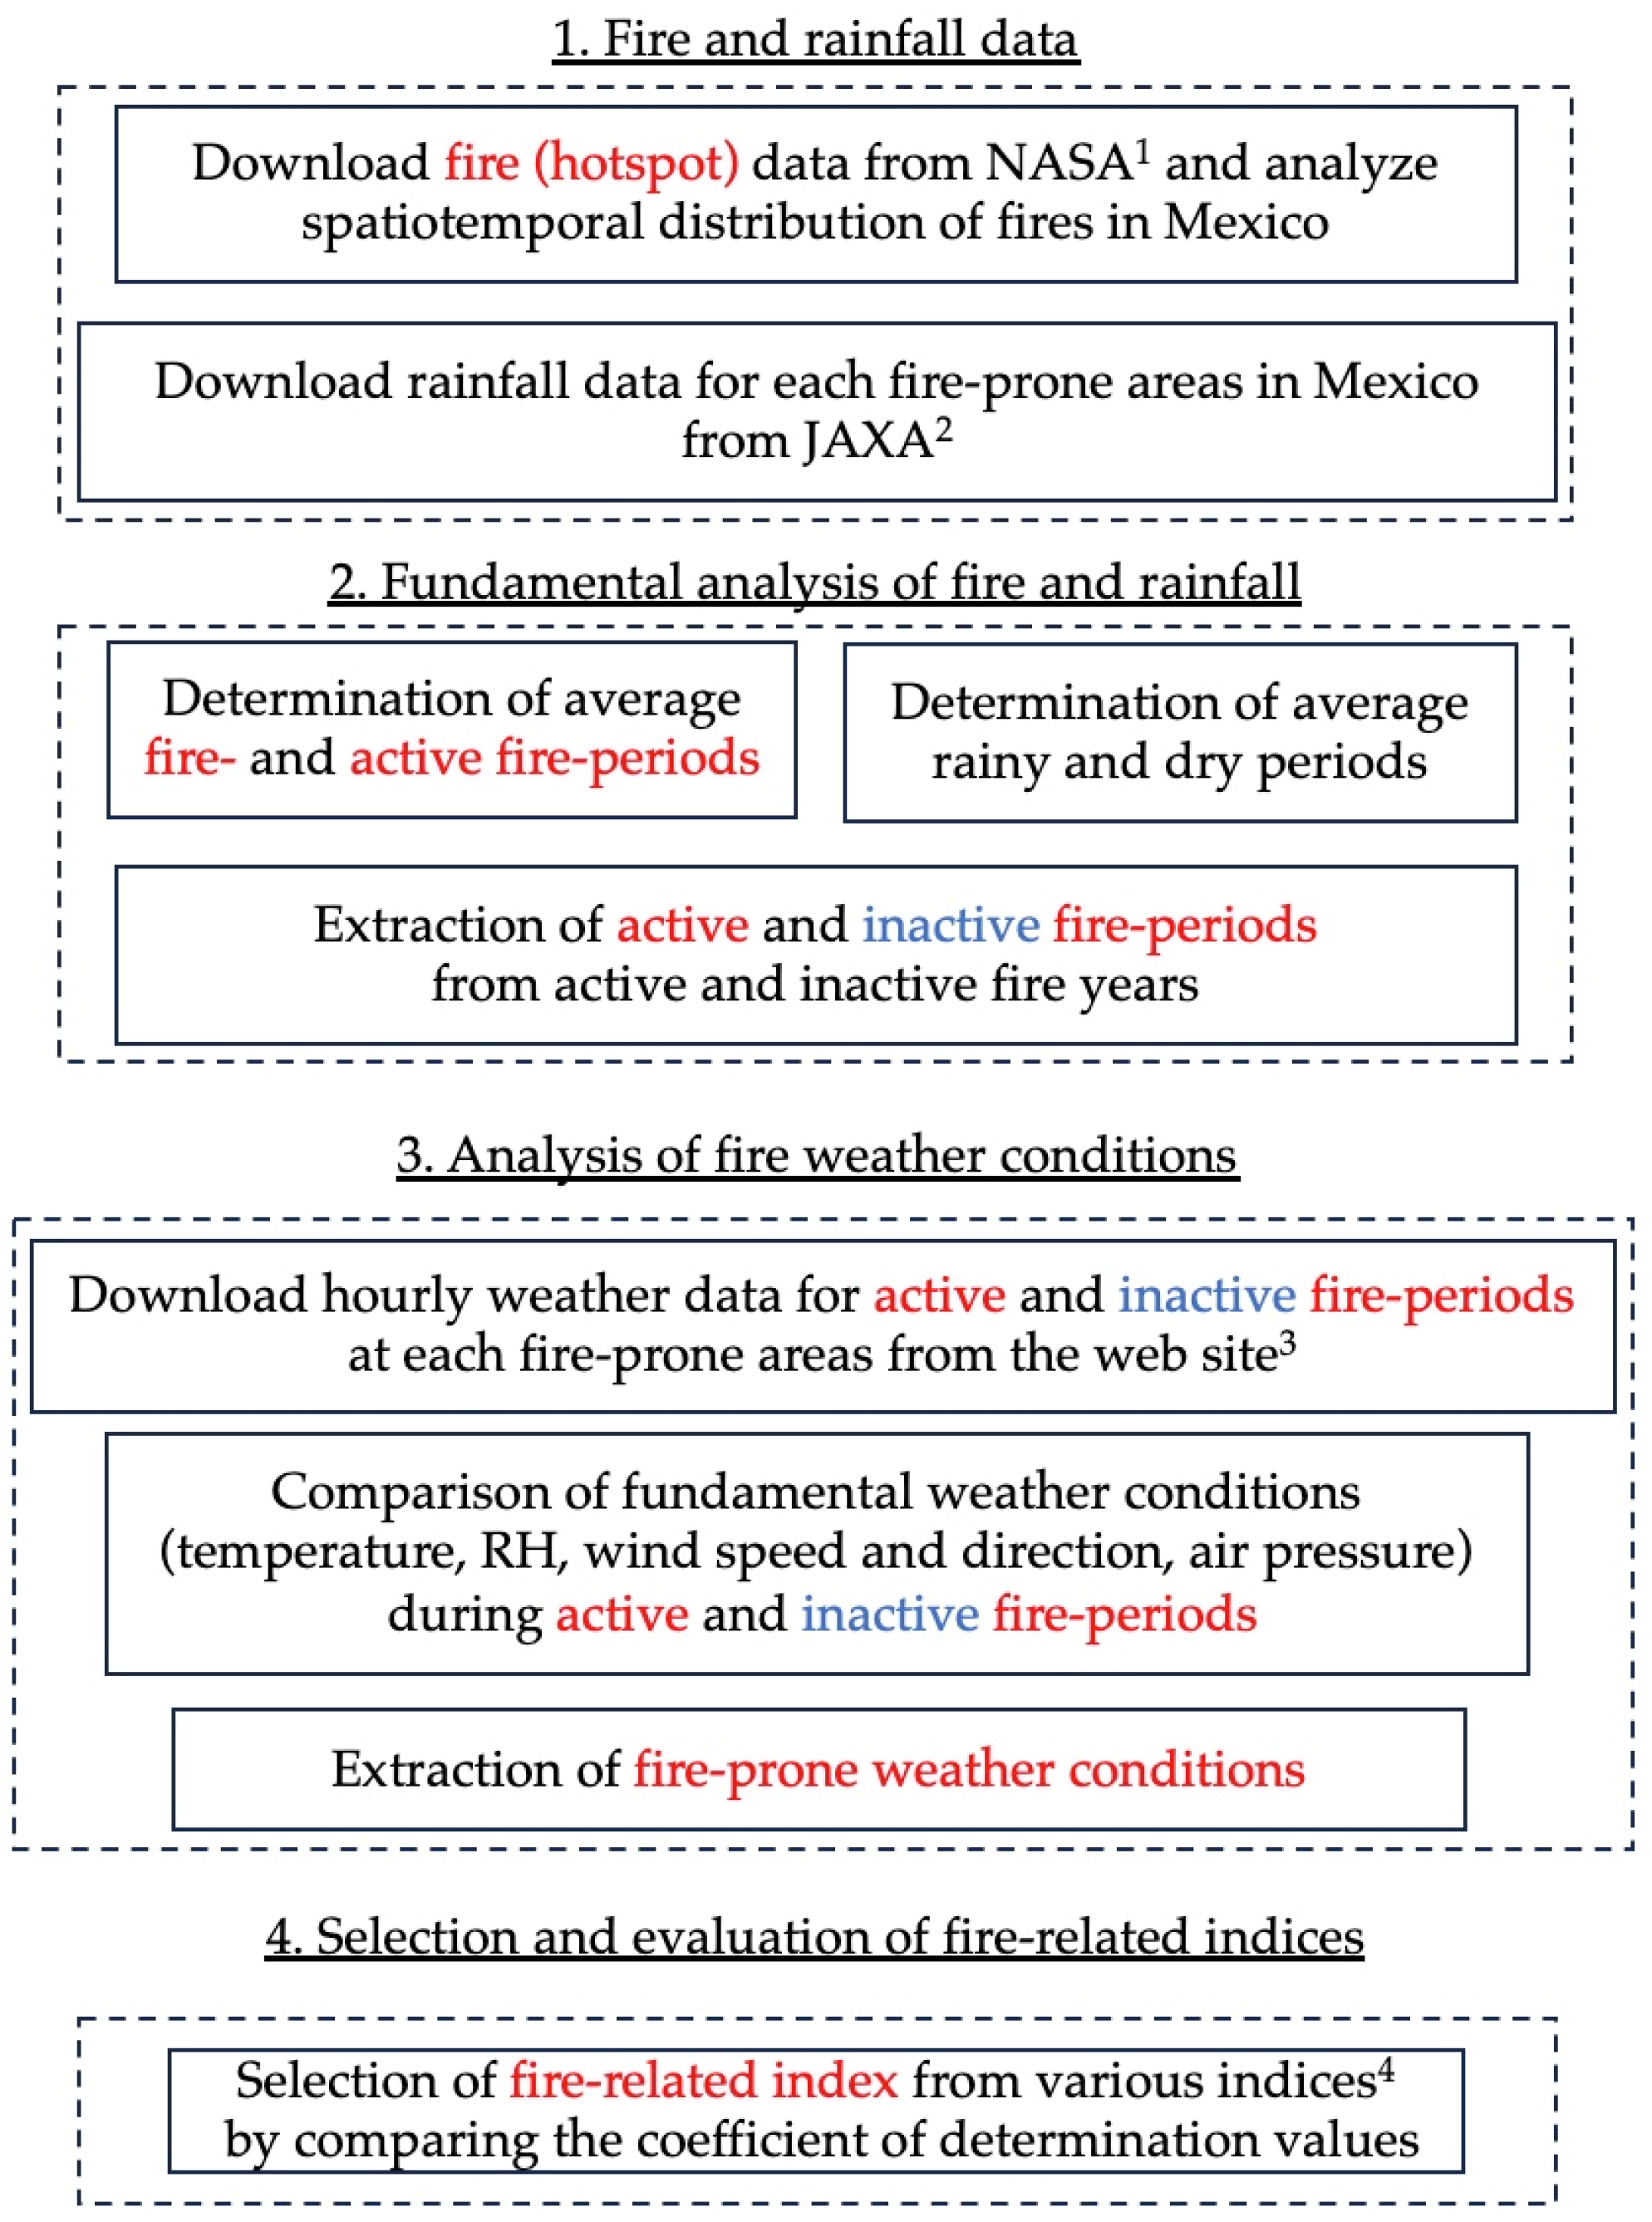
2.2. Analysis Methods and Procedures
2.2.1. Fire and Rainfall Data
2.2.2. Fundamental Analysis of Fire and Rainfall
2.2.3. Analysis of Fire Weather Conditions
2.2.4. Selection of Fire-Related Indices
3. Results
3.1. Fire (Hotspots) Distribution in Mexico
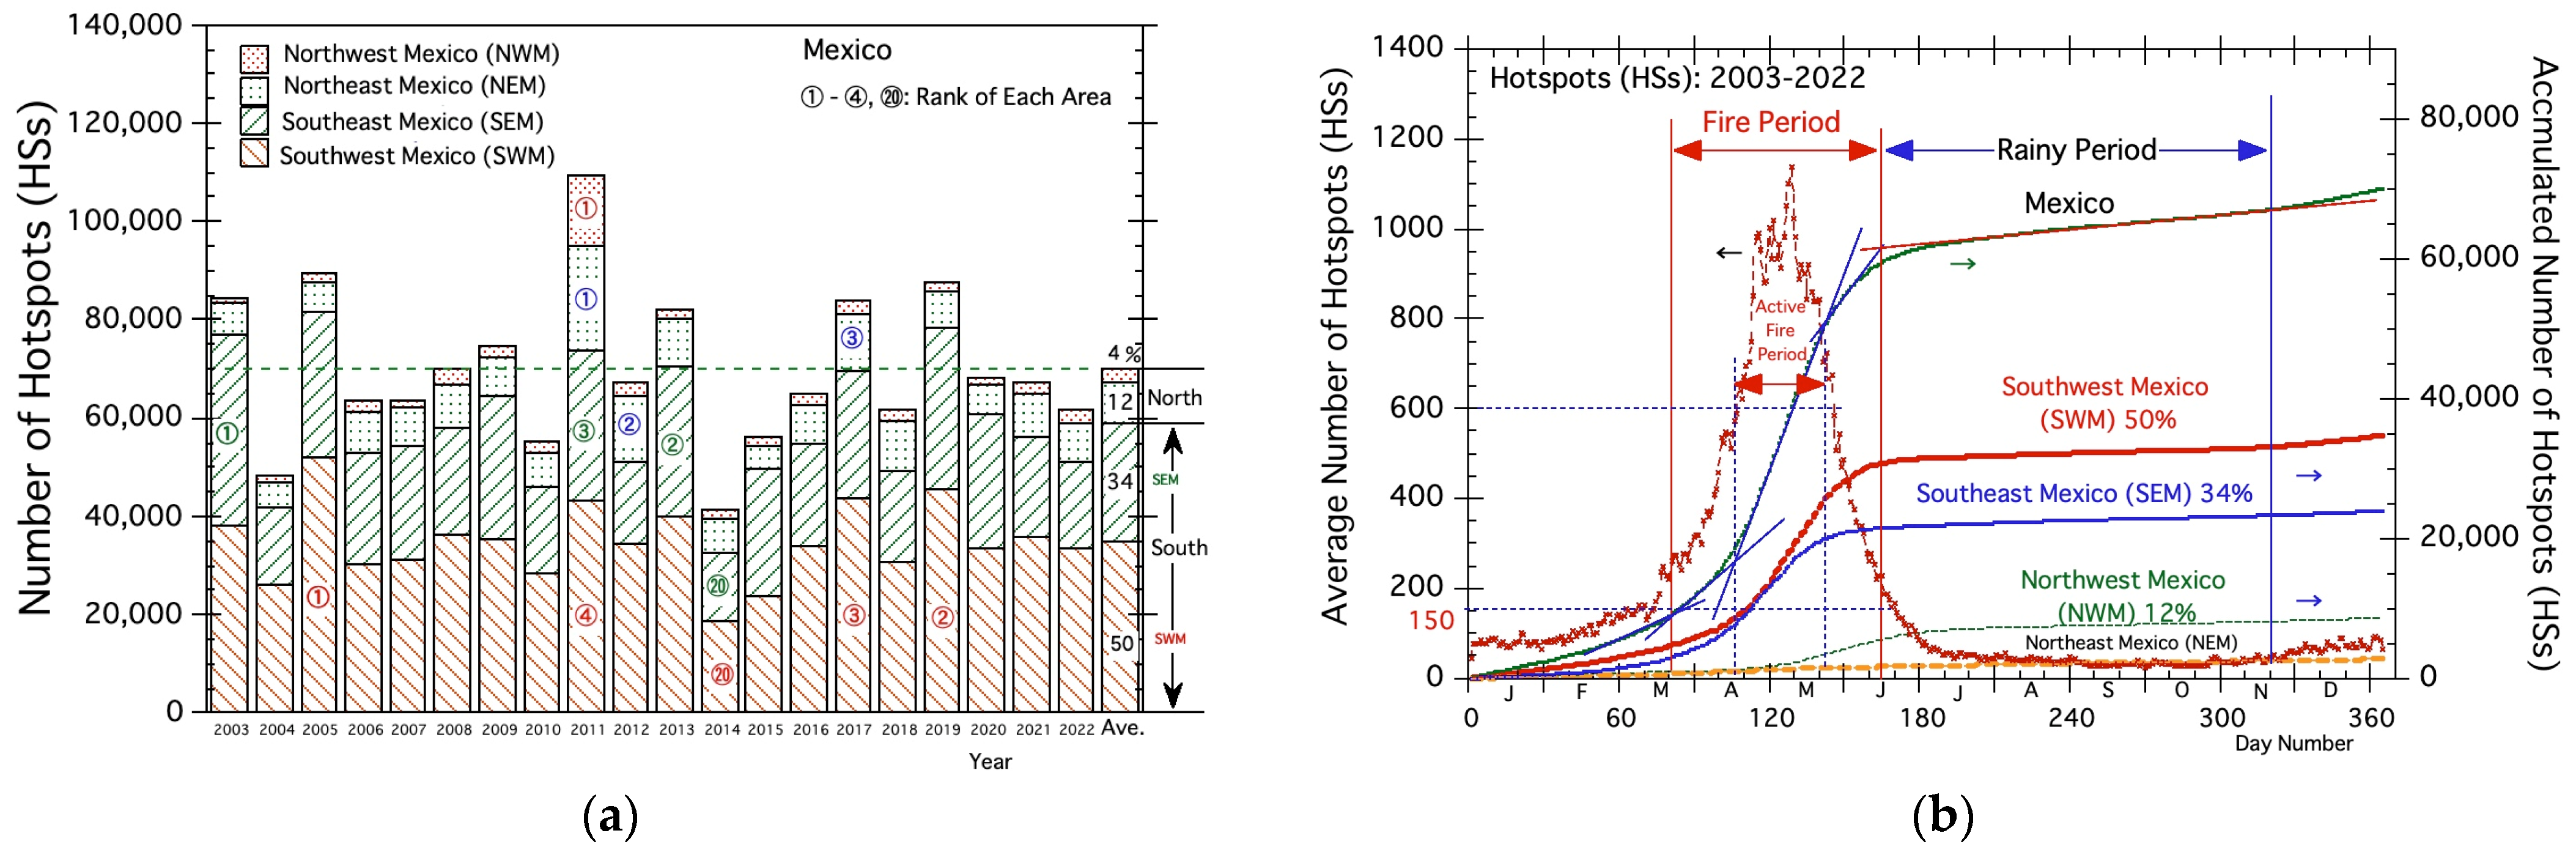
3.2. Recent Fire History in Mexico
3.3. Fire Weather Conditions in Southeast Mexico (SEM)
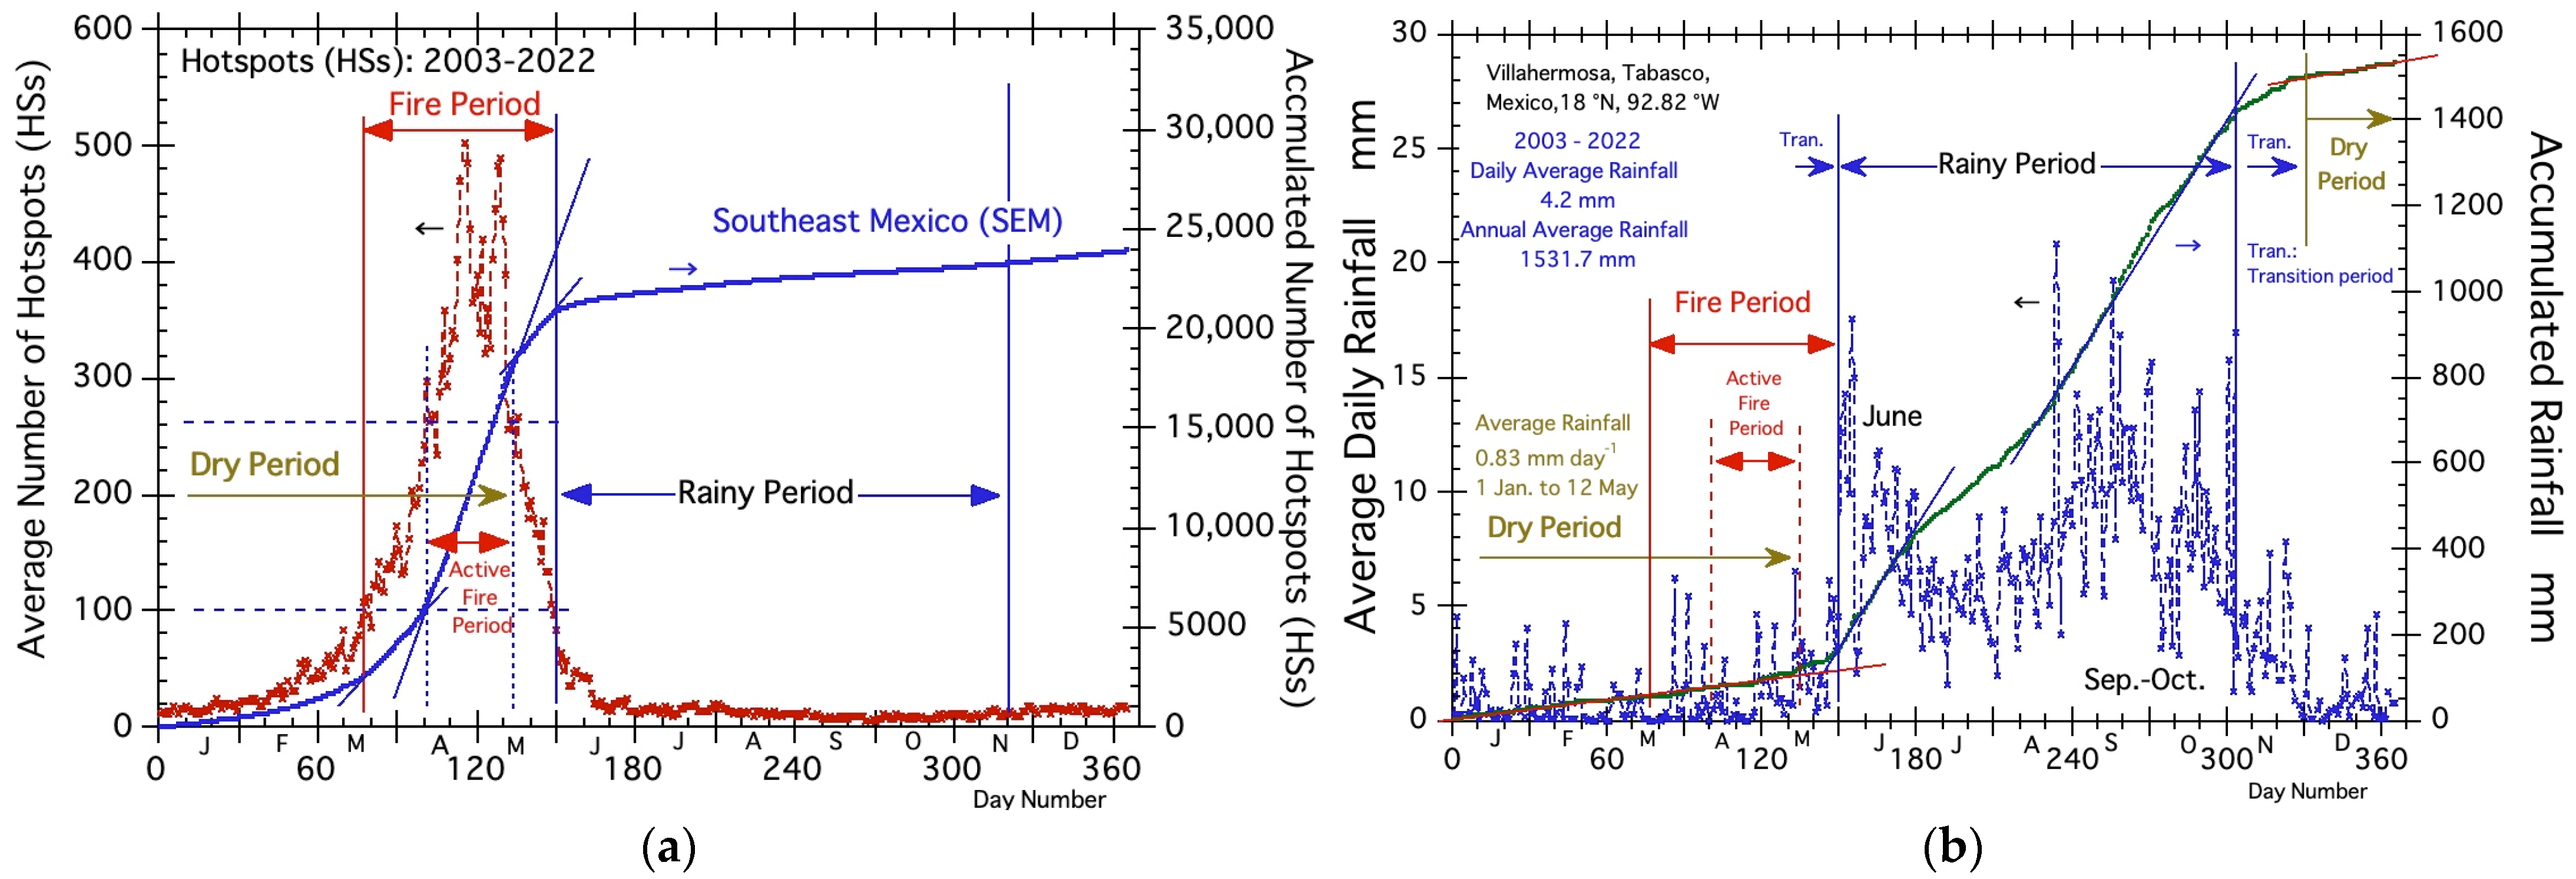
3.3.1. Average Fire and Dry Period in Villahermosa
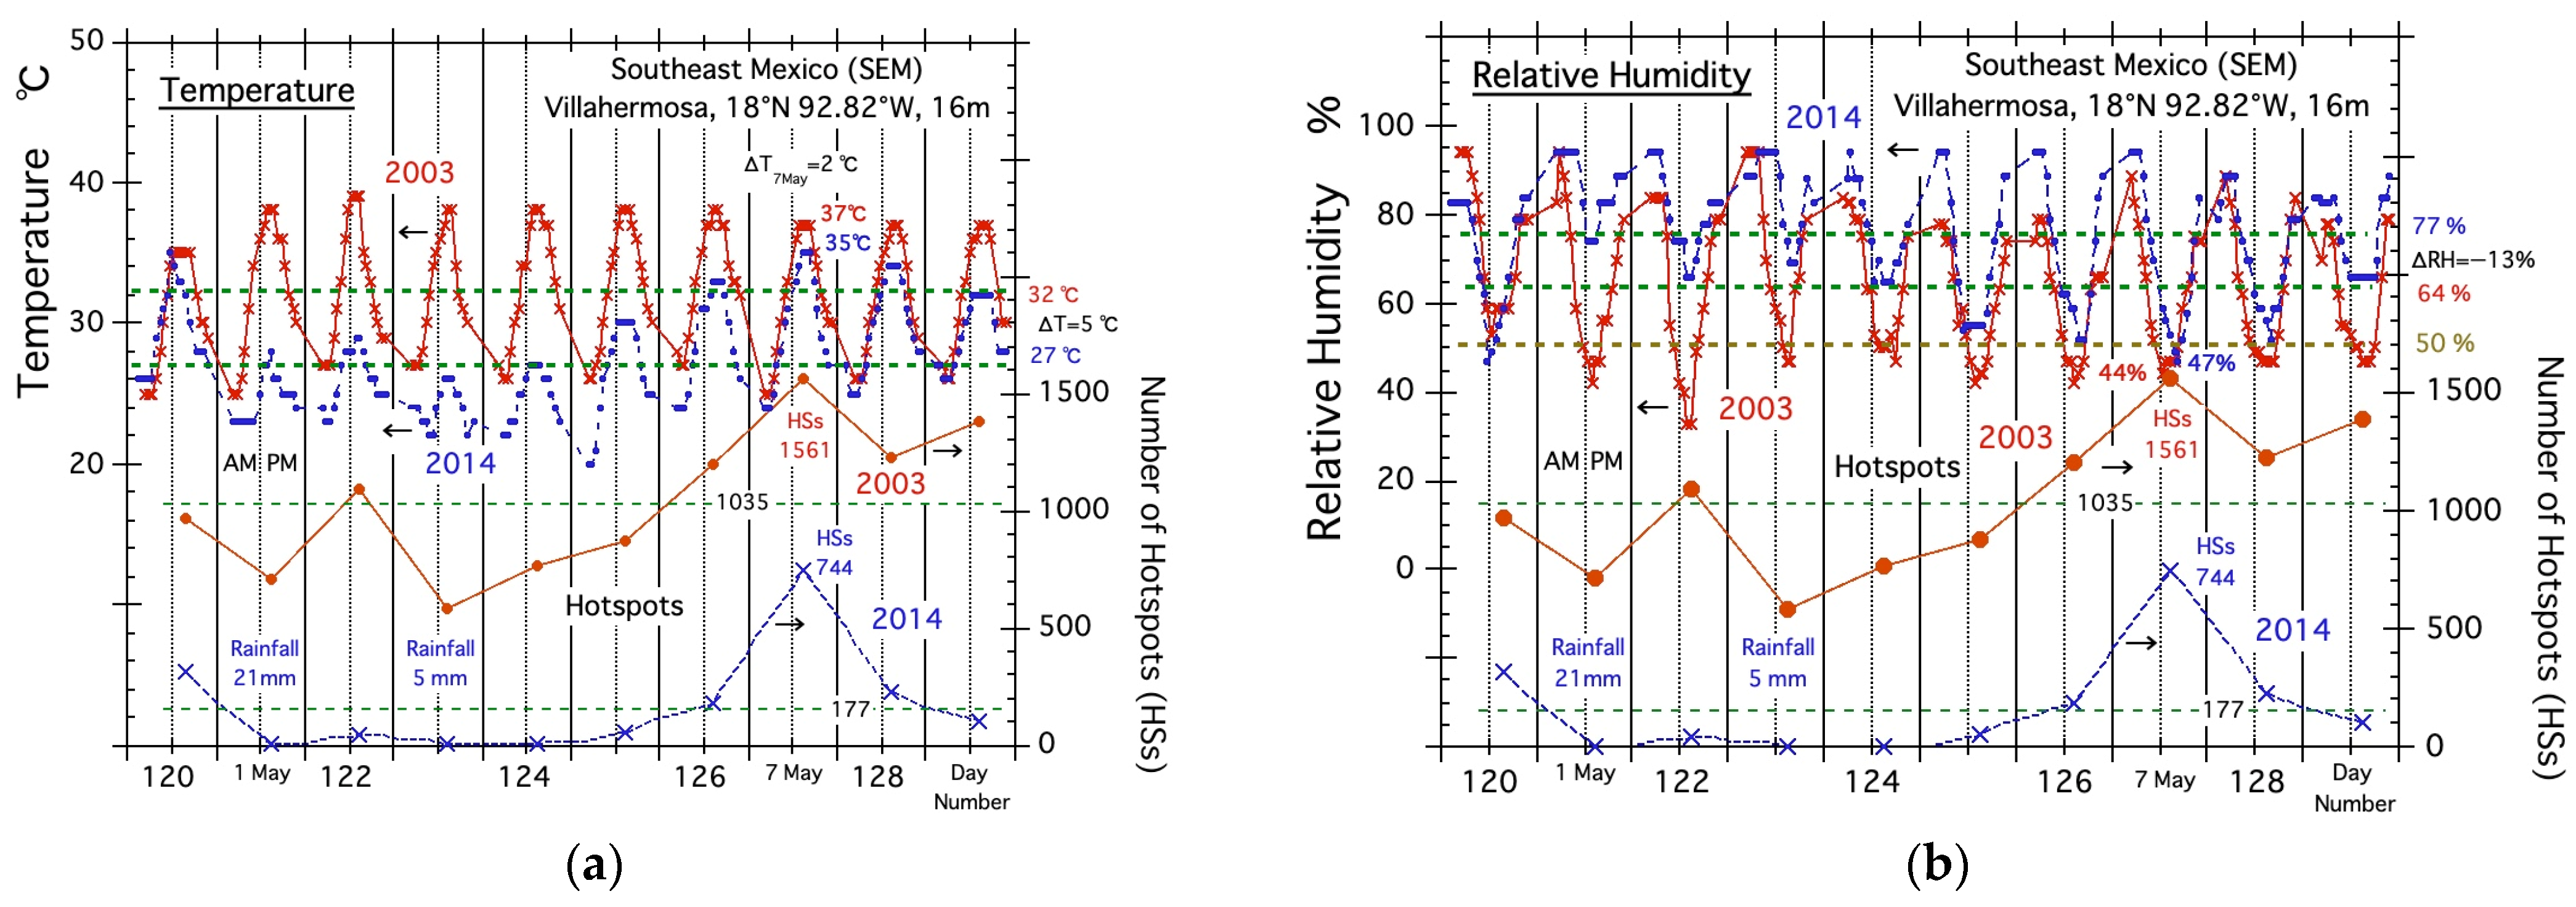
3.3.2. Active Fire Period in 2003 (Top Fire Year in the SEM)
3.3.3. Fire Weather Conditions in Villahermosa
- Temperature and relative humidity (RH)
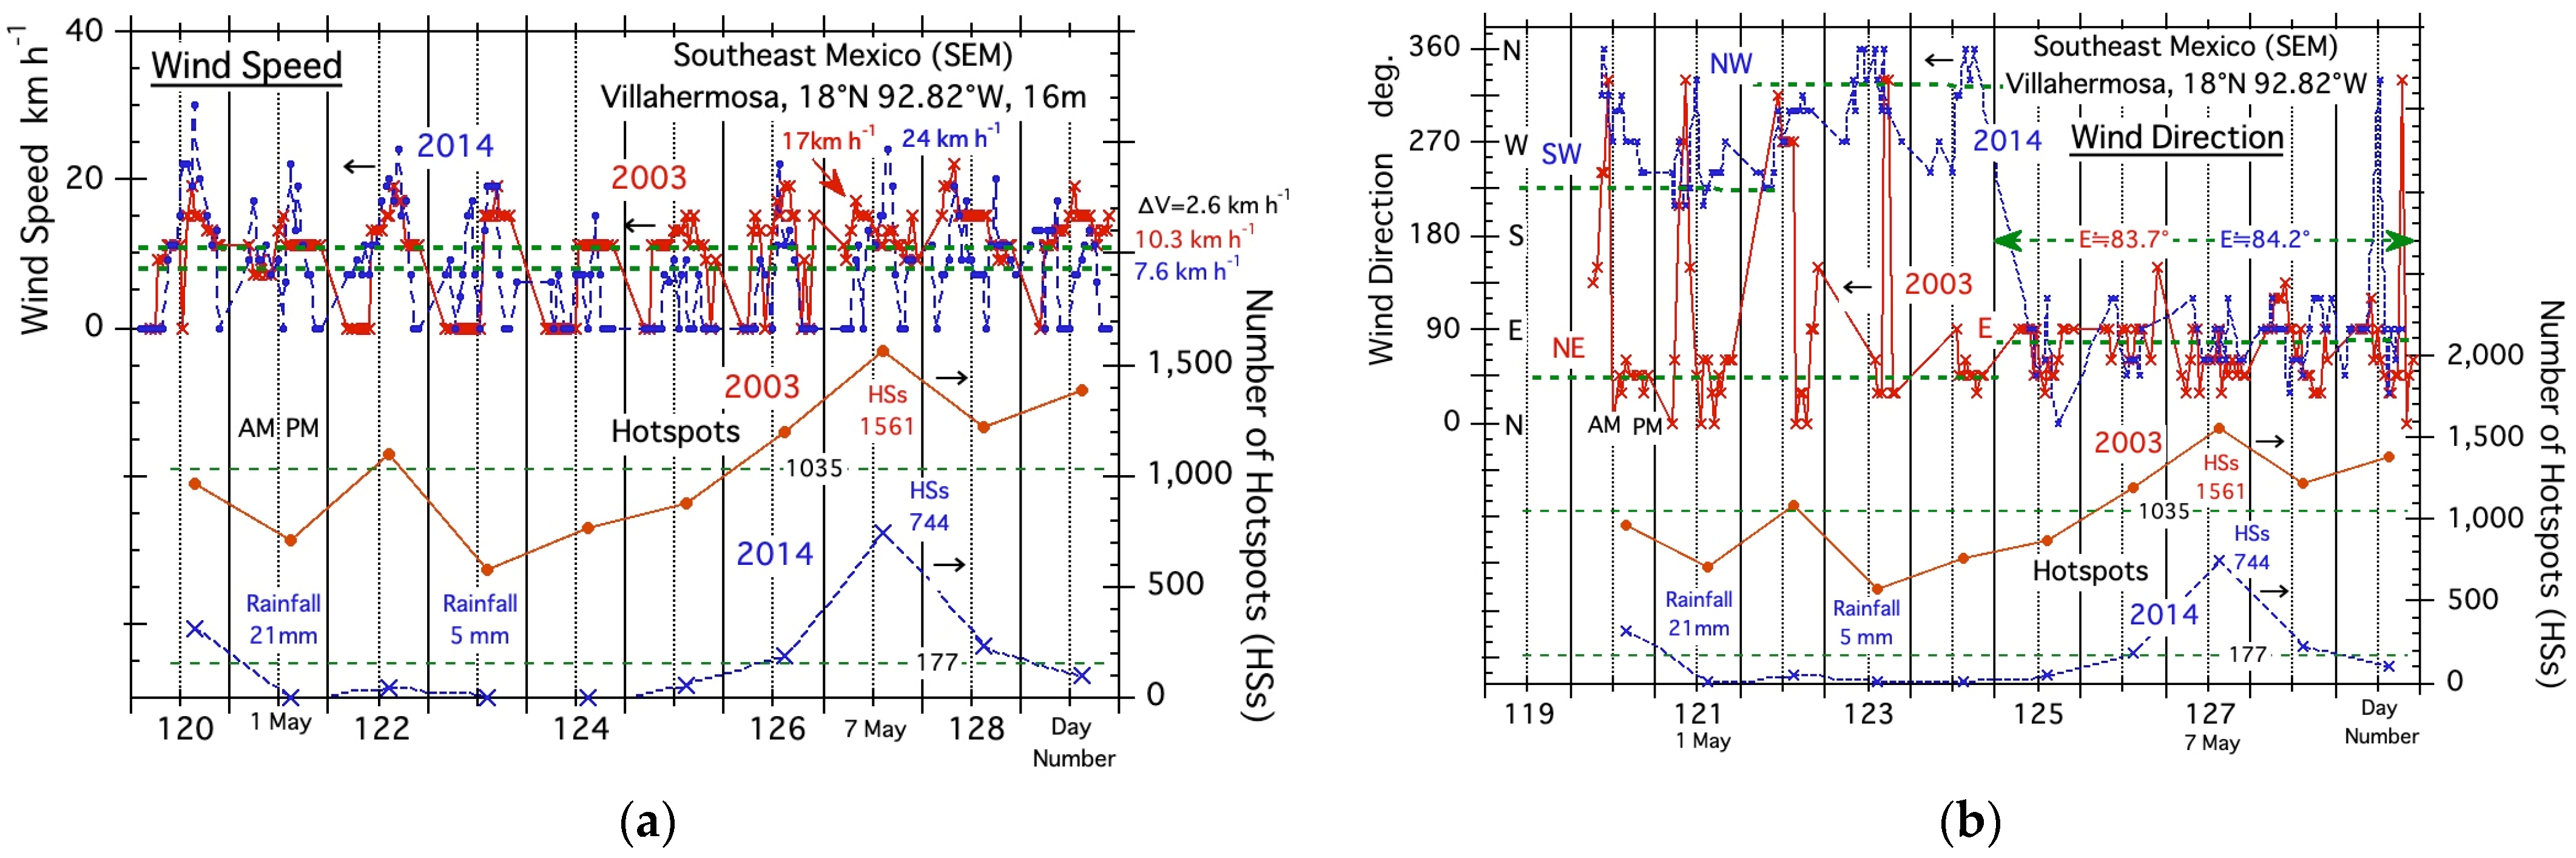
- Wind speed and wind direction
- Air pressure
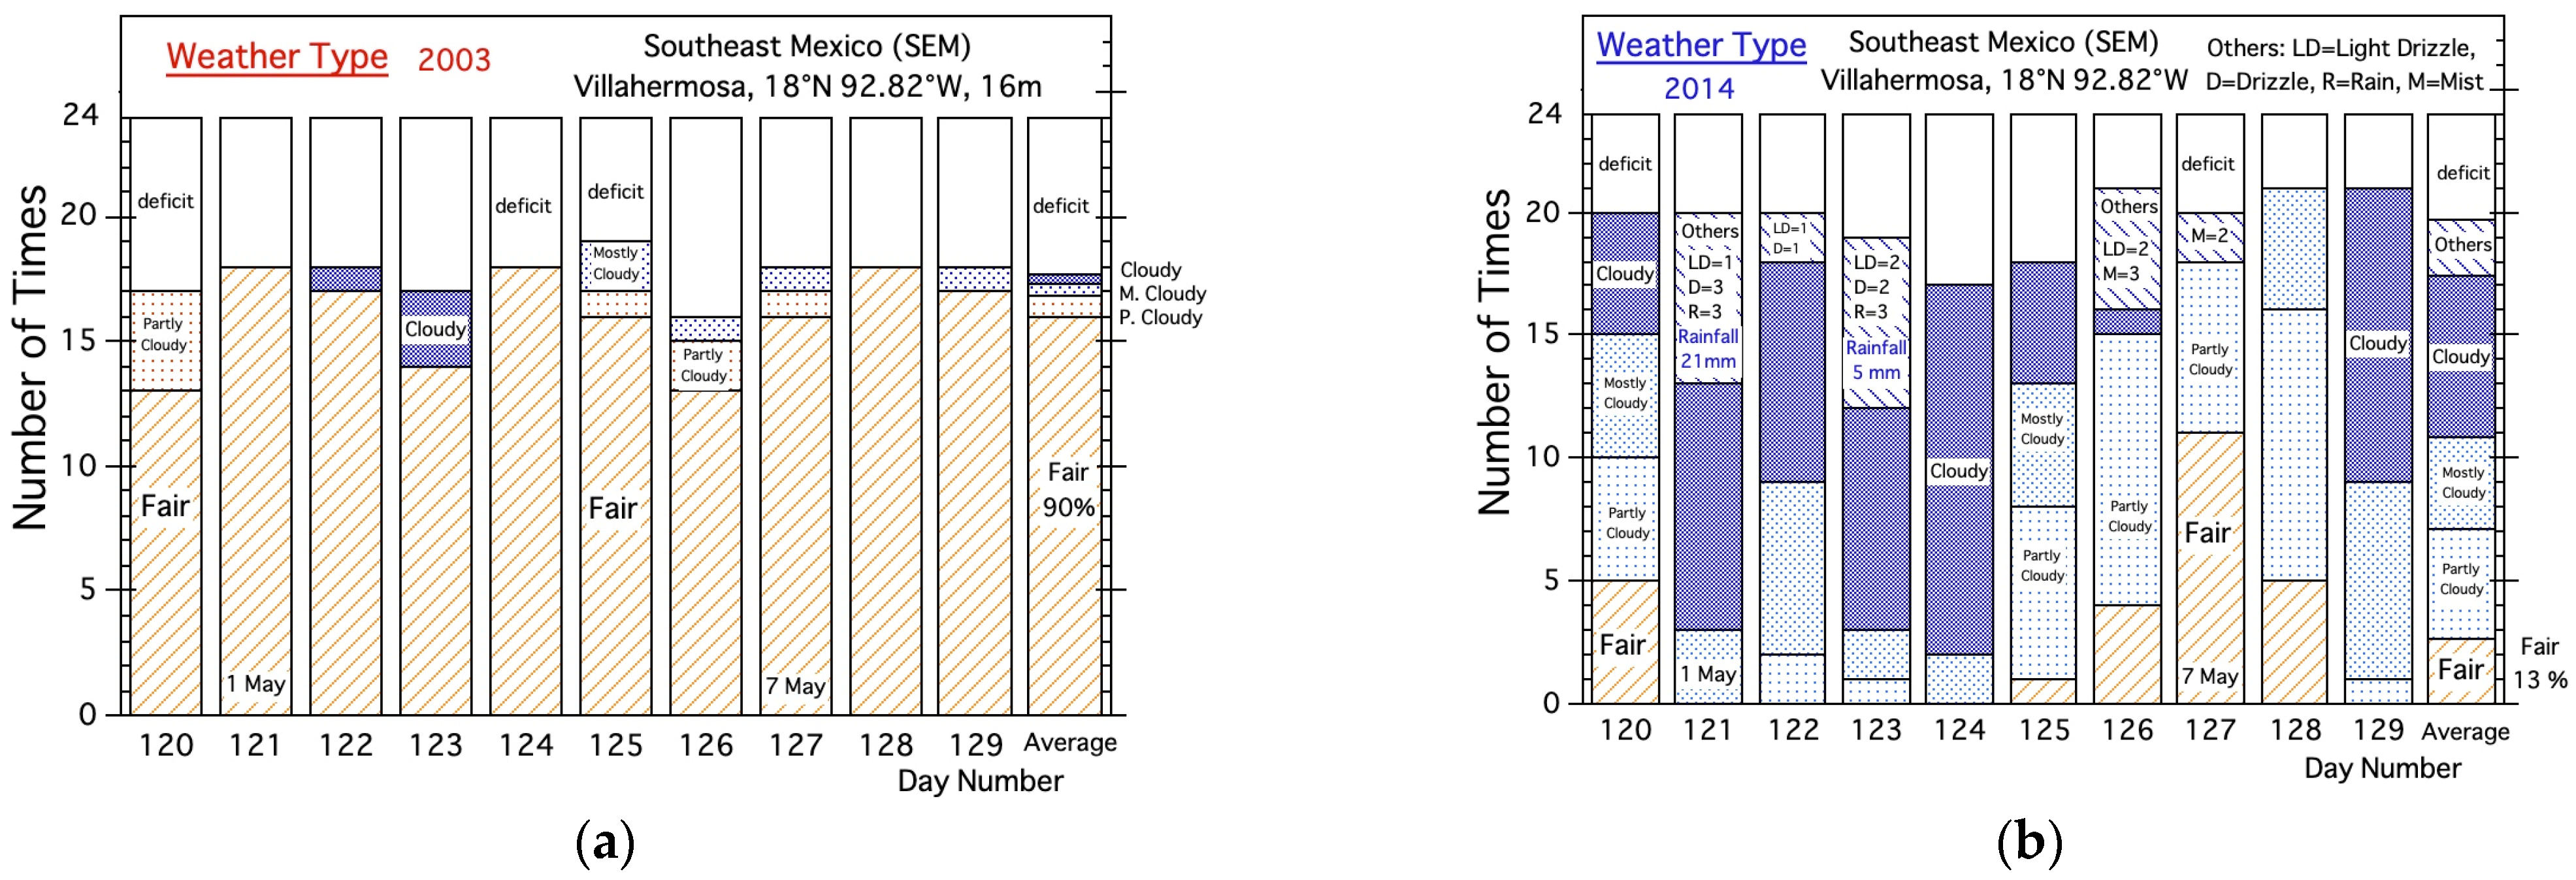
- Weather type
3.4. Fire Weather Conditions in Southwest Mexico (SWM)
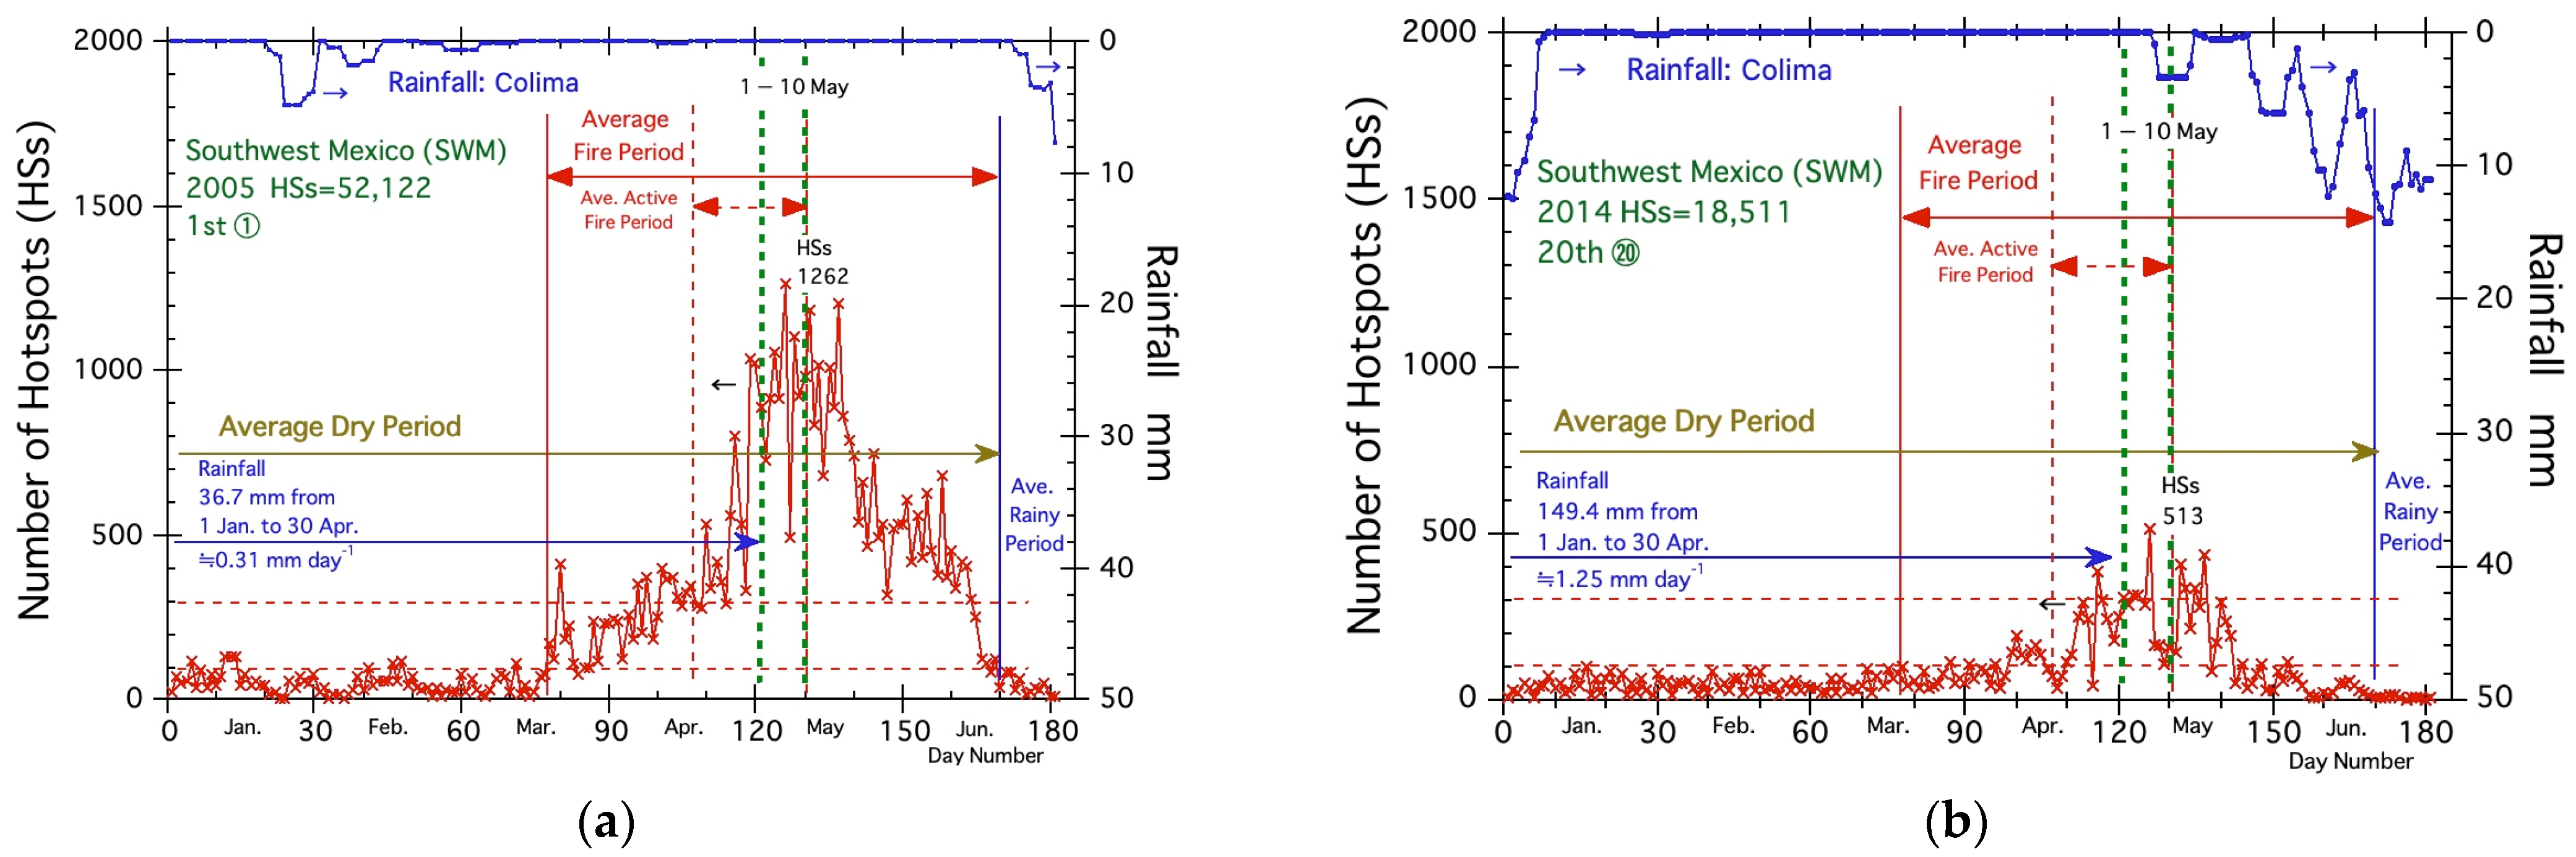
3.4.1. Average Fire and Dry Period in Colima
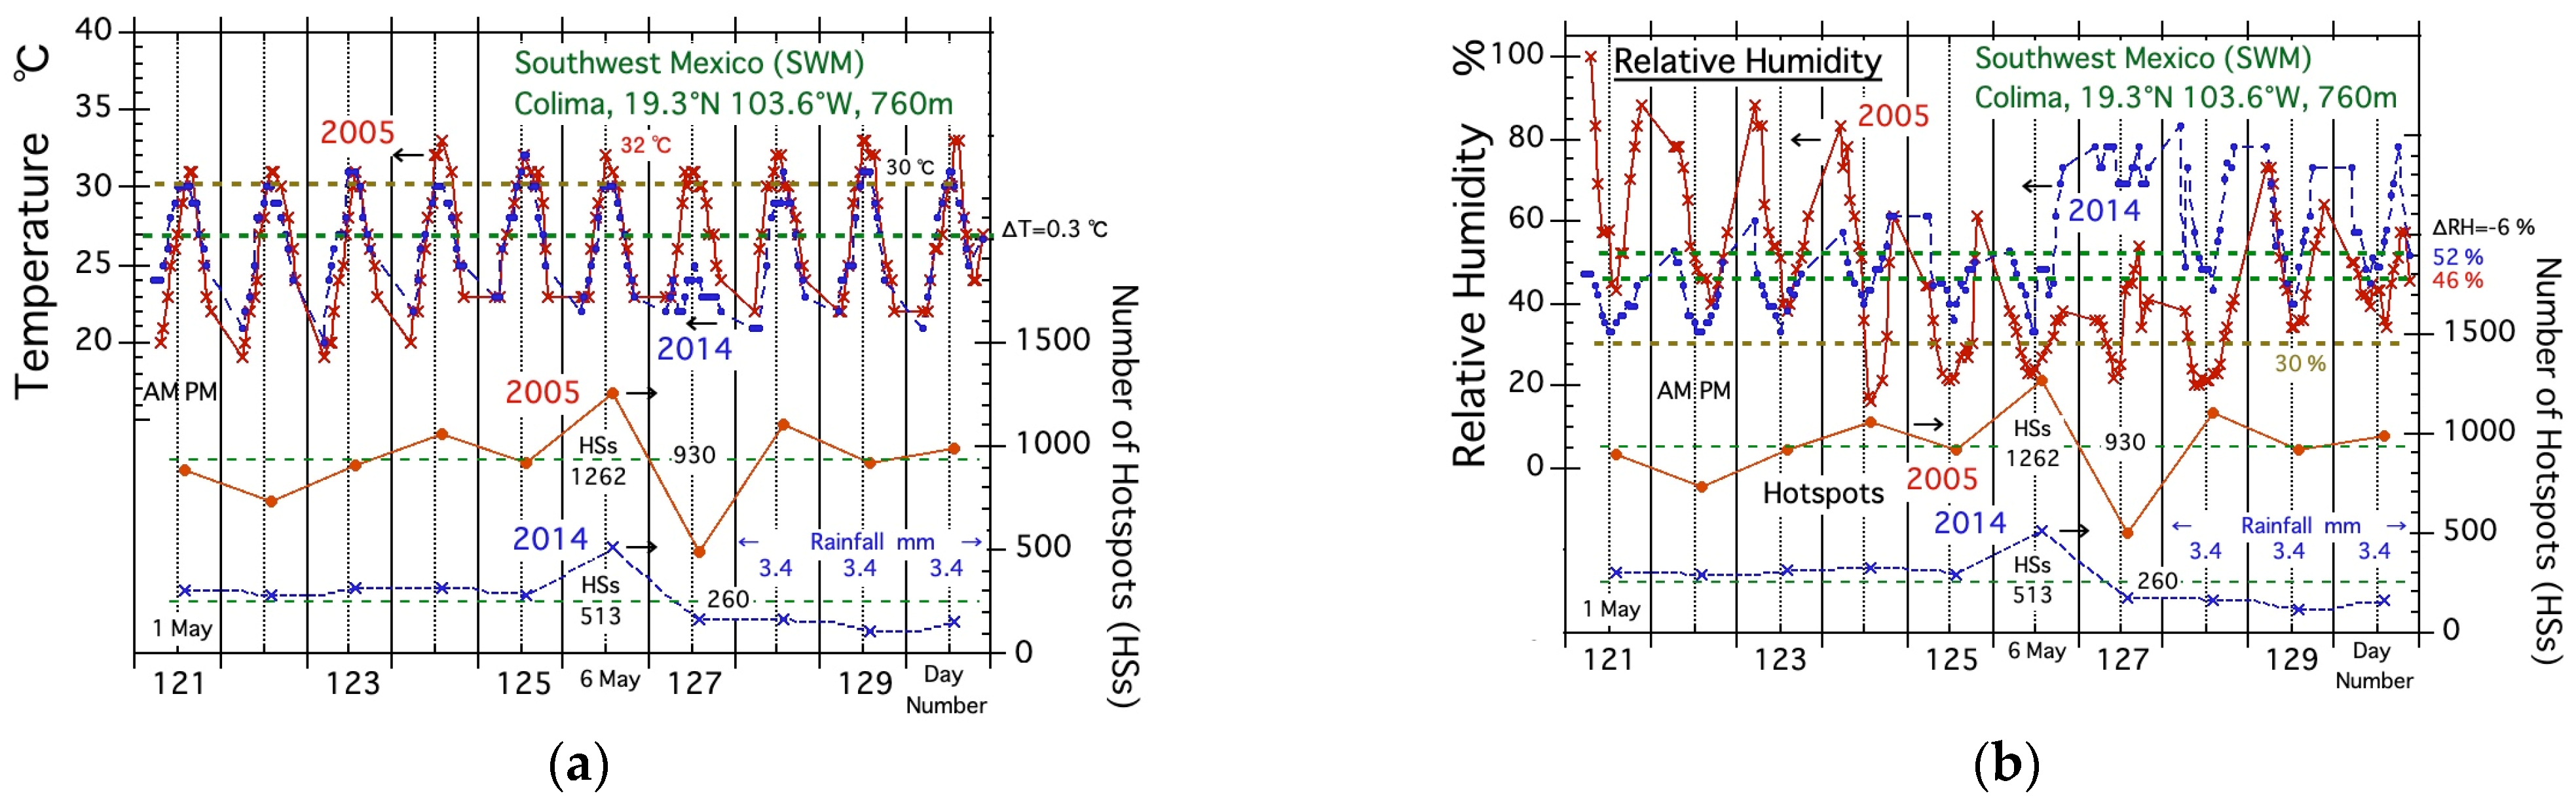
3.4.2. Active Fire Period in 2005 (Top Fire Year in SWM)
3.4.3. Fire Weather Conditions in Colima
- Temperature and relative humidity
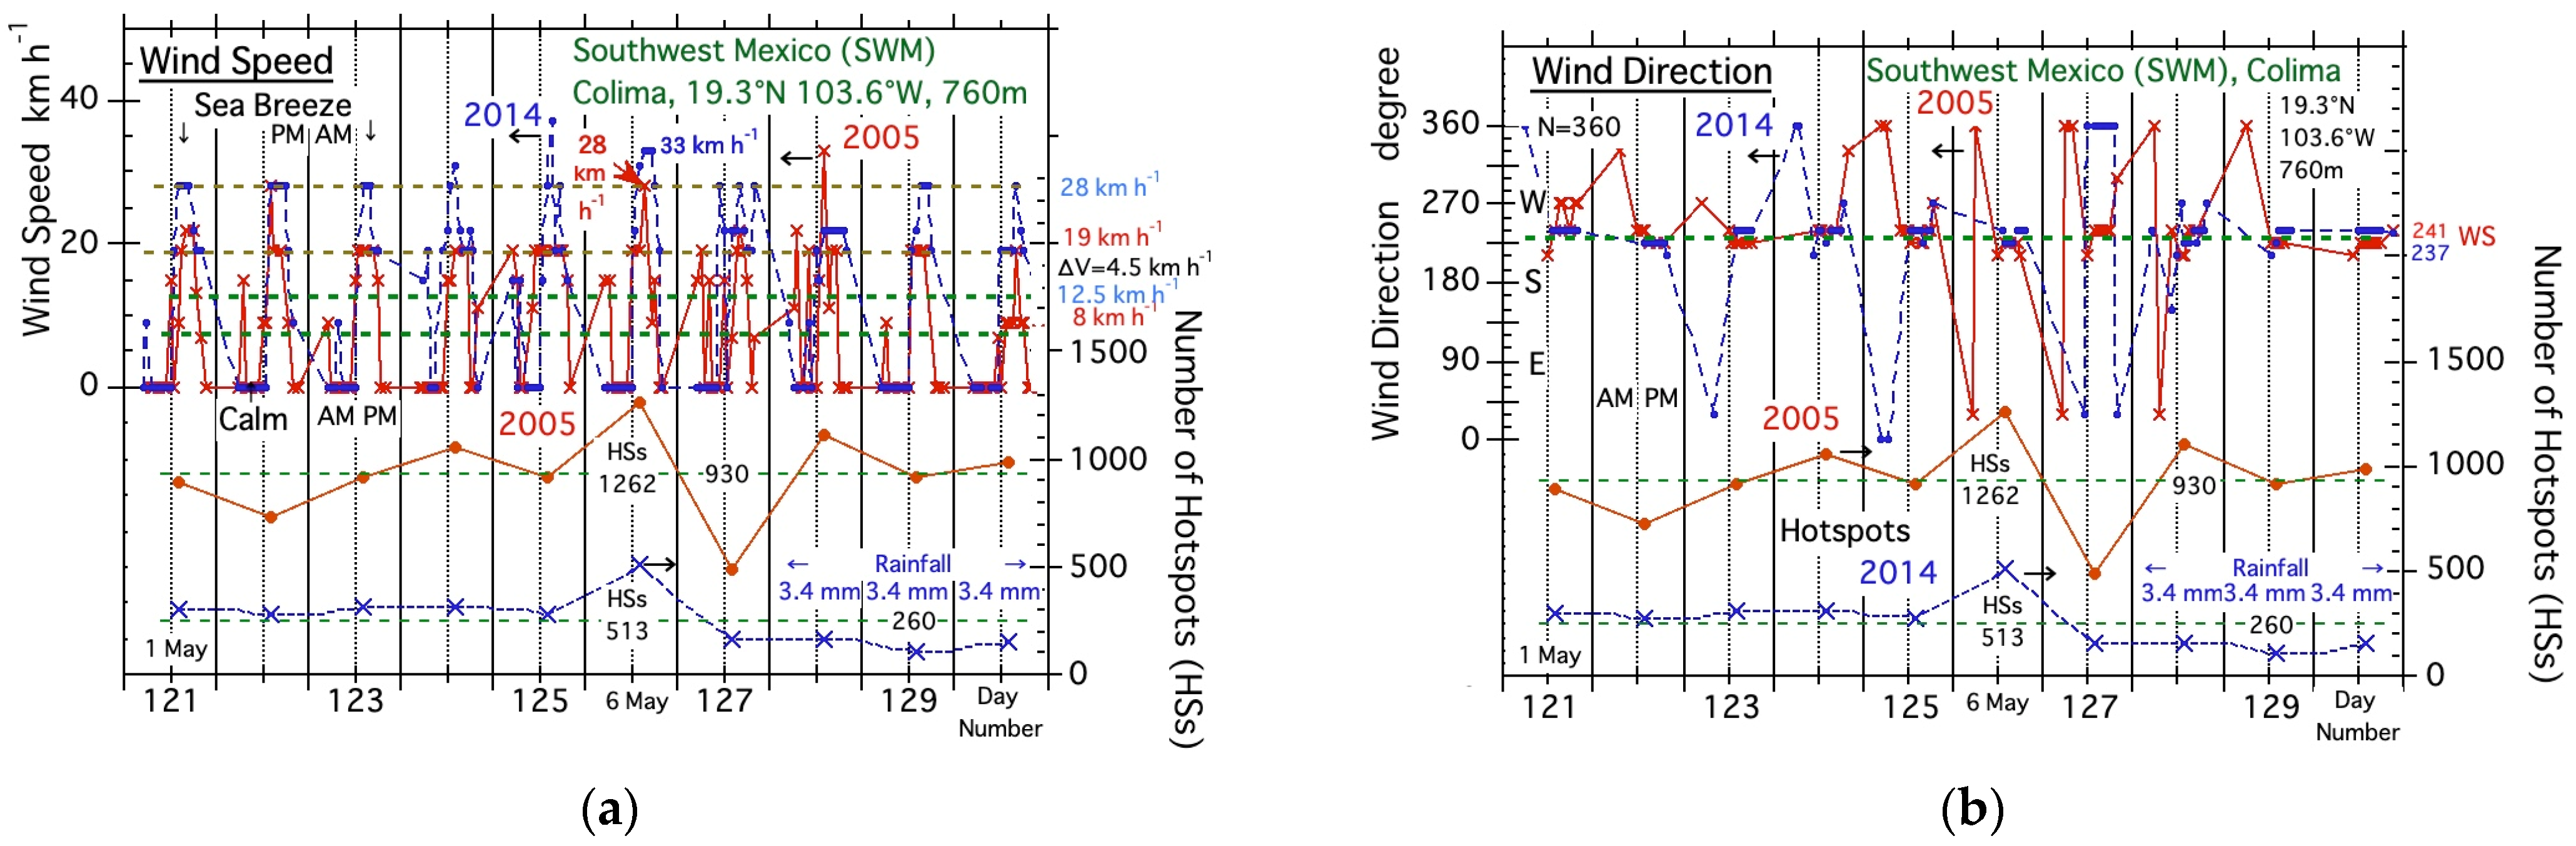
- Wind speed and wind direction
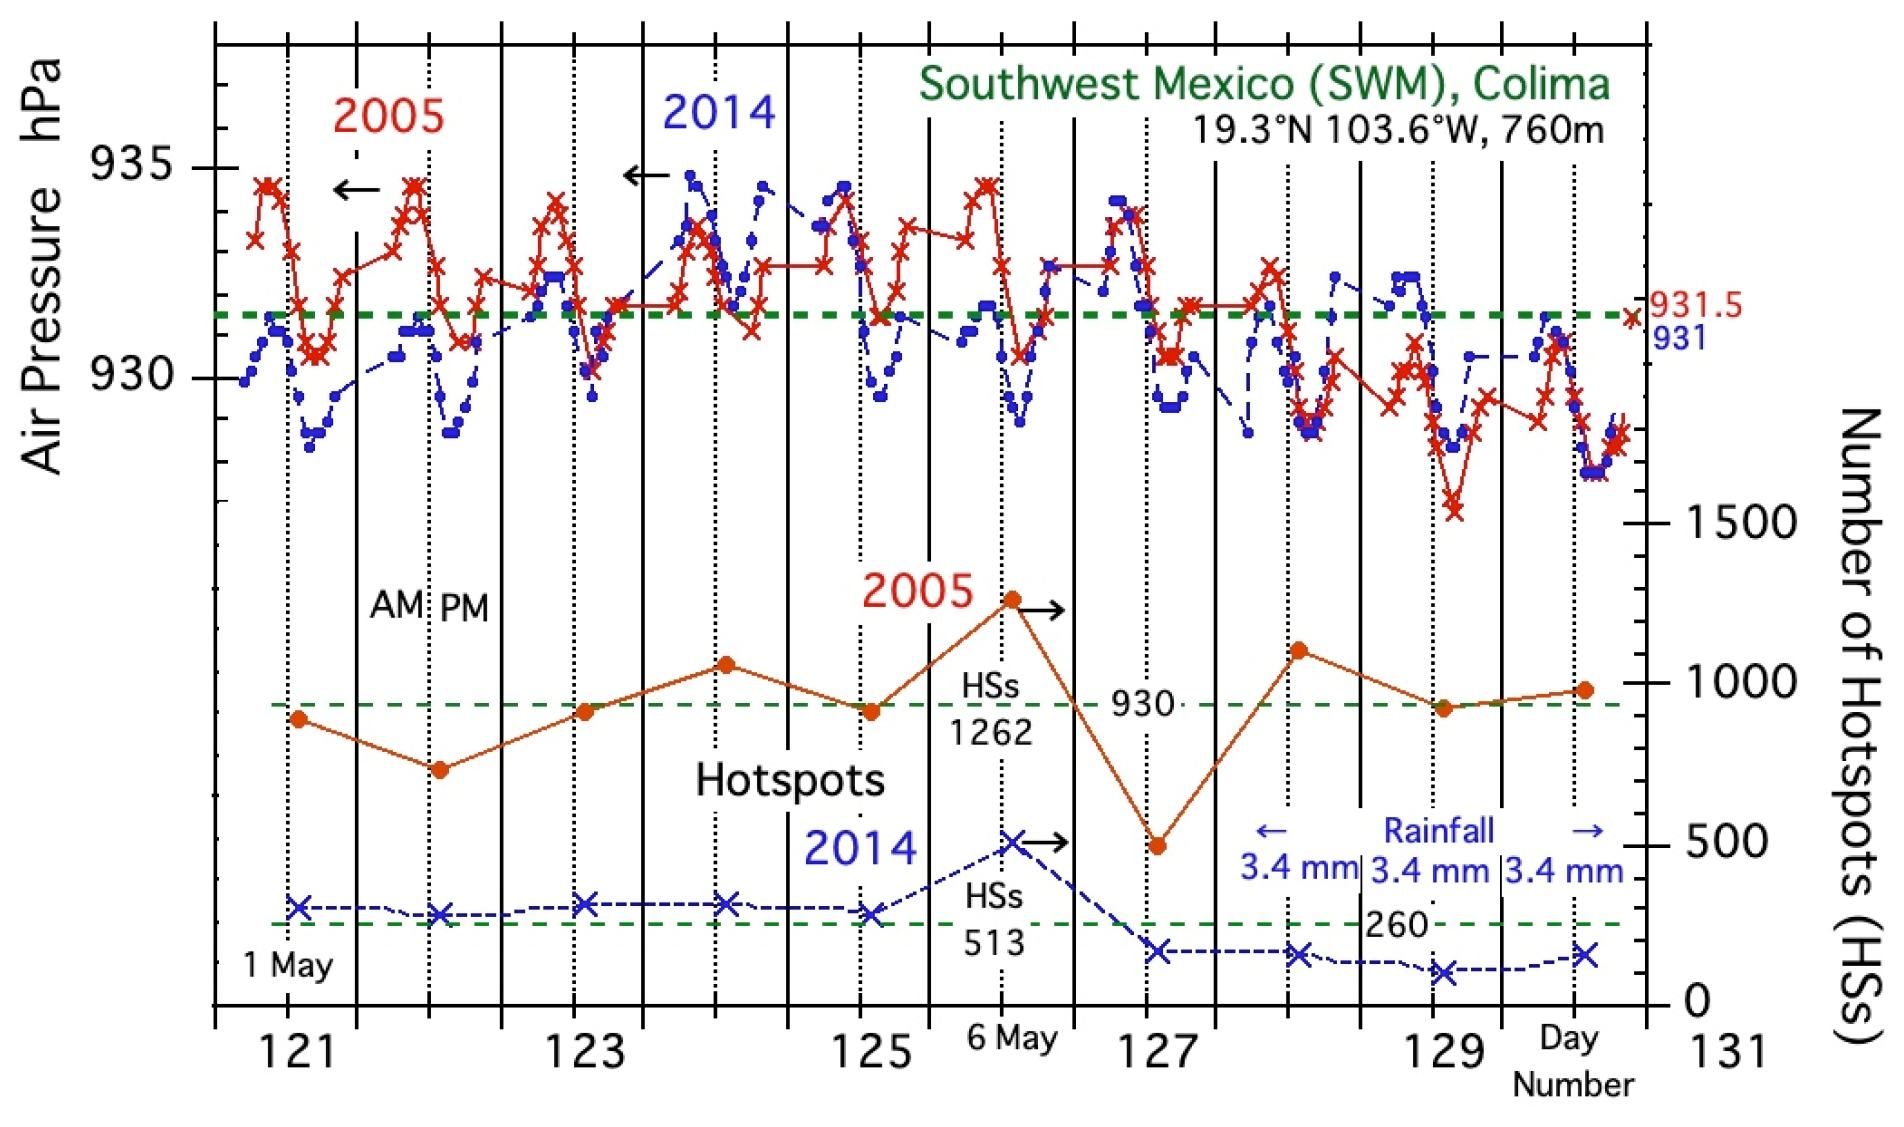
- Air pressure
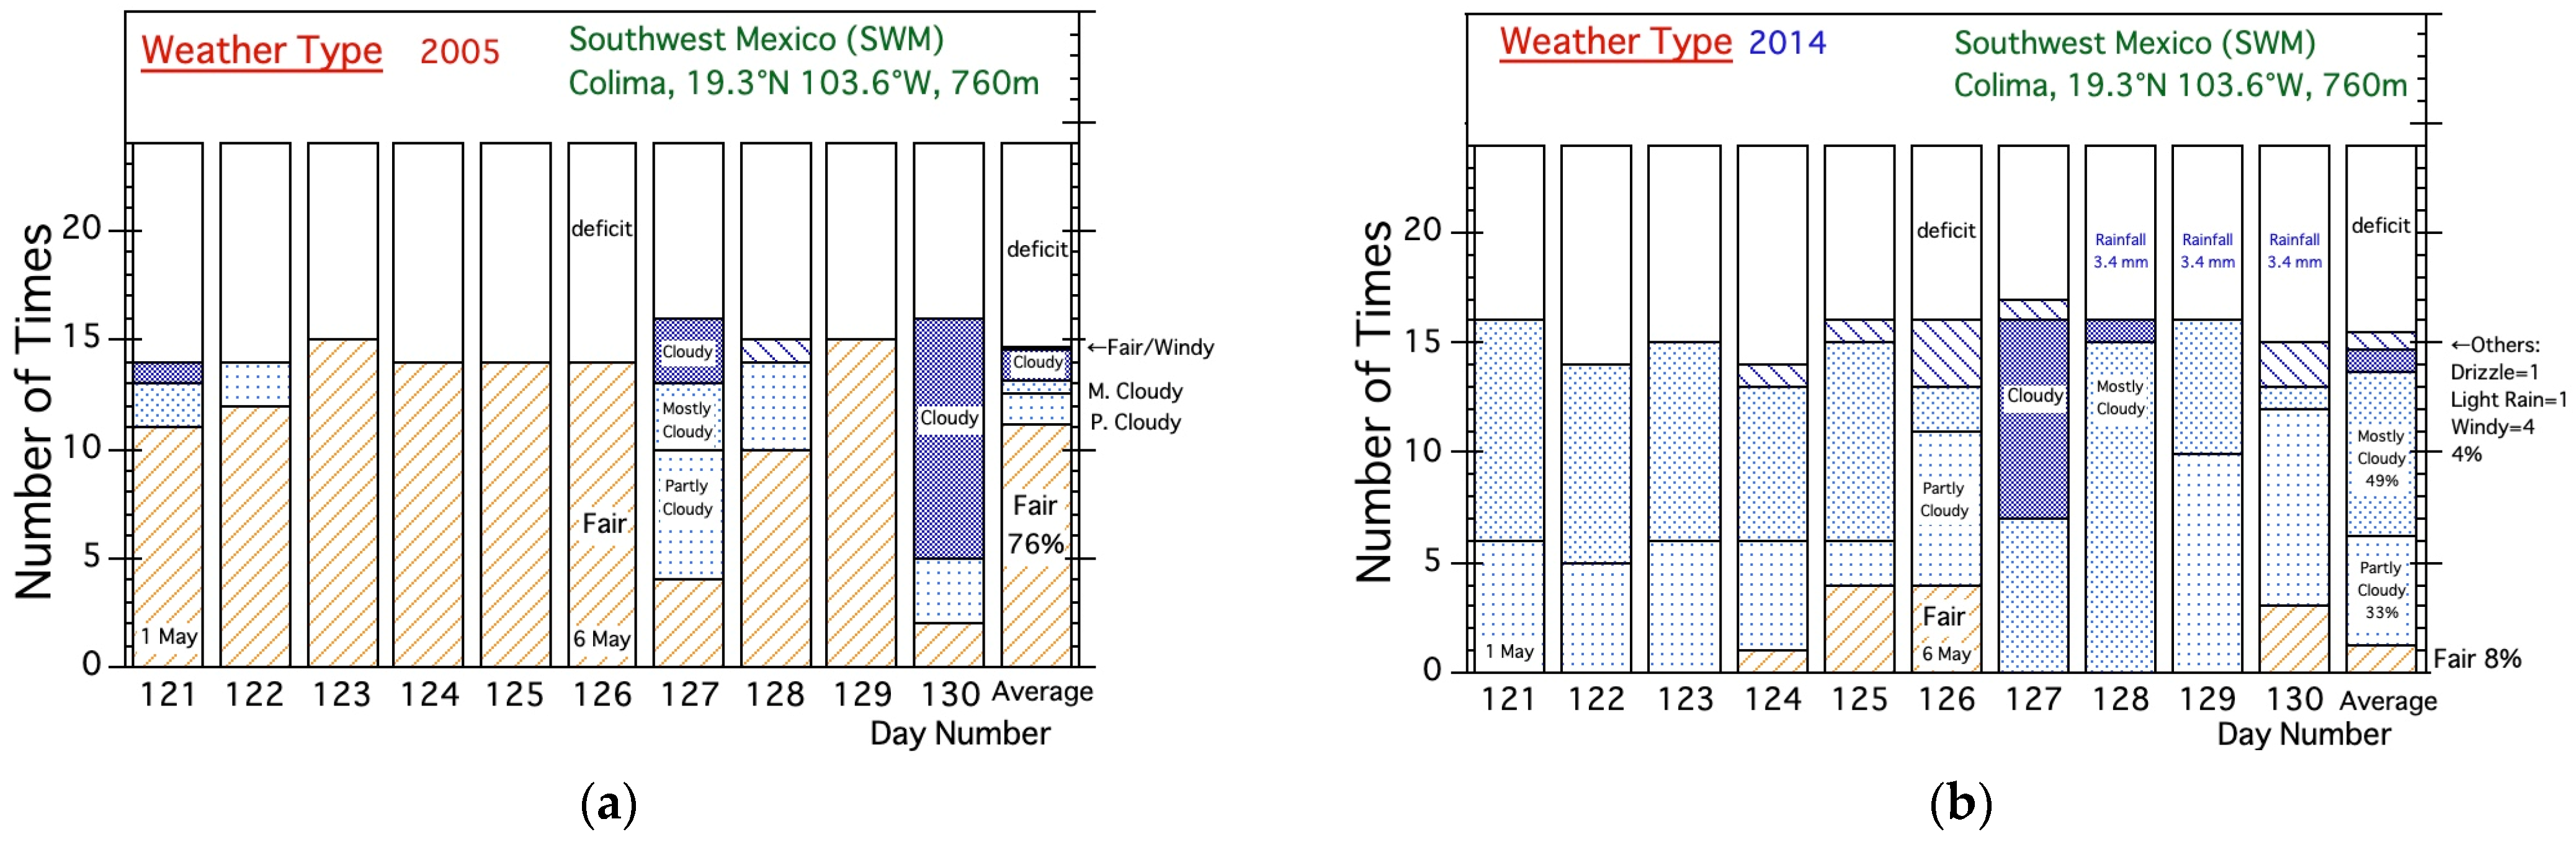
- Weather type
4. Discussion
4.1. Forest Fire Researches in Mexico
4.2. Fire-Prone Weather Conditions in the SEM and the SWM
4.3. Fire-Related Indices for the SEM and SWM
4.3.1. Fire-Related Index for the SEM
4.3.2. Fire-Related Index for the SWM
5. Conclusions
- (1)
- The majority of fires in Mexico (approximately 84%) occur mainly in areas south of the Tropic of Cancer.
- (2)
- Southwest Mexico (the SWM, N < 22°, 94–106° W) and Southeast Mexico (the SEM, N < 22°, 86−94° W) account for 50% and 34% of all fires in Mexico, respectively.
- (3)
- Analysis results using hourly data showed that westerly wind sea breezes from the Pacific Ocean blow toward the coastal land areas of the SWM. Easterly sea breezes from the Caribbean blow into the land area of the SEM.
- (4)
- Fires in the SWM and the SEM became active under high temperatures, low relative humidity, high wind speed, low air pressure, and fair weather. The most sensitive fire weather parameters were “relative humidity” for the SWM and “temperature” for the SEM.
- (5)
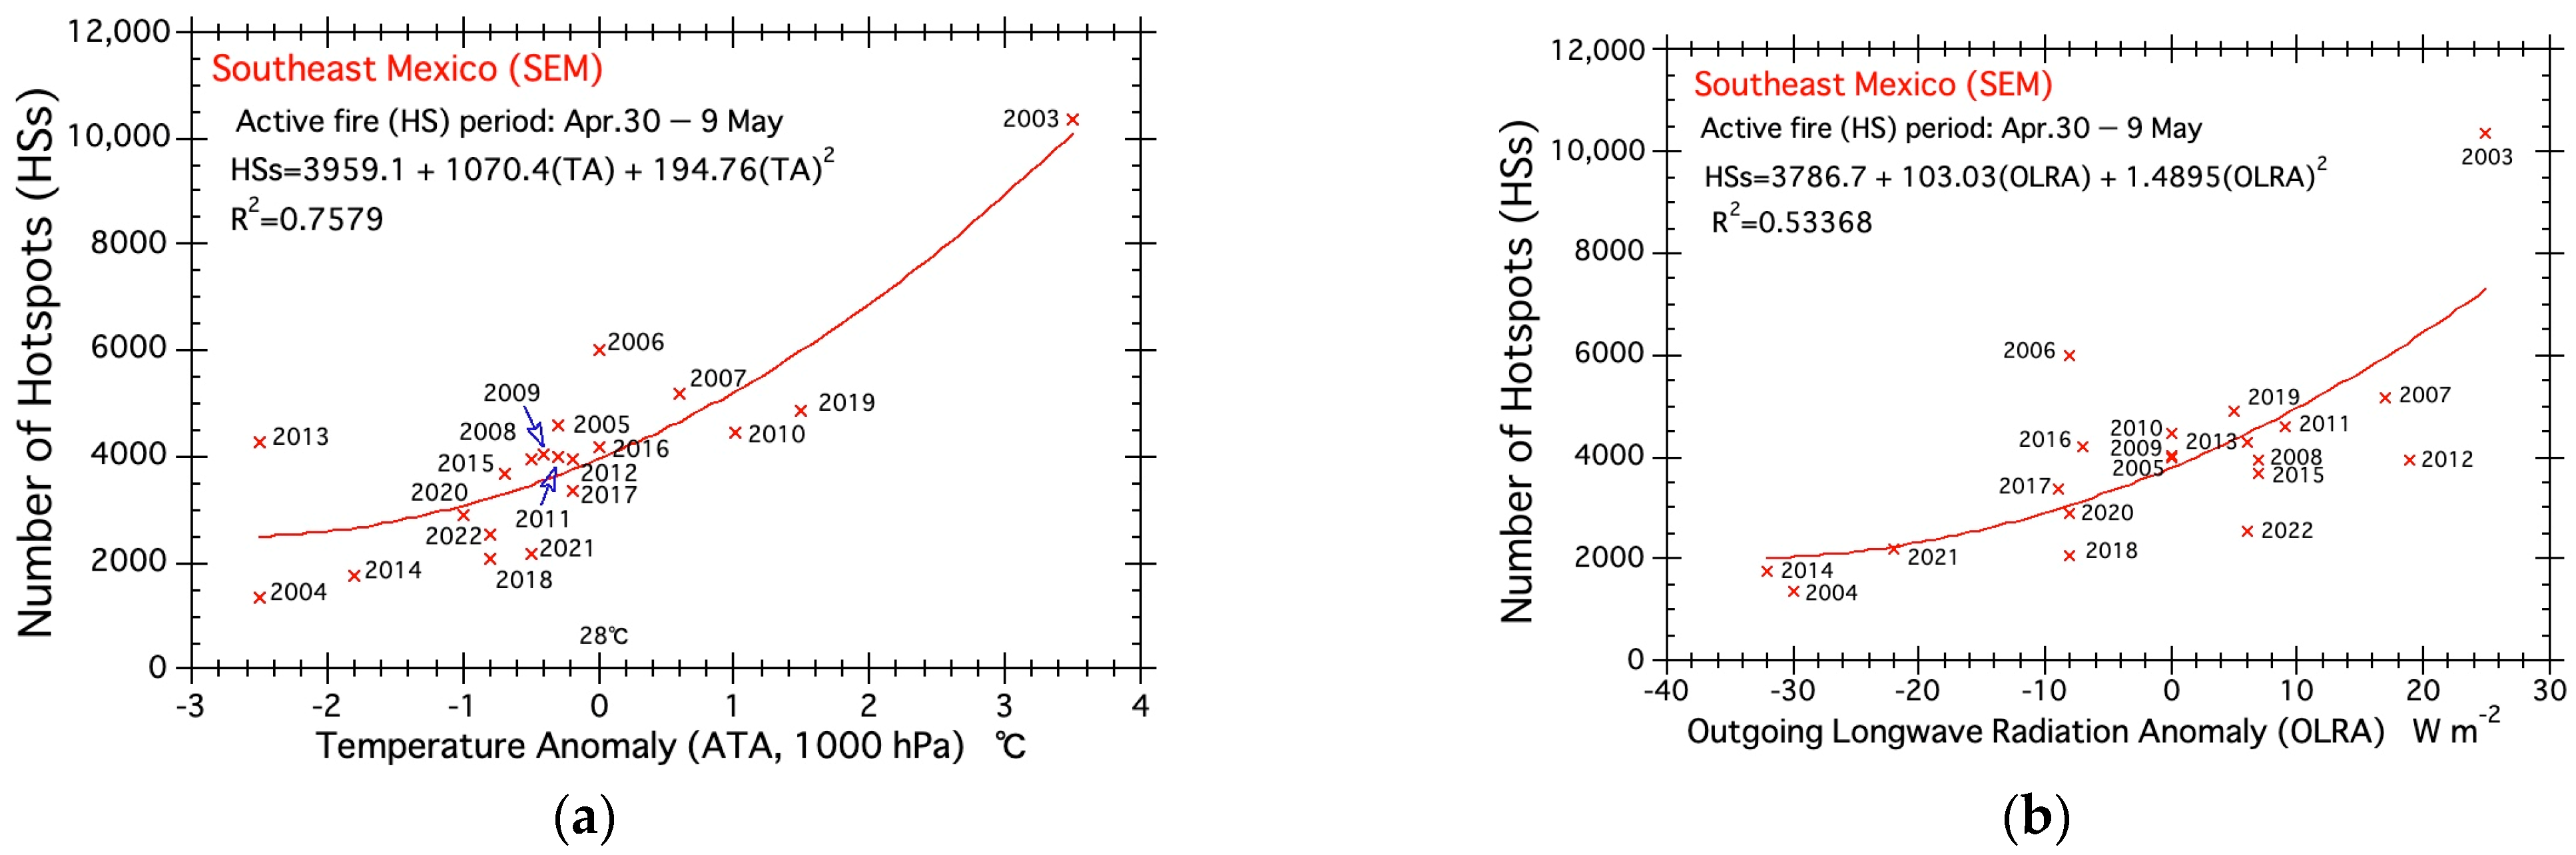
- Based on the analysis results, the fire-related indices selected were “precipitable water vapor anomaly (PWVA)” for the SWM and “temperature anomaly (TA)” for the SEM.
- (6)
- The SWM fire index (PWVA) suggests that future fires will depend on dryness, while the SEM fire index (TA) suggests that future fires will depend on high temperature trends.
Funding
Institutional Review Board Statement
Informed Consent Statement
Data Availability Statement
Acknowledgments
Conflicts of Interest
References
- UN Environment Programme. UN Report Spreading Like Wildfire/The Rising Threat. Available online: https://www.unep.org/resources/report/spreading-wildfire-rising-threat-extraordinary-landscape-fires (accessed on 13 December 2023).
- Benali, A.; Mota, B.; Carvalhais, N.; Oom, D.; Miller, L.M.; Campagnolo, M.L.; Pereira, J.M.C. Bimodal fire regimes unveil a global-scale anthropogenic fingerprint. Glob. Ecol. Biogeogr. 2017, 26, 799–811. [Google Scholar] [CrossRef]
- Morton, D.C.; Defries, R.S.; Randerson, J.T.; Giglio, L.; Schroeder, W.; VAN DER Werf, G.R. Agricultural intensification increases deforestation fire activity in Amazonia. Glob. Chang. Biol. 2008, 14, 2262–2275. [Google Scholar] [CrossRef]
- Ward, D.S.; Kloster, S.; Mahowald, N.M.; Rogers, B.M.; Randerson, J.T.; Hess, P.G. The changing radiative forcing of fires: Global model estimates for past, present and future. Atmos. Chem. Phys. 2012, 12, 10857–10886. [Google Scholar] [CrossRef]
- Cochrane, M.A. The Origins and Control of Forest Fires in the Tropics; London School of Economics and Political Science, Suntory and Toyota: London, UK, 2021. [Google Scholar]
- Cochrane, M.A.; Schulze, M.D. Forest fires in the Brazilian Amazon. Conserv. Biol. 1998, 12, 948–950. [Google Scholar] [CrossRef]
- UNEP. 2002. Available online: https://www.unep.org/resources/report/unep-annual-report-2002 (accessed on 13 December 2023).
- Pan, Y.; Chen, J.M.; Birdsey, R.; McCullough, K.; He, L.; Deng, F. Age structure and disturbance legacy of North American forests. Biogeosciences 2011, 8, 715–732. [Google Scholar] [CrossRef]
- Langner, A.; Miettinen, J.; Siegert, F. Land cover change 2002–2005 in Borneo and the role of fire derived from MODIS imagery. Glob. Chang. Biol. 2007, 13, 2329–2340. [Google Scholar] [CrossRef]
- Hoscilo, A.; Page, S.E.; Tansey, K.J.; Rieley, J.O. Effect of repeated fires on land-cover change on peatland in southern Cen-tral Kalimantan, Indonesia, from 1973 to 2005. Int. J. Wildland Fire 2011, 20, 578–588. [Google Scholar] [CrossRef]
- Miettinen, J.; Shi, C.; Liew, S.C. Deforestation rates in insular Southeast Asia between 2000 and 2010. Glob. Chang. Biol. 2011, 17, 2261–2270. [Google Scholar] [CrossRef]
- Hooijer, A.; Page, S.; Jauhiainen, J.; Lee, W.A.; Lu, X.X.; Idris, A.; Anshari, G. Subsidence and carbon loss in drained tropical peatlands. Biogeosciences 2012, 9, 1053–1071. [Google Scholar] [CrossRef]
- Page, S.E.; Rieley, J.O.; Banks, C.J. Global and regional importance of the tropical peatland carbon pool. Glob. Chang. Biol. 2011, 17, 798–818. [Google Scholar] [CrossRef]
- Dargie, G.C.; Lewis, S.L.; Lawson, I.T.; Mitchard, E.T.A.; Page, S.E.; Bocko, Y.E.; Ifo, S.A. Age, extent and carbon storage of the central Congo Basin peatland complex. Nature 2017, 542, 86–90. [Google Scholar] [CrossRef] [PubMed]
- Rieley, J. Mega Rice Project (MRP) Central Kalimantan. Available online: https://peatlands.org/is-indonesia-heading-foranother-mega-rice-project-disaster/ (accessed on 11 March 2023).
- Aragão, L.E.O.C.; Anderson, L.O.; Fonseca, M.G.; Rosan, T.M.; Vedovato, L.B.; Wagner, F.H.; Silva, C.V.J.; Silva Junior, C.H.L.; Arai, E.; Aguiar, A.P.; et al. 21st Century drought-related fires counteract the decline of Amazon deforestation carbon emissions. Nat. Commun. 2018, 9, 536. [Google Scholar] [CrossRef]
- Libonati, R.; Belém, L.B.C.; Rodrigues, J.A.; Santos, F.L.M.; Sena, C.A.P.; Pinto, M.M.; Filippe, L.; Carvalho, I.A. Sistema ALARMES—Alerta de Área Queimada Pantanal, Situação Final de 2020. Nota Técnica 01/2021; Laboratório de Aplicações de Satélites Ambientais: Rio de Janeiro, Brazil, 2021. [Google Scholar] [CrossRef]
- Geirinhas, J.L.; Trigo, R.M.; Libonati, R.; Coelho, C.A.; Palmeira, A.C. Climatic and synoptic characterization of heat waves in Brazil. Int. J. Climatol. 2018, 38, 1760–1776. [Google Scholar] [CrossRef]
- Panisset, J.S.; Libonati, R.; Gouveia CM, P.; Machado-Silva, F.; França, D.A.; França JR, A.; Peres, L.F. Contrasting patterns of the extreme drought episodes of 2005, 2010 and 2015 in the Amazon Basin. Int. J. Climatol. 2018, 38, 1096–1104. [Google Scholar] [CrossRef]
- Machado-Silva, F.; Libonati, R.; de Lima, T.F.M.; Peixoto, R.B.; França, J.R.d.A.; Magalhães, M.d.A.F.M.; Santos, F.L.M.; Rodrigues, J.A.; DaCamara, C.C. Drought and fires influence the respiratory diseases hospitalizations in the Amazon. Ecol. Indic. 2020, 109, 105817. [Google Scholar] [CrossRef]
- Junior, C.H.L.S.; Aragão, L.E.O.C.; Fonseca, M.G.; Almeida, C.T.; Vedovato, L.B.; Anderson, L.O. Deforestation-Induced Fragmentation Increases Forest Fire Occurrence in Central Brazilian Amazonia. Forests 2018, 9, 305. [Google Scholar] [CrossRef]
- Bistinas, I.; Harrison, S.P.; Prentice, I.C.; Pereira, J.M.C. Causal relationships versus emergent patterns in the global controls of fire frequency. Biogeosciences 2014, 11, 5087–5101. [Google Scholar] [CrossRef]
- Staver, A.C.; Archibald, S.; Levin, S.A. The global extent and determinants of savanna and forest as alter-native biome states. Science 2011, 334, 230–232. [Google Scholar] [CrossRef]
- Aleman, J.C.; Fayolle, A. Long-term vegetation change in Central Africa: The need for an integrated management framework for forests and savannas. In Sustainability Challenges in Sub-Saharan Africa I: Continental Perspectives and Insights from Western and Central Africa; Science for Sustainable Societies, Series; Gasparatos, A., Ahmed, A., Naidoo, M., Karanja, A., Fukushi, K., Saito, O., Takeuchi, K., Eds.; Springer: Singapore, 2020; Chapter 9; pp. 281–315. [Google Scholar] [CrossRef]
- Alvarado, S.T.; Andela, N.; Silva, T.S.F.; Archibald, S. Thresholds of fire response to moisture and fuel load differ between tropical savannas and grasslands across continents. Glob. Ecol. Biogeogr. 2019, 29, 331–344. [Google Scholar] [CrossRef]
- VAN Wilgen, B.; Govender, N.; Biggs, H.; Ntsala, D.; Funda, X. Response of Savanna Fire Regimes to Changing Fire-Management Policies in a Large African National Park. Conserv. Biol. 2004, 18, 1533–1540. [Google Scholar] [CrossRef]
- Jia, G.; Shevliakova, E.; Artaxo, P.; De Noblet-Ducoudré, N.; Houghton, R.; House, J.; Kitajima, K.; Lennard, C.; Popp, A.; Sirin, A.; et al. Land–Climate Interactions. In Climate Change and Land: An IPCC Special Report on Climate Change, Desertification, Land Degradation, Sustainable Land Management, Food Security, and Greenhouse Gas Fluxes in Terrestrial Ecosystems; Shukla, P.R., Skea, J., Buendia, E.C., Masson-Delmotte, V., Pörtner, H.-O., Roberts, D.C., Zhai, P., Slade, R., Connors, S., van Diemen, R., et al., Eds.; 2019; in press; Available online: https://www.ipcc.ch/site/assets/uploads/2019/11/05_Chapter-2.pdf (accessed on 1 October 2023).
- Hayasaka, H.; Tanaka, H.L.; Bieniek, P.A. Synoptic-scale fire weather conditions in Alaska. Polar Sci. 2016, 10, 217–226. [Google Scholar] [CrossRef]
- Hayasaka, H.; Yamazaki, K.; Naito, D. Weather Conditions and Warm Air Masses during Active Fire-periods in Boreal Forests. Polar Sci. 2019, 22, 100472. [Google Scholar] [CrossRef]
- Hayasaka, H. Rare and Extreme Wildland Fire in Sakha in 2021. Atmosphere 2021, 12, 1572. [Google Scholar] [CrossRef]
- Hayasaka, H. Fire Weather Conditions in Boreal and Polar Regions in 2002–2021. Atmosphere 2022, 13, 1117. [Google Scholar] [CrossRef]
- Hayasaka, H. Peatland Fire Weather Conditions in Sumatra, Indonesia. Climate 2023, 11, 92. [Google Scholar] [CrossRef]
- Hayasaka, H. Fire Weather Conditions in Plantation Areas in Northern Sumatra, Indonesia. Atmosphere 2023, 14, 1480. [Google Scholar] [CrossRef]
- Usup, A.; Hayasaka, H. Peatland Fire Weather Conditions in Central Kalimantan, Indonesia. Fire 2023, 6, 182. [Google Scholar] [CrossRef]
- Yulianti, N.; Hayasaka, H. Recent Active Fires in Indonesia’s Southern Papua Province Caused by El Niño Conditions. Remote. Sens. 2023, 15, 2709. [Google Scholar] [CrossRef]
- Worldview. Available online: https://worldview.earthdata.nasa.gov/ (accessed on 12 October 2023).
- Climate and Average Weather Year Round in Villahermosa, Weather Spark. Available online: https://weatherspark.com/y/10690/Average-Weather-in-Villahermosa-Mexico-Year-Round (accessed on 1 October 2023).
- Thermal Low. Available online: https://glossary.ametsoc.org/wiki/Thermal_low (accessed on 30 November 2023).
- Climate and Average Weather Year Round in Colima, Weather Spark. Available online: https://weatherspark.com/y/3823/Average-Weather-in-Colima-Mexico-Year-Round (accessed on 1 October 2023).
- Galván, L.; Magaña, V. Forest fires in Mexico: An approach to estimate fire probabilities. Int. J. Wildland Fire 2020, 29, 753–763. [Google Scholar] [CrossRef]
- Domínguez, R.M.; Trejo, D.A.R. Forest Fires in Mexico and Central América. In Proceedings of the Second International Symposium on Fire Economics, Planning, and Policy: A Global View, Albany, CA, USA, 19–22 April 2008. [Google Scholar]
- Alizadeh, M.R.; Abatzoglou, J.T.; Adamowski, J.; Rad, A.M.; AghaKouchak, A.; Pausata, F.S.R.; Sadegh, M. Elevation-dependent intensification of fire danger in the western United States. Nat. Commun. 2023, 14, 1773. [Google Scholar] [CrossRef] [PubMed]
- Kelsey, V.; Riley, S.; Minschwaner, K. Atmospheric precipitable water vapor and its correlation with clear-sky infrared temperature observations. Atmospheric Meas. Technol. 2022, 15, 1563–1576. [Google Scholar] [CrossRef]


Disclaimer/Publisher’s Note: The statements, opinions and data contained in all publications are solely those of the individual author(s) and contributor(s) and not of MDPI and/or the editor(s). MDPI and/or the editor(s) disclaim responsibility for any injury to people or property resulting from any ideas, methods, instructions or products referred to in the content. |
© 2024 by the author. Licensee MDPI, Basel, Switzerland. This article is an open access article distributed under the terms and conditions of the Creative Commons Attribution (CC BY) license (https://creativecommons.org/licenses/by/4.0/).
Share and Cite
Hayasaka, H. Synoptic-Scale Wildland Fire Weather Conditions in Mexico. Atmosphere 2024, 15, 96. https://doi.org/10.3390/atmos15010096
Hayasaka H. Synoptic-Scale Wildland Fire Weather Conditions in Mexico. Atmosphere. 2024; 15(1):96. https://doi.org/10.3390/atmos15010096
Chicago/Turabian StyleHayasaka, Hiroshi. 2024. "Synoptic-Scale Wildland Fire Weather Conditions in Mexico" Atmosphere 15, no. 1: 96. https://doi.org/10.3390/atmos15010096
APA StyleHayasaka, H. (2024). Synoptic-Scale Wildland Fire Weather Conditions in Mexico. Atmosphere, 15(1), 96. https://doi.org/10.3390/atmos15010096