Abstract
Polycyclic aromatic compounds (PAHs) have been noted to generate a high risk for human health. Their presence and concentration have not been equally distributed in the environment and various anthropic activities favored the environmental presence of specific pollution components. The economic sector of bakery, as well as intensive animal breeding, are well spread worldwide and they represent a priority economic sector due to their direct link to the food industry. In this study, particulate matter (PM) and PAH pollutant compounds were monitored and their presence and concentration were correlated with specific anthropic activities such as bakery and animal husbandry. For the first time, the data analysis established correlations between PM10 or PM2.5 sizes and concentrations with a specific anthropic activity (bakery vs. animal husbandry). PM10 seemed to be more present at sites of animal husbandry activities than bakery ones. The vast majority of high PAH concentrations were detected in industrial sites such as bakeries. Spearman statistical correlation tests of intensive breeding of animals and bakery fields showed a moderate correlation between dimensional fractions of particulate matters, which indicated several emission sources, with different characteristics.
1. Introduction
Air pollution, in the context of climate change, impacts human health and, therefore, generates special attention among both scientific researchers and populations, respectively [1]. The toxic compounds most frequently quantified in the monitoring studies carried out worldwide have been gas-phase pollutants (e.g., ozone, nitrogen dioxide, sulfur dioxide, carbon monoxide, etc.), particulate matter (PM, especially particles less than 2.5 μm in diameter, PM2.5), volatile organic compounds (VOCs), dioxins, metals (ex. Cu, Cr, Mn, Ni, Pb), and polycyclic aromatic compounds (PAHs) [1,2,3,4,5]. Epidemiologic studies indicated that exposure to polluted air increased the risk of developing respiratory diseases [1] and circulatory and cardiovascular diseases [1,2,3]. In addition, air pollution amplifies symptoms of mental disorders and, overall, it increases mortality risk [5]. The most vulnerable groups to air pollution include the elderly, pregnant, persons with chronic diseases, and children [1,2,3,4,5]. There are two types of air pollution sources, the first one has been generated by industrial activities; road, naval, and air transport; construction sites; forest wildfire; volcanic activity; various domestic stationary sources (heating, cooking, personal care products, and cleaning products); and activities from the agricultural sector [6]. Pollutants resulting from primary sources are carbon monoxide (CO), carbon dioxide (CO2), methane (CH4), VOCs, ammonia (NH3), sulfur dioxide (SO2), nitric oxide (NO), PM, and nitrogen dioxide (NO2). The second pollution source stems from chemical reactions, naturally carried out into the environment, generating ozone (O3), nitric acid (HNO3), sulfate (SO42−), sulfuric acid (H2SO4), PM, and NO2 [6].
The increase in PM concentration has been a serious problem for the environment. Large quantities of PM generate poor air quality with negative effects on visibility, climate change, and radiative forces [6]. In addition, particulate matters alone or in combination with other chemical compounds, depending on the anthropic activities carried out regionally, induce negative health effects. PM composition consists of mineral dust, organic and inorganic salts, and black carbon, with different compositions depending on weather conditions and provenience (urban or rural locations) [6]. PM2.5s are fine particles, with aerodynamic diameters smaller or equal to 2.5 µm, while PM10s have aerodynamic diameters smaller or equal to 10 µm. PM2.5s penetrate through the lung more effectively, due to their small size compared to PM10, and for this reason, they pose a major threat to human health [7].
The annual average concentration of PM2.5 in East Asia and Pacific regions was 43 µg/m3 and 67 µg/m3 in Sub-Saharan Africa. The study carried out by the National Council on Climate and Air Quality of the Republic of Korea from 2021 [7] showed a magnitude order of exposure reaching a level of 7, which was higher for the population from Africa as compared to people from North America. Moreover, 95% of the world population is currently exposed to PM2.5 concentrations higher than 15 µg/m3, the WHO-recommended threshold. Under this threshold, the number of deaths linked to air pollution decreased by 15% [6]. Another study based on the UK Biobank cohort, conducted in 2023, showed that PM2.5 and PM10 had a higher negative impact on elderly participants (age ≥ 55) with asthma disorders compared to younger participants (age < 55) [8]. Some studies indicated that long-term exposures to air pollution with PM2.5, PM10, and nitrogen oxides (NO2 and NOx) have been a stress factor that increased cardiovascular diseases (CVD), mental disorders incidents among patients with prediabetic and diabetic conditions, risk of bipolar disorders incidents, and, finally, risks of death [8,9,10,11]. In China and other major countries that produce coal, the raw material is stored on the ground outside, causing pollution with PM due to wind erosion [12]. The PM’s negative effect on human health has been potentiated by the presence of PAH-coated PMs. PAH compounds induce a great risk to human health due to their carcinogenic, mutagenic, and teratogenic properties [13,14].
The physical–chemical properties of PAHs make them persistent and highly mobile in the environment, allowing them a wide distribution across air, soil, and water bodies [15,16,17]. In the atmosphere, low molecular weight PAHs (2- and 3-ring PAHs) are mainly distributed in the gaseous phase, while heavier PAHs tend to be associated with particulate matter [18]. PAH compounds are generated in the atmosphere as a result of incomplete combustion of organic matter from different heat sources such as domestic heating, traffic, forest wildfire, volcanic eruptions [15,19,20,21], and incineration during the pyrolysis and incomplete combustion of fossil fuels and biomass [22]. Other PAH sources come from iron and steel production, cement manufacturing, or coal production [23,24,25]. A study on maternal residences from New Mexico, USA, exposed to industrial emissions (BTEX, PAHs, O3, chlorine, metals such as Cr, Hg, Mn, Ni, and Pb) associated the high incidence of low-weight baby birth with 1,2,4-trimethylbenzene, benzene, chlorine, ethylbenzene, and styrene presence [26]. European Directive 2004/107/EC released by the European Parliament and the Council of the European Union established that average concentrations for 1 year of measurement should not exceed 1 ng/m3 of benzo(a)pyrene in PM10 particulate matter. The directive states that other important PAHs such as benzo(a)anthracene, benzo(b)fluoranthene, and benzo(j)fluoranthene should also be measured in both PM10 and bulk deposition, but no additional threshold values were established because benzo(a)pyrene was considered an indicator of the remaining PAHs [27].
Other categories of pollutants associated with PM are metals and metalloids. The most important and toxic air pollutant is Pb, because of the industrial pollution and traffic (vehicle with an engine based on Pb-fuel) [13]. In addition, other air pollutants can be mentioned, such as Cu and Cd from industrial sources as well as Cr, Mn, Ni, V, Pb, Zn, and Ti from traffic sources. WHO Air quality guidelines imposed maximum limits for Pb (0.5 µg/m3), Cd (0.005 µg/m3), Mn (0.15 µg/m3), Ni (0.02 µg/m3), and V (0.02 µg/m3) [28]. A multitude of worldwide studies on atmospheric and urban air indicated the presence of metals and metalloids such as Cu, Ni, and Pb (Cairo, Egypt) [29]; As and Cr (Hanoi, Vietnam) [30]; Al, Cd, Cu, Fe, Mn, Pb, and Zn (Kowloon Tong, Hong Kong) [31]; Al, As, Cr, Cu, Fe, Ni, and Al (Iasi, Romania) [32].
In this study, we analyzed air pollution based on the size and concentration of particulate matters found in emissions, as well as on chemical compounds found in PM with a high degree of risk to human health, like heavy metals and polycyclic aromatic hydrocarbons PAH [33]. The measured concentrations of particulate matters (total PM, PM 10, PM 2.5, PM 1.0) [34,35] from representative areas, chosen as a model, located in the vicinity of two industrial platforms were compared to the PM limits imposed by Romanian Law 104/2011 for PM10, as well as by STAS 12574-87 for total particulate matters [36,37]. The study took place in the industrial areas related to the cities of Timisoara and Bucharest, covering two different economic fields: intensive animal breeding and the food industry (bakery). The concentrations of particulate matters (total suspended particle, PM10, PM2.5) were monitored together with the concentrations of heavy metals and PAHs present in PM. The results showed direct correlations between PM size, the concentration of chemical compounds present on the particulate matters, and a specific anthropic activity. The test results were expressed in values of the Spearman correlation coefficient.
2. Materials and Methods
2.1. Sampling Campaigns Locations
Monitoring of emissions was carried out in a bakery industrial area in Bucharest and in animal husbandry farms from Timisoara during the summer and autumn of 2022. Sampling campaigns had similar moderate weather conditions with temperatures between 25 ÷ 33 °C and wind speeds between 0.5 ÷ 1.9 m/s. Sampling points were chosen in order to assess only the contribution of industrial sources (a sampling point was placed in the wind-dominant direction from the source) versus the natural pollution background (a sampling point was placed before the pollution source in the wind-dominant direction) (Figure 1).
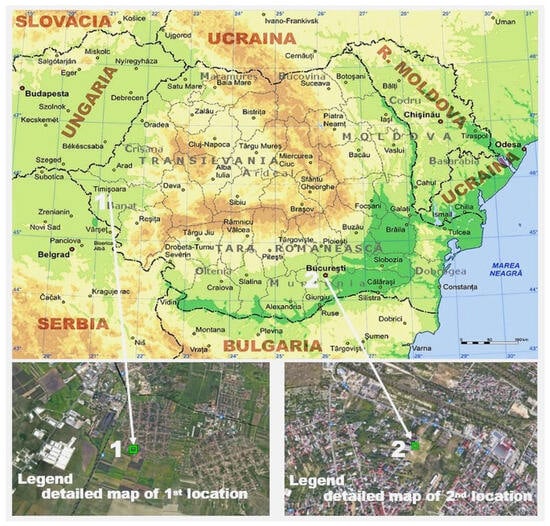
Figure 1.
Location of sampling points on Romania map and detailed maps according to google map: Timisoara (1), Bucharest (2); GPS location of monitoring points: Timisoara (45°41′53.41″ N; 21°12′30.33″ E) and Bucharest (44°28′23.12″ N; 26°0′43.05″ E), Romania.
2.2. Particulate Matters Sampling
The samplings of particulate matters were collected by absorbing a measured volume of air onto filters with a predetermined flow rate using dedicated sampling systems, equipped with impactors and impactor inlets with scrubbers for the measurement of PAHs [38]. The impactors were used to separate the PM10 and PM2.5 fractions, and the particulate matters were sampled on Ø 47 mm Whatman quartz filters, using TCR Tecora and Sven Lech sampler’s equipment. Total suspended particles (TSP) were collected using the same equipment without impactors. The minimum sampling period was 24 h with a flow rate of 2.3 m3/h.
The compounds of interest retained in the particulate matters were recovered from the filters and from the particulate matters using a sample preparation stage in order to quantify metallic elements and PAH compounds. The metals are measured by ICP-MS and PAHs are determined by HPLC, respectively.
2.3. PAHs Detection
PAHs were extracted from the particulate matters deposited on the filters by liquid–solid extraction with acetone and petroleum ether. The extract was concentrated and interfering compounds were removed by purification with aluminum oxide. The purified eluate was concentrated and taken up with acetonitrile. For the separation and quantification of the analytes, the Ultimate 3000 UHPLC-FLD chromatograph (Thermo Electron, Germering, Germany) and the Hypersyl Green PAH column (Thermo Electron, Germering, Germany) (250 mm × 3 mm, 5 µm) were used. The mobile phase used was a gradient of acetonitrile (A) and ultrapure water with a flow rate of 0.9 mL/min as follows: 0–3 min isocratic elution 60% solvent A, 3–15 min gradient elution 60–100% A, 15–27 min isocratic elution 100%. In 27 min, all the analytes of interest were separated. An injection volume of 10 µL was used and the temperature set in the column thermostat was 20 °C. The program of the excitation and emission wavelengths at which the fluorescence detector signals were recorded and the chromatograms of the environmental samples can be seen in Table 1.

Table 1.
Fluorescence, excitation, and emission wavelengths for the detection of PAHs.
The performance of the PAH measurement method was evaluated in terms of linearity, method quantitation limit (MQL), extraction efficiency, and precision (repeatability and reproducibility).
Linearity and precision were determined by analyzing a dilution series of standard PAH mixtures in acetonitrile, ranging from 2 ng mL−1 to 120 ng mL−1 of individual PAHs in five dilution steps. Blank and low spike samples were analyzed directly, and limits of quantification were evaluated from the concentration of PAHs required to give at least a signal-to-noise ratio of 10. A calibration curve was performed for every sequence of analysis and the value of the determination coefficient (R2) was higher than 0.99. The quantification limit assumed for all compounds was 0.1 µg/m3.
Quality assurance and quality controls (QA/QC) were conducted by performing laboratory blanks, sample blanks, and recoveries of spiked samples which were analyzed before spike and after spike. The laboratory blanks and sampling blanks were prepared and analyzed in the same conditions as real samples. The relative standard deviation was less than 15% for PAHs. A clean filter was exposed to the same sampling environment as a field blank. The precision was expressed as residual standard deviation. Repeatability (which was determined for the same sample in triplicate) was in the range of 4.36% and 7.51% while the reproducibility had values in the range of 7.21% and 14.36%, proving that the method is accurate.
In addition, for QA/QC, a matrix-type Certified Reference Material (CRM) ERM-CZ100 PAHs in fine dust (PM10-like) was used. The results (certified and obtained) are presented in Table 2. The recovery rate was performed in triplicate and ranged between 75.97% and 94.15% for all analytes (Table 2).

Table 2.
Quality control of PAHs using an ERM-CZ100 PAHs in fine dust (PM10-like) CRM.
The Chromeleon 7.0 HPLC software graphically plotted the calibration curves by representing on the ordinate the areas of the chromatographic peaks as a function of concentration. The quantification of the analytes was carried out using the calibration method with an external standard interpolating on the ordinate the values of the areas obtained in the case of the analyzed samples (Figure 2b). The chromatograms corresponding to a calibration standard of 40 µg/L and for a sample are presented in Figure 2.
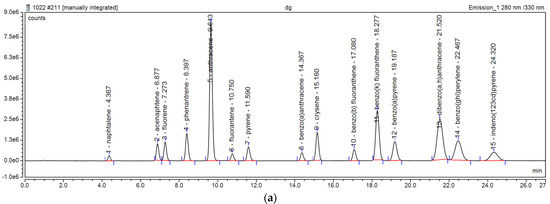
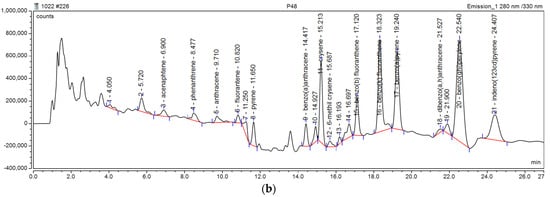
Figure 2.
HPLC−FLD chromatograms of a 40 µg/L calibration standard (a) and a sample (b).
The total PAHs represent the sum of fluoranthene, benzo(b)fluoranthene, benzo(a)pyrene, benzo(ghi)perylene, and indeno(1,2,3-cd)pyrene.
2.4. Metallic Elements Detection
In order to analyze the metals, a pretreatment step of the particulate matter (PM2.5, PM10, TSP) was performed in HNO3 ultrapure quality for trace analysis solution (Merck KGaA, Darmstadt, Germany) using an Ethos Up microwave digestion system (Milestone, Sorisole, Italy). Metal analysis was carried out on an Inductively Coupled Plasma Mass Spectrometer—ICP-MS Agilent 7900 (Agilent, Santa Clara, CA, USA) equipped with a quadrupole mass analyzer (Agilent, Santa Clara, CA, USA) using as an ion source, plasma generated at atmospheric pressure by means of a radio frequency field in a flow of argon. Calibration curves in the range 2 µg/L to 10 µg/L for As, Cd, Co, Cr, Cu, Mn, Mo, Ni, Pb, and Ti were plotted using certified reference material (CRM) ICP multi-element standard solution XVI 100 mg/L (Merck KGaA, Darmstadt, Germany). For Sr and Zn, the same CRM was used and the calibration curves were made from 10 µg/L to 100 µg/L. The quality control of the results was carried out on a second CRM Solution made of 21 components, 100 mg/L each (As, Cd, Co, Cr, Cu, Mn, Mo, Ni, Pb, Sr, Ti, Zn) provided by CPAChem (Stara Zagora, Bulgaria).
In addition, two different matrix type CRMs were used: BCR-176R fly ash (As, Cd, Co, Cr, Cu, Ni, Pb, Zn) and ERM-CZ120 fine dust, PM10-like (certified values for As, Cd, Pb, Ni; informative values for Co, Cr, Cu, Zn, Mn, Mo, Ti). The recovery percentages were situated in the range of 87.61% to 116.7% for fine dust and between 95.62% and 105.6% for fly ash. The literature data indicated the accepted recovery range as follows: 80% to 110% for 1 ppm, 90% to 110% for 10 ppm, 90% to 107% for 100, and 95% to 105% for 0.1% ppm [39]. As is presented in Table 3, all the obtained results were situated in the recommended range.

Table 3.
Obtained recovery percentage for analyzed metals in ERM-CZ120 and BCR-176R CRMs.
2.5. Measurement Uncertainty of the Applied Methods
The expanded uncertainty values for the applied analytical methods are presented in Table 4. These values were used only on the QA/QC control. The experimental data presented in the results section represent the average values of twenty data sets, the interval of values being set by the standard deviation of the results.

Table 4.
Expanded uncertainty of the applied methods for quantification of PM, PAHs, and metals.
2.6. Statistics
Statistics results were based on ANOVA and Spearman tests. Spearman statistical correlation tests were applied to 20 sets of monitoring data for the dimensional fractions of suspended particulate matter (PM2.5, PM10, TSP), the concentrations of toxic metals, and PAH-type compounds in the particulate matter. The test results are expressed in values of the Spearman correlation coefficient, q.
The SPSS 20.0 program (Statistical Package for the Social Sciences, version 20.0) was used for the statistical interpretation of the obtained experimental data and the correlation between particulate matters (PM2.5, PM10, TSP) and pollutants (metals, HAPs).
3. Results
The results were reported as a value difference between the pollution vs. background sampling points.
3.1. PM Results
The particulate matters measurements from bakery (Bucharest, Romania) and husbandry (Timisoara, Romania) showed a particular emissions pattern specific to the economic activities carried out in these areas. Weather factors, especially the intensity of the wind, are influencing the level of particulate matters concentrations based on their sizes [6,7]. The weather conditions were similar in both locations and meteorological factors (wind speed and direction) at the sampling emission sources were taken into account.
The particulate matters analyses showed an emission PM10/PM2.5 ratio of 1.6 from husbandry, which was slightly higher than the 1.4 PM10/PM2.5 ratio from bakery. These results showed, in both locations, a more significant emission of PM10 compared to PM2.5 emissions (Figure 3). The PM2.5 amounts seemed to be associated with industrial bakery activities (51.56 ± 6.3 µg/m3 PM2.5) than with farm activities where PM2.5s were almost half (37.7 ± 4.9 µg/m3 PM2.5) of the bakery concentration (Figure 3).
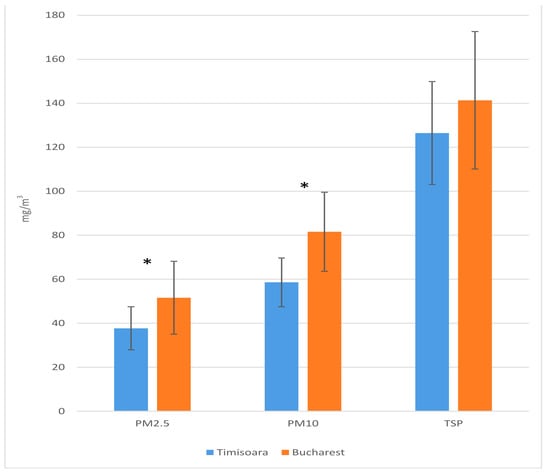
Figure 3.
The amounts of PM2.5, PM10, and TSP particulate matters (n = 20, mean value ± SD, SD = standard deviation) from animal husbandry (Timisoara) and bakery (Bucharest), *, p < 0.5.
The overall TSP values were similar between animal husbandry and bakery, but they were under the maximum threshold established by legislation (Table 2, [37]), below 150 µg/m3. On the other hand, PM2.5 and PM10 concentrations were both above their imposed maximum concentration limits, regardless of the sampling site (industrial—Bucharest or animal husbandry—Timisoara) (Table 5).

Table 5.
PM2.5, PM10, and TSP concentration limits imposed by Romanian Legislation [36,37].
The particulate matters have been also carriers for various pollutants such as metals and PAHs.
3.2. Metals Results
Analyses of PM2.5 particulate matters’ metal content showed stronger contamination with Cr, Cu, As, and Pb from bakery compared to husbandry (Figure 4). In particular, the Cu amount from PM2.5 analyzed near bakery (2.28 ± 0.45 µg/m3) was 10-fold higher than the Cu monitored near husbandry (0.27 ± 0.09 µg/m3). The Pb values were only two folds higher in bakery compared to husbandry (Figure 4). Overall, the metal loads found in PM2.5 emissions from husbandry were lower than those found on the bakery site. There were some exceptions when the metal loads detected in PM2.5 near husbandry were at least twice as high compared to bakery. For instance, Zn (21.25 ± 6.15 µg/m3) was three-fold higher (Table 6) and Sr (11.78 ± 3.26 µg/m3) was 10-fold higher (Table 6) compared to bakery.
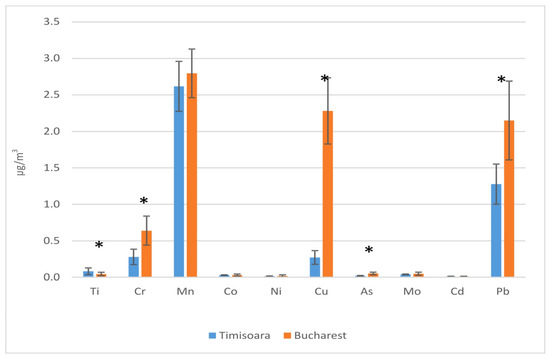
Figure 4.
The amounts of metals found in PM2.5 particulate matters (n = 20, mean value ± SD) from husbandry (Timisoara) and bakery (Bucharest). *, p < 0.5.

Table 6.
The amounts of Zn and Sr (n = 20, mean value ± SD) found in PM2.5 from husbandry (Timisoara) and bakery (Bucharest).
Quantification of metal from PM10 particulate matters showed some changes compared to their presence in PM2.5. Activities from husbandry seemed to generate the load of PM10 with larger amounts of metals such as Ti (0.13 ± 0.03 µg/m3), Cr (0.59 ± 0.15 µg/m3), Mn (4.56 ± 0.37 µg/m3), Pb (2.74 ± 0.54 µg/m3), Zn (31.34 ± 8.22 µg/m3), and Sr (24.95 ± 5.21 µg/m3) (Figure 5, Table 7). It seems the high amount of Cu and As were specific for bakery activities, regardless of their presence in PM2.5 or PM10.
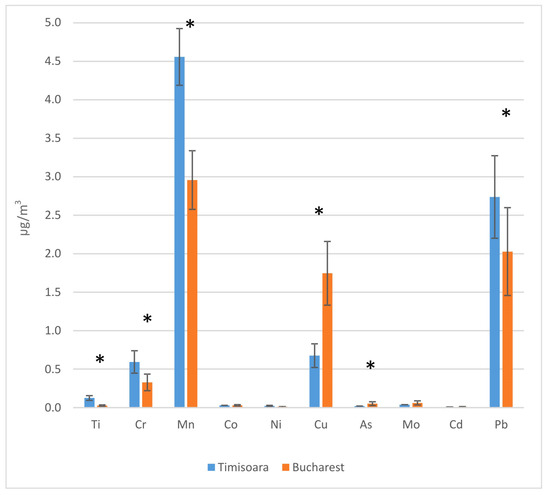
Figure 5.
The amounts of metals found in PM10 particulate matters (n = 20, mean value ± SD) from husbandry (Timisoara) and bakery (Bucharest). *, p < 0.5.

Table 7.
The amounts of Zn and Sr (n = 20, mean value ± SD) found in PM10 monitored from husbandry (Timisoara) and bakery (Bucharest).
In addition, Cr, Mn, and Pb loads from husbandry became more significant in PM10 compared to PM2.5. It became clear that husbandry activities generated PM10 particulate matters with major loads of metals compared to PM10 emissions from industrial activities.
Overall, Romania Law no. 104/2011 which transposes Directive 2008/50/EC identifies only a few metals and metalloids such as Pb, As, Cd, and Ni as important indicators present in PM10 particles (Table 8).

Table 8.
Metal concentration limits in particulate matters, PM10.
All the metal indications, regardless of their locations, had an average concentration below their imposed limits with the exception of Pb with 2–3 µg/m3 values for a limit of 0.5 µg/m3.
3.3. PAHs Results
The analyses of PAH loads on particulate matters PM2.5 and PM10 showed a major presence near industrial activity sites such as bakery compared to sites with typical husbandry activities (Figure 6 and Figure 7). The amounts of PAHs from PM2.5 and PM10 had a very similar scale value and pattern.
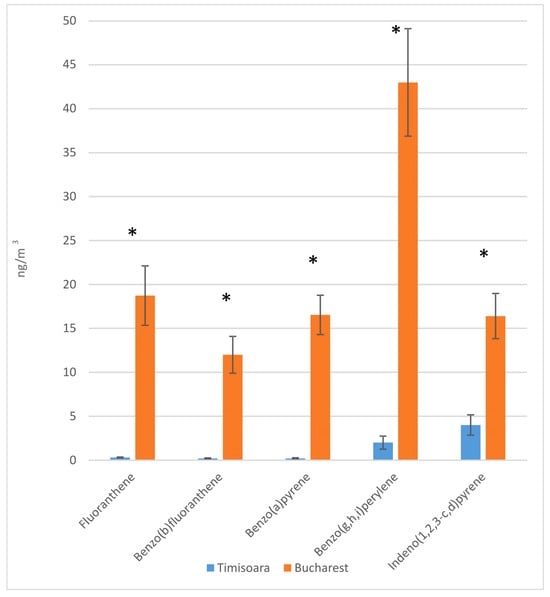
Figure 6.
The amounts PAHs found in PM2.5 particulate matters (n = 20, mean value ± SD) from husbandry (Timisoara) and bakery (Bucharest). *, p < 0.5.
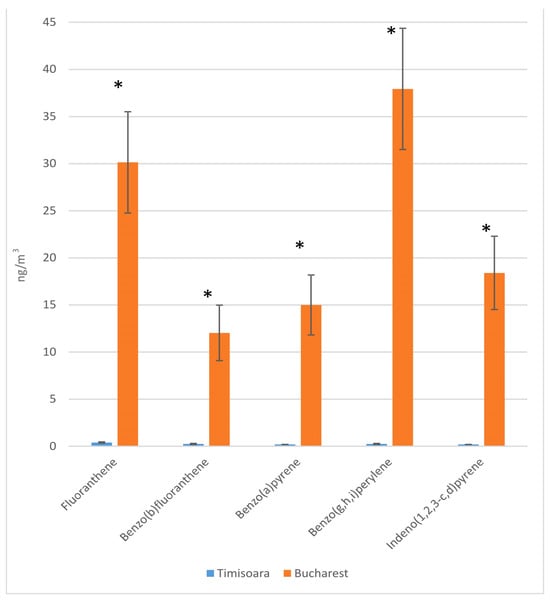
Figure 7.
The amounts PAHs found in PM10 particulate matters (n = 20, mean value ± SD) from husbandry (Timisoara) and bakery (Bucharest). *, p < 0.5.
The benzo(a)pyrene concentration limit imposed by Romanian Legislation [36] is up to 1 ng/m3, the value representing an annual average. Unfortunately, this limit was overtaken by all PAH compounds in the bakery area (Bucharest), regardless of their presence in PM2.5 or PM10. In the Timisoara monitoring point, only two compounds (benzo(g,h,i)perylene, indeno(1,2,3-c,d)pyrene) were related to PM2.5 particles.
4. Discussion
In the bakery, the main emission sources were the production lines linked to gas combustion points, including ovens and the transport path of raw materials and finished products. The same pattern of emission sources was observed for animal husbandry where heating installations and transport paths of animals as well as for animal food transport paths were the main sources of air pollution.
High PM2.5 concentrations were recorded in the area with bakery activities, especially from flour processing areas. PM2.5 concentrations were two times higher (Timisoara) and four times higher (Bucharest), respectively, than those reported for Iasi, Romania (16.92 ± 9.07 µg/m3) [32].
The value of PAHs adsorbed on PM2.5 for Bucharest varied between 0 ng/m3 and 4 ng/m3, presenting a total PAHs of 6.5 ng/m3.
In the area of Timisoara, PAH compounds varied in the range of 12 ng/m3 to 43 ng/m3, with a total value of 106.67 ng/m3. In this case, a higher level of PAH can be observed in the Bucharest area, with a population of 2,000,000 inhabitants (the capital of Romania), where there is a rich industrial site with a wide diversity of anthropic activities. The compositional profile of PM2.5 from Timisoara and in Bucharest areas was similar and comprised various chemical compounds such as fluoranthene, benzo(b)fluoranthene, benzo(g,h,i)perylene, indeno(1,2,3-c,d)pyrene with the exception of the benzo(a)pyrene compound which was detected only in the Bucharest area. The compound with a maximum concentration detected was benzo(g,h,i)perylene (43 ng/m3), followed by fluoranthene (18.73 ng/m3).
The PAHs adsorbed in PM10 from the Timisoara area varied between 0.2 ng/m3 and 0.4 ng/m3, with a PAHs total of 1.3 ng/m3, while for Bucharest, the PAHs had values in the range of 12.03 to 37.93 ng/m3 and the total PAHs was 113.5 ng/m3. As in the previous case, the PAH values for the Bucharest area were higher than for Timisoara. The compositional PAH profile of PM10 was similar to PM2.5, being represented by five PAH compounds such as fluoranthene, benzo(b)fluoranthene, benzo(g,h,i)perylene, indeno(1,2,3-c,d)pyrene, and benzo(a)pyrene. Benzo(g,h,i)perylene (37.93 ng/m3) and fluoranthene (30.13 ng/m3) were the PAH compounds with the maximum concentrations in Bucharest.
The value of total PAHs adsorbed in PM10 (113.5 ng/m3) was higher than values detected in Poland (9.07 ng/m3) and France (21.4 ng/m3) [40,41]. Instead, similar values were obtained in other countries: China (143 ng/m3) and Taiwan (164.98 ng/m3) [42,43].
Zn concentrations found in PM2.5 (21.25 ± 6.15 µg/m3) from Timisoara were similar to those from Iasi, Romania (25.39 ± 15.82 µg/m3) [32], but in Bucharest, the Zn content was three times lower (8.30 ± 2.32 µg/m3). An opposite situation was reported in Bucharest where Sr concentrations in PM2.5 were similar to those from Iasi (1.28 ± 0.40 µg/m3, respectively 1.40 ± 1.55 µg/m3 [32]), whereas in Timisoara, ten times higher Sr concentrations were reported (11.78 ± 3.26 µg/m3). Higher concentrations of Cr, Mn, Pb, Sr, and Zn in PM10 from Timisoara compared with Bucharest could be a result of soil dust resuspension and/or transport lines (tires, brake linings) [44]. Similar results were reported for an urban site from Birmingham, Alabama [45]. Low concentrations of As, Cd, Co, Cr, Ni, and Mo in PM2.5 were reported also in two cities in Vietnam (Ho Chi Minh and Hanoi) at the same levels as Timisoara and Bucharest [30].
The Spearman linear correlation coefficient (q) has values between –1 and +1, where positive values indicate a direct/positive correlation, but negative values show an inverse/negative correlation. The degree of association/correlation between the variables was established according to the q value (Table 9), [46].

Table 9.
Range values for Spearman correlation.
The sets of data obtained in the monitoring campaigns were subjected to the Spearman correlation test applied to the dimensional fractions of particulate matters (total suspended particles (TPS), PM2.5, PM10, metals, and PAHs. In the case of the animal husbandry field, results showed a moderate correlation between the dimensional fractions of dust (Table 10), which pin-pointed the existence in the area of several emission sources with different characteristics.

Table 10.
Results of the Spearman correlation test applied to the dimensional fractions of PMs, metals, and PAHs from particulate matters in the field of intensive animal breeding (Timisoara).
In the case of the bakery sector, there was a moderate correlation between the dimensional fractions of particulate matter, which showed the existence of several emission sources in the sampling area with different characteristics, with the monitoring result characterizing the mixture of emissions from all sources. There was an inverse correlation of metals and PAHs in PM with values of the correlation coefficient varying within wide limits, respectively, very low in the case of PAHs and varying from low absolute values in the case of PM2.5 particulate matter to values of 0.943 in the case of total particulate matter (Table 11). Under these conditions, the existence of distinct sources of emission of dimensional fractions of particulate matter with dimensions higher than 2.5 µm with a heavy metal content that influences the values of the correlation coefficients could be assumed.

Table 11.
Results of the Spearman correlation test applied to the dimensional fractions of PMs, metals, and PAHs from particulate maters for the bakery sector (Bucharest).
A general pattern was not identified for the presence of heavy metals and PAHs in particulate matters. The values of correlation coefficients covered a wide range of values from low correlations, as was the case of the correlation between PM 2.5 concentration and metals or PAHs concentrations, up to very good correlations, as in was the case of the correlation between total dust concentration and metals or PAHs concentrations.
5. Conclusions
It could be said that particulate matter emissions were characterized by the presence of a wide range of dimensional fractions and their dimensional ratio was directly linked to the industrial anthropic activity type, such as the composition of raw materials used in industrial processes, technological process aims, and design, as well as the domain of the main industrial activity. The PM10s were produced more during anthropic activities linked to animal farming compared to industrial bakery. An opposite scenario was observed for PM2.5s, where their high concentrations were linked to industrial activities such as industrial baking compared to animal farming. In general, metal pollutants such as Mn, Cu, and Pb were more loaded in PM10 and associated with animal farming activities, but the presence of PHAs was exclusively in PM2.5 and PM10 related to industrial activities.
A moderate correlation was found between PM sizes from the intensive breeding of animals and the bakery field, which was explained by the existence in the surveyed area of several emission sources with different characteristics, such as raw material transport paths or mixing areas. In spite of sources located in the immediate vicinity of the surveyed areas, the monitored results were linked only to interest sources due to the sampling point strategy design before and after location based on wind direction.
Some indicators such as Pb or benzo(a)pyrene exceed the allowed limits (0.5 µg/m3 for Pb and 1 ng/m3 for benzo(a)pyrene) and those concentrations could be very harmful to human health. Therefore, in order to reduce the adverse effects of particulate matter air pollution in the tested locations, it is beneficial to extend the height of the emission chimneys for better dispersion of pollutants. A more efficient air pollution management should be linked to fuel consumption by reducing thermal losses and improving the efficiency of combustion installations.
The overall results of this paper clearly characterized, for the first time, the air pollution based on the industrial activity type, pinpointing which type of management actions should be taken for an air pollution-free working place and environment. It could be recommended to reduce the emission of pollutants by the bakery or animal husbandry by adding specific PAH and metal retention screens, replacing vehicles that use fossil fuels with hybrid or electric ones, or adding installation based on photovoltaic panels for the production of electrical and thermal energy.
Author Contributions
Conceptualization, L.-F.P. and M.N.-L.; methodology, S.M.C. and V.D.; software, V.D. and M.N.-L.; validation, L.-F.P., M.N.-L. and G.-G.V.; formal analysis, V.D., V.I.I., A.R.B. and I.N.; investigation, V.D.; resources, S.M.C.; data curation, M.N.-L. and G.-G.V.; writing—original draft preparation, V.D., M.N.-L., G.-G.V. and V.I.I.; writing—review and editing, V.D., V.I.I., G.-G.V. and M.N.-L.; visualization, M.N.-L.; supervision, L.-F.P.; project administration, L.-F.P.; funding acquisition, S.M.C. All authors have read and agreed to the published version of the manuscript.
Funding
Romanian Ministry of Education and Research, contract no. 20N/2019, Project code 19 04 02 02 partial; Romanian Ministry of Research, Innovation, and Digitalization, contract no. 3N/2022, Project code PN 23 22 02 01.
Institutional Review Board Statement
Not applicable.
Informed Consent Statement
Not applicable.
Data Availability Statement
Data are contained within the article.
Acknowledgments
The work was funded through the “Nucleu” Program by the Romanian Ministry of Education and Research (contract no. 20N/2019, Project PN 19 04 02 02) and through the “Nucleu” Program within the National Research Development and Innovation Plan 2022–2027 with the support of the Romanian Ministry of Research, Innovation, and Digitalization, contract no. 3N/2022, Project code PN 23 22 02 01.
Conflicts of Interest
The authors declare no conflicts of interest.
References
- Abed Al Ahad, M.; Demsar, U.; Sullivan, F.; Kulu, H. Long-term exposure to air pollution and mortality in Scotland: A register-based individual-level longitudinal study. Environ. Res. 2023, 238, 1–10. [Google Scholar] [CrossRef] [PubMed]
- Orellano, P.; Reynoso, J.; Quaranta, N. Short-term exposure to sulphur dioxide (SO2) and all-cause and respiratory mortality: A systematic review and meta-analysis. Environ. Int. 2021, 150, 106434. [Google Scholar] [CrossRef] [PubMed]
- Chen, R.; Yin, P.; Meng, X.; Liu, C.; Wang, L.; Xu, X.; Ross, J.A.; Tse, L.A.; Zhao, Z.; Kan, H.; et al. Fine particulate air pollution and daily mortality: A nationwide analysis in 272 Chinese cities. Am. J. Respir. Crit. Care Med. 2017, 196, 73–81. [Google Scholar] [CrossRef] [PubMed]
- Requia, W.J.; Vicedo-Cabrera, A.M.; Amini, H.; Schwartz, J.D. Short-term air pollution exposure and mortality in Brazil: Investigating the susceptible population groups. Environ. Pollut. 2024, 340, 122797. [Google Scholar] [CrossRef] [PubMed]
- Yu, P.; Xu, R.; Li, S.; Coelho, M.S.Z.S.; Saldiva, P.H.N.; Sim, M.R.; Abramson, M.J.; Guo, Y. Associations between long-term exposure to PM2.5 and site-specific cancer mortality: A nationwide study in Brazil between 2010 and 2018. Environ. Pollut. 2022, 302, 119070. [Google Scholar] [CrossRef] [PubMed]
- WHO Global Air Quality Guidelines—Particulate Matter (PM2.5 and PM10), Ozone, Nitrogen Dioxide, Sulfur Dioxide and Carbon Monoxide; World Health Organization: Geneva, Switzerland, 2021. Available online: https://iris.who.int/bitstream/handle/10665/345329/9789240034228-eng.pdf (accessed on 25 October 2023).
- Ministry of Foreign Affair of the Republic of Korea. Air Pollution: An Introduction to Its Causes, Effects and Solutions; Ministry of Foreign Affair of the Republic of Korea: Seul, Republic of Korea, 2021; p. 18. Available online: https://www.neaspec.org/sites/default/files/Air_Pollution_Handbook.pdf (accessed on 25 October 2023).
- Wang, X.; Ran, S.; Xia, H.; Shi, H.; Wu, G.; Zhang, Z.; Wang, C.; Cai, M.; Zhang, J.; Lin, H. Ambient air pollution associated with incident asthma, subsequent cardiovascular disease and death: A trajectory analysis of a national cohort. J. Hazard. Mater. 2023, 460, 132372. [Google Scholar] [CrossRef] [PubMed]
- Feng, J.; Cai, M.; Qian, Z.M.; Zhang, S.; Yang, Y.; McMillin, S.E.; Chen, G.; Hua, J.; Tabet, M.; Wang, C.; et al. The effects of long-term exposure to air pollution on incident mental disorders among patients with prediabetes and diabetes: Findings from a large prospective cohort. Sci. Total Environ. 2023, 897, 165235. [Google Scholar] [CrossRef] [PubMed]
- Li, D.; Ma, Y.; Cui, F.; Yang, Y.; Liu, R.; Tang, L.; Wang, J.; Tian, Y. Long-term exposure to ambient air pollution, genetic susceptibility, and the incidence of bipolar disorder: A prospective cohort study. Psychiatry Res. 2023, 327, 115396. [Google Scholar] [CrossRef]
- Qiu, X.; Yazdi, M.D.; Wei, Y.; Di, Q.; Just, A.; Zanobetti, A.; Weisskopf, M.; Dominici, F.; Schwartz, J. Associations of short-term exposure to air pollution and increased ambient temperature with psychiatric hospital admissions in older adults in the USA: A case–crossover study. Lancet Planet. Health 2022, 6, e331–e341. [Google Scholar] [CrossRef]
- Chu, Y.J.; Holladay, S.; Qiu, Y.; Tian, X.L.; Zhou, M. Air pollution and mortality impacts of coal mining: Evidence from coalmine accidents in China. J. Environ. Econ. Manag. 2023, 121, 102846. [Google Scholar] [CrossRef]
- Manisalidis, I.; Stavropoulou, E.; Stavropoulos, A.; Bezirtzoglou, E. Environmental and health impacts of air pollution: A review. Front. Public Health 2020, 8, 14. [Google Scholar] [CrossRef] [PubMed]
- Boström, C.E.; Gerde, P.; Hanberg, A.; Jernström, B.; Johansson, C.; Kyrklund, T. Cancer risk assessment, indicators and guidelines for polycyclic aromatic hydrocarbons in ambient air. Environ. Health Perspect. 2002, 110, 451–489. [Google Scholar] [PubMed]
- Abdel-Shafy, H.I.; Mansour, M.S. A review on polycyclic aromatic hydrocarbons: Source, environmental impact, effect on human health and remediation. Egypt. J. Pet. 2016, 25, 107–123. [Google Scholar] [CrossRef]
- Di-Toro, D.M.; McGrath, J.A.; Hansen, D.J. Technical basis for narcotic chemicals and polycyclic aromatic hydrocarbon criteria. I. Water and tissue. Environ. Toxicol. Chem. 2000, 19, 1951–1970. [Google Scholar] [CrossRef]
- Baklanov, A.; Hänninen, O.; Slørdal, L.H.; Kukkonen, J.; Bjergene, N.B. Fay Integrated systems for forecasting urban meteorology, air pollution and population exposure. Atmos. Chem. Phys. 2007, 7, 855–874. [Google Scholar] [CrossRef]
- Ma, W.L.; Qi, H.; Baidron, S.; Liu, L.Y.; Yang, M.; Li, Y.F. Implications for long-range atmospheric transport of polycyclic aromatic hydrocarbons in Lhasa, China. Environ. Sci. Pollut. Res. 2013, 20, 5525–5533. [Google Scholar] [CrossRef]
- Mojiri, A.; Zhou, J.L.; Ohashi, A.; Ozaki, N.; Kindaichi, T. Comprehensive review of polycyclic aromatic hydrocarbons in water sources, their effects and treatments. Sci. Total Environ. 2019, 696, 133971. [Google Scholar] [CrossRef]
- Patel, A.B.; Shaikh, S.; Jain, K.R.; Desai, C.; Madamwar, D. Polycyclic aromatic hydrocarbons: Sources, toxicity, and remediation approaches. Front. Microbiol. 2020, 11, 562813. [Google Scholar] [CrossRef]
- Shimada, K.; Nohchi, M.; Maeshima, K.; Uchino, T.; Kobayashi, Y.; Ono, K.; Ogata, H.; Katsumi, N.; Inazu, K.; Okochi, H. Effects of changes in polycyclic aromatic hydrocarbons (PAHs) emissions and degradation on their concentrations in Tokyo from 2007 and 2016. Sci. Rep. 2022, 12, 4249. [Google Scholar] [CrossRef]
- Wang, Z.; Ren, P.; Sun, Y.; Ma, X.; Liu, X.; Na, G.; Yao, Z. Gas/particle partitioning of polycyclic aromatic hydrocarbons in coastal atmosphere of the north Yellow Sea, China. Environ. Sci. Pollut. Res. 2013, 20, 5753–5763. [Google Scholar] [CrossRef]
- Ravindra, K.; Sokhi, R.; Van Grieken, R. Atmospheric polycyclic aromatic hydrocarbons: Source attribution, emission factors and regulation. Atmos. Environ. 2008, 42, 2895–2921. [Google Scholar] [CrossRef]
- Gupte, A.; Tripathi, A.; Patel, H.; Rudakiya, D.; Gupte, S. Bioremediation of polycyclic aromatic hydrocarbon (PAHs): A perspective. Open Biotechnol. J. 2016, 10, 363–378. [Google Scholar] [CrossRef]
- Lammel, G. Polycyclic Aromatic Compounds in the Atmosphere–A Review Identifying Research Needs. Polycycl. Aromat. Compd. 2015, 35, 316–329. [Google Scholar] [CrossRef]
- Gong, X.; Huang, Y.; Duong, J.; Leng, S.; Zhan, F.B.; Guo, Y.; Lin, Y.; Luo, L. Industrial air pollution and low birth weight in New Mexico, USA. J. Environ. Manag. 2023, 348, 119236. [Google Scholar] [CrossRef] [PubMed]
- Pacín, C.; Martínez-Abaigar, J.; Núñez-Olivera, E.; Aboal, J.R.; De Nicola, F.; Fernández, J. Polycyclic aromatic hydrocarbons (PAHs) levels in PM10 and bulk deposition using Mosspheres: A pilot study in an urban environment. Environ. Res. 2023, 223, 115406. [Google Scholar] [CrossRef] [PubMed]
- World Health Organization (WHO). Air Quality Guidelines for Europe; WHO Regional Publications; WHO: Geneva, Switzerland, 2000.
- Shaltout, A.A.; Hassan, S.K.; Alomairy, S.E.; Manousakas, M.; Karydas, A.G.; Eleftheriadis, K. Correlation between inorganic pollutants in the suspended particulate matter (SPM) and fine particulate matter (PM2.5) collected from industrial and residential areas in Greater Cairo, Egypt. Air Qual. Atmos. Health 2019, 12, 241–250. [Google Scholar] [CrossRef]
- Hien, T.T.; Chi, N.D.T.; Huy, D.H.; Anh, H.; Oram, D.E.; Forster, G.L.; Mills, G.P.; Baker, A.R. Soluble trace metals associated with atmospheric fine particulate matter in the two most populous cities in Vietnam. Atmos. Environ. X 2022, 15, 100178. [Google Scholar] [CrossRef]
- Jiang, S.Y.N.; Yang, F.; Chan, K.L.; Ning, Z. Water solubility of metals in coarse PM and PM2.5 in typical urban environment in Hong Kong. Atmos. Pollut. Res. 2014, 5, 236–244. [Google Scholar] [CrossRef]
- Galon-Negru, A.G.; Olariu, R.I.; Arsene, C. Size-resolved measurements of PM2.5 water-soluble elements in Iasi, north-eastern Romania: Seasonality, source apportionment and potential implications for human health. Sci. Total Environ. 2019, 695, 133839. [Google Scholar] [CrossRef]
- Danciulescu, V.; Cozea, A.; Bucur, E.; Tanase, G.; Bratu, M. Concentration versus number of particles in the assessment of air pollution with particulate matter. Rom. J. Ecol. Environ. Chem. 2022, 4, 68–74. [Google Scholar] [CrossRef]
- Lyu, X.P.; Wang, Z.W.; Cheng, H.R.; Zhang, F.; Zhang, G.; Wang, X.M.; Ling, Z.H.; Wang, N. Chemical characteristics of submicron particulates (PM1.0) in Wuhan, Central China. Atmos. Res. 2015, 161–162, 169–178. [Google Scholar] [CrossRef]
- US EPA. Quality Assurance Handbook for Air Pollution Measurement Systems Ambient Air Specific Methods; EPA/600/R-94/038a; US Environmental Protection Agency: Washington, DC, USA; US Government Printing Office: Washington, DC, USA, 1994; Volume 2, p. 11. Available online: https://nepis.epa.gov (accessed on 7 February 2022).
- Directive 2008/50/CE; Transpose in Romanian Legislation by Law no.104/2011 Regarding Air Quality. Official Monitor: Bucharest, Romania, 2011. (In Romanian)
- STAS 12574–87; Air in Protected Areas. Quality Conditions. ASRO: Bucharest, Romania, 1987. (In Romanian)
- CEN-EN 15549; Air Quality-Standard Method for the Measurement of the Concentration of Benzo[a]Pyrene in Ambient Air. CEN: Brussels, Belgium, 2008.
- Tanase, I.G.; Radu, G.L.; Pana, A.; Buleandra, M. Validation of the Analytical Methods. Theoretical Principles and Case Studies; Printech Publishing House: Bucharest, Romania, 2007; pp. 170–175. (In Romanian) [Google Scholar]
- Siudek, P.; Frankowski, M. The role of sources and atmospheric conditions in the seasonal variability of particulate phase PAHs at the urban site in Central Poland. Aerosol Air Qual. Res. 2018, 18, 1405–1418. [Google Scholar] [CrossRef]
- Albinet, A.; Leoz-Garziandia, E.; Budzinski, H.; ViIlenave, E. Polycyclic aromatic hydrocarbons (PAHs), nitrated PAHs and oxygenated PAHs in ambient air of the Marseilles area (south of France): Concentrations and sources. Sci. Total Environ. 2007, 384, 280–292. [Google Scholar] [CrossRef] [PubMed]
- Lin, Y.; Ma, Y.; Qiu, X.; Li, R.; Fang, Y.; Wang, J.; Zhu, Y.; Hu, D. Sources, transformation, and health implications of PAHs and their nitrated, hydroxylated, and oxygenated derivatives in PM2.5 in Beijing. J. Geophys. Res. 2015, 120, 7219–7228. [Google Scholar] [CrossRef]
- Fang, G.-C.; Wu, Y.-S.; Chen, J.-C.; Fu, P.P.-C.; Chang, C.-N.; Ho, T.-T.; Chen, M.-H. Characteristic study of polycyclic aromatic hydrocarbons for fine and coarse particulates at Pastureland near Industrial Park sampling site of central Taiwan. Chemosphere 2005, 60, 427–433. [Google Scholar] [CrossRef]
- Hjortenkrans, D.S.T.; Bergbäck, B.G.; Häggerud, A.V. Metal emissions from brake linings and tires: Case studies of Stockholm, Sweden 1995/1998 and 2005. Environ. Sci. Technol. 2007, 41, 5224–5230. [Google Scholar] [CrossRef]
- Fang, T.; Guo, H.; Verma, V.; Peltier, R.E.; Weber, R.J. PM2.5 water–soluble elements in the southeastern United States: Automated analytical method development, spatiotemporal distributions, source apportionment, and implications for heath studies. Atmos. Chem. Phys. 2015, 15, 11667–11682. [Google Scholar] [CrossRef]
- Jaba, E.; Grama, A. Statistical Analysis with SPSS under Windows; Polirom Publishing House: Iasi, Romania, 2004; pp. 34–39. (In Romanian) [Google Scholar]
Disclaimer/Publisher’s Note: The statements, opinions and data contained in all publications are solely those of the individual author(s) and contributor(s) and not of MDPI and/or the editor(s). MDPI and/or the editor(s) disclaim responsibility for any injury to people or property resulting from any ideas, methods, instructions or products referred to in the content. |
© 2024 by the authors. Licensee MDPI, Basel, Switzerland. This article is an open access article distributed under the terms and conditions of the Creative Commons Attribution (CC BY) license (https://creativecommons.org/licenses/by/4.0/).