Abstract
Polar lows (PLs) are maritime mesoscale cyclones associated with severe weather. They develop during marine cold air outbreaks near coastlines and the sea ice edge. Unfortunately, our knowledge about the mechanisms leading to PL development is still incomplete. This study aims to provide a detailed analysis of the development mechanisms of a PL that formed over the Norwegian Sea on 25 March 2019 using the output of a simulation with the sixth version of the Canadian Regional Climate Model (CRCM6/GEM4), a convection-permitting model. First, the life cycle of the PL is described and the vertical wind shear environment is analysed. Then, the horizontal wind divergence and the baroclinic conversion term are computed, and a surface pressure tendency equation is developed. In addition, the roles of atmospheric static stability, latent heat release, and surface heat and moisture fluxes are explored. The results show that the PL developed in a forward-shear environment and that moist baroclinic instability played a major role in its genesis and intensification. Baroclinic instability was initially only present at low levels of the atmosphere, but later extended upward until it reached the mid-troposphere. Whereas the latent heat of condensation and the surface heat fluxes also contributed to the development of the PL, convective available potential energy and barotropic conversion do not seem to have played a major role in its intensification. In conclusion, this study shows that a convection-permitting model simulation is a powerful tool to study the details of the structure of PLs, as well as their development mechanisms.
1. Introduction
The polar and subpolar regions are extreme environments, where a wide range of atmospheric phenomena with different spatiotemporal scales develop, such as katabatic winds from the Greenland ice sheet (e.g., [1]), mesoscale tip jets and barrier winds (e.g., [2]), polar mesoscale cyclones (PMCs) (e.g., [3]), and Arctic cyclones (e.g., [4]). Interactions between these phenomena can occur; for instance, katabatic winds can trigger PMCs (e.g., [5]).
A specific type of PMC known as polar lows (PLs) are of particular interest, since they are associated with severe weather, and some studies have indicated that they can have an impact on ocean circulation [6,7]. The wider family of PMCs includes cyclones that develop poleward of the main polar front and whose horizontal scale is meso-α or meso-β [8], which correspond to 200–2000 km and 20–200 km, respectively [9]. Whereas PMCs are quite common in both hemispheres, only a small number of PMCs can be considered PLs [10]. What differentiates PLs from the other PMCs is the fact that they are maritime cyclones with a 200–1000 km horizontal scale and their associated near-surface winds are gale force or stronger [11].
PLs develop during marine cold air outbreaks (MCAOs) [12] near coastlines and the sea ice edge, where strong low-level air temperature gradients are often located during the cold season. MCAOs lead to convergence zones that are favourable for the formation of PLs (e.g., [13]). The shape of the sea ice edge and the coastline has an impact on the generation and intensification of the convergence zones associated with MCAOs, due to the resulting asymmetry in the air mass transformation [14] or due to local discontinuities in surface diabatic fluxes from land or sea ice toward open water areas (e.g., [15]). These convergence zones are more intense the smaller the bend angle (a simple representation of the sea ice edge or coastline consists of two straight lines that meet at a certain angle—the bend angle), the higher the sea surface temperature (SST) and the weaker the stability of the atmosphere. Accordingly, some studies have shown that, compared to a straight sea ice edge, an indented sea ice edge is more favourable for the genesis of PLs [15,16].
In the late 1970s and early 1980s, two alternative hypotheses or theoretical explanations for PL development were suggested [17]. While some researchers concluded that PLs were baroclinic disturbances (e.g., [18]), others argued that PLs were convective systems similar to tropical cyclones (e.g., [19]). Later, several studies indicated that both mechanisms played an important role in PL development (e.g., [20,21]), leading to the idea of a PL spectrum that encompasses not only PLs with baroclinic or a convective origin, but also PLs generated through a combination of different development mechanisms [22]. Recent studies have concluded that moist baroclinic instability plays a major role in PL development [23,24,25], and the existence of hurricane-like PLs has been questioned [25,26]. Numerous studies have highlighted the contribution of latent heating to PL development (e.g., [27,28,29]), and several studies have found that surface heat fluxes are important for the maintenance and intensification of PLs (e.g., [29,30]). Upper-level geopotential height anomalies can also contribute to PL development (e.g., [15]). Although all these studies have highlighted the role of different mechanisms in PL genesis and intensification, the relative importance of each one is yet to be determined (for a detailed review of the development mechanisms of PLs see [10]).
The environments where PLs develop can be classified as weak-shear or strong-shear [25]. Most PLs develop in a strong-shear environment, where baroclinic instability plays an important role, and they decay in a weak-shear environment [25]. Strong-shear environments have been traditionally classified into two categories: forward-shear and reverse-shear (e.g., [31]). Recently, Stoll et al. [25] suggested two additional categories, right-shear and left-shear. PLs that develop in right-shear (left-shear) conditions propagate towards colder (warmer) regions. Forward-shear PLs are the most frequent type of PL [32]. The development of forward-shear PLs is similar to the baroclinic development of midlatitude storms, whereas the development of reverse-shear PLs is similar to the secondary development associated with frontal instability [31].
Our knowledge about how polar lows form and intensify is still incomplete because, among other reasons, until relatively recently atmospheric models were too coarse to represent the structure of PLs. In effect, improved predictions of PLs need higher resolution simulations [28]; ideally, a grid mesh of less than 3 km should be used [33]. In the last decade, convection-permitting models have proven to be a useful tool to study PLs (e.g., [26,34]). Nevertheless, the simulation of PLs strongly depends on the initial conditions and on the lead time [33,35].
The main objective of this work was to conduct a detailed analysis of the development mechanisms of an observed PL that is reasonably well represented by the sixth version of the Canadian Regional Climate Model (CRCM6/GEM4) [35]. An older version of the CRCM, with a 30 km grid mesh and 40 vertical levels, was previously used to study a PL that formed over the Hudson Bay in December 1988 [15]. To the best of the authors’ knowledge, no study of a PL has been made using the CRCM with high resolution. This study demonstrates that the detailed representation of an observed PL provided by the CRCM6/GEM4 is invaluable to analyse its development mechanisms. The main conclusion of this analysis is that moist baroclinic instability plays a major role in the genesis and intensification of the observed PL. This article is organised in four sections. Section 2 describes the data and methods used for the analysis of the development mechanisms of this PL. Section 3 presents and discusses the results, and Section 4 provides the main conclusions.
2. Materials and Methods
2.1. Data
The PL studied here developed over the Norwegian Sea on 25 March 2019 (Figure 1). Moreno-Ibáñez et al. [35] conducted an ensemble of eight simulations of this PL with the CRCM6/GEM4 [36,37,38,39], with a grid spacing of 0.0225° and a vertical grid with 62 levels. Note that the CRCM6/GEM4 does not include ocean and sea ice simulation components; therefore, high-temporal atmosphere–ocean–sea ice interactions are not explicitly represented, as SSTs and sea ice are prescribed in the CRCM6/GEM4 from daily ERA5 values (see [35]). The authors concluded that the observed PL was quite well represented by the simulation initialised on 24 March at 1800 UTC. In effect, this simulation captured the size, track, and lifetime of this PL. The cloud signature of the simulated PL at its mature stage spanned roughly 600 km, and its lifetime extended from 25 March at 0000 UTC to 25 March at 2100 UTC. The verification of the simulation against conventional surface observations within a 300 km radius from the PL centre showed that the sea level pressure (SLP) field was well represented, although the simulated PL was somewhat deeper than the observed one. The simulation output was available hourly and covered the period from 24 March at 1900 UTC to 26 March at 0600 UTC [40], and the three-dimensional fields were interpolated on 22 pressure levels from 1000 to 10 hPa.
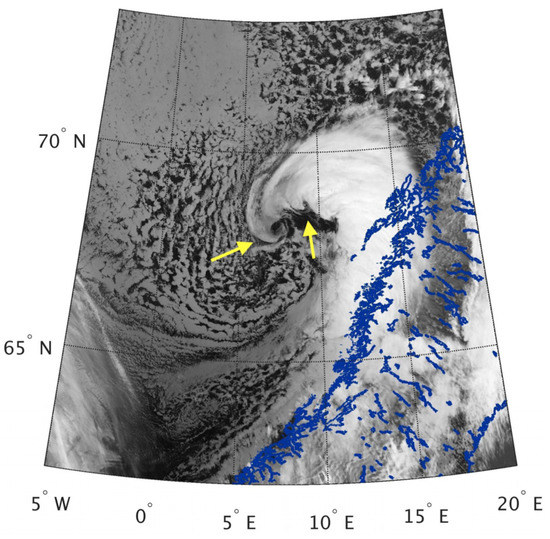
Figure 1.
Visible Infrared Imaging Radiometer Suite (VIIRS) [41] channel M15 (10.76 μm) image showing the PL on 25 March, 1248–1254 UTC. The blue outlining represents the coastline. Small meso-vortices are observed along the front of the occluding PL (yellow arrows). The open and closed convective cells are due to mesoscale cellular convection resulting from the MCAO.
2.2. Methods
Life Cycle and Classification of the PL
In order to analyse the life cycle of the PL, horizontal averages of several variables were computed using the values at the grid points within a 300 km radius from the centre of the simulated PL. This radius was selected because it roughly corresponds to the size of the PL at its mature stage [35]. Note that, since the size of the PL increased with time, the average fields computed during the first hours of PL development corresponded not only to the PL itself, but also to its environment. Likewise, maximum and minimum values were obtained from the values at the grid points within a 300 km radius from the PL centre. Of particular interest was the time evolution of the PL intensity, represented by the minimum SLP at the PL centre and the maximum 10 m wind speed. The time evolution of the average difference between the SST and the temperature at 500 hPa (SST − T500), which has been often used in PL studies as a measure of the atmospheric static stability (e.g., [42]), was also analysed. Note that, in the case of the SST − T500, only the ocean grid points were considered for the computation of the average. In addition, the time series of the average temperature at 2 m, as well as of the average and maximum surface heat fluxes, were examined.
Based on the classification of vertical wind shear environments suggested by Stoll et al. [25], the vertical wind shear category corresponding to each 1 h time step during the lifetime of the PL was determined. The vertical shear strength was computed as follows [25]:
where ⟨ ⟩ is the horizontal averaging operator, is the differential wind vector, is the geopotential height at 500 hPa, and is the geopotential height at 925 hPa. The horizontal average of the differential wind vector is calculated here as the horizontal average of the horizontal wind vectors at 500 and 925 hPa within a 300 km radius from the PL centre:
where is the wind component parallel to the x axis (i.e., east-west component), and is the wind component parallel to the y axis (i.e., north–south component). The vertical shear vector in the along and across propagation direction is computed as follows [25]:
where is the vertical shear angle, with representing the orientation of , and the propagation direction. The propagation direction is obtained from the PL track points.
2.3. Analysis of the Development Mechanisms of the PL
As when analysing the life cycle of the PL, horizontal averages of different variables were computed using the values at the grid points within a 300 km radius from the PL centre.
Since the presence of the PL is associated with convergence in the planetary boundary layer, due to mass conservation there must be divergence at a higher level of the troposphere. The times series of the vertical profile of the horizontal average of wind divergence () helps determine the pressure level at which divergence occurs.
The terms that contribute to the atmospheric surface pressure tendency were analysed using the following equation (see Appendix A):
where is the atmospheric surface pressure, is the temperature at 2 m, = 287 J K−1 Kg−1 is the gas constant for dry air, is the geopotential at 500 hPa, is 500 hPa, and is the minimum value of the time series of the surface pressure at each grid point. The time series used for the computation of corresponds to the whole simulation period. The pressure level was selected considering that the PL extends up to ~500 hPa. The first term represents the contribution of the tendency of the geopotential at 500 hPa, and the second term represents the contribution of the warming of the atmospheric column. To analyse the error in the computation of the surface pressure tendency with Equation (4) due to the approximations made, the surface pressure tendency was also computed using the simulated surface pressure field. Time derivatives were calculated with a central-difference scheme, except on the time boundaries where backward-difference and forward-difference schemes were used. The error was then computed as follows:
where , and . The mean absolute error over the whole domain and period of the simulation was 0.09 hPa h−1, which is reasonable and quite small on average. However, the maximum and minimum errors were 1.49 hPa h−1 and −1.52 hPa h−1, respectively, so the spatial distribution of the error should be considered when interpreting the results.
Computation of the baroclinic conversion term, which represents the conversion from eddy available potential energy to eddy kinetic energy [43,44], helped determine the role of baroclinic instability in the development of this PL. In the scientific literature, the baroclinic conversion term has been computed to analyse the contribution of baroclinic instability to the development of midlatitude storms (e.g., [45]) and PLs [23,46,47,48]. Since many studies indicated that baroclinic instability plays a major role in PL development (e.g., [49]), it is expected that the baroclinic conversion term was significant during the development of this PL. Given that PLs are mesoscale eddies, we are interested in the deviation of atmospheric variables () from the time-mean state (), which is . Therefore, at each grid point, the baroclinic conversion term was computed as follows:
where is the vertical velocity in pressure coordinate and is the specific volume. The period considered for the computation of the time average and deviation corresponds to the lifetime of the simulated PL.
Finally, the atmospheric static stability, and therefore the role of natural convection, was analysed using thermodynamic diagrams. Skew-T log-P diagrams [50] were plotted with the software package MetPy [51]. MetPy computes the convective available potential energy (CAPE) and the convective inhibition (CIN) as follows:
where is the gas constant for dry air, is the parcel temperature, is the environmental temperature, EL is the pressure of the equilibrium level, LFC is the pressure of the level of free convection, and SFC is the level of the surface or the beginning of the parcel path.
3. Results and Discussion
3.1. Life Cycle and Classification of the PL
Figure 2 shows time series throughout the life cycle of this PL. The central pressure of the PL dropped from around 1008.3 hPa at 0000 UTC to a minimum of 995.7 hPa at 1500 UTC, which corresponds to an average deepening rate of 0.8 hPa h−1 (Figure 2a). Later, the SLP increased to reach 1002.3 hPa at the end of its lifetime. The maximum 10 m wind speed associated with the PL steadily increased from 18.2 m s−1 until it reached a maximum of 29.8 m s−1 at 1200 UTC (Figure 2a). The mean SST − T500 exceeded 39 °C during the whole lifetime of the PL (Figure 2b). The SST − T500 increased from the genesis of the PL, until it reached a maximum of 45 °C at 0600 UTC, and then it decreased. The maximum SST − T500 was in the range of values obtained over the Nordic Seas in the recent study of Stoll [32]. During the whole lifetime of the PL, the average surface latent heat flux (LHF) was higher than the average surface sensible heat flux (SHF), especially during the second half of the lifetime of the PL (Figure 2c). The maximum LHF and SHF associated with the PL were 619 W m−2 at 1500 UTC and 583 W m−2 at 1300 UTC, respectively. The mean 2 m temperature increased from −2.1 °C at 0000 UTC until it reached a maximum of 2.1 °C at 1100 UTC (Figure 2b). The surface diabatic fluxes (SHF and LHF) and the 2 m temperature decreased as the PL moved overland.
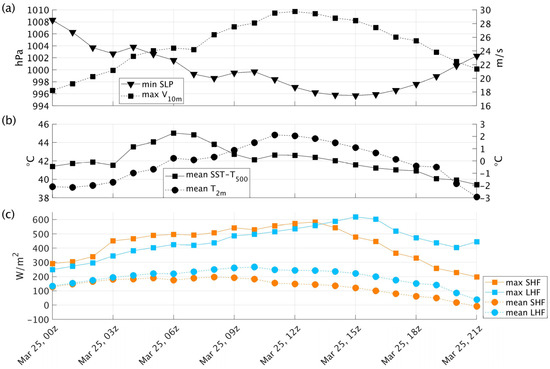
Figure 2.
Time series of the (a) minimum SLP (hPa) at the centre of the simulated PL, and maximum 10 m wind speed (m s−1), (b) mean difference between the SST and the temperature at 500 hPa (°C), and mean 2 m temperature (°C), and (c) maximum and mean SHF and LHF (W m−2). The grid points included in the computation of the horizontal average and the maximum are those within a 300 km radius from the PL centre. In the case of the SST − T500, only the ocean grid points have been considered.
The life cycle of the PL can be divided into different stages. The genesis stage includes the first few hours of PL development, from 0000 UTC to around 0300 UTC. The mature stage covers the period around 1200 UTC, which corresponds to the time with the highest maximum 10 m wind speed associated with the PL (Figure 2a). The dissipation stage corresponds to the period after 1500 UTC, i.e., after the central pressure of the PL reached its minimum value (Figure 2a).
Strong vertical wind shear (>1.5 × 10⁻³ s−1) was found during the whole lifetime of the PL, even at the dissipation stage (Table 1). The type of vertical shear dominant during most of the PL lifetime was forward shear (16 h). Forward shear was mainly present when the PL moved eastward or south-eastward. In contrast, right shear (1 h) occurred when the PL moved northward, and left shear (4 h) occurred when the PL moved southward. The fact that the propagation direction changed from eastward to northward and then to southward in a short time was due to the fact that the location of the SLP minimum associated with the PL was somewhat erratic during that time. This is not surprising since, in general, PL tracks are not smooth (e.g., [25]). The shear strength considerably decreased during the lifetime of the PL, indicating that the environment became less baroclinic. The average SST − T500 during the genesis time of this PL, which was almost 42 °C (Figure 2b), is in agreement with Terpstra et al. [31], who found an average SST − T500 of 41.0 ± 3.6 °C at the genesis time of forward-shear PLs.

Table 1.
Vertical shear strength (10−3 s−1), vertical shear vector in the propagation direction (10−3 s−1), vertical shear vector across the propagation direction (10−3 s−1), and type of shear on 25 March 2019 at different times (UTC) during the lifetime of the PL.
3.2. Development Mechanisms of the PL
The environmental conditions on the 24–25 March were favourable for the formation of the PL [35]. On 24 March at 1900 UTC, a few hours before the PL genesis, there was strong low-level baroclinicity to the west of Jan Mayen, and cold air was being advected by the strong northerly winds, while warm air was being advected northward (see Figure 13 in Moreno-Ibáñez et al. [35]). At 500 hPa, there was a through with its northeast–southwest axis parallel to the sea ice edge (not shown). On the right side of this 500 hPa through, a low-level through, which eventually became a PL, started to form.
Figure 3a shows the horizontal average of the horizontal wind divergence within a 300 km radius from the PL centre. Overall, there was weak convergence in the lower levels of the atmosphere (below 700 hPa) and stronger divergence in the upper levels (more often above 500 hPa). The level of non-divergence was located at 500 hPa in the beginning of the PL development, and it decreased down to 900 hPa by the time the PL dissipated. In the upper troposphere, there was a notable increase in divergence over time between 500 and 300 hPa. Thus, divergence aloft led to the deepening of the PL. A maximum in divergence was observed at 400 hPa around the time when the central pressure of the PL reached the minimum (Figure 2a). Afterwards, the decrease in divergence aloft was associated with the dissipation of the PL (Figure 3a). In the lower troposphere, the convergence started to decrease halfway through the lifetime of the PL, shortly before hitting Norway (at around 1100 UTC). As the PL moved overland, the low-level divergence field was affected by the complex topography of the Norwegian coast, which resulted in a decrease in convergence. On average, the vertical movement in pressure coordinate () was upward (−0.53 < Pa s−1) between the surface and ~300 hPa during the lifetime of the PL (Figure 3b). The absolute value of the average vertical movement was maximum between 700 and 600 hPa, except for during the first three hours and the last three hours of the PL lifetime, when the maximum was located at 500 and 800 hPa, respectively. The maximum absolute values of the average vertical movement were found between 1000 and 1200 UTC on 25 March.
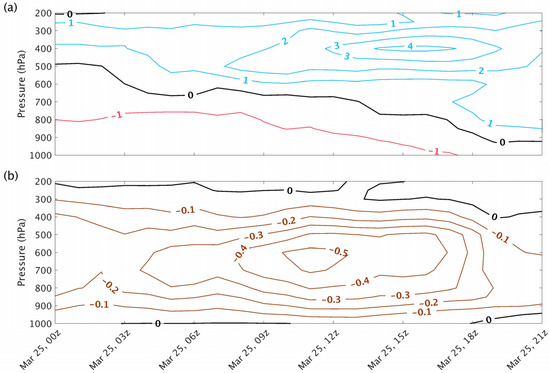
Figure 3.
Time series of the vertical profile of the horizontal average of (a) the horizontal wind divergence (×10−5 s−1, contours every 10−5 s−1), and (b) the vertical motion in pressure coordinate (Pa s−1, contours every 10−1 Pa s−1). The grid points included in the computation of the average are those within a 300 km radius from the PL centre.
Figure 4 shows the horizontal wind divergence at 950 hPa and 500 hPa on the 25 March at 0300 UTC and 1200 UTC. During the initial stage of the PL, there was a hook-shaped thin band of very strong convergence at 950 hPa (Figure 4a). This band extended from the west side of the PL to its centre, and from its centre to the southwest. Near the PL centre, on its east and north sides, there was mainly convergence, although the values were much smaller than those of the hook-shaped convergence band. At 500 hPa, there was a comma-shaped area of divergence located above the PL (Figure 4c). This area of divergence was surrounded by a band of convergence that was particularly strong on its north and east sides. The presence of this area of convergence explains why, on average, the horizontal wind divergence was not very strong at 500 hPa (Figure 3a). During the mature stage of the PL, at 950 hPa, there was a strong convergence band that wrapped around the PL, as well as several low-level and alternating strong convergence and divergence bands (Figure 4b). At 500 hPa, the absolute values of convergence and divergence in the PL region were quite weak, except for a band of strong divergence that extended from the east side of the PL to the south (Figure 4d).
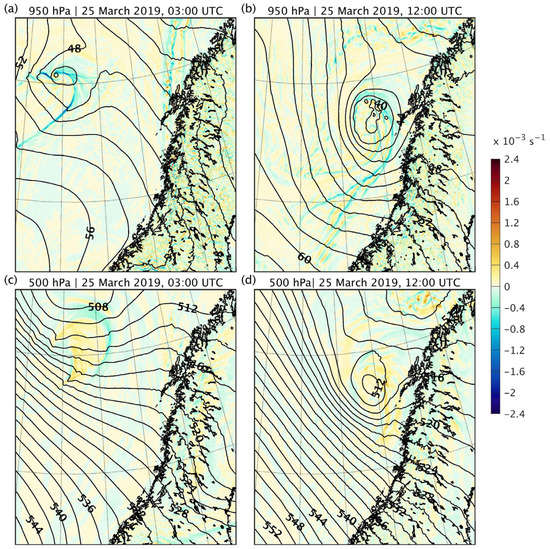
Figure 4.
Horizontal wind divergence at (a,b) 950 hPa and (c,d) 500 hPa on 25 March 2019 at (a,c) 0300 UTC and (b,d) 1200 UTC. The black isolines represent the geopotential height (dam; contours every 2 dam) at (a,b) 950 hPa and (c,d) 500 hPa. The black outlining represents the coastline.
The interaction between the low- and mid-troposphere is better understood by looking at the SLP, the geopotential height at 500 hPa, and the 1000–500 hPa thickness, shown in Figure 5. The PL formed downstream of a 500 hPa trough, in a region with a strong 1000–500 hPa thickness gradient, indicating a baroclinic environment (Figure 5a). Thus, the upper-level divergence (Figure 4c) provided a favourable condition for the intensification of the PL. This is in accordance with Stoll et al. [25], who found that PLs that develop in strong-shear environments are associated with an up-shear vertical tilt of the pressure anomaly. At around half its lifetime, the vertical extension of the PL reached 500 hPa (Figure 5c). The 1000–500 hPa thickness field shows that there was southward (northward) cold (warm) air advection to the west (east) of the PL (Figure 5b,c). In other words, the warm (cold) sector was ahead of (behind) the PL with respect to its propagation direction, which is a situation typical of forward shear environments [25]. The PL still had a large vertical extension when it affected the Norwegian coast (Figure 5d), and the upper-level low dissipated at the same time as the low-level one (not shown).
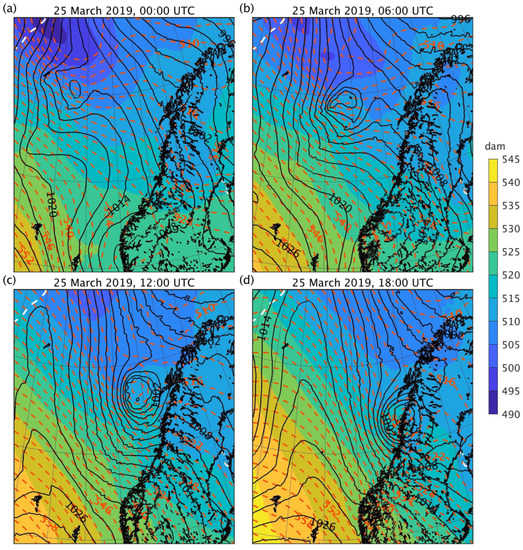
Figure 5.
Simulated fields showing the PL on 25 March 2019 at (a) 0000 UTC, (b) 0600 UTC, (c) 1200 UTC, and (d) 1800 UTC. The colourmap represents the 1000–500 hPa thickness (dam), the black isobars represent the SLP (hPa, contours every 2 hPa) and the red (dashed lines) isohypses represent the geopotential height at 500 hPa (dam, contours every 2 dam). The black outlining represents the coastline, and the white dashed line represents the sea ice edge, which is defined as the 0.15 contour of the sea ice concentration. Image (a) was adapted from Moreno-Ibáñez et al. [35].
Figure 6 and Figure 7 show the terms in Equation (4) contributing to the surface pressure tendency on 25 March at 0000 UTC and 1200 UTC, respectively. Since the PL was moving toward the southeast, the surface pressure tendency was negative (positive) on the south and east (north and west) side of the PL, and the absolute values of the surface pressure tendency were particularly high where the pressure gradients were the strongest (Figure 6a and Figure 7a). The errors in the computation of the surface pressure tendency with Equation (4) were small and of a different sign over the domain shown. At 0000 UTC, the mean absolute error over this domain was 0.07 hPa h−1, and the maximum absolute error was 0.66 hPa h−1 (Figure 6b). At 1200 UTC, the mean absolute error over this domain was 0.09 hPa h−1, and the maximum absolute error was 0.85 hPa h−1 (Figure 7b). Over the area of the MCAO, the increase in the air temperature of the atmospheric column contributed to a decrease in surface pressure, whereas the increase in geopotential height at 500 hPa contributed to an increase in surface pressure (Figure 7). At 0000 UTC, only term 2 contributed to the decrease in the surface pressure south of the PL (Figure 6). Therefore, the warming of the atmospheric column near the PL centre played an important role in the deepening of the PL during its genesis. At 1200 UTC, when the PL was well developed, the decrease in geopotential height at 500 hPa was the main driver of the decrease in surface pressure near the PL centre (Figure 7). The contribution of the warming of the atmospheric column to the deepening of the PL was less important at this stage.
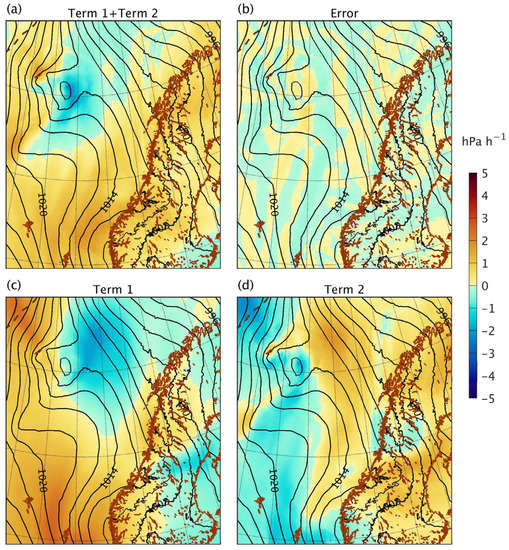
Figure 6.
Surface pressure tendency (hPa h−1) on 25 March 2019 at 0000 UTC. (a) Surface pressure tendency computed as the sum of term 1 () and term 2 (), and (b) the error, that is, the sum of term 1 and term 2 minus the surface pressure tendency computed with the simulated surface pressure field. The two terms contributing to the surface pressure tendency are (c) term 1 and (d) term 2. The black isobars represent the SLP (hPa; contours every 2 hPa). The brown outlining represents the coastline, and the brown dashed line represents the sea ice edge, which is defined as the 0.15 contour of the sea ice concentration.
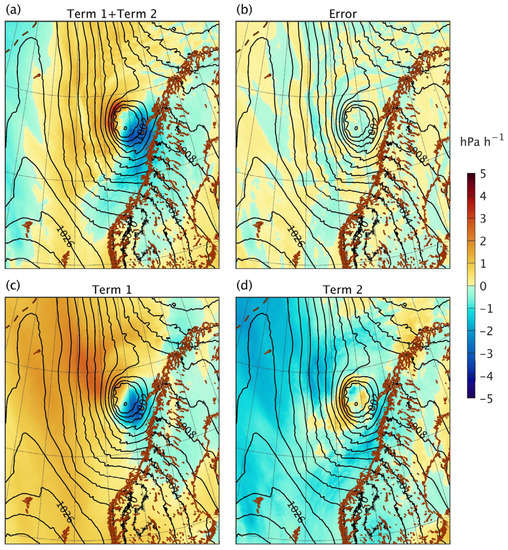
Figure 7.
Same as Figure 6, but for 25 March 2019 at 1200 UTC.
Figure 8 shows the time average and deviation of SLP, computed considering the period corresponding to the lifetime of the PL. In the region shown in the figure, overall, the average SLP decreased from the southwest to the northeast. The PL formed in an environment with a relatively high SLP (Figure 8a) and moved south-eastward to an environment with lower SLP (Figure 8b). Thus, the propagation of the PL into an environment with lower SLP and strong convergence of northward warm advection at low-levels (see Figure 4a in this article, and Figure 13 in Moreno-Ibáñez et al. [35]) also contributed to the decrease in the central pressure of the PL.
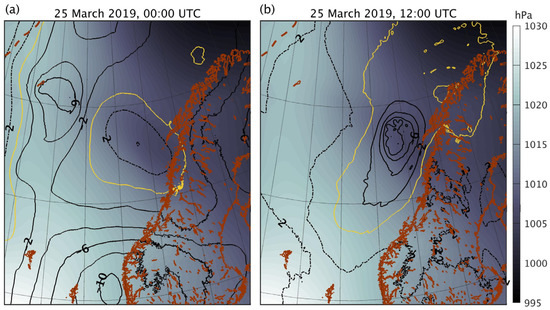
Figure 8.
Time average and time deviation of SLP on 25 March 2019 at (a) 0000 UTC and (b) 1200 UTC. The colour map represents the time average of SLP (hPa) for the period corresponding to the lifetime of the PL. The black continuous (dashed) lines represent the negative (positive) time deviation of SLP (hPa, contours every 2 hPa), and the yellow line represents a zero-time deviation of SLP. The brown outlining represents the coastline, and the brown dashed line represents the sea ice edge, which is defined as the 0.15 contour of the sea ice concentration.
Given that this PL formed in a baroclinic environment downstream of a 500 hPa trough (Figure 5a), baroclinic instability likely played a major role in its genesis, as noted by Moreno-Ibáñez et al. [35]. The time series of the baroclinic conversion term shows that this indeed was the case (Figure 9). We recall that positive corresponds to rising (sinking) warm (cold) air, resulting in lowering of the centre of mass of the atmospheric column; the decrease of gravitational potential energy is then available for generating kinetic energy. During the whole lifetime of the PL, the horizontal average of was positive in the lower levels of the troposphere (~1000–700 hPa) and negative in the upper levels (~500–300 hPa). Between 500 and 700 hPa, the term was initially negative, but it increased as the PL developed, acquiring values close to zero or positive by 1200 UTC. In other words, baroclinic conversion gradually expanded from the lower troposphere to the middle troposphere. The large positive at low levels contributed to the intensification of the PL, as reflected in the deepening central pressure and increasing surface wind speeds (Figure 2a). The highest values of were found between 800 and 700 hPa (Figure 9) due to the latent heating of condensation, which increased the air buoyancy (this will be analysed below). The baroclinic term eventually weakened during the second half of the lifetime of the PL, contributing to its dissipation.
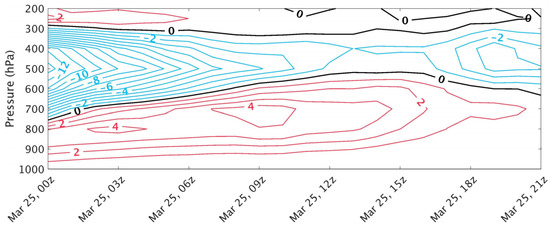
Figure 9.
Time series of the vertical profile of the horizontal average of the baroclinic conversion term (×10−3 W kg−1, contours every 10−3 W kg−1). The grid points included in the computation of the average are those within a 300 km radius from the PL centre.
The spatial distribution of the lower-level (1000–700 hPa) mass-weighted vertical integral of at the genesis and mature stages of the PL is shown in Figure 10. During the genesis of the PL, a thin band of very high values of extended from the centre and east side of the PL towards the southwest (Figure 10a). This corresponded to the region where convergence was strongest (Figure 4a). This band is associated with the shape of the SLP gradient as well as the temperature one (Figure 11a), indicating a frontal zone. The values of in this thin band decreased over time (Figure 10b), and the band disappeared as the PL moved overland (not shown). In summary, these results indicate that low-level baroclinic instability plays an important role in the formation of this PL, and that, during the intensification of this PL, baroclinic instability extended from the low- to the mid-troposphere.
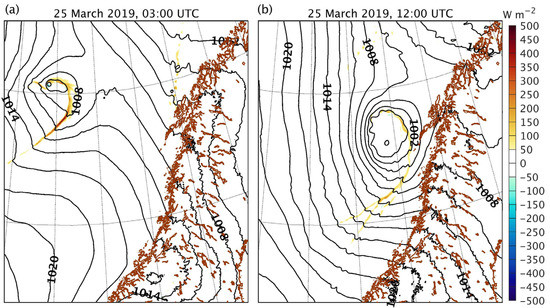
Figure 10.
Mass-weighted vertical integral of (W m−2) at the lower troposphere (1000–700 hPa) on 25 March 2019 at (a) 0300 UTC and (b) 1200 UTC. The black isolines represent the SLP (hPa; contours every 2 hPa). The brown outlining represents the coastline.
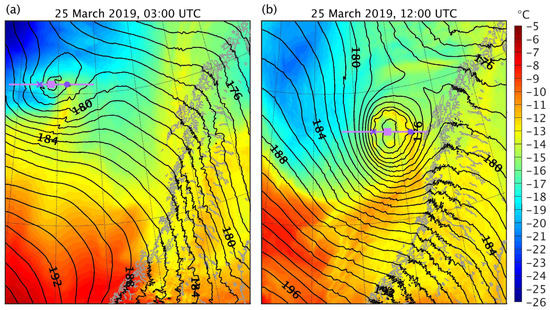
Figure 11.
Simulated fields showing the PL on 25 March 2019 at (a) 0300 UTC and (b) 1200 UTC. The colourmap represents the temperature at 800 hPa (°C), and the black isolines represent the geopotential height at 800 hPa (dam, contours every 1 dam). The grey outlining represents the coastline. The violet line indicates the region whose vertical cross-section is shown in (a) Figure 12a and (b) Figure 12b. The violet square, cross, and circle indicate the corresponding locations in Figure 12 and Figure 13.
The baroclinic development of this PL is illustrated by a map of the temperature and geopotential height fields at 800 hPa (Figure 11), as well as by a vertical cross-section of the potential temperature and vertical velocity fields (Figure 12) during its genesis and mature stages. During the genesis of the PL, there was low-level southward (northward) cold (warm) air advection on the west (east) side of the PL (Figure 11a). This situation led to the generation of eddy available potential energy, which could then be converted to eddy kinetic energy through baroclinic conversion. There was a very strong updraft on the west side of the PL, where the air was warmer than in the surrounding areas (Figure 12a). The upward vertical movement was particularly strong here because it was a region of strong low-level convergence (Figure 4a). Moreover, the sensible and latent heat fluxes on the west side of the PL were stronger that on its east side (this will be analysed below), thus increasing the air buoyancy. There was also an upward vertical movement, albeit weaker, at the centre of the PL and on its east side (Figure 12a). This was also a region with high values of low-level convergence (Figure 4a). The contribution to the PL deepening by the warming of the atmospheric column (Figure 6d) was found at approximately the location where baroclinic instability was the most intense (Figure 10a), which was a region with an upward vertical movement (Figure 12a). By 1200 UTC, the PL had occluded (Figure 11b). There was still an upward vertical movement on the west and east sides of the PL (Figure 12b), but the upward movement on the west side was much weaker than during the PL genesis (Figure 12a). This agrees with the lower values of low-level convergence in this region (Figure 4b) compared to the initial stages of PL development (Figure 4a). On the east side, the upward movement extended up to 500 hPa, with the maximum rising motion values mainly between 850 and 650 hPa (Figure 12b). Unlike other PLs (e.g., [52]), this one did not have a warm core (Figure 11 and Figure 12). The formation of the typical comma-shaped cloud (Figure 1), similar to the cloud signature of synoptic-scale cyclones, is explained by the vertical movement (Figure 12) observed in the regions where the baroclinic term was the strongest (Figure 10), which corresponded to the area where the temperature gradient at 800 hPa was highest (Figure 11).
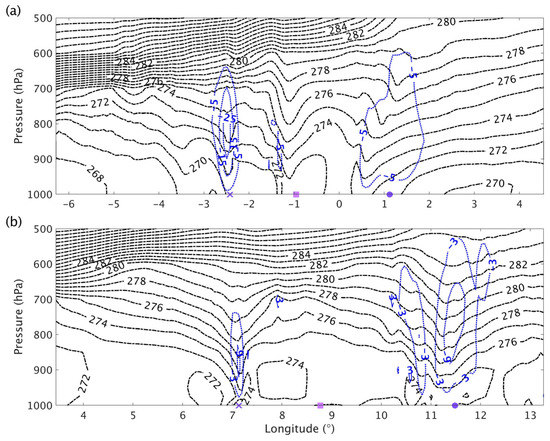
Figure 12.
Vertical cross-section of the PL corresponding to the violet lines shown in (a) Figure 11a and (b) Figure 11b (on 25 March 2019 at 0300 and 1200 UTC, respectively). The black dashed lines represent the potential temperature (K, contours every 1 K). The blue dotted (continuous) lines represent the negative (positive) vertical velocity (Pa s−1, contours every (a) 10 Pa s−1 and (b) 6 Pa s−1). The violet square, cross, and dot correspond to the locations indicated in Figure 11.
An interesting feature of this PL was the formation of a few small and low-level cyclonic mesoscale vortices around the PL centre, embedded in the frontal zone (Figure 1 and Figure 11b). Figure 11b shows that the SLP contour near the PL centre was wavy. The strong positive values of relative vorticity at the location of these wavy patterns indicated that they were mesoscale cyclonic vortices or PL intensification (not shown). Figure 12b shows a strong upward vertical movement around the centre of the mesoscale vortex located at approximately 11° E. These mesoscale vortices had a diameter of up to ~30 km and were warmer than the surrounding area (Figure 11b). This type of vortex typically develops from a frontal wave formed through barotropic instability, the energy source being the wind shear across the front [53]. The strong horizontal shear near the centre of the PL likely explains the development of barotropic instability and the ensuing frontal wave. Frontal waves are often seen at the centre of synoptic-scale extratropical cyclones [53] and have also been found in some PL studies (e.g., [13]). This is a clear example of the added value of a high-resolution model that can resolve narrow wind shear zones, frontal waves, and small mesoscale vortices.
The role of CAPE in the development of this PL was analysed using a skew-T log-P diagram (Figure 13). On 25 March at 0300 UTC, during the PL genesis, at the locations of rising motion to the west and to the east of the PL centre (Figure 12a), the atmosphere was neutral to moist convection from the surface up to ~700–600 hPa and stable above (Figure 13a,b). At both locations, the CAPE was less than 50 J kg−1, and there was no CIN. The air was saturated in the lower troposphere at both locations; subsequently, latent heat release resulted in diabatically induced upward vertical movement, which reinforced the baroclinically induced rising motion, leading to strong updrafts (Figure 12a). In addition, the release of latent heat in the warm air mass contributed to the maintenance of the horizontal temperature gradient, thus contributing to the baroclinic environment, as found by other authors (e.g., [29]). In the mid-troposphere, the air was quite dry to the west of the PL centre, whereas it was still close to saturation at 500 hPa to the east of the PL centre (Figure 13a,b). As the surface heat fluxes warmed and moistened the atmosphere (Figure 2c), the temperature profile shifted towards higher values in the lowest level of the skew-T log-P diagram (Figure 13c,d). At 1200 UTC, during the mature stage of the PL, at locations of rising motion (Figure 12b), the atmosphere was unstable to moist convection, when considering an air parcel lifted from the surface. The CAPE was 379.39 and 299.69 J kg−1 to the west and to the east of the PL centre, respectively, and there was no CIN at any of these locations (Figure 13c,d). At both locations, the air was saturated in the lower troposphere. In the mid-troposphere, the air was quite dry to the west of the PL centre, whereas it was still close to saturation at 500 hPa, to the east of the PL centre.
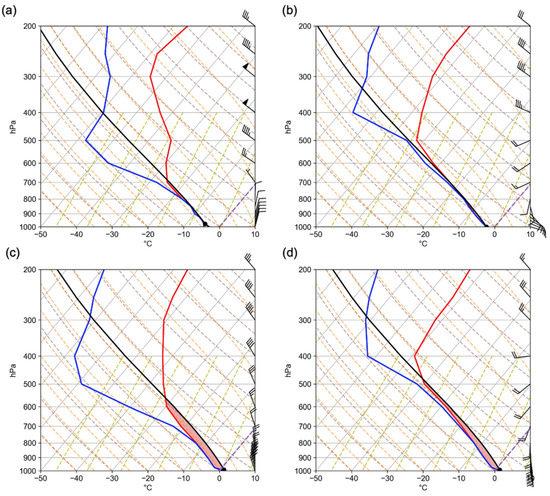
Figure 13.
Skew-T log-P diagrams corresponding to 25 March 2019 at 0300 UTC at the location of the (a) violet cross and (b) violet circle in Figure 11a and Figure 12a, and to 25 March 2019 at 1200 UTC at the location of the (c) violet cross and (d) violet circle in Figure 11b and Figure 12b. The diagrams show the air temperature (red line, °C), the dew-point temperature (blue line, °C), the parcel profile (black line), the lifting condensation level (black circle), and the wind speed (m s−1) and direction (wind barbs). The violet dashed line is the zero isotherm. The red shading is the convective available potential energy.
According to van Delden et al. [17], a moderate amount of CAPE is around 400–600 J kg−1. Hence, the lack of CIN and the negligible (Figure 13a,b) and relatively low (Figure 13c,d) amount of CAPE is in accordance with other studies that found that there is no reservoir of CAPE during PL development, since it is consumed as quickly as it is generated [25,54].
Finally, it is interesting to analyse the role of the surface heat fluxes in the genesis and intensification of this PL. The MCAO led to large surface heat fluxes from the ocean to the atmosphere (Figure 14). However, the surface heat fluxes did not seem to make a significant direct contribution to the PL genesis, since they were not particularly strong in the region where the decrease in the surface pressure was mainly due to the warming of the atmospheric column (Figure 6). Rather, the surface heat fluxes likely had an indirect role in the formation of this PL. By warming the lower atmosphere, the sensible heat flux contributed to the decrease in the static stability of the atmosphere, which favoured the interaction between the low- and high-level anomalies (Figure 5a), contributing to baroclinic development. The latent heat flux provided the cold and dry atmosphere with moisture, thus facilitating the release of latent heat at higher atmospheric levels. When the PL was well developed, both sensible and latent heat surface fluxes were the strongest on the west side of the PL, where the winds were the most intense, as they were reinforced by the winds associated with the MCAO (Figure 15). In the regions where the heat surface fluxes were the strongest, the surface pressure was increasing, and this increase was partly due to the cooling of the atmospheric column (Figure 7). Low-level cold air advection, which contributed to the cooling of the atmospheric column, tended to generate a decrease in cyclogenesis and a downward air motion [15]. Finally, note that an in-depth analysis of the role of surface heat fluxes should be performed to clearly determine the direct and indirect roles of surface heat fluxes in the development of this PL. As Gachon et al. [15] noted in their case study of a PL, sensible heat fluxes can have a direct impact on the low-level temperature and vorticity advection terms, thus having direct and indirect impacts on the vorticity tendency or cyclogenesis and on the vertical motion near the surface.
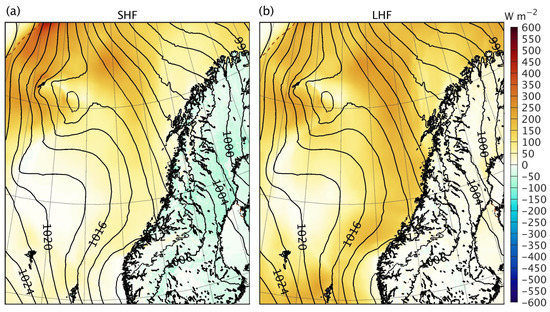
Figure 14.
Surface diabatic fluxes (W m−2) on 25 March 2019 at 0000 UTC: (a) sensible heat flux, and (b) latent heat flux. The black isobars represent the SLP (hPa; contours every 2 hPa). The black outlining represents the coastline, and the brown dashed line represents the sea ice edge, which is defined as the 0.15 contour of the sea ice concentration.
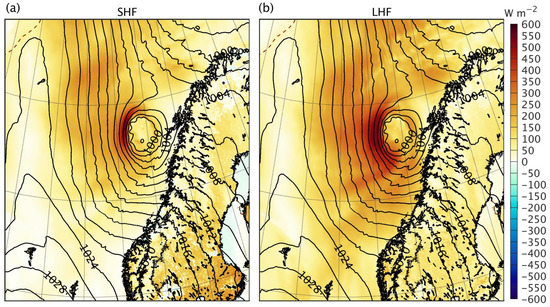
Figure 15.
Same as Figure 14, but for 25 March 2019 at 1200 UTC.
4. Conclusions
A case study of the PL that developed over the Norwegian Sea on 25 March 2019 has been presented. The observed PL was simulated reasonably well by the CRCM6/GEM4, a convection-permitting model [35]. The analysis conducted here has allowed gaining an insight into the development mechanisms involved in the genesis and intensification of this PL, showing the potential of convection-permitting models as a tool to study PLs.
The PL developed in a forward-shear environment, and its development resembled that of a typical midlatitude storm. As shown in Stoll et al. [25], forward-shear PLs mainly occur within a MCAO and propagate eastward. Accordingly, the genesis of this PL, which propagated south-eastward, occurred during a MCAO in a region with a high horizontal temperature gradient, near the sea ice edge. The PL formed as a low-level pressure anomaly located downstream (east) of a 500 hPa trough. During the initial stage of the PL, early on 25 March, there was low-level southward (northward) cold (warm) air advection on the west (east) side of the PL. The warming of the atmospheric column near the PL centre contributed to the deepening of the incipient PL. As the PL deepened and its vertical extension increased, reaching the 500 hPa level, the baroclinic instability extended from the low- to the mid-troposphere while weakening. Latent heating of condensation contributed to the intensification of the PL, by reinforcing the upward vertical movement associated with baroclinic conversion. The surface heat fluxes seemed to indirectly contribute to the formation of the PL by decreasing the atmospheric static stability and by providing moisture to the dry atmosphere. By 1200 UTC, the PL had occluded, and it dissipated as the baroclinic conversion term became weaker. In conclusion, moist baroclinic instability was the main driver of the genesis and intensification of this PL, in agreement with recent studies (e.g., [25]).
In addition to baroclinic conversion, other sources of energy, namely barotropic conversion and CAPE, were present during PL development; nonetheless, they do not seem to have played a major role in the intensification of this PL. Barotropic instability led to the formation of a frontal wave that generated small and low-level cyclonic mesoscale vortices around the PL centre. Although some CAPE built up at certain locations, there was no significant reservoir of CAPE during PL development, since the CAPE was consumed as quickly as it was generated.
This study has shown that the CRCM6/GEM4 can represent, among other details, strong temperature gradients, intense and narrow updrafts, narrow wind shear zones, frontal waves, and small low-level mesoscale cyclones. Thus, the CRCM6/GEM4 can provide a detailed representation of the structure of PLs, as well as of the forcing mechanisms involved in the generation and intensification of these mesoscale cyclones. In this case, the baroclinic development was well represented by the CRCM6/GEM4, which captured the evolution of the narrow zones along the front that presented high values of the baroclinic conversion term. To further evaluate the contribution of surface heat fluxes to the PL development, in particular near the sea ice edge, a future study could conduct a more in-depth diagnostic of the direct and indirect effects on both temperature advection and the MCAO features and vorticity maximum location at low levels using the methodology applied by Gachon et al. [15]. An interesting course of research would be to conduct a detailed analysis of a PL that formed under different forcing mechanisms. For instance, it would be very interesting to study the development mechanisms of a PL that formed to the east of Greenland, where topography can play an important role in PL development [55].
The main limitation of this study is that, since the CRCM6/GEM4 does not include either an ocean or a sea ice component, the atmosphere–ocean–sea ice interactions were not explicitly represented, despite the fact that these interactions modulated the PL development during its life cycle. In effect, the shape of the sea ice edge, which is affected by near surface winds and surface oceanic currents, affects the formation of convergence zones within MCAO [14] and influences PL genesis [15]. As suggested in Renfrew et al. [56], coupled interactions between the atmosphere and the oceanic features play a significant role in shaping surface fluxes and impact on the ocean, which in turn modify the low-level atmospheric conditions. PL development can lead to an increase or a decrease in SST [49], which can in turn contribute to the intensification or weakening of the PL. Moreover, the sea ice concentration and SST used as ocean surface boundary conditions in these simulations were obtained from ERA5 [57], which has a grid mesh of 0.25°. Therefore, coupling the atmosphere model with ocean and sea ice models could improve the representation of PLs by the CRCM6/GEM4, since the interactions between these different components should be represented at high resolution.
Author Contributions
Conceptualization, M.M.-I. and R.L.; methodology, M.M.-I. and R.L.; software, M.M.-I.; validation, R.L. and P.G.; formal analysis, M.M.-I., R.L. and P.G.; investigation, M.M.-I.; resources, R.L.; writing—original draft preparation, M.M.-I.; writing—review and editing, M.M.-I., R.L. and P.G.; visualization, M.M.-I.; supervision, R.L. and P.G.; project administration, R.L.; funding acquisition, R.L. All authors have read and agreed to the published version of the manuscript.
Funding
This work was supported by the Discovery Grant program of the Natural Sciences and Engineering Research Council of Canada (NSERC) under Grant 707337, by the project “Marine Environmental Observation, Prediction and Response” (MEOPAR; http://meopar.ca (accessed on 23 May 2023)) of the Networks of Centres of Excellence (NCE; http://www.nce-rce.gc.ca (accessed on 23 May 2023)) of Canada, and by the excellence scholarship of the Trottier Family Foundation (grant from the UQAM’s foundation).
Institutional Review Board Statement
Not applicable.
Informed Consent Statement
Not applicable.
Data Availability Statement
The output of the simulations of this PL and the coordinates of the manually obtained PL track are openly available in Borealis, the Canadian Dataverse Repository at 10.5683/SP3/6E3ITE (accessed on 4 April 2023). VIIRS channel M15 observations are available from NASA (https://ladsweb.modaps.eosdis.nasa.gov/ (accessed on 22 September 2022)). The Global Self-consistent, Hierarchical, High-resolution Geography Database (GSHHG), available at https://www.soest.hawaii.edu/pwessel/gshhg/ (accessed on 7 February 2023), was used to represent the coastlines. The divergent colourmap used in Figure 4, Figure 6, Figure 7, Figure 10, Figure 14, and Figure 15 is provided by the Texas Advanced Computing Center at https://sciviscolor.org/ (accessed on 20 December 2022).
Acknowledgments
Computations were performed on the supercomputer Beluga, managed by Calcul Québec and the Digital Research Alliance of Canada. The operation of this supercomputer is funded by the Canada Foundation for Innovation (CFI), Ministère de l’Économie et de l’Innovation du Québec (MEI) and le Fonds de recherche du Québec (FRQ). The software package MetPy is available at https://unidata.github.io/MetPy/latest/ (accessed on 7 November 2022). The authors would like to thank Katja Winger for her valuable help in the use of the r.diag toolkit, as well as Frédérik Toupin for maintaining an efficient and user-friendly local computing facility.
Conflicts of Interest
The authors declare no conflict of interest. The funders had no role in the design of the study; in the collection, analyses, or interpretation of data; in the writing of the manuscript; or in the decision to publish the results.
Appendix A
An equation to express the surface pressure tendency can be developed using the thermodynamic and hydrostatic equations. When focusing on the PL as a whole, the hydrostatic approximation is adequate [10]. Three vertical levels were considered when developing the equation of the surface pressure tendency: the top level 500 hPa, the low level , and the surface level . The level is the minimum value of the time series of the surface pressure at each grid point. Therefore, for each grid point, .
- 1.
- Step 1: Find an expression for
Starting from the hydrostatic equation:
We integrate from 500 hPa to :
We compute the local derivative using Leibniz formula:
- 2.
- Step 2: Link to
We integrate the hydrostatic equation from b to s:
We compute the local derivative using Leibniz formula:
Since and , we obtain:
We solve for :
We assume that term will be negligible compared to because is close to , so
- 3.
- Step 3: The surface pressure tendency equation
Substituting by the expression obtained in Step 1, we obtain:
Therefore, the surface pressure tendency is:
References
- Klein, T.; Heinemann, G. Interaction of katabatic winds and mesocyclones near the eastern coast of Greenland. Meteorol. Appl. 2002, 9, 407–422. [Google Scholar] [CrossRef]
- DuVivier, A.K.; Cassano, J.J.; Craig, A.; Hamman, J.; Maslowski, W.; Nijssen, B.; Osinski, R.; Roberts, A. Winter Atmospheric Buoyancy Forcing and Oceanic Response during Strong Wind Events around Southeastern Greenland in the Regional Arctic System Model (RASM) for 1990–2010. J. Clim. 2016, 29, 975–994. [Google Scholar] [CrossRef]
- Michel, C.; Terpstra, A.; Spengler, T. Polar Mesoscale Cyclone Climatology for the Nordic Seas Based on ERA-Interim. J. Clim. 2018, 31, 2511–2532. [Google Scholar] [CrossRef]
- Valkonen, E.; Cassano, J.; Cassano, E. Arctic Cyclones and Their Interactions with the Declining Sea Ice: A Recent Climatology. J. Geophys. Res. Atmos. 2021, 126, e2020JD034366. [Google Scholar] [CrossRef]
- Gutjahr, O.; Jungclaus, J.H.; Brüggemann, N.; Haak, H.; Marotzke, J. Air-Sea Interactions and Water Mass Transformation During a Katabatic Storm in the Irminger Sea. J. Geophys. Res. Ocean. 2022, 127, e2021JC018075. [Google Scholar] [CrossRef]
- Moore, G.W.K.; York, J.; Sathiyamoorthy, S. Polar lows in the Labrador Sea. Tellus A 1996, 48, 17–40. [Google Scholar] [CrossRef]
- Condron, A.; Renfrew, I.A. The impact of polar mesoscale storms on northeast Atlantic Ocean circulation. Nat. Geosci. 2013, 6, 34. [Google Scholar] [CrossRef]
- Heinemann, G.; Claud, C. Report of a workshop on ‘‘theoretical and observational studies of polar lows’’ of the European Geophysical Society Polar Lows Working Group. Bull. Am. Meteorol. Soc. 1997, 78, 2643–2658. [Google Scholar] [CrossRef]
- Orlanski, I. A Rational Subdivision of Scales for Atmospheric Processes. Bull. Am. Meteorol. Soc. 1975, 56, 527–530. [Google Scholar]
- Moreno-Ibáñez, M.; Laprise, R.; Gachon, P. Recent advances in polar low research: Current knowledge, challenges and future perspectives. Tellus A 2021, 73, 1890412. [Google Scholar] [CrossRef]
- Turner, J.; Rasmussen, E.A.; Carleton, A.M. Introduction. In Polar Lows: Mesoscale Weather Systems in the Polar Regions; Rasmussen, E.A., Turner, J., Eds.; Cambridge University Press: Cambridge, UK, 2003; pp. 1–51. [Google Scholar]
- Fletcher, J.; Mason, S.; Jakob, C. The Climatology, Meteorology, and Boundary Layer Structure of Marine Cold Air Outbreaks in Both Hemispheres. J. Clim. 2016, 29, 1999–2014. [Google Scholar] [CrossRef]
- Sergeev, D.E.; Renfrew, I.A.; Spengler, T.; Dorling, S.R. Structure of a shear-line polar low. Q. J. R. Meteorol. Soc. 2017, 143, 12–26. [Google Scholar] [CrossRef]
- Watanabe, S.-i.I.; Niino, H.; Spengler, T. Formation of maritime convergence zones within cold air outbreaks due to the shape of the coastline or sea ice edge. Q. J. R. Meteorol. Soc. 2022, 148, 2546–2562. [Google Scholar] [CrossRef]
- Gachon, P.; Laprise, R.; Zwack, P.; Saucier, F.J. The effects of interactions between surface forcings in the development of a model-simulated polar low in Hudson Bay. Tellus A 2003, 55, 61–87. [Google Scholar] [CrossRef]
- Albright, M.D.; Reed, R.J.; Ovens, D.W. Origin and structure of a numerically simulated polar low over Hudson Bay. Tellus A 1995, 47, 834–848. [Google Scholar] [CrossRef]
- van Delden, A.; Rasmussen, E.A.; Turner, J.; Røsting, B. Theoretical investigations. In Polar Lows: Mesoscale Weather Systems in the Polar Regions; Rasmussen, E.A., Turner, J., Eds.; Cambridge University Press: Cambridge, UK, 2003; pp. 286–404. [Google Scholar]
- Mansfield, D.A. Polar lows: The development of baroclinic disturbances in cold air outbreaks. Q. J. R. Meteorol. Soc. 1974, 100, 541–554. [Google Scholar] [CrossRef]
- Rasmussen, E. The polar low as an extratropical CISK disturbance. Q. J. R. Meteorol. Soc. 1979, 105, 531–549. [Google Scholar] [CrossRef]
- Businger, S. The synoptic climatology of polar low outbreaks. Tellus A 1985, 37, 419–432. [Google Scholar] [CrossRef]
- Sardie, J.M.; Warner, T.T. A numerical study of the development mechanisms of polar lows. Tellus A 1985, 37, 460–477. [Google Scholar] [CrossRef]
- Rasmussen, E.A.; Turner, J.; Ninomiya, K.; Renfrew, I.A. Observational studies. In Polar Lows: Mesoscale Weather Systems in the Polar Regions; Rasmussen, E.A., Turner, J., Eds.; Cambridge University Press: Cambridge, UK, 2003; pp. 150–285. [Google Scholar]
- Terpstra, A.; Spengler, T.; Moore, R.W. Idealised simulations of polar low development in an Arctic moist-baroclinic environment. Q. J. R. Meteorol. Soc. 2015, 141, 1987–1996. [Google Scholar] [CrossRef]
- Haualand, K.F.; Spengler, T. Direct and Indirect Effects of Surface Fluxes on Moist Baroclinic Development in an Idealized Framework. J. Atmos. Sci. 2020, 77, 3211–3225. [Google Scholar] [CrossRef]
- Stoll, P.J.; Spengler, T.; Terpstra, A.; Graversen, R.G. Polar lows–moist-baroclinic cyclones developing in four different vertical wind shear environments. Weather Clim. Dyn. 2021, 2, 19–36. [Google Scholar] [CrossRef]
- Kolstad, E.W.; Bracegirdle, T.J. Sensitivity of an apparently hurricane-like polar low to sea-surface temperature. Q. J. R. Meteorol. Soc. 2017, 143, 966–973. [Google Scholar] [CrossRef]
- Bracegirdle, T.J.; Gray, S.L. The dynamics of a polar low assessed using potential vorticity inversion. Q. J. R. Meteorol. Soc. 2009, 135, 880–893. [Google Scholar] [CrossRef]
- McInnes, H.; Kristiansen, J.; Kristjánsson, J.E.; Schyberg, H. The role of horizontal resolution for polar low simulations. Q. J. R. Meteorol. Soc. 2011, 137, 1674–1687. [Google Scholar] [CrossRef]
- Føre, I.; Nordeng, T.E. A polar low observed over the Norwegian Sea on 3–4 March 2008: High-resolution numerical experiments. Q. J. R. Meteorol. Soc. 2012, 138, 1983–1998. [Google Scholar] [CrossRef]
- Wagner, J.S.; Gohm, A.; Dörnbrack, A.; Schäfler, A. The mesoscale structure of a polar low: Airborne lidar measurements and simulations. Q. J. R. Meteorol. Soc. 2011, 137, 1516–1531. [Google Scholar] [CrossRef]
- Terpstra, A.; Michel, C.; Spengler, T. Forward and Reverse Shear Environments during Polar Low Genesis over the Northeast Atlantic. Mon. Weather Rev. 2016, 144, 1341–1354. [Google Scholar] [CrossRef]
- Stoll, P.J. A global climatology of polar lows investigated for local differences and wind-shear environments. Weather Clim. Dyn. 2022, 3, 483–504. [Google Scholar] [CrossRef]
- Xue, J.; Bromwich, D.H.; Xiao, Z.; Bai, L. Impacts of initial conditions and model configuration on simulations of polar lows near Svalbard using Polar WRF with 3DVAR. Q. J. R. Meteorol. Soc. 2021, 147, 3806–3834. [Google Scholar] [CrossRef]
- Sergeev, D.; Renfrew, I.A.; Spengler, T. Modification of Polar Low Development by Orography and Sea Ice. Mon. Weather Rev. 2018, 146, 3325–3341. [Google Scholar] [CrossRef]
- Moreno-Ibáñez, M.; Laprise, R.; Gachon, P. Assessment of simulations of a polar low with the Canadian Regional Climate Model. EarthArXiv 2023, Preprint. [Google Scholar] [CrossRef]
- Côté, J.; Gravel, S.; Méthot, A.; Patoine, A.; Roch, M.; Staniforth, A. The Operational CMC–MRB Global Environmental Multiscale (GEM) Model. Part I: Design Considerations and Formulation. Mon. Weather Rev. 1998, 126, 1373–1395. [Google Scholar] [CrossRef]
- Bélair, S.; Mailhot, J.; Girard, C.; Vaillancourt, P. Boundary Layer and Shallow Cumulus Clouds in a Medium-Range Forecast of a Large-Scale Weather System. Mon. Weather Rev. 2005, 133, 1938–1960. [Google Scholar] [CrossRef]
- Bélair, S.; Roch, M.; Leduc, A.-M.; Vaillancourt, P.A.; Laroche, S.; Mailhot, J. Medium-Range Quantitative Precipitation Forecasts from Canada’s New 33-km Deterministic Global Operational System. Weather Forecast. 2009, 24, 690–708. [Google Scholar] [CrossRef]
- Girard, C.; Plante, A.; Desgagné, M.; McTaggart-Cowan, R.; Côté, J.; Charron, M.; Gravel, S.; Lee, V.; Patoine, A.; Qaddouri, A.; et al. Staggered Vertical Discretization of the Canadian Environmental Multiscale (GEM) Model Using a Coordinate of the Log-Hydrostatic-Pressure Type. Mon. Weather Rev. 2014, 142, 1183–1196. [Google Scholar] [CrossRef]
- Moreno-Ibáñez, M.; Laprise, R.; Gachon, P. Polar low developed in the Norwegian Sea on 25 March 2019–Simulations with the Canadian Regional Climate Model (CRCM6/GEM4) and Manual Track; Borealis; V1; 2023. Available online: https://doi.org/10.5683/SP3/6E3ITE (accessed on 4 April 2023).
- NASA. NASA Visible Infrared Imaging Radiometer Suite Level-1B Product User Guide; NASA Goddard Space Flight Center: Greenbelt, MD, USA, 2019. Available online: https://ladsweb.modaps.eosdis.nasa.gov/api/v2/content/archives/Document%20Archive/Science%20Data%20Product%20Documentation/NASAVIIRSL1BUGAug2019.pdf (accessed on 22 September 2022).
- Stoll, P.J.; Graversen, R.G.; Noer, G.; Hodges, K. An objective global climatology of polar lows based on reanalysis data. Q. J. R. Meteorol. Soc. 2018, 144, 2099–2117. [Google Scholar] [CrossRef]
- Lorenz, E.N. Available Potential Energy and the Maintenance of the General Circulation. Tellus 1955, 7, 157–167. [Google Scholar] [CrossRef]
- Lorenz, E.N. The Nature and Theory of the General Circulation of the Atmosphere; World Meteorological Organization: Geneva, Switerland, 1967. [Google Scholar]
- Clément, M.; Nikiéma, O.; Laprise, R. Limited-area atmospheric energetics: Illustration on a simulation of the CRCM5 over eastern North America for December 2004. Clim. Dyn. 2017, 48, 2797–2818. [Google Scholar] [CrossRef]
- Duncan, C.N. A numerical investigation of polar lows. Q. J. R. Meteorol. Soc. 1977, 103, 255–267. [Google Scholar] [CrossRef]
- Yanase, W.; Niino, H. Dependence of Polar Low Development on Baroclinicity and Physical Processes: An Idealized High-Resolution Numerical Experiment. J. Atmos. Sci. 2007, 64, 3044–3067. [Google Scholar] [CrossRef]
- Shimada, U.; Wada, A.; Yamazaki, K.; Kitabatake, N. Roles of an upper-level cold vortex and low-level baroclinicity in the development of polar lows over the Sea of Japan. Tellus A 2014, 66, 24694. [Google Scholar] [CrossRef]
- Wu, L. Effect of atmosphere-wave-ocean/ice interactions on a polar low simulation over the Barents Sea. Atmos. Res. 2021, 248, 105183. [Google Scholar] [CrossRef]
- Wallace, J.M.; Hobbs, P.V. Atmospheric Science: An Introductory Survey, 2nd ed.; Elsevier: Amsterdam, The Netherlands, 2006; Volume 92. [Google Scholar]
- Unidata. MetPy Version 1.3.1; UCAR/Unidata: Boulder, CO, USA, 2022. [Google Scholar]
- Føre, I.; Kristjánsson, J.E.; Kolstad, E.W.; Bracegirdle, T.J.; Saetra, Ø.; Røsting, B. A ‘hurricane-like’ polar low fuelled by sensible heat flux: High-resolution numerical simulations. Q. J. R. Meteorol. Soc. 2012, 138, 1308–1324. [Google Scholar] [CrossRef]
- Leutwyler, D.; Schär, C. Barotropic Instability of a Cyclone Core at Kilometer-Scale Resolution. J. Adv. Model. Earth Syst. 2019, 11, 3390–3402. [Google Scholar] [CrossRef]
- Linders, T.; Saetra, Ø. Can CAPE maintain polar lows? J. Atmos. Sci. 2010, 67, 2559–2571. [Google Scholar] [CrossRef]
- Kristjánsson, J.E.; Thorsteinsson, S.; Kolstad, E.W.; Blechschmidt, A.M. Orographic influence of east Greenland on a polar low over the Denmark Strait. Q. J. R. Meteorol. Soc. 2011, 137, 1773–1789. [Google Scholar] [CrossRef]
- Renfrew, I.A.; Pickart, R.S.; Våge, K.; Moore, G.W.K.; Bracegirdle, T.J.; Elvidge, A.D.; Jeansson, E.; Lachlan-Cope, T.; McRaven, L.T.; Papritz, L.; et al. The Iceland Greenland Seas Project. Bull. Am. Meteorol. Soc. 2019, 100, 1795–1817. [Google Scholar] [CrossRef]
- Hersbach, H.; Bell, B.; Berrisford, P.; Hirahara, S.; Horányi, A.; Muñoz-Sabater, J.; Nicolas, J.; Peubey, C.; Radu, R.; Schepers, D.; et al. The ERA5 global reanalysis. Q. J. R. Meteorol. Soc. 2020, 146, 1999–2049. [Google Scholar] [CrossRef]
Disclaimer/Publisher’s Note: The statements, opinions and data contained in all publications are solely those of the individual author(s) and contributor(s) and not of MDPI and/or the editor(s). MDPI and/or the editor(s) disclaim responsibility for any injury to people or property resulting from any ideas, methods, instructions or products referred to in the content. |
© 2023 by the authors. Licensee MDPI, Basel, Switzerland. This article is an open access article distributed under the terms and conditions of the Creative Commons Attribution (CC BY) license (https://creativecommons.org/licenses/by/4.0/).