Article

Changes to Sea Surface Temperatures and Vertical Wind Shear and Their Influence on Tropical Cyclone Activity in the Caribbean and the Main Developing Region

by
Keneshia Hibbert
1,2,3,*,
Equisha Glenn
1,2,4,
Thomas M. Smith
5 and
Jorge E. González-Cruz
2,6,7,*
1
NOAA-EPP Earth System Science and Remote Sensing Technologies Scholar, New York, NY 10017, USA
2
NOAA Center for Earth System Science and Remote Sensing Technologies, New York, NY 10017, USA
3
CUNY Graduate Center, The City University of New York, New York, NY 10017, USA
4
Civil Engineering Department, The City College of New York, New York, NY 10017, USA
5
NOAA/STAR/SCSB and CISESS/ESSIC, University of Maryland, College Park, MD 20742, USA
6
Department of Mechanical Engineering, The City College of New York, New York, NY 10017, USA
7
Atmospheric Science Research Center, University at Albany, Albany, NY 12222, USA
*
Authors to whom correspondence should be addressed.
Atmosphere 2023, 14(6), 999; https://doi.org/10.3390/atmos14060999
Submission received: 9 April 2023 / Revised: 6 June 2023 / Accepted: 7 June 2023 / Published: 9 June 2023

Abstract

:
Sea surface temperatures and vertical wind shear are essential to tropical cyclone formation. TCs need warm SSTs and low shear for genesis. Increasing SSTs and decreasing VWS influences storm development. This work analyzes SST and VWS trends for the Caribbean, surrounding region, and the Atlantic hurricane main developing region from 1982–2020. Storm intensity increases significantly during this period. Annual and seasonal trends show that regional SSTs in the MDR are warming annually at 0.0219 °C yr−1 and, per season, 0.0280 °C yr−1. Simultaneously, VWS decreases during the late rainfall season, at 0.056 m/s yr−1 in the MDR and 0.0167 m/s yr−1 in the Caribbean and surrounding area. The Atlantic Warm Pool is expanding at 0.51 km2 per decade, increasing upper atmospheric winds and driving VWS changes. Correlations of large-area averages do not show significant relationships between TC intensity, frequency, and SSTs/VWS during the LRS. The observed changes appear to be associated with regional warming SSTs impacting TC changes. Plain Language Abstract: Tropical cyclone (TC) formation requires warm ocean waters and low wind shear. Changes to sea surface anomalies and wind shear influences are essential to understanding storm development and intensification. The ability to forecast storm changes is vital to human lives and livelihoods. This work analyzes sea surface temperatures (SSTs) and vertical wind shear (VWS) trends in the Caribbean, surrounding areas, and the Atlantic main developing region (MDR). We found increasing SSTs, decreasing wind shears, an expanding Atlantic Warm Pool (AWP), and increased storm intensity during the Atlantic hurricane season.

1. Introduction

Sea surface temperatures (SSTs) in the mid-Atlantic and the Caribbean have steadily increased for several decades [1,2,3]. Mid-Atlantic SSTs are warming faster during the late rainfall season (LRS, August to November) than any other season (dry season, December to March, and early rainfall season, April to July), with temperatures reaching 26.5 °C and higher, which is the threshold considered for deep convection [4,5]. Upward trends in the Atlantic SSTs may intensify tropical cyclonic (TC) activity, posing more significant risks to coastal communities. Research shows that storms in the North Atlantic have increased in frequency and intensity since the 1980s [6]. Additionally, the Caribbean and the U.S. have experienced increasingly intense hurricanes recently; these are potentially linked to increasing SSTs [7]. More than 80% of Atlantic TC systems that turn into major hurricanes are formed within the main developing region (MDR, 10–20° N, 20–80° W), where TCs are primarily formed from easterly waves originating in Western Africa [8]. In their most recent work, Chand et al. [9] found that global tropical cyclones have decreased by 13%, except for North Atlantic storms. Thus, understanding the connection between a changing climate and the TCs frequency and intensification trends in this region is particularly important.
Previous studies have analyzed the role of various environmental factors in major hurricane activity in the MDR. Taylor and Stephenson note warmer SSTs around the Caribbean, exceeding temperatures of 29.5 °C, highlighting the expansion of the Atlantic Warm Pool (AWP), while stating that the swing into the warm phase of the AMO in the 1990s may account for some of these warming trends found in these more recent Caribbean SSTs [10]. However, Mann and Emanuel [11] showed that growing SST trends strongly correlate to MDR’s TC counts, unrelated to the Atlantic multidecadal oscillation (AMO). In contrast, Vecchi and Soden’s [12] work argued that wind shear is supposed to increase due to climate change, making it more difficult for hurricanes to form. Although previous studies of the correlations between SSTs and TC frequency and SST and deep convection have been conducted elsewhere, we have yet to find research on these topics within the MDR. Few studies have looked at the future of SST trends under a warming climate; Antuna et al. (2015) [1], using the RCP8.5 ‘business as usual’ scenario [13] and a low emission scenario, found a continuing warming SST trend in the Caribbean, 2000–2099. Furthermore, Nurse and Charley (2014) [14] analyzed two future projections scenarios for three time periods: 2000–2009, 2050–2059, and 2090–2099, similarly finding increasing SSTs across the Caribbean through the 21st century, with warming intensifying over each period. Because our oceans have a direct relationship with the atmosphere, continued research and understanding of how current trends will impact our immediate and future global climate are essential for mitigating the consequences of these changes. Additionally, an increased understanding of the mechanisms that drive changes to TC intensities can help improve global climate models and reduce systematic biases to test model validity.
Thus, this study aims to investigate the connections between recent (1982–2020) and long-term (1851–2020) SST trends, vertical wind shear (VWS) trends, and their linkages to recent observations in TC activity in the MDR, the Caribbean and the surrounding regions. While ocean–atmospheric interactions are changing and affecting TCs globally, it has yet to be fully understood if these changes are caused by naturally occurring phenomena or attributed to global warming. The thermodynamic efficiency of warm SSTs (increased rates of evaporation) and low-level wind shear are essential to TC intensity [15]. The study is a significant initial step in understanding the MDR’s connections between TCs, SSTs, and other variables in a warmer climate due to possible changes in TCs and SSTs. Understanding the vital variables responsible for these changes and how they affect TCs is also imperative in improving our ability to predict TC intensification and landfall.

2. Materials and Methods

2.1. Analytical Techniques

Climatological analyses of the study region were analyzed over 71 years, from 1950 to 2020. The first SST dataset used in this study, which focuses on the more recent trends from 1982–2020, is the NOAA’s Optimum Interpolated Sea Surface Temperature (OISST). This is a 0.25° High-Resolution Optimum Interpolation (OI) Sea Surface Temperature v2.1 dataset with a daily temporal resolution combined with the infrared satellite SST estimates in situ observation data from buoys and ships [16]. Pathfinder infrared SST is used for the earlier period, and operational satellite SST estimates are used for daily updates. The second SST dataset used in this study is the ERSST v5, used to look to the past for previous trends, 1950–2020, was derived from the International Comprehensive Ocean–Atmosphere Dataset (ICOADS). It is a monthly 2° × 2° horizontally gridded dataset that uses the NOAA Global Surface Temperature product to integrate ERSST data with land surface temperatures from the Global Historical Climatology Network Monthly dataset’s combined surface temperature analyses [17]. The NCEP/NCAR Reanalysis 1 dataset provided vertical wind shear data with monthly temporal and 2.5° × 2.5° spatial resolution. Atlantic hurricane data from this project are taken from the NOAA HURDAT2 Reanalysis project, last updated in November 2019.

2.2. Regional Analysis

SST trends for the study region were evaluated using the NOAA OISST and ERSST products. Regional values were averaged monthly and yearly to determine the temperature changes over relevant years. Linear regression and two-tailed tests were performed to assess the significance of these changes. Quadratic trends were explored; however, they did not add any new information to our findings; additionally, we found linear regressions to be a better fit. SST trends and values were later calculated seasonally for the LRS from 1950 to 2020 for ERSST (Figure 1A) and the DS (dry season), ERS (early rainfall season), and the LRS (late rainfall season), using the OISST dataset from 1982 to 2020. Similarly, annual and seasonal trend analysis and climatology for VWS over the Caribbean, the surrounding region, and the MDR were performed.
By taking the averages of our 39-year study period from both the ERSST and OISST datasets, then subtracting the difference between those averages from the ERSST dataset, we removed the systematic bias in the ERSST dataset.
This study primarily uses the NOAA OISST dataset because of its accuracy, relatively higher resolution, and consistency since 1982. Our focus is on recent (1982–2020) trends and their effect on changes to the Atlantic Warm Pool (AWP) and TC activity in the Atlantic main developing region (MDR), and how these changes, if any, are affecting the Caribbean and the surrounding areas.

2.3. Trends and Grid Analysis

A non-parametric test for trends was performed for this study because of its large and variable datasets. The Mann–Kendall (M-K) trend test was applied to regional, seasonal averages, and gridded analyses for annual, DS, ERS, and LRS from the OISST dataset. To observe SST and VWS trends annually and seasonally, the trends (slope) and associated significance (p-values) for SSTs (Figure 1B) and VWS from 1982 to 2020 throughout the study region were calculated. If the calculated p-values were less than 0.05 (95% confidence level), trends were considered statistically significant.

2.4. Correlations

The correlation coefficient is used to evaluate the strength of a relationship between variables. Using the OISST dataset, the Pearson correlation coefficient (PCC) test was used for this study; values between 0.7 and 0.9 are usually highly correlated for these time series. In contrast, values between 0.5 and 0.7 are moderately correlated, and less than 0.4 indicates a weak correlation. Correlation analyses were performed between SST and the AMO, SST, and VWS, and the hurricane counts and intensity during the LRS for the Caribbean, surrounding region, and MDR. Each correlation was tested for statistical significance at the 95% test level.

2.5. Hurricane Count and Intensity

The Saffir–Simpson hurricane wind scale was used to analyze hurricane strength for hurricane analysis. The scale is used to classify tropical cyclones in the Western Hemisphere that exceed the intensity of a tropical depression. Storms are assigned one of five categories (1–5) distinguished by the intensities of their sustained winds. Hurricane intensity and frequency changes during the LRS were investigated over 150 years (1851–2020) for the Caribbean, the surrounding region, and the MDR.

2.6. Atlantic Warm Pool

The multidecadal variability of TC activity in the North Atlantic has often been linked to the Atlantic Multidecadal Oscillation (AMO). The AMO produces variations in SST in higher latitudes in the North Atlantic, and in lower latitudes in the Atlantic Warm Pool (AWP) [18]. The AWP has SST above 28.5 °C, and extends through the Gulf of Mexico, the Caribbean Sea, and the western tropical North Atlantic [19], reaching its maximum size during the LRS. Its size and intensity correlate with the amount of rainfall the Caribbean and surrounding regions experience during the LRS [2]. Given that the AWP is in the path of TC activity, it is plausible that changes in TC activity could be related to AWP variability. Low-latitude SSTs play a vital role in hurricane activity, suggesting that the AWP links the AMO and Atlantic hurricane activity [18]. Previous studies have indicated that the AMO can contribute to TC variations; however, other factors, such as seasonality and global warming, should be considered and may be more critical. This study aims to identify whether the AWP changes in magnitude and extent over time during the LRS.

3. Results

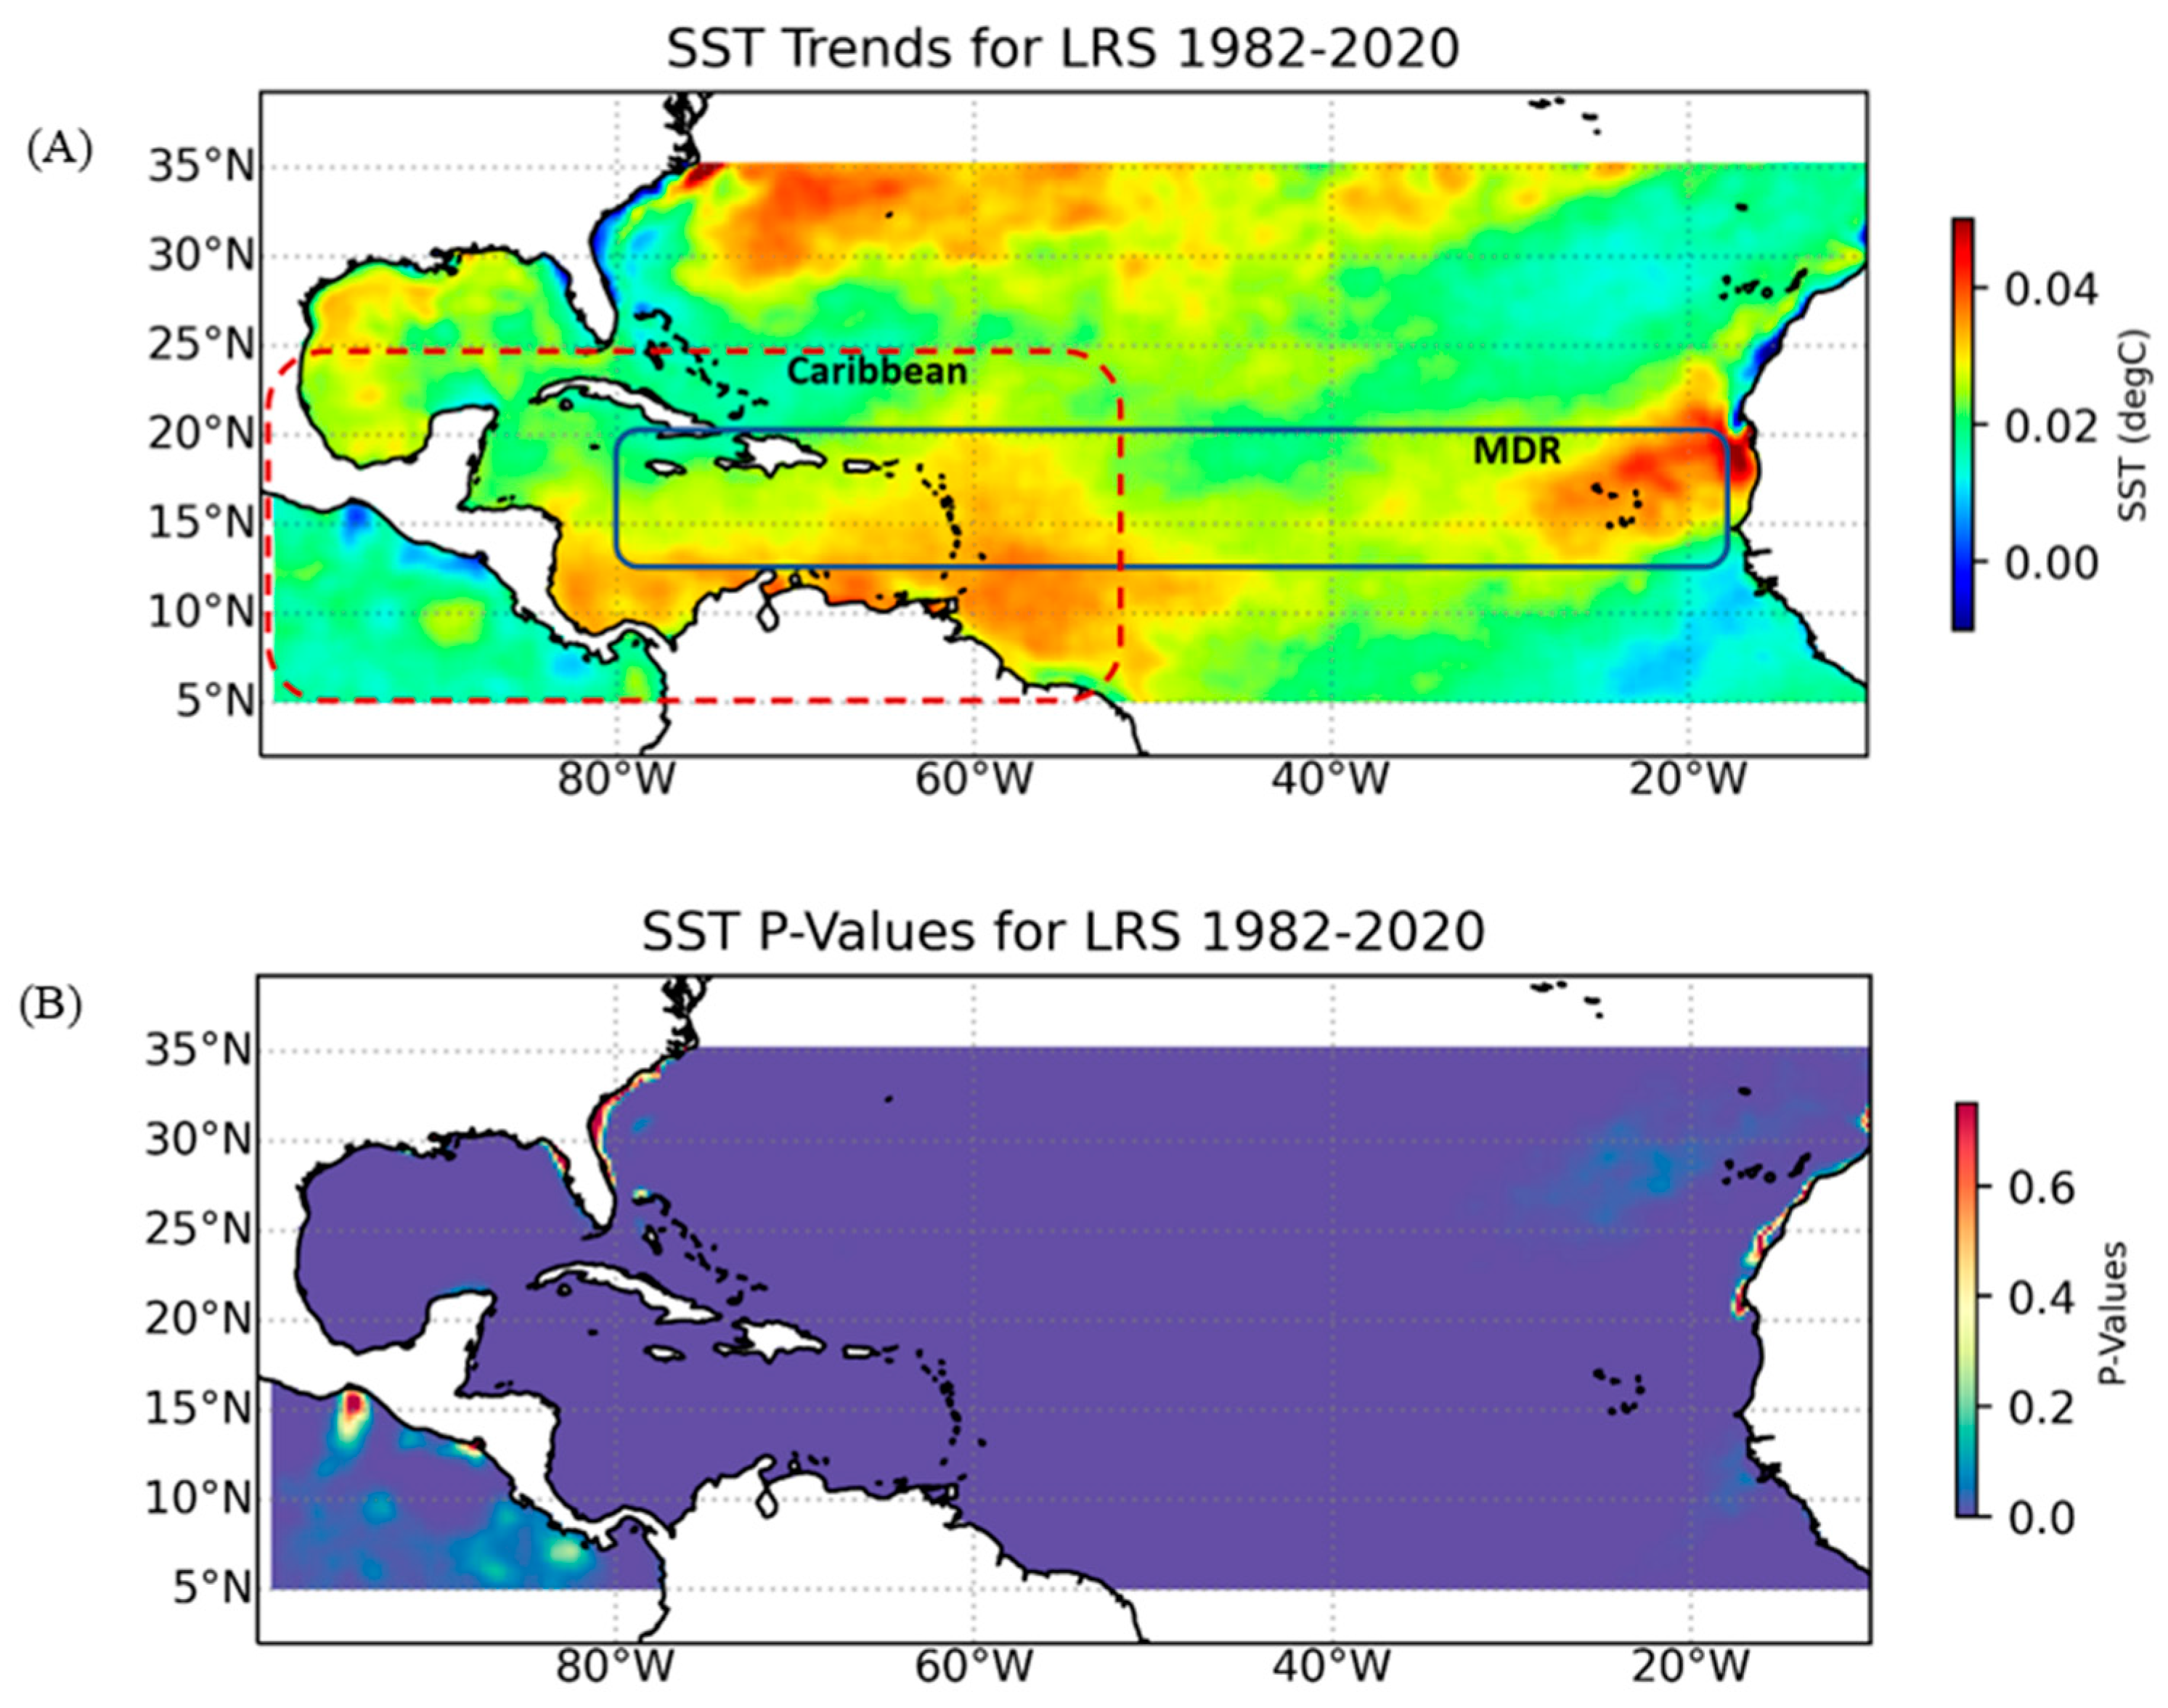
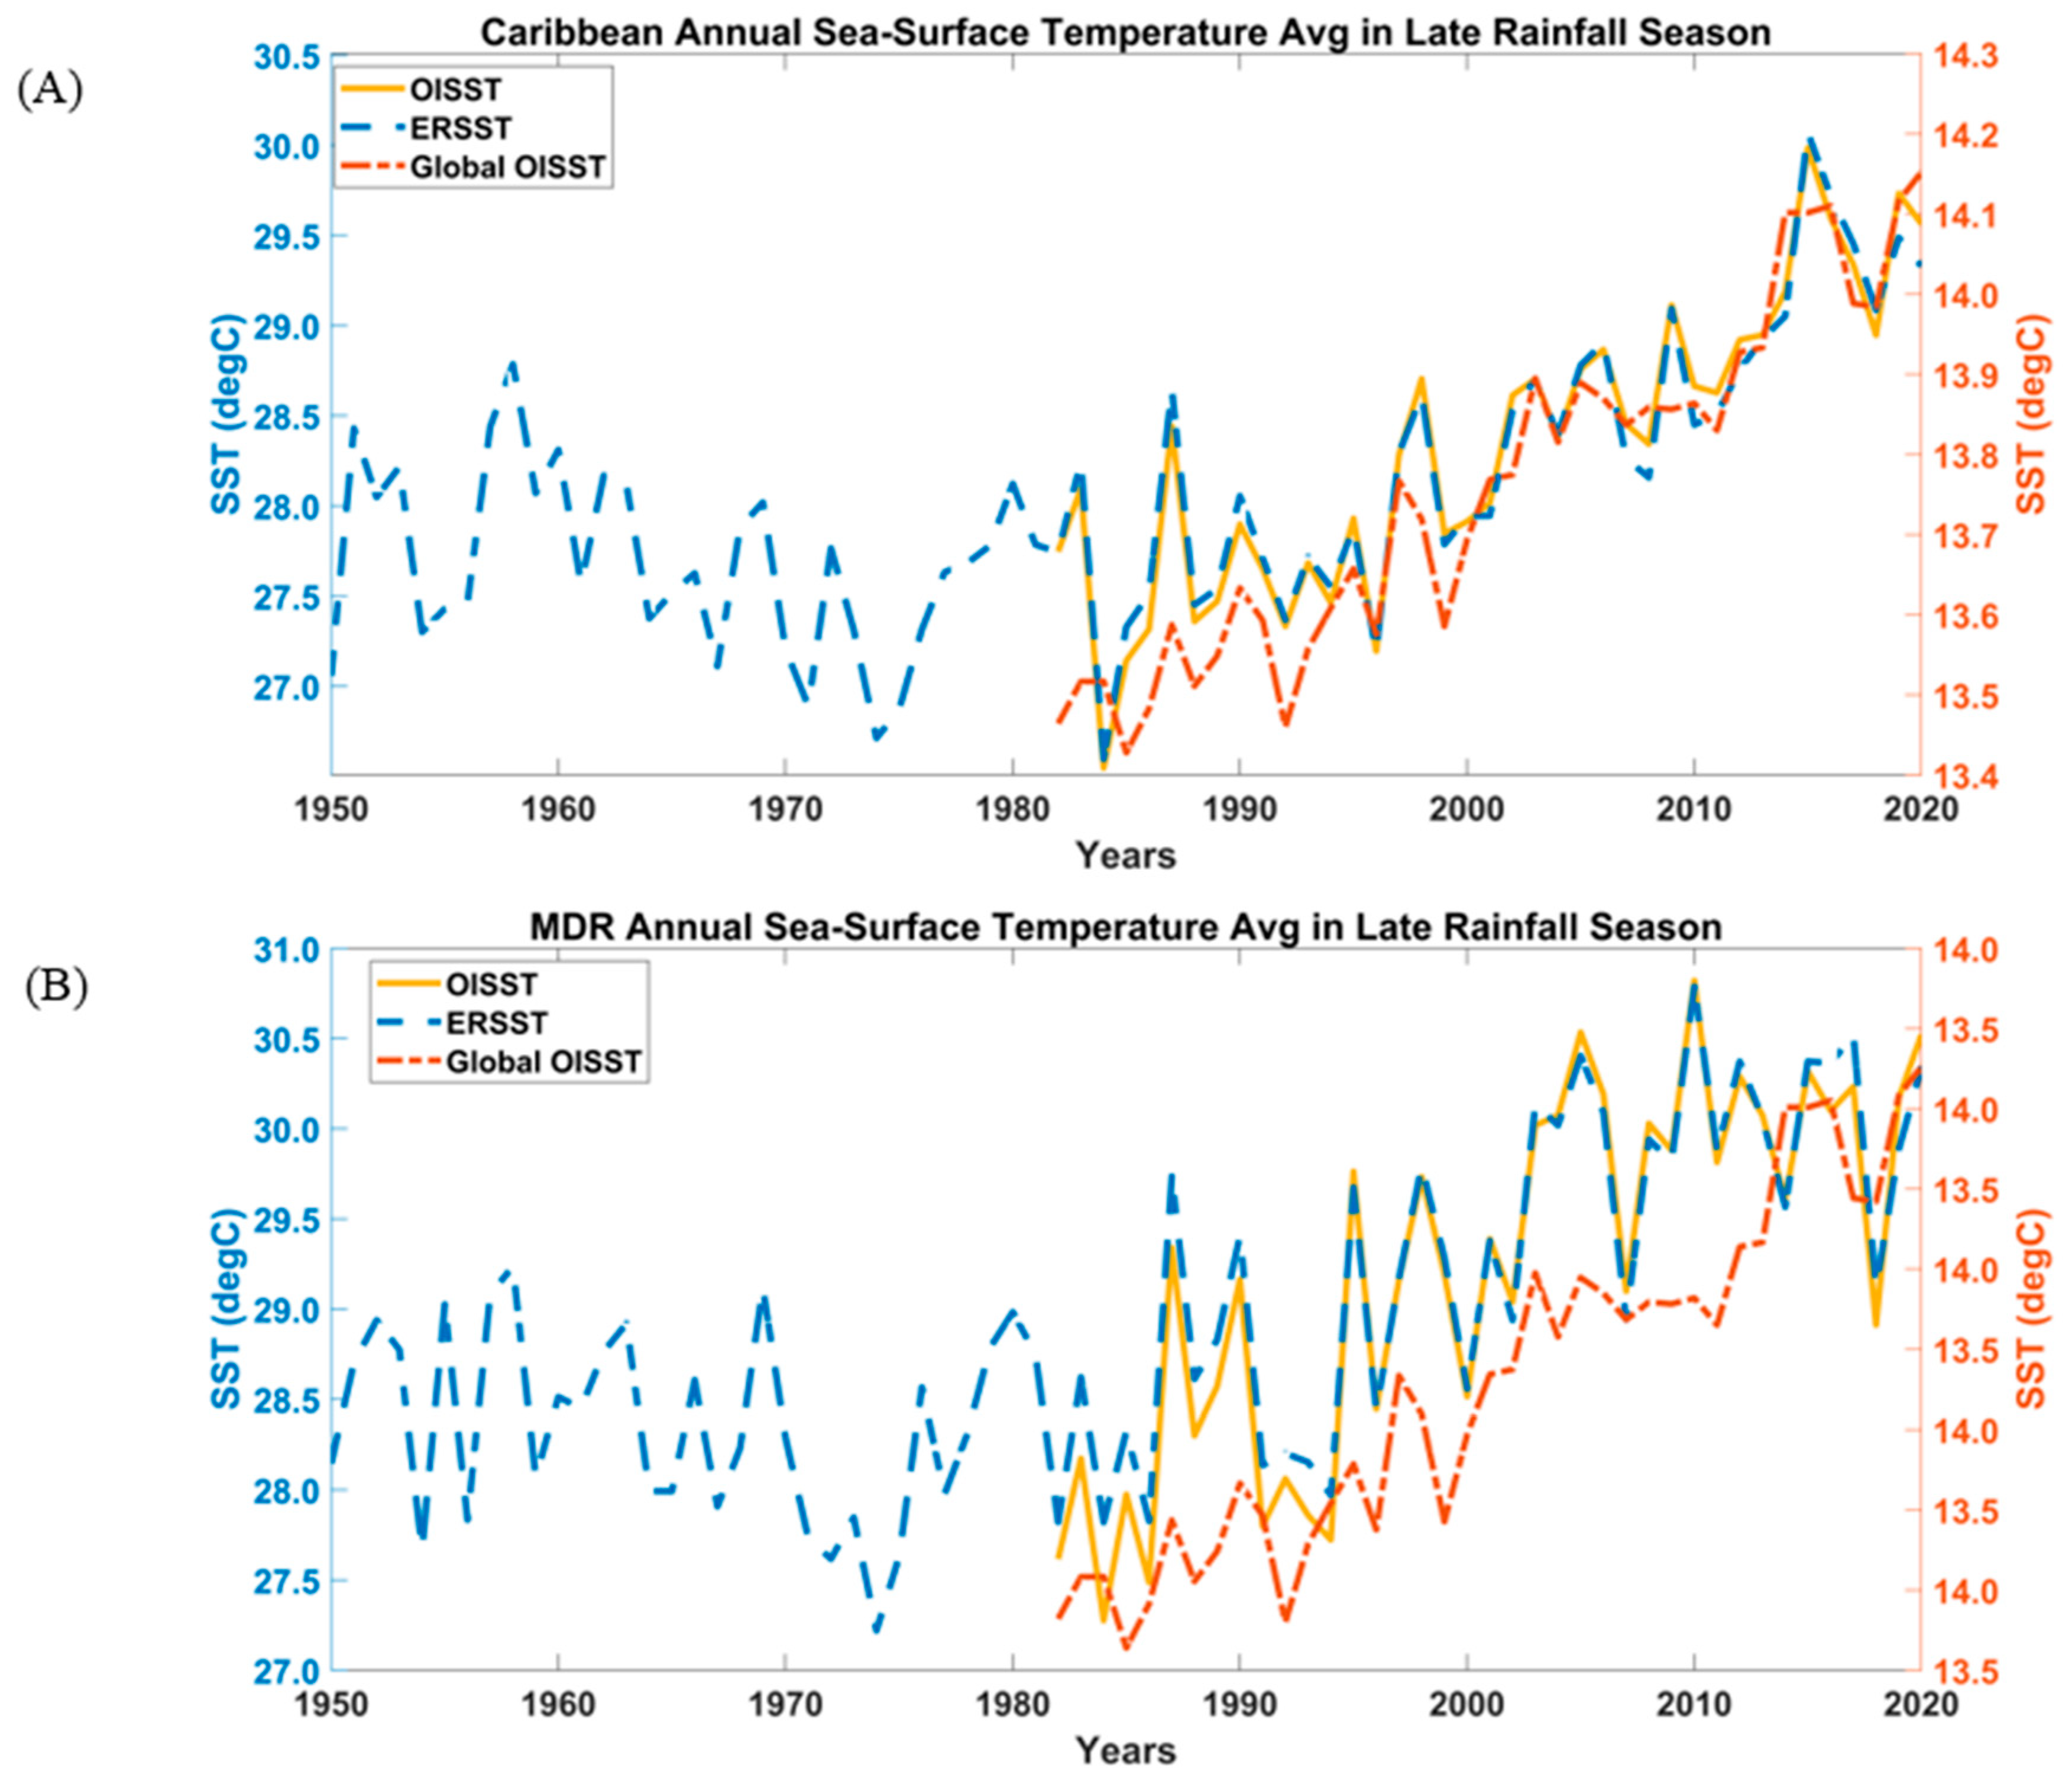
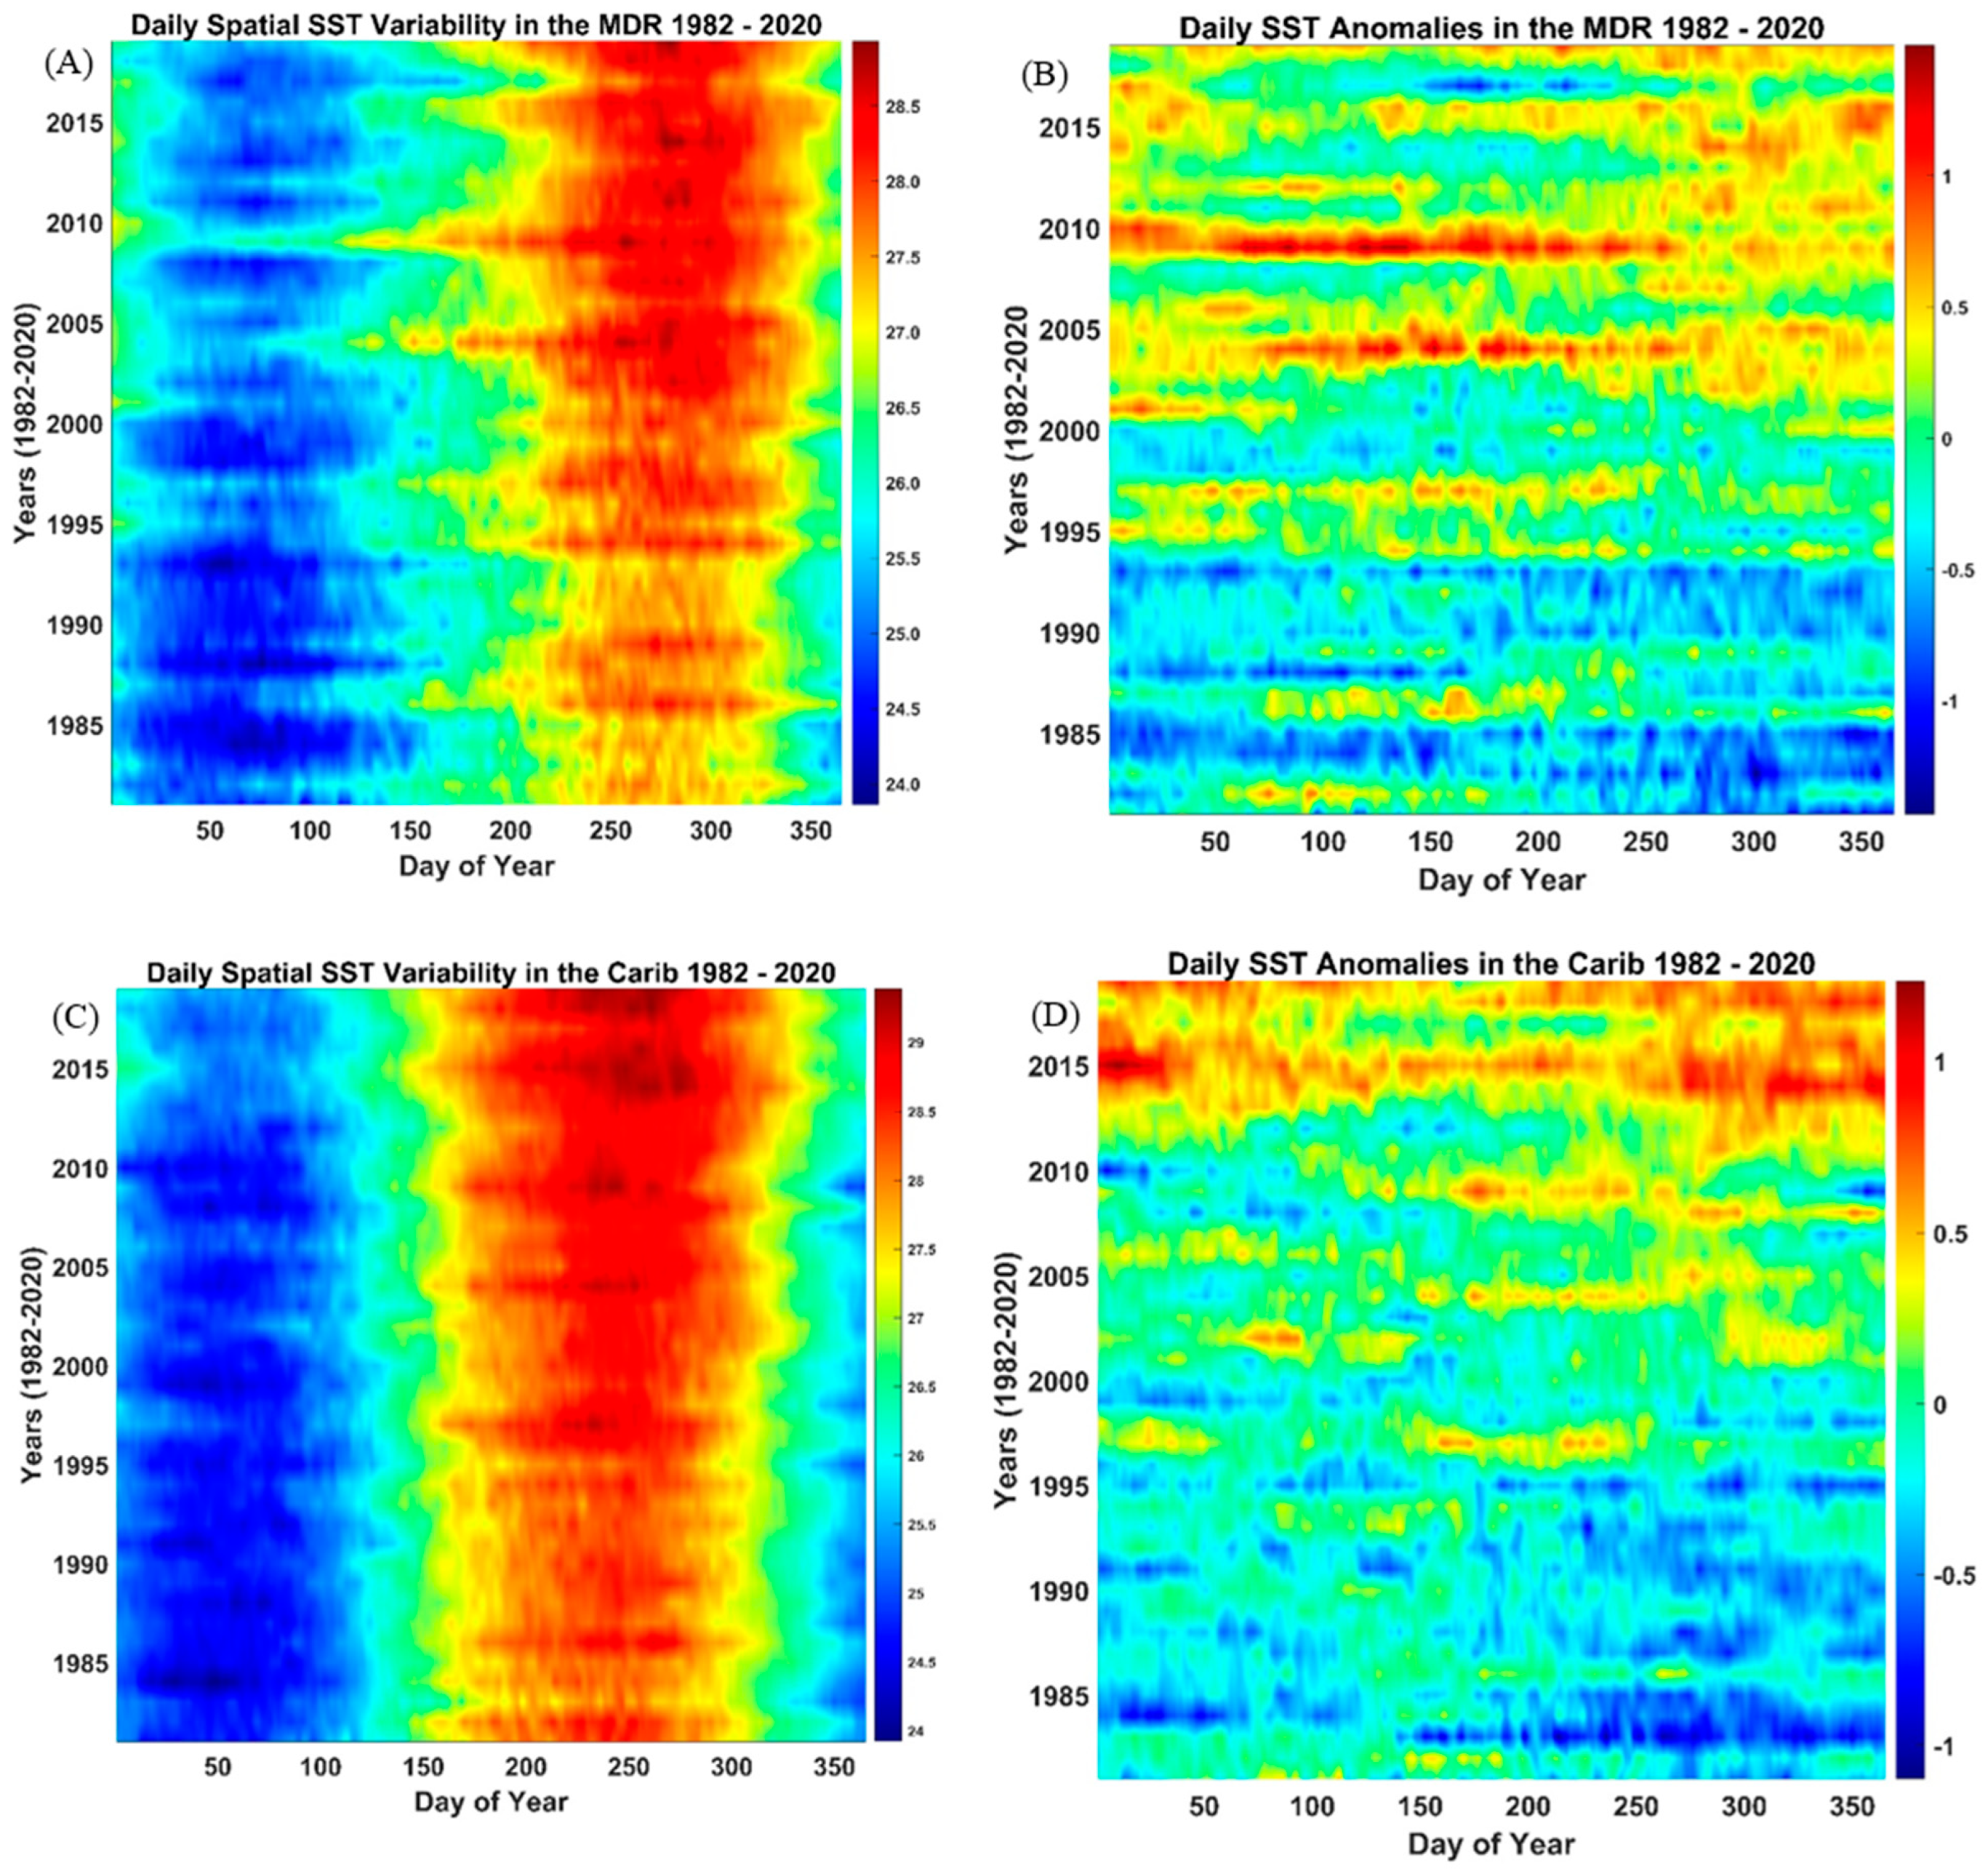
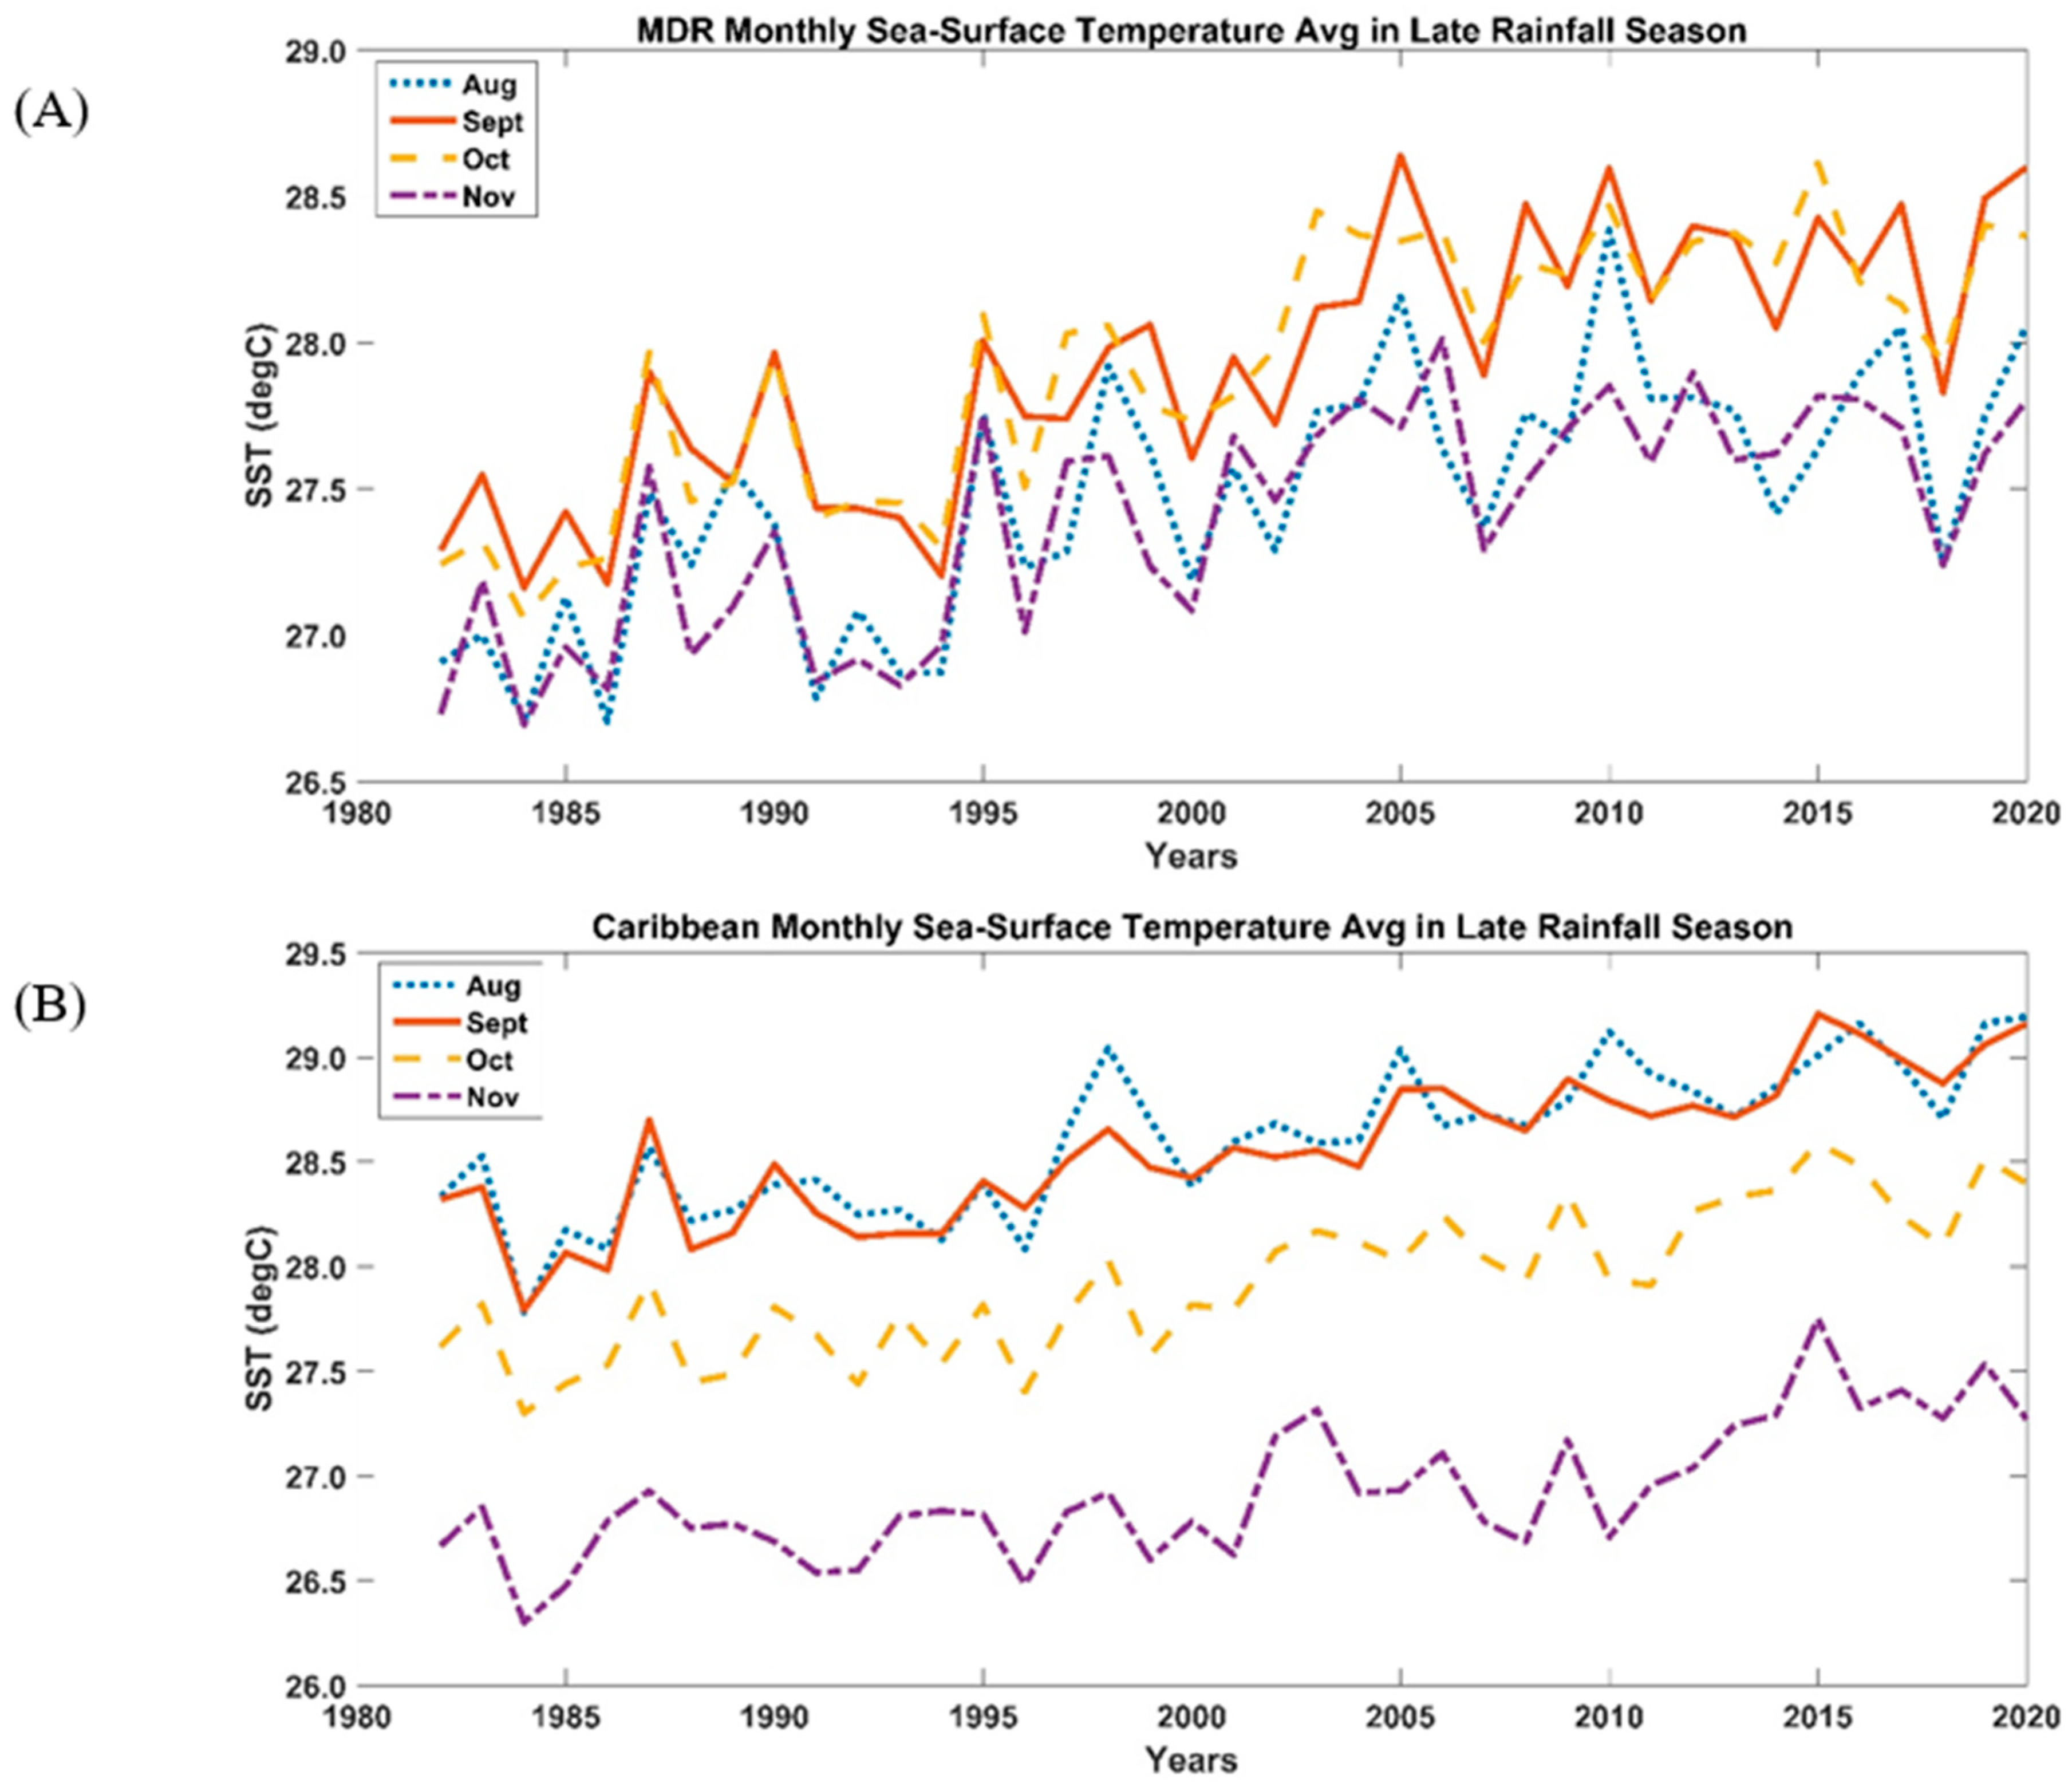
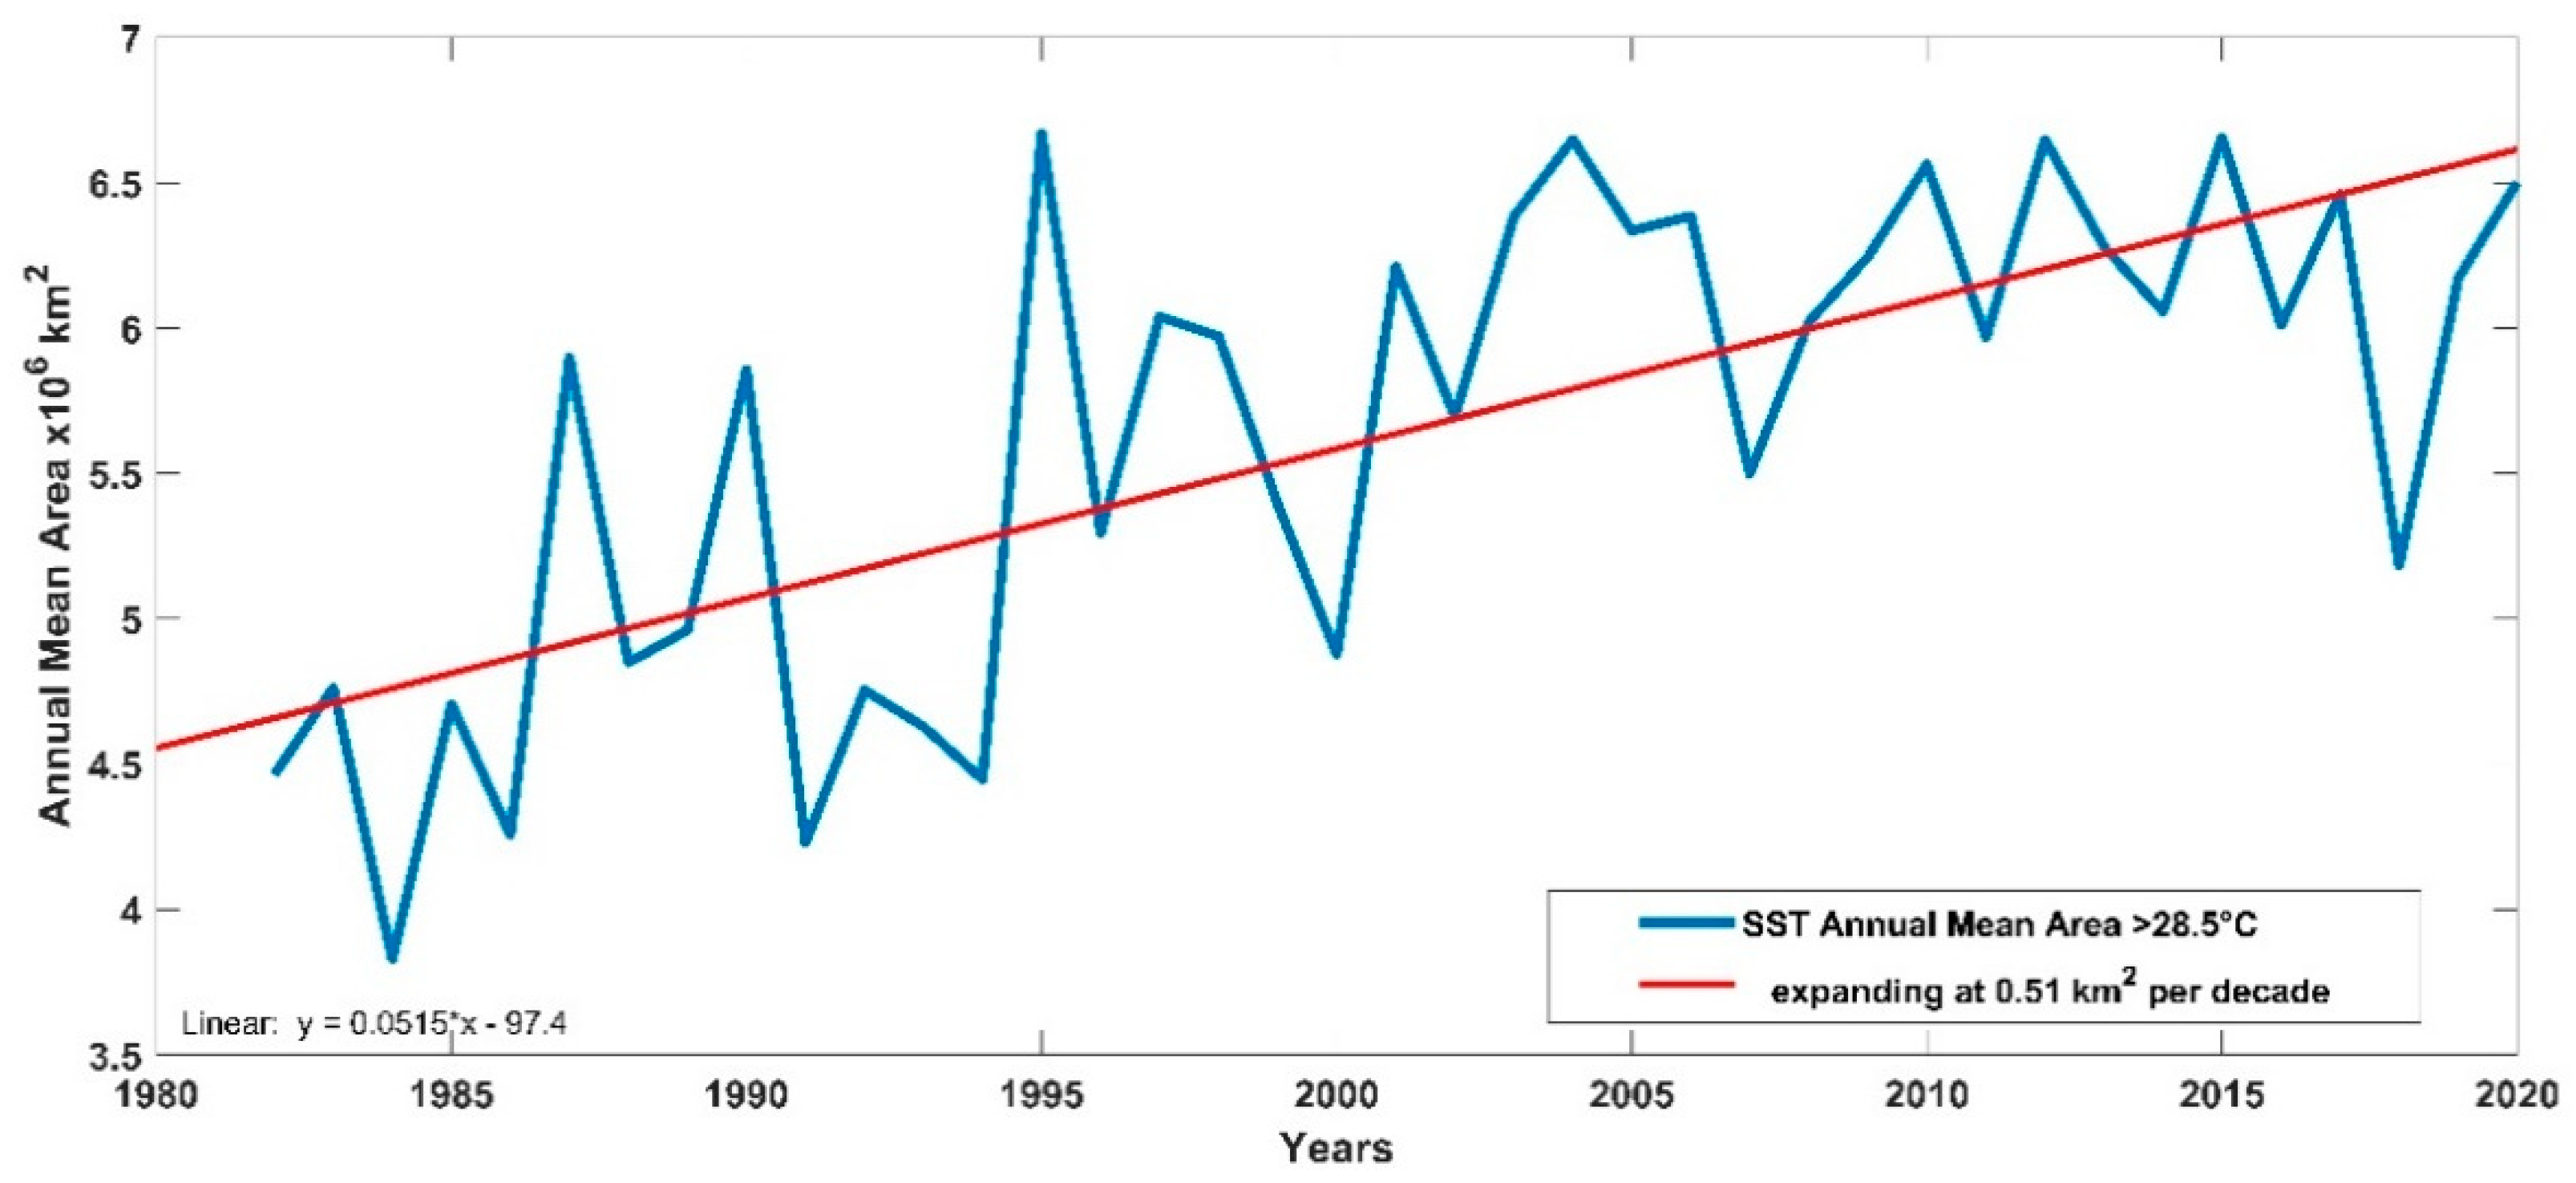
3.1. Observations of Sea Surface Temperatures and the Atlantic Warm Pool Trends

SST analysis shows statistically significant increasing annual trends during the LRS (Figure 2), which are consistent with the reports of Glenn et al. [2] in 2015. The MDR temperatures rise at 0.28 °C/decade and 0.24 °C/decade in the Caribbean and the surrounding area (Figure 2). Both are significant at the 95% confidence level. Warming is most consistent during the LRS and most notably during the latter half of the study period, indicating an evident shift in warmer SSTs over time. SSTs have been anomalously warm since 1995 in the MDR, and around 1998 in the Caribbean region, as shown in Figure 3. In addition to annual averages and trends, daily averages and anomalies were calculated for both study areas. Observation of daily anomalies shows an increase in SSTs during the LRS over the past 25 to 27 years. Observing daily averages and anomalies allowed us to see those shifts from cooler to warmer SSTs taking place in the latter half of the study period (1995–2020).
Additionally, it is evident that the warmer SST trend began to occur more consistently after 1995; however, in or around 2000 for the MDR and near or around 1999 for the Caribbean and the surrounding region, we begin to observe more days above the convection threshold (26.5 °C), Figure 3. An expanded analysis of annual SST trends using the ERSST dataset (Figure 2) shows consistently increasing SST trends dating back to the 1950s. However, a period during the 1970s indicated notably lower SSTs, which could be attributed to slight global cooling due to increased anthropogenic forcing [20]. Furthermore, an annual analysis of global SST trends such as those during the LRS (Figure 2) indicates the global signal manifesting in these climate-sensitive regions, while suggesting that these changes could be attributed to global warming.
Further examination of the individual months during the LRS (Figure 4) shows that monthly average SSTs are cooler at the beginning of the season (August in the MDR) and are much warmer later (September to October in the MDR). October has notably warmer SSTs. Interestingly, October SSTs are about the same as or are warmer than September SSTs in the MDR. Though not the same for the Caribbean and surrounding region, overall, trends in monthly SSTs indicate that October stays warmer, and temperatures are increasing over time.
Further analysis shows that SSTs have not only increased but are spreading regionally. Analysis shows that the area of SSTs greater than 28.5 °C has increased over time (Figure 5). An investigation during the LRS from 1982 to 2020 showed an expansion of the warming area. A grid-based study of the Atlantic Warm Pool (AWP), the area with temperatures at or above 28.5 °C, which reaches its maximum during the LRS [19], showed that it is increasing in extent and magnitude, at a rate of 0.51 km2 per decade. Simultaneously, VWS trends decrease in the MDR (Figure 6 and Figure 7), consistent with the AWP-induced atmospheric changes related to tropospheric vertical wind shear and the thermodynamic parameter of convective instability.
With these notable changes occurring with SSTs, and examining their influence on tropical cyclone activities, we must analyze both the naturally and unnaturally occurring phenomena that may be responsible. Although the Atlantic multidecadal oscillation (AMO) has shifted to its warm phase during our observations, the amplitude of these warmer SSTs may be influenced by global warming. Mann and Emanuel [11] found that the AMO does not appear to play a role in changes in tropical cyclone activities dating back to the 19th century. Instead, the underlying factors appear to be anthropogenically forced large-scale warming, and 20th-century anthropogenic tropospheric aerosol forcing. After observing the AMO, global, and regional SST trends in the intra-Americas region (IAR) region, Glenn et al. [2] found that even after the AMO shifted from a cold to warm phase during their 31-year study period (similar to ours), IAR SSTs continued to follow global trends. Consistent with our findings, SSTs in the region are consistently increasing. Statistically significant relationships have been found between Atlantic hurricane frequency and large-scale circulation features, including SSTs [21]. Observations of changes to Atlantic TCs and SSTs suggest that SSTs may be the primary driver of Atlantic TC activities.

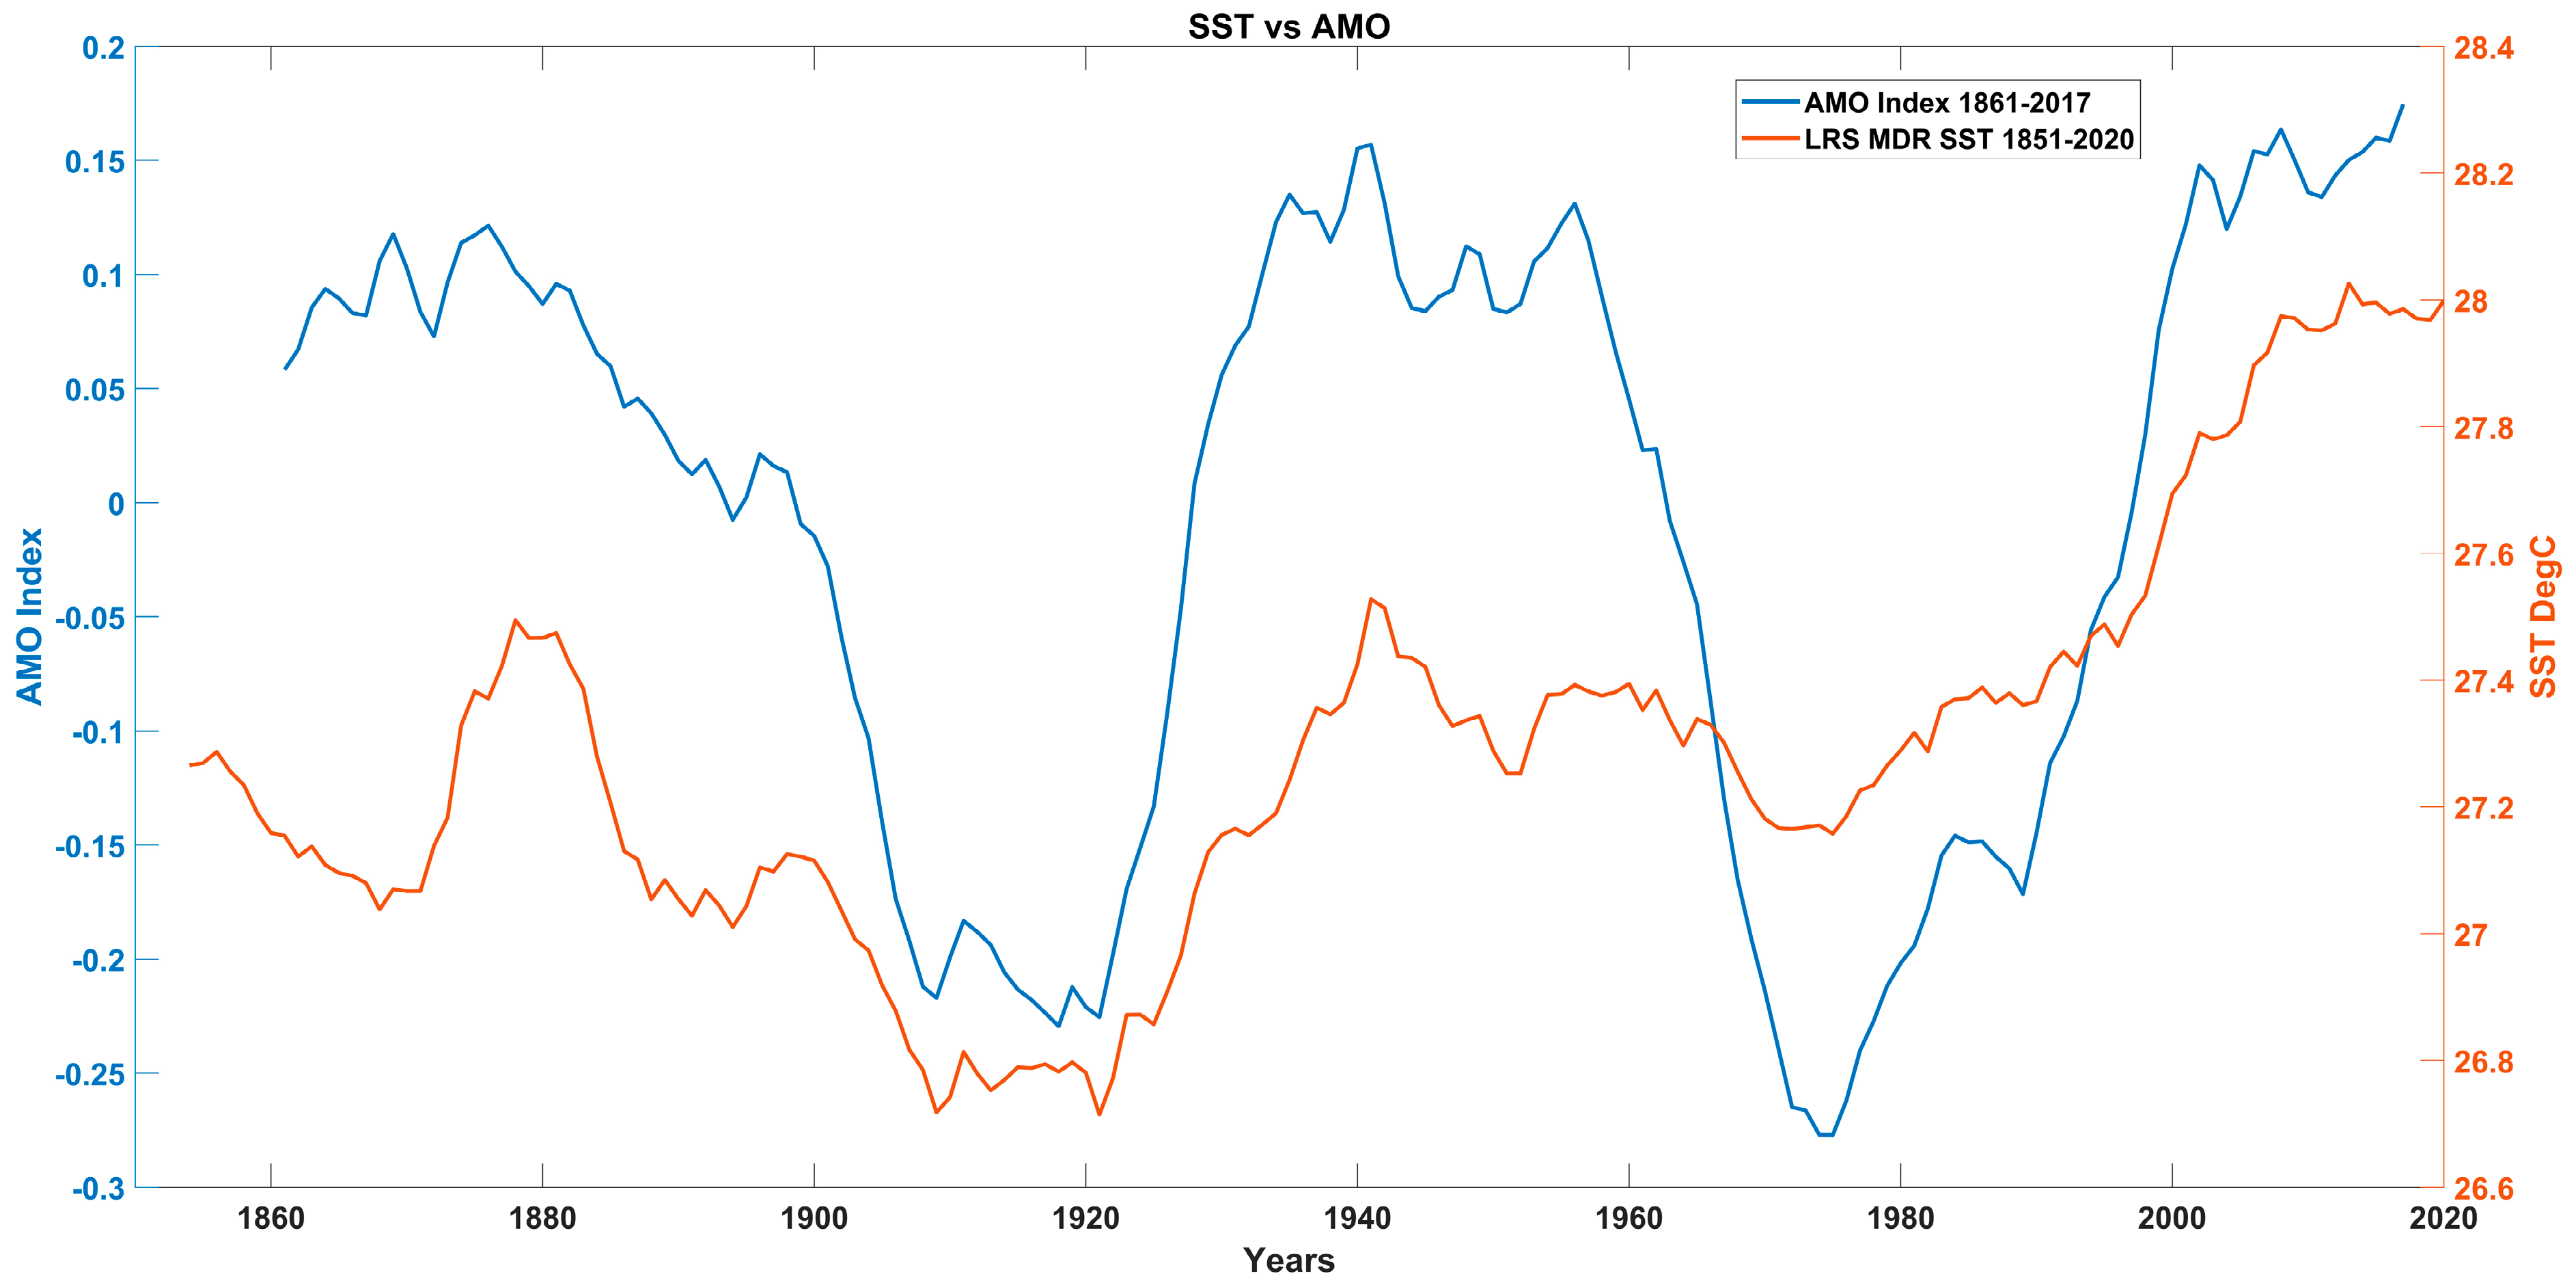
3.2. SST and the Atlantic Multidecadal Oscillation (AMO)

For this analysis, we took a longer SST record, using the NOAA ERSST dataset dating back to 1851, to correlate better with the AMO index dating back to 1861, as shown in Figure 8. The AMO index is calculated using the Kaplan SST dataset, computing the average SSTs north of the equator 0–70 N, detrended, and then smoothed with a 121-month smoother [22]. We averaged only the LRS and calculated a 10-year running average to better observe relationships, if any, to the AMO. Similarly, to Mann and Emanuel [10], our observation of the LRS SSTs in the MDR and the AMO indicated a relationship. However, other factors must also influence Atlantic SST changes. The correlation suggests that the AMO explains about 36% of the SST variance, and to describe the bulk of the variance requires a combination of factors linearly independent of the AMO. We conclude that the AMO is not the primary driver of warming Atlantic SSTs and may not be a significant cause of Atlantic TC changes.

3.3. Examination of Hurricane Frequency and Intensity

Recently, 2020 has surpassed 2005 as the most active season on record, though 2005 still holds the record for the most recent hurricanes. According to NOAA, the 2021 Atlantic hurricane season was the 6th consecutive above-average season, and although 2022 did not follow suit, three hurricanes made landfall on the U.S. mainland. Hurricane Ian is one of these and is the 5th strongest hurricane to make U.S. landfall.
Using the most current storm tracking systems, this study examined hurricane counts over the 39 years of our study period. Additionally, storm counts from the past 130 years were included to place the more recent period into the historical context. Therefore, we could agree on the low reliability of long-term hurricane records pre-1965. Consequently, we are more focused on the more recent study period. The 39-year study period counts were separated and normalized into two parts, before and after 1995, due to the warm shift in SSTs (Figure 9). Observing the respective months allows us to identify when the most notable changes occur. August and September, with warmer SSTs, show substantial differences in hurricane counts and intensity. There were no August Category 4 storms before 1995, but there have been ten after. In September, there were eight Category 1 and 2 storms before 1995. The storm count increased by eleven, and the Category 3 storm count increased by thirteen after 1995. October presents a striking increase in storm counts, with more Category 5 storms after 1995 than any other month during the LRS, Figure 9. Storm count observations from 1851 to 1981 show more HU storms than MHs. Consistent with Vecchi et al. [23] storm frequency and intensity show a short-term trend, and there were fewer storms in the mid-to-late 20th century. However, storm frequency and intensity have increased more recently (1982–2020), with no increase in lower-intensity storms and an increasing number of high-intensity storms. This is consistent with similar findings from other studies by Emanuel, 2008 [24], Knutson et al. [25], and Kossin et al. [26].
Hurricanes become more intense during the latter half of the season, specifically in September. October storms have increased in frequency and intensity, notably after 1995. In a 15-year running average of hurricane counts from 1851–2020, as depicted in Figure 10, there are no clear trends over the first 130 years for weaker storms. However, major hurricanes (MHs) are becoming more frequent. Additionally, observations of the current 39-year period indicate upward increases in counts of both low and high-intensity storms (Figure 10).

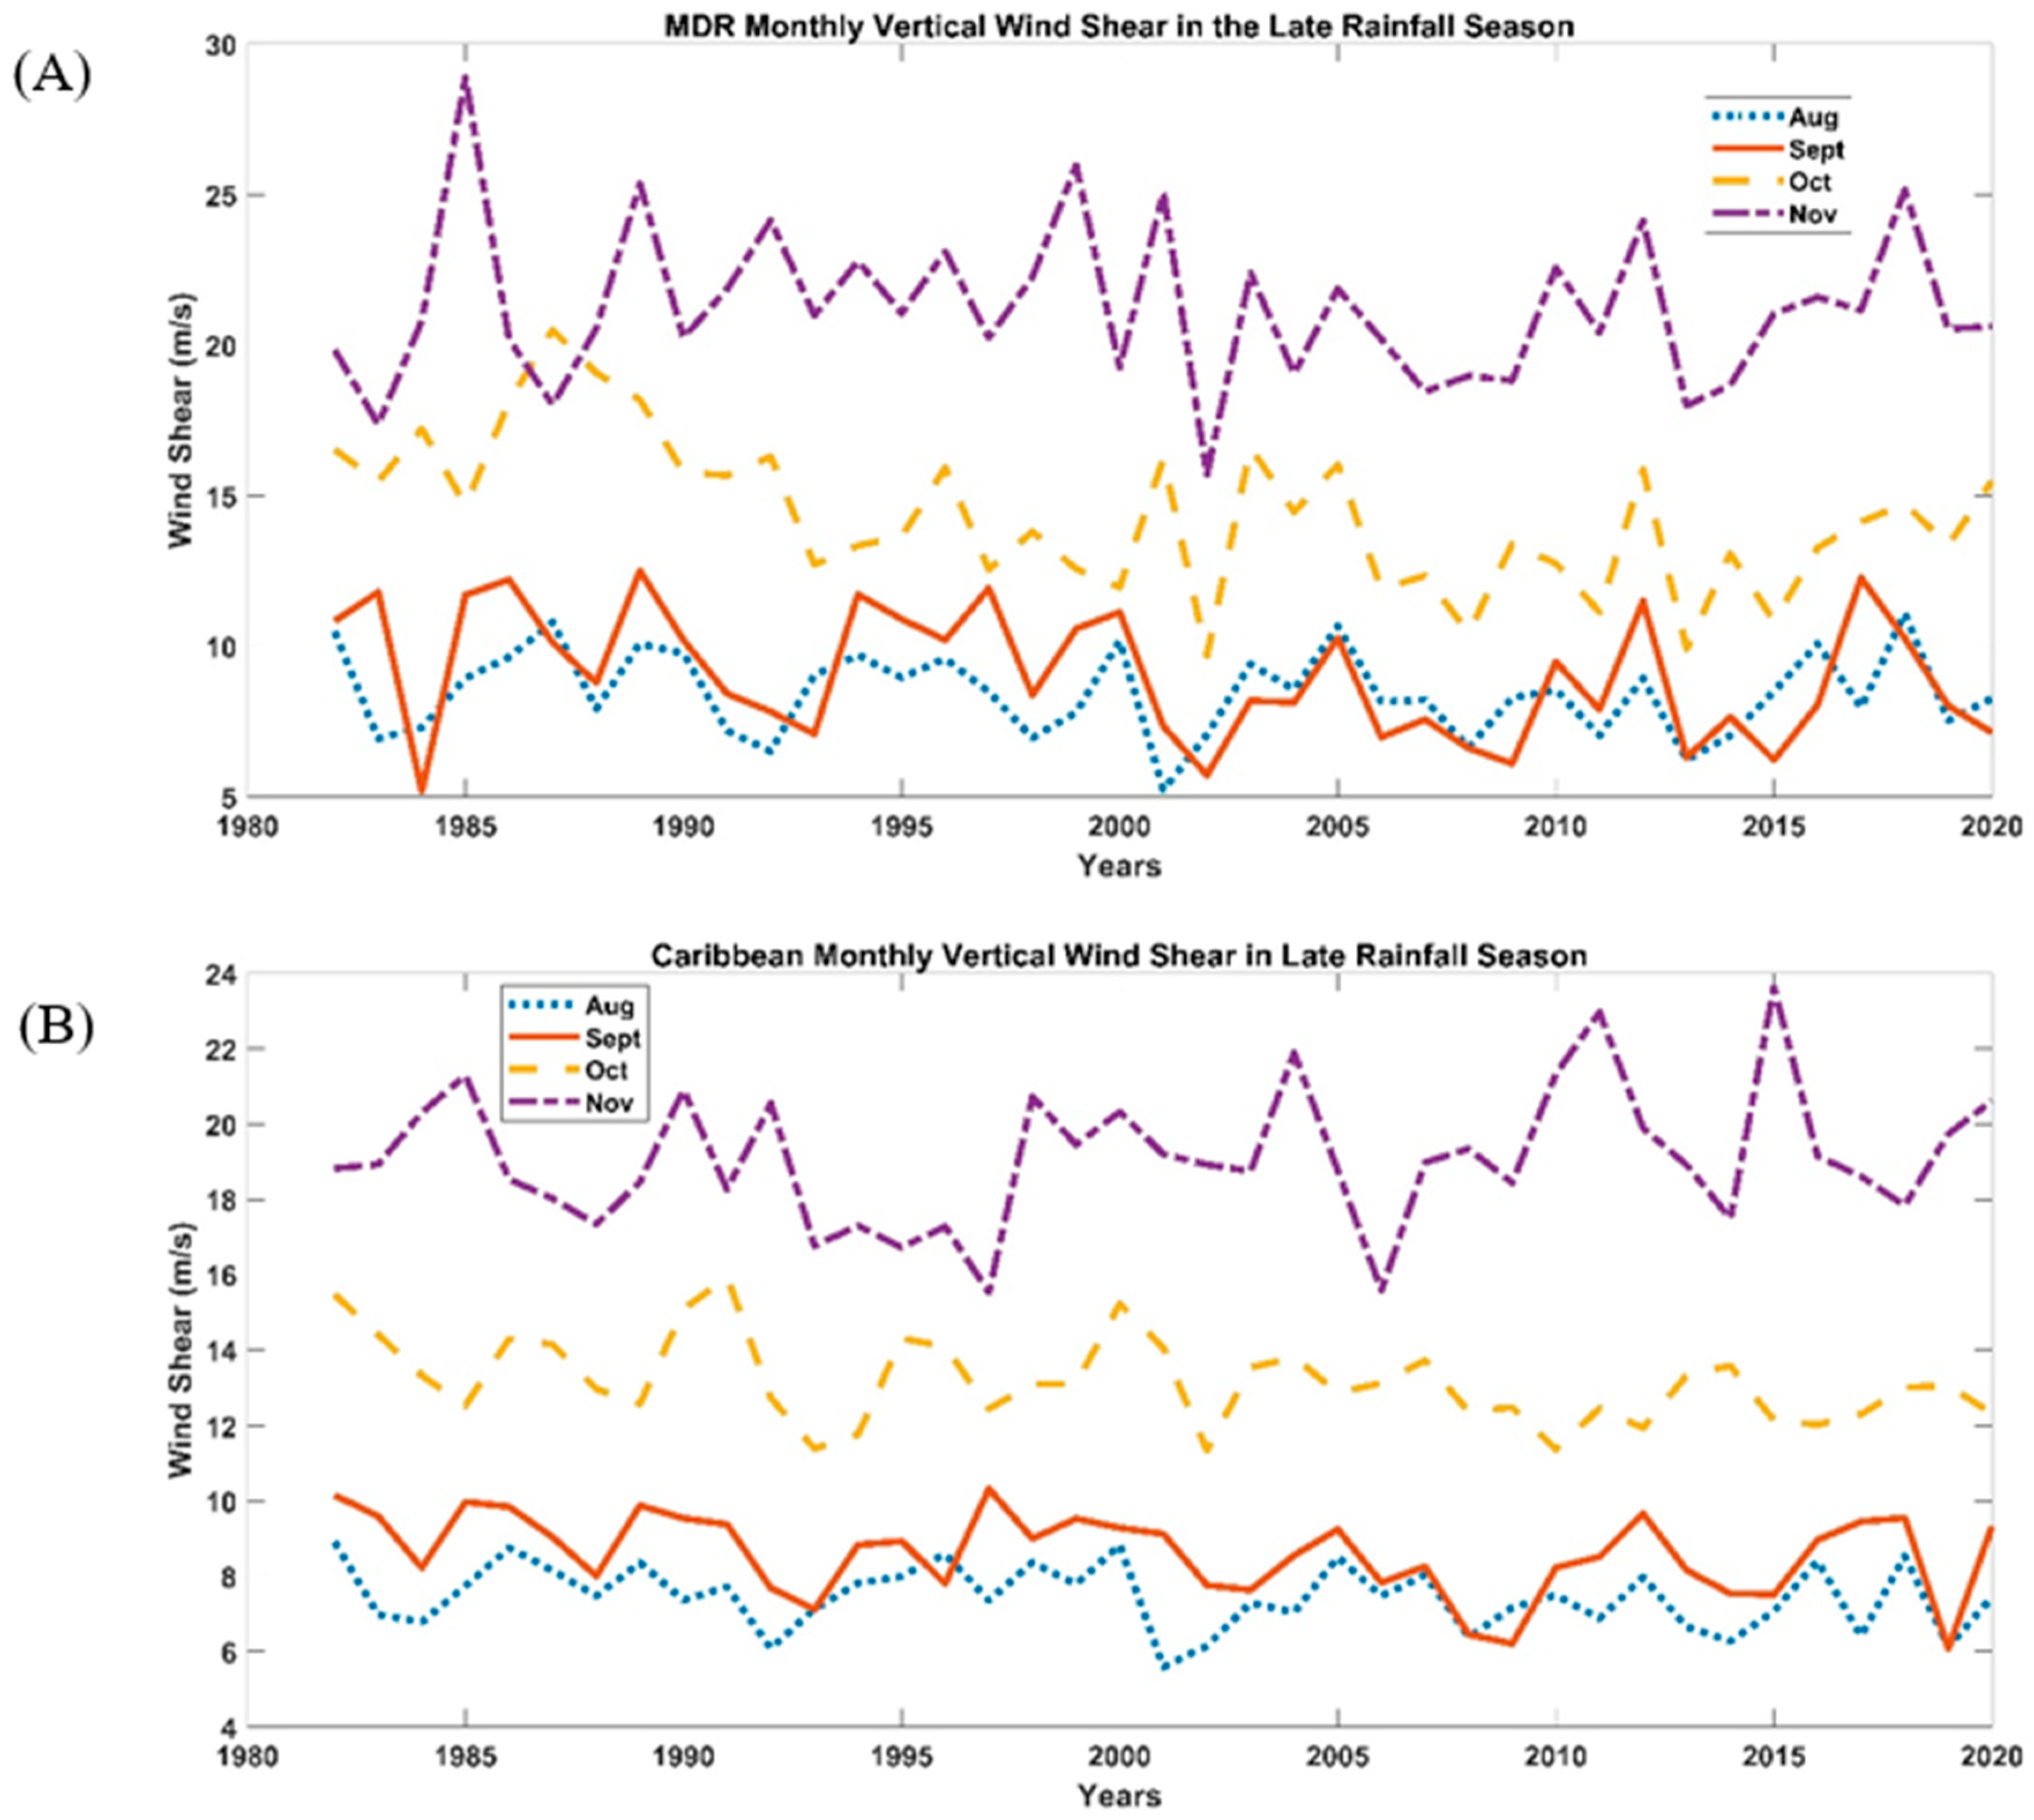
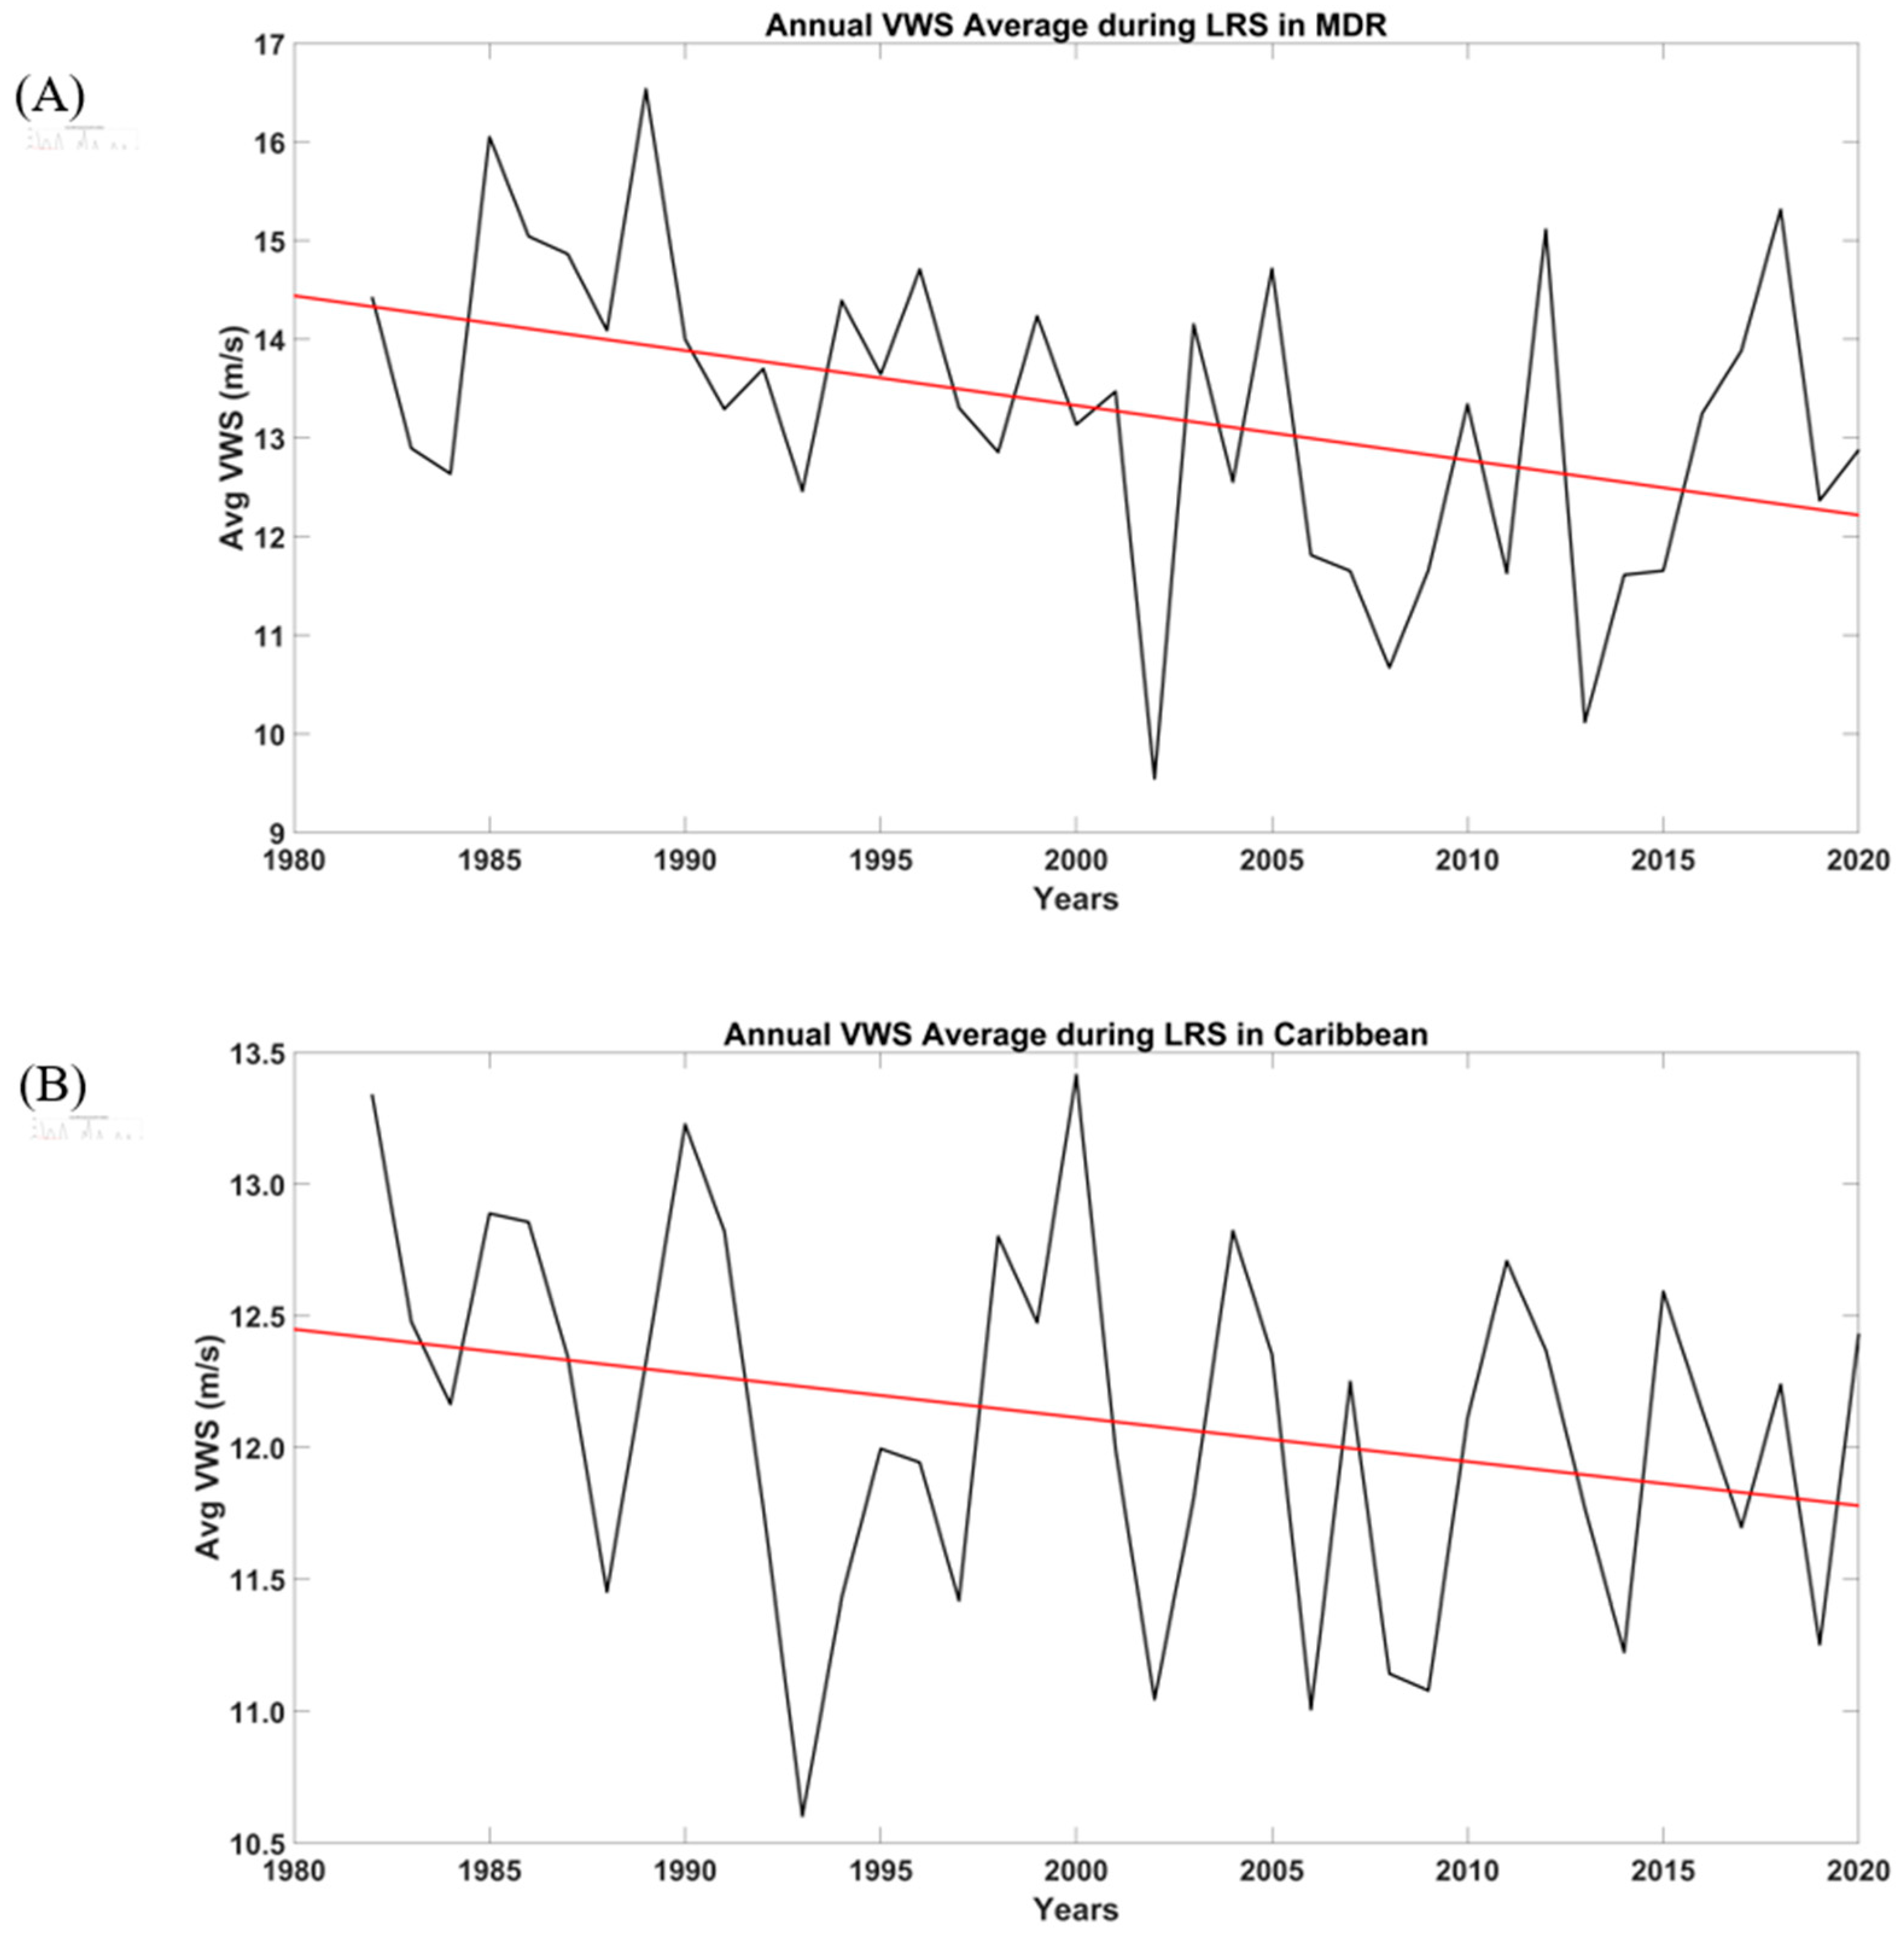
3.4. Correlations and Vertical Wind Shear

Table 1 summarizes the LRS correlation of TC intensity with SST and VWS in the study region. The relationship between SSTs and wind speed has been explored for decades [27,28,29]. The negative relationship between SST and wind speed is due to increased wind speeds cooling surface ocean temperatures through vertical mixing and enhanced evaporation. Wang et al. [30] found that increasing surface wind speed produces more evaporation, leading to cooler SSTs, causing the surface wind speed to rise further and vice versa. However, a study by Xie [31] indicated that the relationship between SST and wind speed could be positively correlated in small-scale regions, showing that surface winds may be higher locally over warmer waters [32]. VWS trends are decreasing in the MDR at a rate of 0.056 ms−1 per year, and a rate of 0.0167 ms−1 per year in the Caribbean and the surrounding area.
Further analysis of VWS winds and components shows that winds in the upper atmosphere are driving VWS changes; these changes could be associated with the expansion of the Hadley Cell [33]. With increased SST warming and the growth of the AWP and low VWS in the region, TC development has increasingly been favored.
Furthermore, observing VWS for individual months (Figure 6) shows that shears in June/July are stable with no notable changes, while August and September show more favorable shear values for TC development. October shears are higher than those in August/September but are steadily decreasing. Our findings are consistent with those of Mann and Emanuel [11] in that shear changes do not seem large enough to explain TC changes. Simultaneously, VWS is a critical variable in TC formation and intensification; previous works have examined how detrimental VWS is to TC formation and intensification [34,35,36]. One understanding is that VWS hinders genesis and intensification by transferring the heat and moisture away from the center of the storm, in turn inhibiting its development [34,37]. Other hypotheses, such as convective downdrafts by Powell [38] and “stabilization caused by mid-level warming that increases static stability and reduces convective activity” by [Powell, Richie and Frank, and Chan [38,39,40], have all focused on various mechanisms as causes. Chan [30] highlighted these studies, which also investigated VWS, to answer the following question: does strong VWS indeed lead to TC weakening? The authors concluded that the magnitude, direction, or orientation of convectional VWS alone was not enough to draw a conclusion. They instead proposed that the whole VWS profile, which includes environmental horizontal winds at all levels within the shear layer, may become the new potential proxy for current TC intensification change predictions after more observational case studies. Chan [40] states that changes to the upper, mid, and lower troposphere using direct or indirect environmental flows of dry and low entropy air can affect TC intensity to various extents. The combination of these studies, including ours, further proves VWS to be a key TC variable that needs further investigation.

4. Discussion and Conclusions

There have been warming SSTs in the Caribbean, the surrounding region, and the MDR over the past 39 years (1982–2020), with the most significant changes occurring over the past 25–27 years. These changes have implications for increased hurricane activity and intensity. SSTs are warmer at the end of the season, and October SSTs are warming over time (Figure 2 and Figure 3). The AWP increases in magnitude and intensity during the LRS, most prominently in the latter half of the study period, at 0.51 km2 per decade. Warmer North Atlantic SSTs produce lower sea surface pressure, increasing the atmospheric moisture content, and weakening atmospheric vertical wind shear, thereby creating favorable conditions for convective development [19]. This is important because of the oceanic–atmospheric interactions caused by AWP changes, which affect the spatial distribution of TCs in the Atlantic. This relationship is perfectly summarized by Emanuel (2020) [41], who discussed how the rate of heat extraction by TCs from the ocean and the rate at which the energy of winds is dissipated (along with the “thermodynamic efficiency of the process”), are essential to TC intensity. In 1986, Emanuel used a Carnot cycle model to estimate the maximum intensity of TCs under somewhat warmer conditions; they found that hurricane intensity is dependent on climate, and predicted that should CO2 emissions reach double the study’s present-day values, there would be a projected 40–50% increase in destructive hurricanes [42].
The key question of our study was as follows: how are these observed trends in SSTs influencing TCs, which are known to be fueled by both SSTs and VWS? These two variables were also researched in this study. VWS results show that annual averages are stable. There are slight decreasing trends, but the subtle change does not cause significant changes in Atlantic TC activity. Analysis of long-term yearly and seasonal trends for SSTs and VWS suggests that warming SSTs are the primary cause of increased hurricane frequency and intensity. However, hurricane frequency may be attributed to more relative SSTs than SSTs in one basin alone [10]. Hurricane intensity is highly correlated with sea surface temperatures, implying that future warming may not necessarily lead to more frequent hurricanes, but instead to more intense hurricanes, as noted in previous studies, increasing the chances of TCs making landfall with increased destructive potential.
While August and September are peak hurricane season months, increasing frequency and intensity in October suggests we consider October part of the peak hurricane season. These findings show the changes in TC seasonality. Despite recently reported higher shears, the warmer SSTs could be a factor in the increasing number of October storms. Additionally, with the expansion of the AWP, SST warming trends in the Caribbean, the surrounding region, and the MDR, and increasingly frequent and intense storms, we may consider expanding the area known as the MDR. Furthermore, changes affecting the MDR’s size and extent affect changes in geographical shifts, which in turn influence tropical cyclone landfall, exposing areas that are less at risk, meaning they are now more prone to being hit.
A key variable that influences SSTs, VWS, and TC in the MDR is the influence of ENSO, as documented in [43,44,45]. Our preliminary analysis indicates that VWS strongly correlates with ENSO, with weakening VWS in La Niña scenarios, and higher VWS in positive ENSO. Thus, our analysis’s self-correlation between VWS and ENSO may be validated.
We would also stress that our findings on increasing SSTs are statistically significant at the 95th percentile; however, TC trends and seasonal shifts yield qualitative results based on the low reliability of long-term hurricane records, as previously indicated. Based on our analysis, it is likely that more TCs will occur in the hurricane season, with increasing intensities, and in later phases of the season (October to November); however, we do not have sufficient data to quantify the uncertainties of these observations. However, the trends we have observed suggest that the Caribbean region will experience higher-intensity storms in the future, likely attributed to an SST increase driven by global warming.
The study by Chand et al. [9] found a 13% decline in TCs over the 20th century, except for the North Atlantic basin; however, these conclusions were based on only a few decades of reliable satellite-era observational data and a less reliable reanalysis dataset, while also looking at trends via natural vs. anthropogenic factors. The authors acknowledged the obstacles facing these analyses, further reiterating the complexities of analyzing TC changes in various ocean basins under changing circumstances.
Therefore, future research must show how other changing oceanic and atmospheric variables influence TC activity trends. Variables that should be investigated further include ocean heat content (OHC), which is relevant to rapid TC intensification. Wang et al., 2023 [46] recently investigated the upper 2000 m of OHC, finding warming rates of 0.38 ± 0.13 ZJ decade−1 in the Gulf of Mexico between 1950 and 2020. We also aim to research the sea-level height and mixed-layer depth, relative to how much energy is available to TCs. This study is also a significant first step in developing a hurricane landfall predictability index. We believe these studies, combined, are essential for better understanding of the driving forces behind TC changes and intensification, especially rapid intensification, because of the increasing probability, depending on geographical location, that hurricanes will make landfall.

Author Contributions

Conceptualization, K.H., J.E.G.-C. and T.M.S.; methodology, K.H. and E.G.; validation, K.H., J.E.G.-C., T.M.S. and E.G.; formal analysis, K.H.; investigation, K.H.; data curation, K.H. and E.G.; writing—original draft preparation, K.H.; writing—review and editing, K.H., J.E.G.-C. and T.M.S.; visualization, K.H.; supervision, J.E.G.-C. and T.M.S. All authors have read and agreed to the published version of the manuscript.

Funding

This publication was supported through NOAA Educational Partnership Program/Minority Serving Institutions, award number NA16SEC4810008 to the Center for Earth System Sciences and Remote Sensing Technologies (CESSRST) at The City College of New York (CCNY). The contents are solely the responsibility of the author(s) and may not represent the official views of NOAA or the U.S. Department of Commerce.

Institutional Review Board Statement

Not applicable.

Informed Consent Statement

Not applicable.

Data Availability Statement

The OISSTv2.1 data are available at https://www.ncei.noaa.gov/products/optimum-interpolation-sst (accessed on 1 June 2019). The ERSSTv5 data are available at https://www.ncei.noaa.gov/products/extended-reconstructed-sst (accessed on 1 July 2021). The NCEP/NCAR Reanalysis data are available at https://psl.noaa.gov/data/gridded/data.ncep.reanalysis2.pressure.html (accessed on 1 July 2020). The HURDAT2 Reanalysis project data are available at https://www.aoml.noaa.gov/hrd/hurdat/Data_Storm.html (accessed on 1 July 2020).

Acknowledgments

The authors thank The City College of New York, NOAA Center for Earth System Sciences and Remote Sensing Technologies, and NOAA Office of Education, Educational Partnership Program, for full fellowship support for Keneshia Hibbert.

Conflicts of Interest

The authors declare no conflict of interest.

References

  1. Antuña-Marrero, J.C.; Otterå, O.H.; Robock, A.; Mesquita, M.d.S. Modelled and Observed Sea Surface Temperature Trends for the Caribbean and Antilles: Sea Surface Temperature Trends for the Caribbean and Antilles. Int. J. Climatol. 2016, 36, 1873–1886. [Google Scholar] [CrossRef]
  2. Glenn, E.; Comarazamy, D.; González, J.E.; Smith, T. Detection of Recent Regional Sea Surface Temperature Warming in the Caribbean and Surrounding Region. Geophys. Res. Lett. 2015, 42, 6785–6792. [Google Scholar] [CrossRef]
  3. Glenn, E.; Smith, T.M.; Gálvez, J.M.; Davison, M.; Hibbert, K.; González, J.E. Tropical Convection in the Caribbean and Surrounding Region during a Regional, Warming Sea-Surface Temperature Period, 1982–2020. Hydrology 2021, 8, 56. [Google Scholar] [CrossRef]
  4. Gadgil, S.; Joseph, P.V.; Joshi, N.V. Ocean–Atmosphere Coupling over Monsoon Regions. Nature 1984, 312, 141–143. [Google Scholar] [CrossRef]
  5. Graham, N.E.; Barnett, T.P. Sea Surface Temperature, Surface Wind Divergence, and Convection over Tropical Oceans. Science 1987, 238, 657–659. [Google Scholar] [CrossRef]
  6. Melillo, J.M.; Richmond, T.T.C.; Yohe, G.W. Climate Change Impacts in the United States: The Third National Climate Assessment; U.S. Global Change Research Program: Washington, DC, USA, 2014. [Google Scholar] [CrossRef]
  7. Pachauri, R.K.; Mayer, L.; Intergovernmental Panel on Climate Change (Eds.) Climate Change 2014: Synthesis Report; Intergovernmental Panel on Climate Change: Geneva, Switzerland, 2015. [Google Scholar]
  8. Shapiro, L.J.; Goldenberg, S.B. Atlantic Sea Surface Temperatures and Tropical Cyclone Formation. J. Clim. 1998, 11, 578–590. [Google Scholar] [CrossRef]
  9. Chand, S.S.; Walsh, K.J.E.; Camargo, S.J.; Kossin, J.P.; Tory, K.J.; Wehner, M.F.; Chan, J.C.L.; Klotzbach, P.J.; Dowdy, A.J.; Bell, S.S.; et al. Declining Tropical Cyclone Frequency under Global Warming. Nat. Clim. Chang. 2022, 12, 655–661. [Google Scholar] [CrossRef]
  10. Taylor, M.A.; Stephenson, K.A. Impacts of Climate Change on Sea Temperature in the Coastal and Marine Environments of Caribbean Small Island Developing States. Caribb. Mar. Clim. Cange Rep. Card Sci. Rev. 2017, 201, 23–30. [Google Scholar]
  11. Mann, M.E.; Emanuel, K.A. Atlantic Hurricane Trends Linked to Climate Change. Eos Trans. AGU 2006, 87, 233. [Google Scholar] [CrossRef]
  12. Vecchi, G.A.; Soden, B.J. Increased Tropical Atlantic Wind Shear in Model Projections of Global Warming: Atlantic Wind Shear and Global Warming. Geophys. Res. Lett. 2007, 34. [Google Scholar] [CrossRef]
  13. Riahi, K.; Rao, S.; Krey, V.; Cho, C.; Chirkov, V.; Fischer, G.; Kindermann, G.; Nakicenovic, N.; Rafaj, P. RCP 8.5—A Scenario of Comparatively High Greenhouse Gas Emissions. Clim. Chang. 2011, 109, 33–57. [Google Scholar] [CrossRef]
  14. Nurse, L.A.; Charlery, J.L. Projected SST Trends across the Caribbean Sea Based on PRECIS Downscaling of ECHAM4, under the SRES A2 and B2 Scenarios. Theor. Appl. Climatol. 2016, 123, 199–215. [Google Scholar] [CrossRef]
  15. Emanuel, K.A. An Air–sea Interaction Theory for Tropical Cyclones. Part I: Steady-State Maintenance. J. Atmos. Sci. 1986, 43, 585–605. [Google Scholar] [CrossRef]
  16. Huang, B.; Liu, C.; Banzon, V.; Freeman, E.; Graham, G.; Hankins, B.; Smith, T.; Zhang, H.-M. Improvements of the Daily Optimum Interpolation Sea Surface Temperature (DOISST) Version 2.1. J. Clim. 2021, 34, 2923–2939. [Google Scholar] [CrossRef]
  17. Huang, B.; Menne, M.J.; Boyer, T.; Freeman, E.; Gleason, B.E.; Lawrimore, J.H.; Liu, C.; Rennie, J.J.; Schreck, C.J.; Sun, F.; et al. Uncertainty Estimates for Sea Surface Temperature and Land Surface Air Temperature in NOAAGlobalTemp Version 5. J. Clim. 2020, 33, 1351–1379. [Google Scholar] [CrossRef]
  18. Wang, C.; Lee, S.-K.; Enfield, D.B. Atlantic Warm Pool Acting as a Link between Atlantic Multidecadal Oscillation and Atlantic Tropical Cyclone Activity: Atlantic Tropical Cyclone Activity. Geochem. Geophys. Geosyst. 2008, 9. [Google Scholar] [CrossRef]
  19. Wang, C.; Lee, S. Atlantic Warm Pool, Caribbean Low-Level Jet, and Their Potential Impact on Atlantic Hurricanes. Geophys. Res. Lett. 2007, 34, L02703. [Google Scholar] [CrossRef]
  20. Fiedler, S.; Putrasahan, D. How Does the North Atlantic SST Pattern Respond to Anthropogenic Aerosols in the 1970s and 2000s? Geophys. Res. Lett. 2021, 48, e2020GL092142. [Google Scholar] [CrossRef]
  21. Shapiro, L.J. Hurricane Climatic Fluctuations. Part I: Patterns and Cycles. Mon. Wea. Rev. 1982, 110, 1007–1013. [Google Scholar] [CrossRef]
  22. Enfield, D.B.; Mestas-Nuñez, A.M.; Trimble, P.J. The Atlantic Multidecadal Oscillation and Its Relation to Rainfall and River Flows in the Continental U.S. Geophys. Res. Lett. 2001, 28, 2077–2080. [Google Scholar] [CrossRef]
  23. Vecchi, G.A.; Landsea, C.; Zhang, W.; Villarini, G.; Knutson, T. Changes in Atlantic Major Hurricane Frequency since the Late-19th Century. Nat. Commun. 2021, 12, 4054. [Google Scholar] [CrossRef] [PubMed]
  24. Emanuel, K. The Hurricane—Climate Connection. Bull. Amer. Meteor. Soc. 2008, 89, ES10–ES20. [Google Scholar] [CrossRef]
  25. Knutson, T.; Camargo, S.J.; Chan, J.C.L.; Emanuel, K.; Ho, C.-H.; Kossin, J.; Mohapatra, M.; Satoh, M.; Sugi, M.; Walsh, K.; et al. Tropical Cyclones and Climate Change Assessment: Part II: Projected Response to Anthropogenic Warming. Bull. Am. Meteorol. Soc. 2020, 101, E303–E322. [Google Scholar] [CrossRef]
  26. Kossin, J.P.; Knapp, K.R.; Olander, T.L.; Velden, C.S. Global Increase in Major Tropical Cyclone Exceedance Probability over the Past Four Decades. Proc. Natl. Acad. Sci. USA 2020, 117, 11975–11980. [Google Scholar] [CrossRef] [PubMed]
  27. Bjerknes, J. Atlantic Air–sea Interaction. In Advances in Geophysics; Elsevier: Amsterdam, The Netherlands, 1964; Volume 10, pp. 1–82. [Google Scholar] [CrossRef]
  28. Shukla, J.; Misra, B.M. Relationships between Sea Surface Temperature and Wind Speed over the Central Arabian Sea, and Monsoon Rainfall over India. Mon. Wea. Rev. 1977, 105, 998–1002. [Google Scholar] [CrossRef]
  29. Hurrell, J.W. Decadal Trends in the North Atlantic Oscillation: Regional Temperatures and Precipitation. Science 1995, 269, 676–679. [Google Scholar] [CrossRef]
  30. Wang, C.; Weisberg, R.H.; Yang, H. Effects of the Wind Speed–Evaporation–SST Feedback on the El Niño–Southern Oscillation. J. Atmos. Sci. 1999, 56, 1391–1403. [Google Scholar] [CrossRef]
  31. Xie, S.-P. Satellite Observations of Cool Ocean–Atmosphere Interaction. Bull. Am. Meteorol. Soc. 2004, 85, 195–208. [Google Scholar] [CrossRef]
  32. QU, B.; Jing-nan, Z.; Dao-rong, L.; Feng, Q.; Min, Z. Correlation between Sea Surface Temperature and Wind Speed in Greenland Sea and Their Relationships with NAO Variability. Sci. Direct 2012, 5, 304–315. [Google Scholar] [CrossRef]
  33. Xian, T.; Xia, J.; Wei, W.; Zhang, Z.; Wang, R.; Wang, L.-P.; Ma, Y.-F. Is Hadley Cell Expanding? Atmosphere 2021, 12, 1699. [Google Scholar] [CrossRef]
  34. Gray, W.M. Global View of the Origin of Tropical Disturbances and Storms. Mon. Wea. Rev. 1968, 96, 669–700. [Google Scholar] [CrossRef]
  35. DeMaria, M. The Effect of Vertical Shear on Tropical Cyclone Intensity Change. J. Atmos. Sci. 1996, 53, 2076–2088. [Google Scholar] [CrossRef]
  36. Wang, Y.; Rao, Y.; Tan, Z.-M.; Schönemann, D. A Statistical Analysis of the Effects of Vertical Wind Shear on Tropical Cyclone Intensity Change over the Western North Pacific. Mon. Weather. Rev. 2015, 143, 3434–3453. [Google Scholar] [CrossRef]
  37. Emanuel, K.A. The Finite-Amplitude Nature of Tropical Cyclogenesis. J. Atmos. Sci. 1989, 46, 3431–3456. [Google Scholar] [CrossRef]
  38. Powell, M.D. Boundary Layer Structure and Dynamics in Outer Hurricane Rainbands. Part II: Downdraft Modification and Mixed Layer Recovery. Mon. Wea. Rev. 1990, 118, 918–938. [Google Scholar] [CrossRef]
  39. Frank, W.M.; Ritchie, E.A. Effects of Vertical Wind Shear on the Intensity and Structure of Numerically Simulated Hurricanes. Mon. Wea. Rev. 2001, 129, 2249–2269. [Google Scholar] [CrossRef]
  40. Chan, K.T.F.; Wang, D.; Zhang, Y.; Wanawong, W.; He, M.; Yu, X. Does Strong Vertical Wind Shear Certainly Lead to the Weakening of a Tropical Cyclone? Environ. Res. Commun. 2019, 1, 015002. [Google Scholar] [CrossRef]
  41. Emanuel, K. Evidence That Hurricanes Are Getting Stronger. Proc. Natl. Acad. Sci. USA 2020, 117, 13194–13195. [Google Scholar] [CrossRef]
  42. Emanuel, K.A. The Dependence of Hurricane Intensity on Climate. Nature 1987, 326, 483–485. [Google Scholar] [CrossRef]
  43. Wang, C. ENSO, Atlantic Climate Variability, and the Walker and Hadley Circulations. In The Hadley Circulation: Present, Past and Future; Diaz, H.F., Bradley, R.S., Beniston, M., Eds.; Advances in Global Change Research; Springer: Dordrecht, The Netherlands, 2004; Volume 21, pp. 173–202. [Google Scholar] [CrossRef]
  44. Yang, Y.; Zhu, Z.; Shen, X.; Jiang, L.; Li, T. The Influences of Atlantic Sea Surface Temperature Anomalies on the ENSO-Independent Interannual Variability of East Asian Summer Monsoon Rainfall. J. Clim. 2022, 36, 677–692. [Google Scholar] [CrossRef]
  45. Lin, I.; Camargo, S.J.; Patricola, C.M.; Boucharel, J.; Chand, S.; Klotzbach, P.; Chan, J.C.L.; Wang, B.; Chang, P.; Li, T.; et al. ENSO and Tropical Cyclones. In Geophysical Monograph Series; McPhaden, M.J., Santoso, A., Cai, W., Eds.; Wiley: New York, NY, USA, 2020; pp. 377–408. [Google Scholar] [CrossRef]
  46. Wang, Z.; Boyer, T.; Reagan, J.; Hogan, P. Upper Oceanic Warming in the Gulf of Mexico between 1950 and 2020. J. Clim. 2023, 36. [Google Scholar] [CrossRef]
Figure 1. (A) Spatial map depicting trends from 1982 to 2020 during the late rainfall season (LRS), indicating warming trends up to and exceeding 0.4 °C per decade in the main developing region MDR) (10–20° N, 20–80° W), and the Caribbean and the surrounding region (5–31° N, 100–55° W). (B) Plot indicating statistical significance. Boundary boxes are estimated approximate locations.
Atmosphere 14 00999 g001
Figure 2. (A) Annual SST variations, indicating annual average SSTs during the LRS for the Caribbean, and the surrounding region, (B) the MDR, depicting current and global SST trends from 1982–2020 using the NOAA OISST and 1950–2020 ERSST dataset. The ERSST-OISST average bias is removed from ERSST over the local region average. The scale for the local region is on the left, and the scale for the global average is on the right of the figure.
Atmosphere 14 00999 g002
Figure 3. (A,C) Regional daily SST averages and (B,D) anomalies during the LRS for the MDR, the Caribbean, and the surrounding region. The x-axis represents Julian Days, and the y-axis represents 1982–2020. The color bar is SST in degrees Celsius. The daily anomalies were produced using the 39-year average (1982–2020) SST for each day of the year as the baseline.
Atmosphere 14 00999 g003
Figure 4. Monthly regional SST trends from 1982 to 2020 using NOAA OISST product: (A) SST temperatures during the LRS in the MDR; (B) SST in the LRS during the Caribbean and the surrounding region.
Atmosphere 14 00999 g004
Figure 5. Illustrates the area index time series for the Atlantic Warm Pool (AWP), 1982–2020. The time series illustrates that the area of SSTs greater than 28.5 °C is expanding at a rate of 0.51 km2 per decade. The linear equation inside the plot shows the increasing trend.
Atmosphere 14 00999 g005
Figure 6. Monthly regional VWS trends from 1982 to 2020 using the NCEP/NCAR Reanalysis 1 product: (A) Wind shear during the LRS in the MDR; (B) Wind shear during the LRS in the Caribbean and the surrounding region.
Atmosphere 14 00999 g006
Figure 7. (A) Annual average of VWS during the LRS from 1982 to 2020 in the MDR, showing a decreasing trend at 0.56 ms−1 per decade; (B) annual average of VWS during the LRS from 1982 to 2020 in the Caribbean and the surrounding region, showing a decreasing trend at 0.16 ms−1 per decade.
Atmosphere 14 00999 g007
Figure 8. Atlantic multidecadal oscillation (AMO) index (1861–2017) and 10-year running average of the LRS SST in the MDR (1851–2020), showing a moderate correlation of 0.6003, with a p-value at 9.6379 × 10 −17.
Atmosphere 14 00999 g008
Figure 9. Categories 1 and 2 Atlantic hurricane (HU) and Categories 3 to 5 Atlantic major hurricane (MH) counts over the LRS months, (A) August, (B) September, (C) October, and (D) November, 1851–2020. The blue bars (HU) indicate low-intensity storm counts, and the orange bars (MH) indicate high-intensity storm counts. The tables below each month show the overall storm counts vs. average storm occurrence per year for that period.
Atmosphere 14 00999 g009
Figure 10. (A) Low-intensity, HU (Category 1 and 2) and high-intensity, (B) MH (major hurricanes) (Category 3 to 5) Atlantic average storm counts from 1851–2020. Storm counts are taken from the HURDAT2 database. Plots indicate increasing storm counts in the recent 39 years, as highlighted by red circular markers.
Atmosphere 14 00999 g010
Table 1. Summary of regional SST and VWS correlations with storm intensities in the Caribbean, surrounding regions, and MDR. The bold type indicates statistical significance at the 95% test level.
SST and VWS Correlations with the Caribbean and Surrounding Region Storm Intensities.
Cat 1Cat 2Cat 3Cat 4Cat 5
SST LRS<10−30.0020.1980.0070.037
VWS LRS0.0130.0070.0080.0380.001
SST and VWS Correlations with Storm Intensities in the MDR.
Cat 1Cat 2Cat 3Cat 4Cat 5
SST LRS0.0020.0030.2730.0380.033
VWS LRS<10−30.0080.0580.0010.040
Disclaimer/Publisher’s Note: The statements, opinions and data contained in all publications are solely those of the individual author(s) and contributor(s) and not of MDPI and/or the editor(s). MDPI and/or the editor(s) disclaim responsibility for any injury to people or property resulting from any ideas, methods, instructions or products referred to in the content.

