Article

Comparison of Trace Element Deposition in Cupressus macrocarpa Leaves and Soils from a High-Pollution Area in the Puchuncaví Valley (Chile) Using a Biomonitoring Method

by
Tamara Gorena
1,2,*,
Franco Sandoval
2,
Ximena Fadic
2 and
Francisco Cereceda-Balic
2,3
1
Departamento de Silvicultura, Facultad de Ciencias Forestales, Universidad de Concepción, Victoria 631, Concepción 4070374, Chile
2
Centre for Environmental Technologies (CETAM), Universidad Técnica Federico Santa María (UTFSM), General Bari 699, Valparaíso 2390123, Chile
3
Departamento de Química, Universidad Técnica Federico Santa María (UTFSM), Avenida España 1680, Valparaíso 2390123, Chile
*
Author to whom correspondence should be addressed.
Atmosphere 2023, 14(5), 893; https://doi.org/10.3390/atmos14050893
Submission received: 17 April 2023 / Revised: 14 May 2023 / Accepted: 16 May 2023 / Published: 20 May 2023
(This article belongs to the Special Issue Biomonitoring - an Effective Tool for Air Pollution Assessment)

Abstract

:
Located in the Puchuncaví Valley (PV) in central Chile is one of the most important and oldest industrial complexes (ICs) in the country. The PV is affected by anthropogenic emissions from the IC where the most important industry is a copper smelter and refinery. In this context, this study assessed the profile, concentration, and enrichment factors of the trace elements, both in the soil and in Cupressus macrocarpa leaves from this high-pollution-load area. The soil and leaf samples were taken from five selected sites, located between 0.8 and 15 km away from the IC. A total of 24 elements were analyzed by ICP-MS and examined by enrichment factor (EF), and PCA source analysis. Leaf concentrations of Ba, Ca, Cd, Cu, K, and Sr showed statistically significant differences between sampling sites (p-value < 0.05). In soil, element concentrations of Al, As, Ba, Cr, Cu, K, Li Mg, Mn, Na, Ni, Pb, and Ti showed statistically significant differences between sampling sites (p-value < 0.05). The source analysis of EFs in the samples of both soil and leaves detected three and four factors, respectively, related mainly to the industrial complex’s copper smelter and refinery, coal-fired power plants, and geogenic sources. According to the PCA, the leaf EFs of anthropogenic elements from copper smelting showed that La Greda (LG, site closest to the IC) was significantly enriched in the elements Cu, Zn, As, Mo, and Pb, while the EF in the soil from LG showed high enrichment in Cu and significant enrichment in Pb.

1. Introduction

In recent decades, contamination by trace elements has become a serious threat to human health and the environment [1,2,3,4,5,6,7,8,9,10,11,12,13,14]. In central Chile, located in the Puchuncaví Valley, is found one of the most important and oldest industrial complexes (ICs), containing several industries, such as a natural gas terminal, cement and chemical companies, and coal-fired power plants, among others. However, the most important industry is the Cu smelter and refinery. This mineral plays a fundamental role in Chile’s economy, the country being among the world’s leading Cu producers [15], with several mining operations in its central regions. Nevertheless, several environmental problems associated with Cu mining activity are widely known, particularly concerning soil contamination with metals and other trace elements, such as Cu, Zn, Pb, Cd, and As [1,2,3,4,5,6,7,8,9,10].
Numerous studies have reported high levels of Cu, As, Pb, and Sb in soils from the Puchuncaví Valley produced by the industrial and copper smelter activities in the IC [5,6,8,9]. Moreover, it has been demonstrated that Cu, As, and Pb concentrations in soils decrease as a function of the distance from the IC [8]. Salmanighabeshi et al. (2015) [11] investigated trace element pollution in soil from five sites near the industrial area from 2007 to 2011 and reported very high contamination factors for elements such as As, Cd, Hg, Sb, and Cu at locations close to the pollution source (La Greda and Los Maitenes) with significant ecological impacts. Despite the high heavy metal and other trace element levels reported in the soils, and atmospheric deposition from different areas around the IC, there are very few studies that have assessed the impact of such a high trace element load on the vegetation in this area [4,7,12], and studies measuring the elemental composition using plant biomonitors are limited [13,14]. Recently, Gorena et al. (2020) [14] reported that elemental levels in Cupressus macrocarpa leaves collected around Puchuncavií Valley were clearly affected by the anthropogenic activities, the Cu values found near the IC, at phytotoxic levels and with an enrichment factor above 3000%, confirming the great influence of the copper smelting and refinery. However, in their study, only the leaves were evaluated, without showing what happened with trace elements in the soil.
This study assesses the profile, concentration, and enrichment factors of the trace elements followed by principal component analysis (PCA), both in soil and in Cupressus macrocarpa leaves from high-pollution-load areas such as the Puchuncaví Valley (Chile).

2. Materials and Methods

2.1. Reagents

All chemicals used for the preparation of stock and standard solutions were for trace metal analysis. Nitric acid (69%) was supplied by PanReac (Barcelona, Spain) and perchloric acid Ultratrace® (70%) was provided by Scharlau (Barcelona, Spain). The working solution was prepared by dilution with ultrapure water obtained from a Milli-Q system (Merck, Darmstadt, Germany). The calibration curve of ICP-MS was performed using a multi-element standard solution and mercury pure plus standard, both supplied by Perkin Elmer (Waltham, MA, USA). A total of 400 µg L−1 of Y (III) and Re (VII) standards (PanReac, Barcelona, Spain) was used as an internal standard.

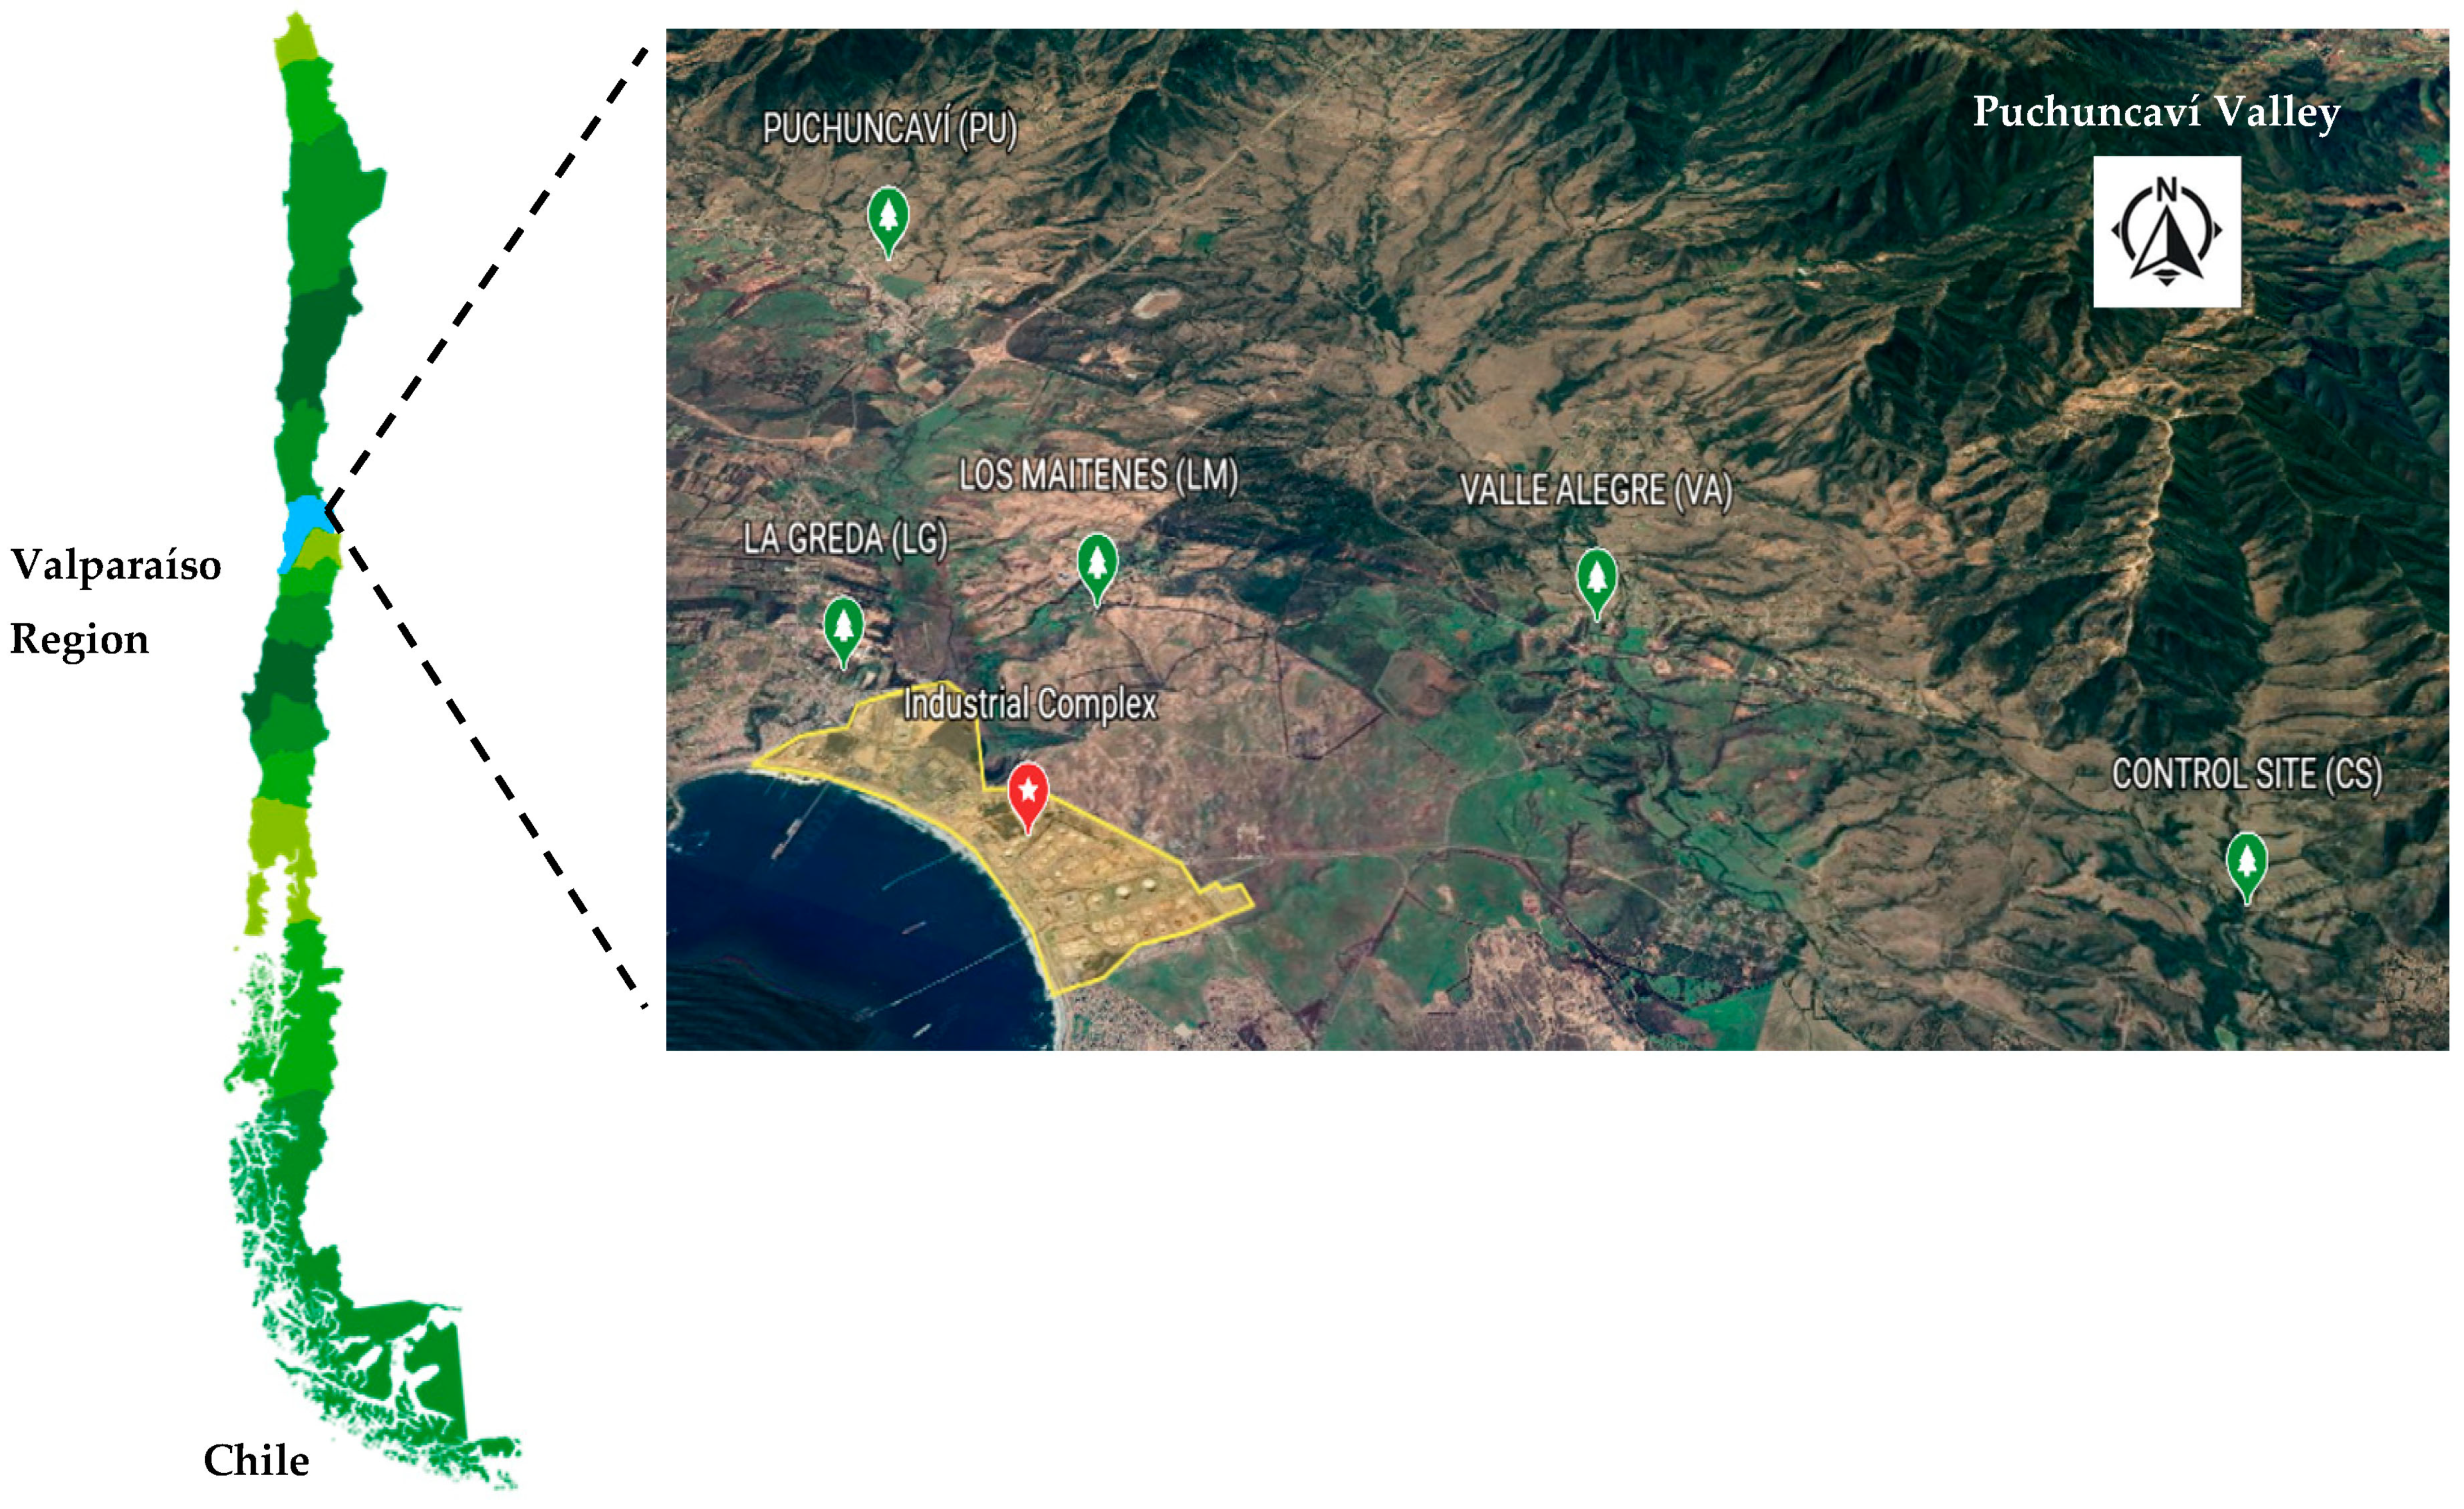
2.2. Sampling Area Description

The Cupressus macrocarpa leaves and soil samples were collected from the Puchuncaví Valley located in the Valparaíso region in Chile. The soil and leaf samples were collected from four different monitoring sites located around the industrial complex in the Puchuncaví Valley. The sampling sites La Greda (LG, 0.8 km NE of IC), Los Maitenes (LM, 3.5 km E of IC), Puchuncaví (Pu, 7.3 km NE of IC), and Valle Alegre (VA, 10.4 km SE of IC) represent different degrees of pollution impact on the Puchuncaví Valley [8].
In addition, a control site (CS, 15 km S of IC) was incorporated (Figure 1), located in opposition to the wind direction and stack emission plumes from the industrial complex. This area was previously validated as a control site [14].

2.3. Plant Material Description

Healthy Cupressus macrocarpa leaf samples and representative trees of each place were chosen at each site, and three bags (replicates, n = 3) of about 250 g leaves each were gathered from six or nine trees, depending on the number of leaves on the trees present at the monitoring sites, according by Gorena et al. (2020) [14]. Leaf samples were collected only from the annual growth of the trees, in the southern hemisphere in early autumn (April 2021). The leaves collected in this period received and accumulated the entire atmospheric deposition of the spring and summer.
Leaves from every position around the tree (west, east, south, and north) were collected to eliminate the factor of wind direction. Cupressus macrocarpa leaves were not washed, to determine the elemental levels in the entire leaf and thus to estimate the whole effect of atmospheric pollution, according to a previous study [14].
Leaf samples were taken using a ceramic knife. Once collected, leaf samples were stored in clean (washed with 10% nitric acid) polyethylene bags and frozen at −20 °C for one week. The samples were then lyophilized using the Labconco System (Bulk Tray Dryers, Kansas, MO, USA). Subsequently, the particle size of the lyophilized leaf samples was reduced in a titanium mill Grindomix GM 200 (Retsch, Haan, Germany) and stored in clean self-sealing plastic bags in a freezer at −20 °C until analysis.

2.4. Soil Description

Undisturbed soils were collected from five selected sites (Figure 1) with a monthly periodicity, between April and July 2021. For sampling, a 1 m2 surface area was delimited and the extraneous matter (stones, leaves, seeds, or roots) was eliminated. A total of 20 topsoil (0–10 cm) samples of approximately 3 kg were collected with a plastic shovel and stored in sterile Whirl-Pak (Nasco, Austin, TX, USA) polyethylene bags. All soil samples were dried for 72 h, at a constant temperature of 50 ºC, and then sieved through a 2 mm plastic mesh.

2.5. Analytical Procedure and Determination of Elements by ICP-MS in Leaves and Soil

Microwave-assisted acid digestion of the samples was carried out. Freeze-dried and ground leaf samples (0.4 g) were digested for 15 min in a Milestone Ultrawave (Bergamo, BG, Italy) with 3.5 mL of nitric acid:water (3:1 v/v) and 1 mL hydrogen peroxide, according to the methodology of Gorena et al. (2020) [14]. The soil samples (0.4 g) were digested for 15 min in a Milestone Ultrawave (Bergamo, BG, Italy) with 3.5 mL of nitric acid:hydrochloric acid (3:1 v/v). The instrumental conditions are presented in Table S1 (Supplementary Material).
The concentrations of 24 elements: Al, Ba, As, Cd, Ca, Co, Cr, Cu, Fe, K, Li, Mg, Mn, Hg, Mo, Na, Ni, Pb, Sb, Sr, S, Ti, V, and Zn, were determined in soil and leaves by the inductively coupled plasma mass spectrometry (ICP-MS), conducted using an ICP-MS 7900 system (Agilent, Santa Clara, CA, USA). In addition, Ce, La, and Nd were determined in leaves (See Table 1). The measurements were performed in triplicate and all samples were expressed in dry weight terms (mg kg−1 of dry weight). The instrumental conditions are presented in Table S2 (Supplementary Material).
To check the accuracy of the analytical procedures, certified reference material was used: the Standard Reference Material 1575a trace elements in pine needles (Pinus taeda) and Reference Material 2709a trace elements in soil, both produced by the National Institute of Standard Technology (NIST, Gaithersburg, MD, USA). No statistical differences (95% confidence level) between the expected and the obtained results were observed (Tables S3 and S4, Supplementary Material).

2.6. Enrichment Factors in Leaves

The enrichment factor in leaves (EFl) was calculated as a percentage for each element and monitoring point using the following Equation (1):
E F l E = C E s a m p l e C E C S C E C S × 100
where EflE is the enrichment factor of the element E, CEsample is the concentration of element E in the leaf sample, and CECS is the concentration of element E in the leaf sample from the control site. For the interpretation criteria, EF < 50% indicates normal conditions, EF of 50–100% indicates moderate enrichment, and EF > 100% indicates significant enrichment [14,16,17].

2.7. Enrichment Factors in Soil

This method is based on the standardization of an element concentration tested against a reference element such as Al, Fe, or Mn [11,18]. Fe was selected as the reference element in this study because this element did not show significant differences in the 5 sites evaluated, being thus a stable element in Puchuncaví soil (see Table 2). The enrichment factor in the soil (Efs) was calculated as a percentage for each element and monitoring point using the following Equation (2):
E F s E = C E s a m p l e / C r e f s a m p l e B E C S / B r e f C S  
where EfsE is the enrichment factor in the soil of the element E, CEsample is the concentration of element E in the soil sample, Crefsample is the concentration of reference element (Fe) in the same soil sample, BECS is the concentration of element E in soil from control site, and BrefCS is the concentration of reference element (Fe) in the same soil from the control site. For the interpretation criteria, EF < 2 is interpreted as a deficiency to minimal enrichment, 2 < EF < 5 indicates moderate enrichment, 5 < EF < 20 indicates significant enrichment, 20 < EF < 40 indicates very high enrichment, and finally EF > 40 indicates extremely high enrichment [11,18].

2.8. Statistical Analysis

For statistical data analysis, normality was evaluated using the Shapiro–Wilk test and Levene’s test for variance check. In the case of not complying with the normality and/or homoscedasticity criteria, a Box–Cox transformation was performed [16]. Differences between the concentrations of leaf and soil trace elements at monitoring sites were analyzed by a one-way analysis of variance (ANOVA) and statistically significant differences were estimated through the least significant difference (LSD) test of Fisher’s multiple comparisons. All tests and statistical evaluations were performed with a 95% confidence level (p < 0.05).
Principal component analysis (PCA) with Varimax rotation of enrichment factors was applied to source analysis in both soil and leaves [18]. Only significant factors with Eigen-values greater than 1 were considered significant in the analysis and data interpretation [19]. Loading correlation coefficients with values of |0.7| or higher were considered to interpret the respective factors [5]. The XLSTAT (Addinsoft) software version 2022 package was used for statistical analysis.

3. Results and Discussion

3.1. Element Concentrations

3.1.1. Element Concentrations in Cupressus macrocarpa Leaves

The mean concentration ± standard deviation (in mg kg−1 of dry weight) of trace elements evaluated in Cupressus macrocarpa leaves from five sampling points in the Puchuncaví Valley are presented in Table 1. The Hg and Li concentrations in all samples were below the limit of quantification (<1.00 mg kg−1). The leaf concentrations of Ba, Ca, Cd, Cu, K, and Sr showed statistically significant differences between sampling sites, using a p-value of 0.05 (significance at 95%). Most elements, such as Al, As, Ce, Co, Cr, Fe, La, Mg, Mo, Na, Nd, Ni, Sb, Ti, and V, did not show significant differences between sampling sites. However, the highest concentration was observed in LG, an area close to the industrial complex.
Table 1. Comparison of mean values (±standard deviation) in mg kg−1 of dry weight (DW) and results of the analysis to variance (ANOVA) of the trace elements measured in Cupressus macrocarpa leaves from monitoring sites in the Puchuncaví Valley, Chile 1.
ElementsLGLMPuVACSANOVA
(p-Value)
Al1188 ± 786 431 ± 127 386 ± 178434 ± 76.03 355 ± 188 0.135
As6.92 ± 4.51 3.11 ± 0.94 2.46 ± 1.066.26 ± 3.41 2.39 ± 1.32 0.160
Ba44.13 ± 7.75 b20.34 ± 6.21 a23.16 ± 15.34 a52.00 ± 8.49 b20.39 ± 3.81 a0.004
Ca14,974 ± 454 a9299 ± 1759 a14,182 ± 5456 ab21,585 ± 3806 b9980 ± 2144 a0.006
Cd0.58 ± 0.13 d0.28 ± 0.04 bc0.22 ± 0.02 ab0.20 ± 0.05 a0.34 ± 0.09 c0.001
Ce1.31 ± 0.93 0.43 ± 0.14 0.43 ± 0.260.41 ± 0.08 0.34 ± 0.18 0.180
Co0.73 ± 0.42 0.34 ± 0.10 0.59 ± 0.500.66 ± 0.30 0.31 ± 0.15 0.338
Cr5.00 ± 2.80 3.64 ± 1.36 2.31 ± 1.673.86 ± 1.74 3.52 ± 1.57 0.573
Cu318 ± 218 c79.87 ± 28.56 ab105 ± 49.23 abc226 ± 92.41 bc56.08 ± 27.23 a0.026
Fe1654 ± 1163 628 ± 219 553 ± 310805 ± 309 495 ± 277 0.229
HgBLQBLQBLQBLQBLQ-
K7592 ± 1083 b4595 ± 1012 a6540 ± 2258 ab7330 ± 876 b4636 ± 830 a0.047
La1.08 ± 0.72 0.32 ± 0.08 0.38 ± 0.200.41 ± 0.10 0.26 ± 0.14 0.112
LiBLQBLQBLQBLQBLQ-
Mg3002 ± 382 2147 ± 394 2536 ± 4132460 ± 573 2254 ± 313 0.200
Mn91.68 ± 33.07 70.04 ± 2.41 139 ± 122110 ± 57.80 73.40 ± 40.07 0.879
Mo3.94 ± 2.71 1.84 ± 0.63 1.62 ± 0.713.13 ± 1.12 1.36 ± 0.69 0.166
Na2355 ± 1219 1103 ± 492 914 ± 210841 ± 366 723 ± 195 0.087
Nd0.57 ± 0.39 0.18 ± 0.06 0.24 ± 0.160.19 ± 0.04 0.23 ± 0.13 0.183
Ni4.99 ± 1.26 4.14 ± 0.97 3.42 ± 1.474.03 ± 1.68 3.56 ± 1.65 0.695
Pb9.41 ± 6.07 3.85 ± 1.01 3.45 ± 1.9912.14 ± 8.36 2.92 ± 1.61 0.181
S1788 ± 781 1123 ± 81.97 1622 ± 5331934 ± 271 1012 ± 152 0.109
Sb1.04 ± 0.41 0.58 ± 0.16 0.51 ± 0.270.83 ± 0.28 0.46 ± 0.24 0.135
Sr166 ± 5.38 b131 ± 6.93 a190 ± 43.66 b310 ± 63.31 c160 ± 17.89 b0.000
Ti73.52 ± 46.41 30.45 ± 9.74 25.80 ± 14.1624.90 ± 5.40 23.88 ± 12.85 0.195
V3.71 ± 2.68 1.36 ± 0.47 1.13 ± 0.611.12 ± 0.28 1.06 ± 0.62 0.201
Zn43.68 ± 17.21 19.78 ± 3.14 26.40 ± 13.9158.24 ± 32.80 16.79 ± 7.08 0.064
1 Bold values show statistically significant differences according to ANOVA (p ≤ 0.05). Different letters in the same row indicate significant differences based on an LSD test with a 95% confidence level. BLQ: below the limit of quantification.
Moreover, high Cu values were registered in Cupressus macrocarpa leaves throughout the Puchuncaví Valley, (Table 1). The highest Cu value in LG leaves had a similar phytotoxic level observed previously at the same site in April 2017 [14] and exceeded the concentration observed in Oenothera picensis leaves, a native herb with a potential Cu metallophyte from LG [12]. In addition, the Cu levels from LG in April (See Table 1) exceeded the levels reported in Cupressus macrocarpa leaves from an urban site in Spain up to 30 times [20], and were 13 times the average concentration observed in Pinus pinea leaves near a chemical and petrochemical industrial complex in Spain [21].
A comparison between tree-rings analyzed until 2011 near the IC [13] and the leaves in this study showed that in Cupressus macrocarpa, trace elements such as Al, As, Ba, Cd, Co, Cr, Cu, Fe, Mo, Ni, Pb, Sb, and V were the major concentrations in leaves, probably due to the main pathway to accumulation of trace elements being atmospheric deposition over leaves. In accordance with the present results, previous studies carried out in other parts of the world have shown that atmospheric deposition is the main way to accumulate trace elements in Pinus [22,23].

3.1.2. Element Concentrations in Soil

The mean concentrations ± standard deviation (in mg kg−1 of dry weight) of trace elements in the soil collected between April and July at sampling sites are shown in Table 2. The Cd, Hg, and Sb concentrations in all samples were below the limit of quantification (<1.25 mg kg−1). The soil concentrations of Al, As, Ba, Cr, Cu, K, Li, Mg, Mn, Na, Ni, Pb, and Ti showed statistically significant differences between sampling sites, using a p-value of 0.05 (significant at 95%).
Table 2. Comparison of mean values (±standard deviation) in mg kg−1 of dry weight (DW) and results of the analysis of variance (ANOVA) of the trace elements measured in the soil from the monitoring sites in the Puchuncaví Valley, Chile 1.
ElementsLGLMPuVACSANOVA
(p-Value)
Al6535 ± 542 c4338 ± 666 ab5340 ± 1045 b3996 ± 220 a4715 ± 654 ab0.001
As13.08 ± 0.89 c7.26 ± 3.88 bc3.38 ± 2.58 a2.44 ± 0.37 a4.18 ± 1.92 ab0.001
Ba42.15 ± 3.76 c29.69 ± 10.90 b19.48 ± 6.20 ab13.47 ± 0.49 a25.36 ± 8.96 b0.001
Ca1479 ± 216 2880 ± 1308 1735 ± 547 1512 ± 112 1730 ± 4200.092
CdBLQBLQBLQBLQBLQ-
Co2.05 ± 0.06 1.68 ± 0.29 2.05 ± 0.53 1.53 ± 0.06 1.86 ± 0.150.077
Cr5.05 ± 0.24 b3.52 ± 0.65 a5.09 ± 1.46 b3.33 ± 0.12 a3.54 ± 0.35 a0.005
Cu1012 ± 189 c414 ± 260 b49.33 ± 35.76 a17.09 ± 5.11 a22.74 ± 4.41 a0.000
Fe8255 ± 404 7305 ± 1286 7580 ± 900 6872 ± 53.48 6609 ± 7130.076
HgBLQBLQBLQBLQBLQ-
K881 ± 103 c1047 ± 294 c627 ± 169 b564 ± 36.23 ab377 ± 4.33 a0.000
Li2.97 ± 0.24 c1.96 ± 0.40 b1.65 ± 0.53 b1.50 ± 0.06 b1.19 ± 0.60 a0.000
Mg868 ± 68.81 b824 ± 152 b607 ± 245 a543 ± 19.53 a411 ± 96.72 a0.002
Mn123 ± 7.64 a137 ± 23.77 a139 ± 26.19 a120 ± 8.10 a261 ± 92.38 b0.002
Mo1.67 ± 0.86 1.76 ± 0.88 BLQBLQBLQ
Na97.90 ± 2.34 b124 ± 71.62 b93.71 ± 37.57 ab60.58 ± 10.33 a61.30 ± 15.99 a0.025
Ni2.57 ± 0.12 b1.76 ± 0.38 a1.64 ± 0.28 aBLQ1.38 ± 0.23 a0.004
Pb42.35 ± 6.28 c16.26 ± 9.65 b6.63 ± 4.83 a4.44 ± 0.47 a8.40 ± 5.61 ab0.000
S904 ± 522 BLQBLQBLQBLQ-
SbBLQBLQBLQBLQBLQ-
Sr13.93 ± 1.73 19.19 ± 8.19 16.77 ± 5.65 12.26 ± 0.67 14.40 ± 3.170.352
Ti73.41 ± 18.53 b72.20 ± 24.54 b52.07 ± 13.88 ab37.54 ± 7.08 a52.58 ± 7.62 ab0.028
V14.98 ± 0.95 12.70 ± 2.21 13.48 ± 2.59 12.71 ± 0.50 14.23 ± 1.360.298
Zn84.83 ± 43.22 BLQBLQBLQBLQ-
1 Bold values show statistically significant differences according to ANOVA (p ≤ 0.05). Different letters in the same row indicate significant differences based on an LSD test with a 95% confidence level. BLQ: below the limit of quantification.
The highest mean concentrations of As, Co, Cu, Ni, Pb, S, V, and Zn in soil were observed at LG, the site closest to the pollution sources, suggesting the contribution of anthropogenic sources from the industrial complex. In accordance with the present results, LG showed Cu and Pb levels exceeding the background soil concentrations proposed for Puchuncaví by Tapia-Gatica et al. (2020) [9]. The average Cu level in soil from LG was similar to concentrations observed at the same site by Salmanighabeshi et al. (2015) [11]. However, levels of As, Ba, Co, K, Mn, Ni, Pb, V, and Zn were lower than those observed previously [11]. In addition, As and Zn from all sites evaluated and Cu and Pb from Pu, VA, and CS, were lower than the background levels proposed by Tapia-Gatica et al. (2020) [9] for Puchuncaví soil. The proposed background concentration seems to be very high for elements such as Cu (100 mg kg−1), As (16 mg kg−1), Pb (35 mg kg−1), and Zn (122 mg kg−1) [9] given the lower levels observed at most of the sampling sites (Table 2).

3.1.3. Comparison of Element Concentrations in Soil and Cupressus macrocarpa Leaves

Plants require trace elements in their growth and metabolism, and deficiency in as well as excess levels of trace elements in soils impairs their growth and development. For primary production through photosynthesis, in addition to water and carbon dioxide, plants require some inorganic mineral nutrients that are taken up through the root system. In this process, elements are transferred from soil to plant, and the leaf mineral composition should reflect the complex interaction between the plant and the local soil composition [24]. Soil contamination with trace elements has become a growing global environmental and human health crisis, especially in the Puchuncaví Valley area [8,9].
The element concentrations were greater in soil than in leaves for Al, As, Co, Fe, Mn, Pb, Ti, and V. In accordance with the present results, previous studies have demonstrated that elements such as Co and V in soil exceed native plant levels from the Puchuncaví Valley [12].
On the other hand, in this study, the levels of elements such as Ca, K, Mg, Mo, Na, Ni, S, and Sr in Cupressus leaves were higher than those in the soil. These results may be partly explained by the fact that the Puchuncaví Valley is an area of high pollution load, rich in anthropogenic trace elements commonly emitted from the industrial complex, such as As, Cu, Mo, Pb, Sb, and Zn [5,14]. In addition, elements such as Ca, K, and Mg play a fundamental role in the growth and development of plants.

3.2. Element Source by Principal Component Analysis (PCA)

To reveal relationships among elements and to identify pollution sources, PCA with Varimax rotation multivariate statistical techniques were applied to EFs in both leaves and soil. EF is a means of quantifying the enrichment of a potentially contaminant-derived element relative to background composition, thus enhancing the difference (Equations (1) and (2)) with abnormal element conditions. The leaf dataset contains the EFs of 24 trace elements from 4 monitoring sites that were submitted to principal component analysis. The elements Nd and Hg were excluded from the PCA because Hg was BLQ in all samples and Nd was the only one possible to quantify in one sample from CS. The results of the leaf PCA with Varimax rotation are presented in Table 3. The leaf PCA showed four common factors contributing to 93.20% of the total accumulated variance. Loadings are the coefficients of correlation between individual factors and the elements, and values close to unity indicate that the element is characteristic of a particular source [15]. In this study, loadings were considered significant for values of >|0.7| [14]. According to this criterion, the first factor (F1), with 37.76% of the variance, grouped elements such as Na, Al, Ti, V, Fe, Cd, La, and Ce. The association of these elements might be attributed to mineral–crustal sources. Lanthanide elements can be of diverse origins, such as tracers of fluidized-bed catalytic cracker emissions [25], motor vehicle emissions [26], and soil without pollution [27]. However, the low La/Ce (0.7 to 1.1) and La/Nd (1.7 to 2.4) ratios are consistent with impacts from the resuspension of local dust [27,28]. In addition, the association of lanthanides with other elements recognized as natural in soil from the Puchuncaví Valley, such as Al, Na, Ti, Fe, and V [5], suggests that the association of these elements might be attributed more probably to natural sources such as a mineral–crustal fraction.
The second factor (F2) (24.37% of the total variance) grouped elements such as Cu, Zn, As, Mo, and Pb. The association of these elements might be attributed to anthropogenic sources represented by copper smelting, as reported in previous studies on the area [5,11,14,29]. In addition, this was supported by the fact that the EF of these elements in Cupressus macrocarpa leaves showed significant enrichment at LG, the closest site to the IC (See Figure 2).
The third factor (F3) (17.10% of the total variance) grouped elements such as Mn, Co, and Ni. These elements in Puchuncaví soil are attributed mostly to the crustal fraction [6]. However, these elements may also originate from coal-fired power plants; while Ni has shown high concentrations of fly ash from coal-burning power plants [20], Co and Mn can be found in high concentrations in coal-derived sources [30]. It is probable that these elements in the leaves have anthropic sources such as the coal-fired power plants of the IC.
Finally, the fourth factor in leaves (F4) (13.97% of the total variance) grouped elements such as Ca, Sr, and Ba. Previously, Ca and Sr in Cupressus macrocarpa leaves have been reported as anthropogenic factors [14]. In addition, Ca can originate from the formation of CaO in the abatement of sulfur dioxide conversion to sulfur (dry desulfurization) [6]. On the other hand, Ba has been reported as a traffic marker [29]. The association of these elements might be attributed to mixed anthropic sources. The elements Mg, S, K, Cr, and Sb were not assigned to any factor found. It is important to note that Mg levels showed no significant differences between the sites, and this element is fundamental for plants because it forms part of the chlorophyll pigment. Moreover, no significant differences were observed in S. Elements such as Mg, K, and S are macroelements. It is probable that the levels of these elements in leaves have a natural source. On the other hand, Cr is potentially derived from anthropogenic sources such as power plants [30] due to its being released into the air mainly by various types of combustion processes. Moreover, Sb is potentially derived from anthropogenic sources such as copper smelting, as shown in previous studies of leaves from the Puchuncaví Valley [14].
The soil dataset contains the EFs of 17 trace elements from 4 monitoring sites that were submitted to principal component analysis. The elements S, Zn, Mo, Cd, Sb, and Hg were excluded from the PCA because Cd, Sb, and Hg were BLQ in all samples and S, Zn, and Mo were quantified in only a few samples. On the other hand, Fe was selected as the reference element (Equation (2)). The results of the soil PCA with Varimax rotation are presented in Table 4. Soil PCA showed three common factors contributing to 82.23% of the total accumulated variance. The first factor (F1), with 40.03% of the variance, grouped elements such as Al, Ni, Cu, As, Ba, and Pb. Previously, Cu, As, and Pb in soil have been reported as anthropogenic factors represented by copper smelting [5,6]. On the other hand, elements such as Al and Ni in the soil identified through positive matrix factorization (PMF) have been reported as a crustal factor [6]. However, high Ni concentrations in fly ash from coal-burning power plants were observed in an urban site in Spain [20] just as Ba has been reported as a traffic marker [29,31]. The association of these elements may probably be attributed to mixed anthropic sources at the IC.
The second factor (F2) (26.77% of the total variance) grouped elements such as Li, Na, Mg, Ca, Mn, and Sr. The association of these elements might be attributed to mineral–crustal sources. These elements in Puchuncaví soil were previously attributed mostly to the crustal fraction, according to PMF receptor modeling [6].
The third factor (F3) (15.44% of the total variance) grouped elements such as Cr and Co. These elements are potentially derived from anthropogenic sources, such as Co from power plants [30] and Cr released into the air mainly by various types of combustion processes. The association of these elements in the soil may probably be attributed to anthropic sources represented by coal-fired power plants of the IC.

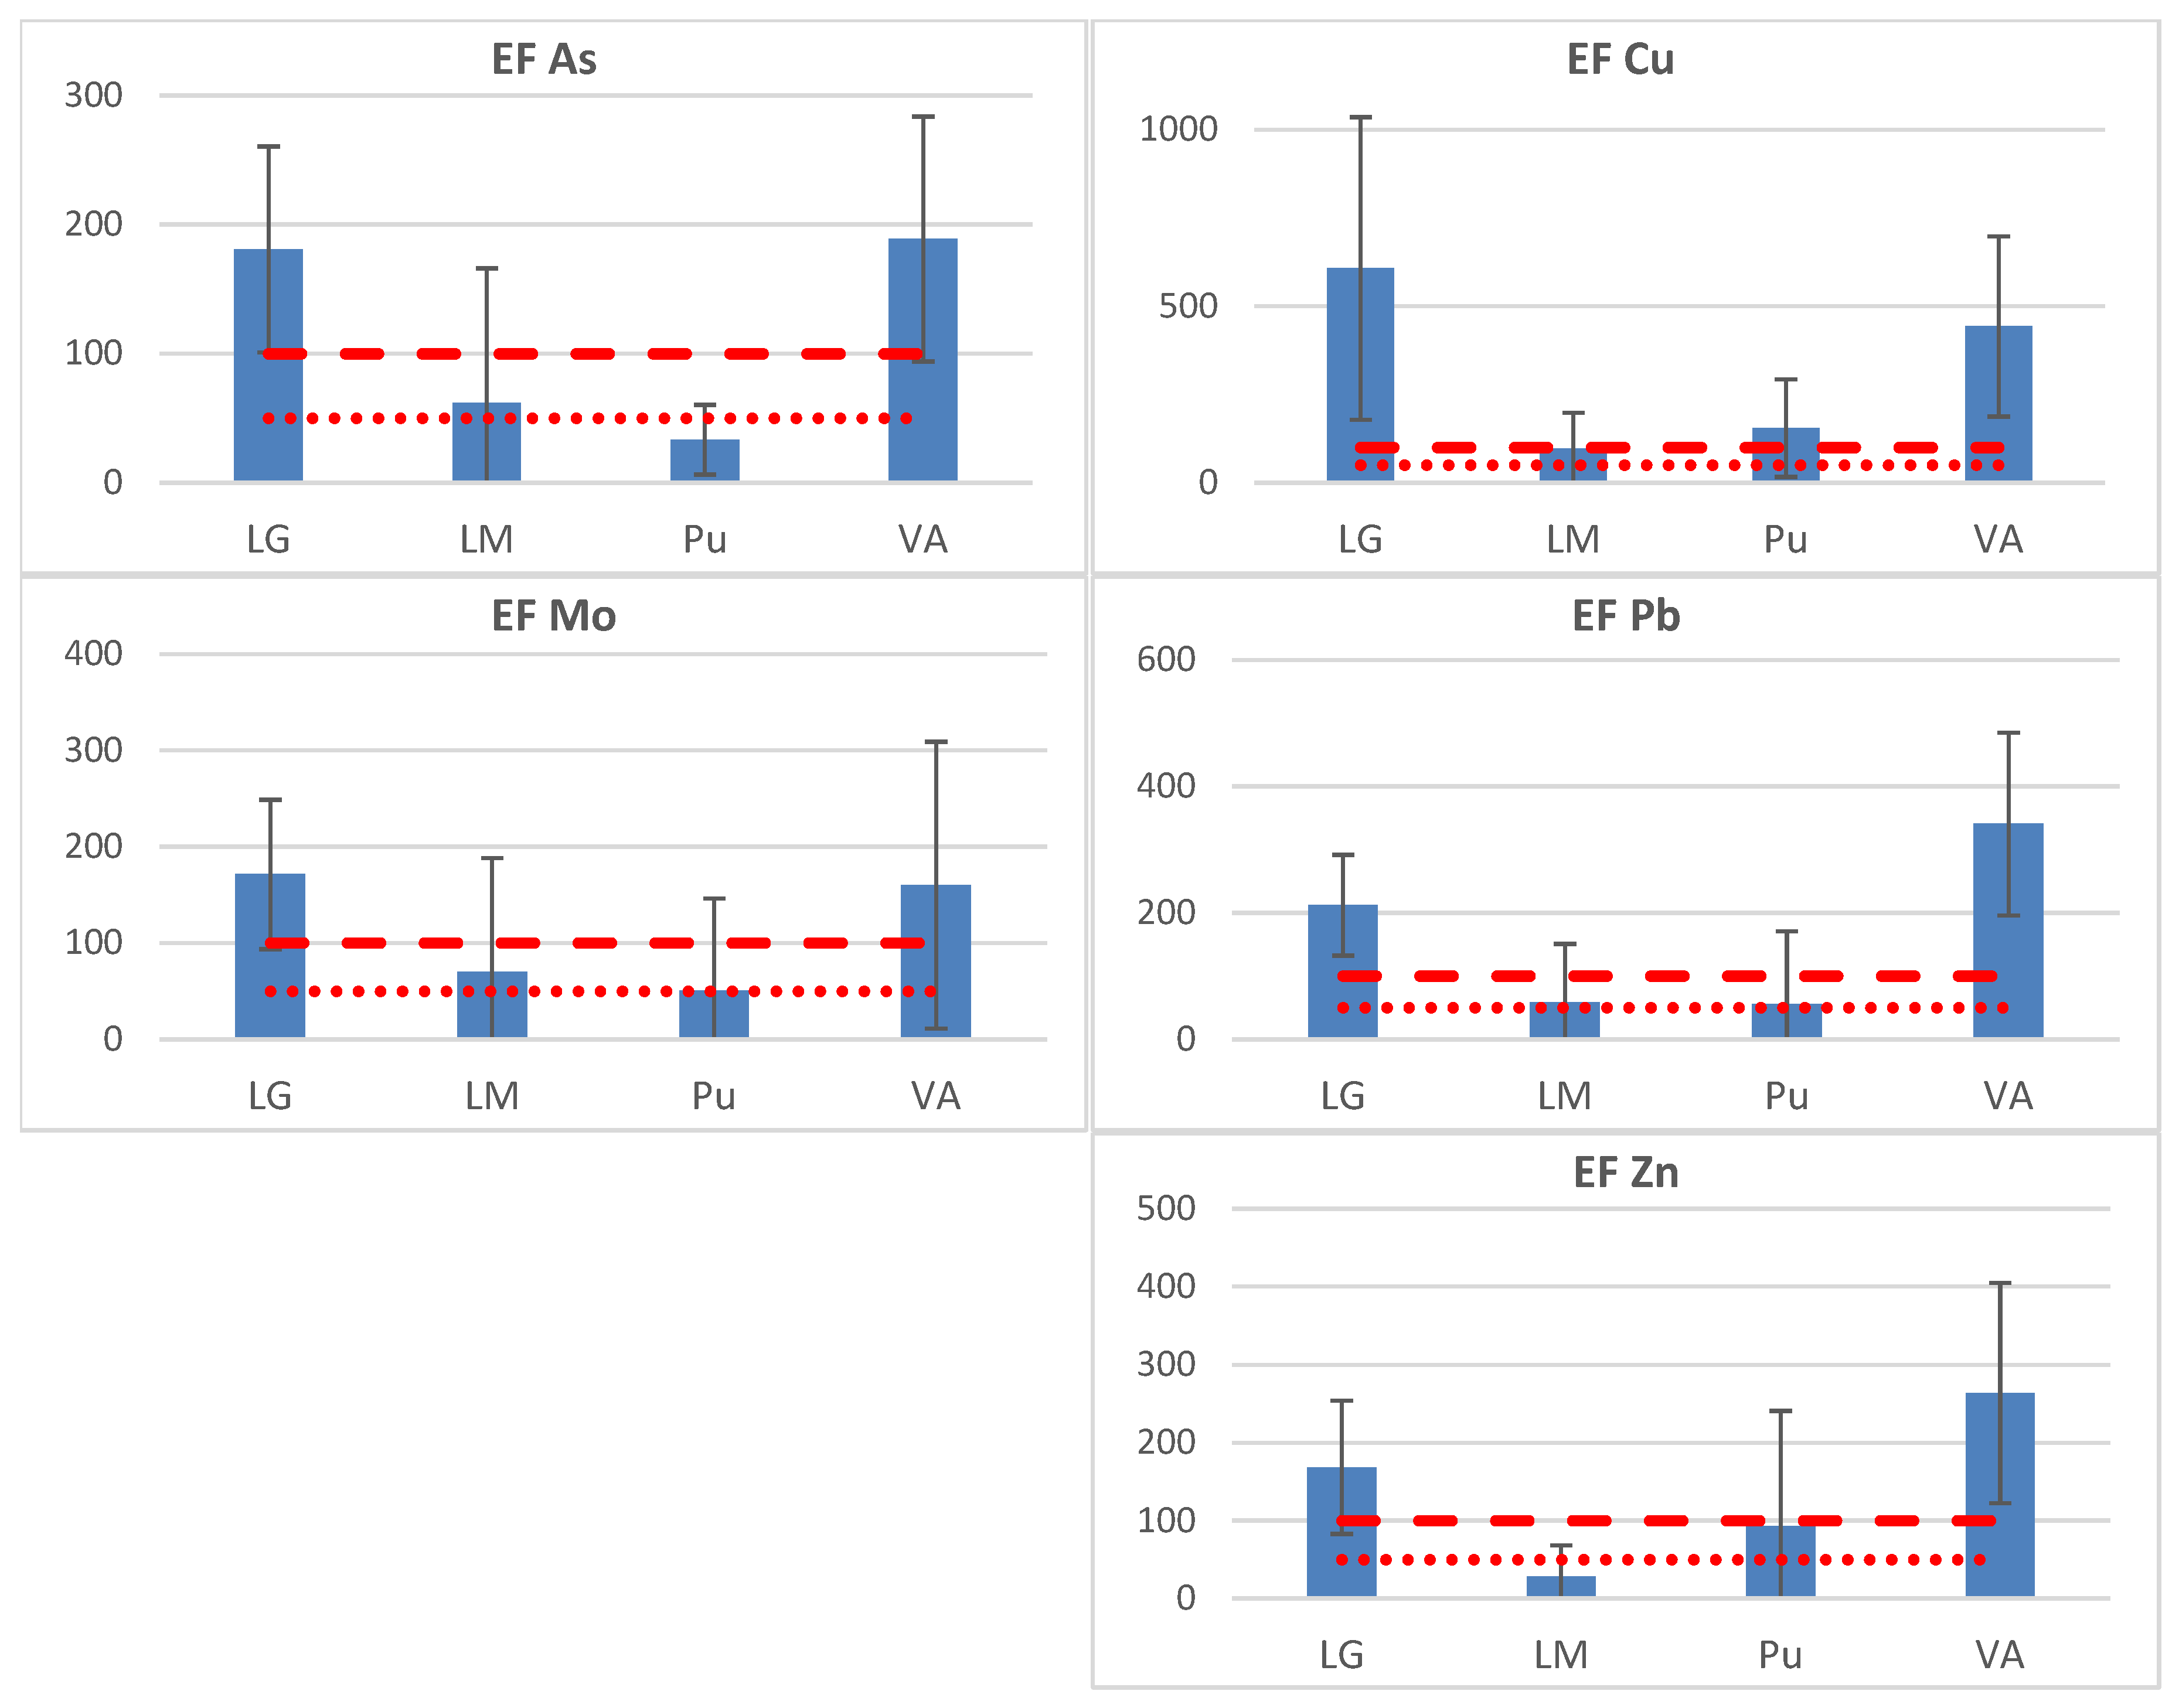
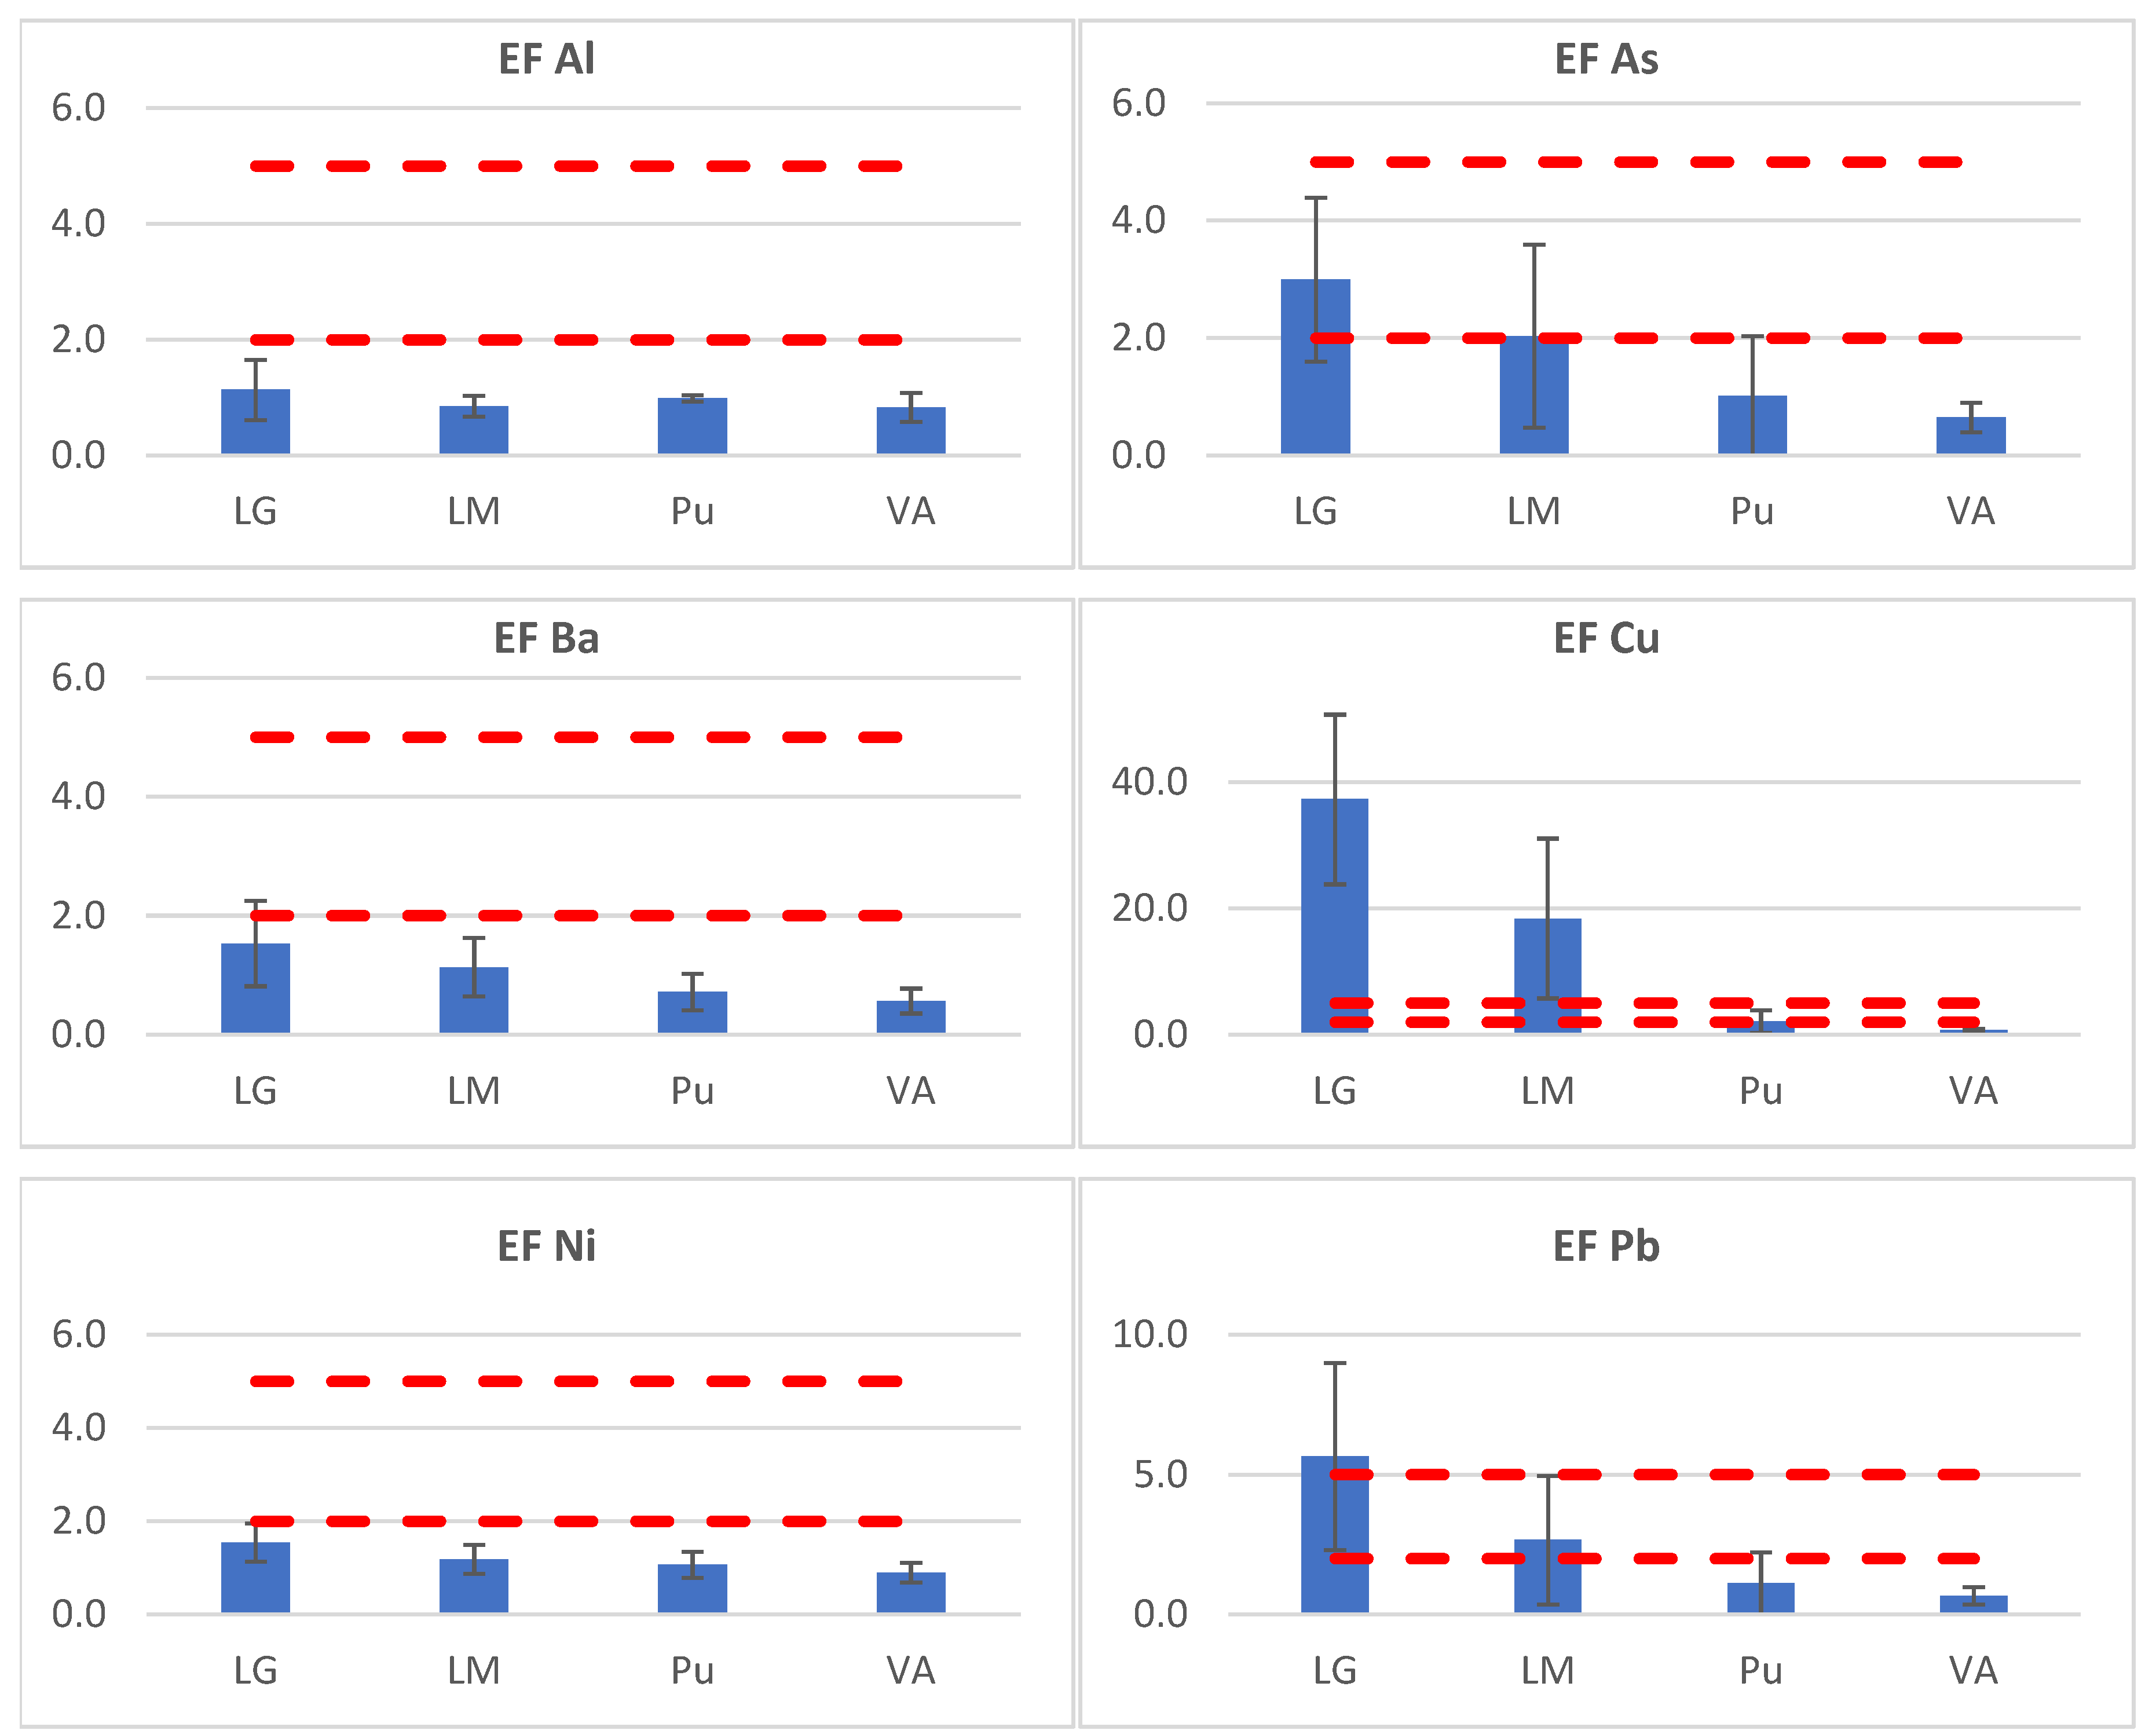
3.3. Enrichment Factors (EFs) in Leaves and Soil

Figure 2 and Figure 3 show the EFs in leaves and soil calculated according to Equations (1) and (2), respectively. In these figures are presented the EFs of anthropogenic elements from copper smelting according to Factor 2 observed in leaf PCA analyses and Factor 1 for soil (See Section 3.2). In leaves (Figure 2), LG and VA were significantly enriched in the elements As, Cu, Mo, Pb, and Zn.
Figure 2. Enrichment factor (EF%) ± standard deviation in Cupressus macrocarpa leaves for the elements As, Cu, Mo, Pb, and Zn at the 4 sampling sites evaluated. These EFs represent anthropogenic elements from copper smelting, according to PCA. The dotted lines indicate Atmosphere 14 00893 i001 EF 100 and Atmosphere 14 00893 i002 EF 50.
Atmosphere 14 00893 g002
The significant enrichment of LG and VA in Cu, Mo, Pb, and As was observed in accordance with previous studies in Cupressus macrocarpa leaves from the Puchuncaví Valley [14]. However, minor values of EF in elements such as As, Mo, and Pb were observed at sites such as LM and Pu, probably due to climatic factors such as rain and predominant winds in these areas.
In soil (Figure 3), the EFs for Cu at sites closest to the IC (LG and LM) were between very high to significant enrichment, respectively, while significant enrichment was observed for Pb from LG. Moderate enrichment was shown for Cu at Pu, As at LG and LM, and Pb at LM. The EF values for Cu, As, and Pb decreased with the distance to the IC, in accordance with previous studies of the soil from the Puchuncaví Valley [11]. The elements Al, Ni, and Ba were deficient to minimally enriched at sample sites in the Puchuncaví Valley.
Figure 3. Enrichment factor (EF) ± standard deviation in soil for the elements Al, As, Ba, Cu, Ni, and Pb at the 4 sampling sites evaluated. These EFs represent anthropogenic elements from copper smelting, according to PCA. The dotted lines indicate 2 < EF < 5 moderate enrichment.
Atmosphere 14 00893 g003
The trace elements accumulation presents differences between leaves and soil. On the one hand, the soil is the final sink, and the trace levels depend on proximity to the source, particle size, and environmental factors such as rain and predominant winds, among others [5,6,8]. On the other hand, the accumulation in leaves depends on characteristics such as leaf form, presence of hairs, epicuticular wax, and rugosity, among others [32,33,34], as well as environmental factors, showing different efficiencies of accumulation [23,33]. It is important to note that soil trace element deposition occurs on a longer time scale in contrast to leaves, due to the dynamics of element deposition in leaves, which is faster due to the constant processes of accumulation and washing.

4. Conclusions

The elemental levels in Cupressus macrocarpa leaves and soil collected around the Puchuncaví Valley were clearly affected by anthropogenic activities to a variable degree, depending on the distance from the industrial complex. The high Cu values found in both soil and leaf samples near the industrial complex (LG) showed the great influence of copper smelting and refinery.
The PCA of EFs in both soil and leaves, detected three and four factors, respectively, mainly related to the industrial complex’s copper smelter, refinery, and coal-fired power plants, as well as geogenic sources.
According to the PCA, the EFs of anthropogenic elements from copper smelting showed that LG and VA were significantly enriched in the elements Cu, Zn, As, Mo, and Pb, while the EFs in the soil at LG (the site closest to the IC) showed high enrichment for Cu and significant enrichment in Pb. The comparison of EFs in leaves and soil showed differences, the Cupressus macrocarpa EFs were higher because of the element deposition dynamics, which were faster in leaves due to the constant processes of accumulation and washing.

Supplementary Materials

The following supporting information can be downloaded at: https://www.mdpi.com/article/10.3390/atmos14050893/s1. Table S1: Instrumental conditions for digestion in microwave Ultrawave Milestone; Table S2: Instrumental conditions for ICP-MS measurements Agilent 7900; Table S3: Quality control results (µg g−1 dry weight) obtained from ICP-MS analysis of “Standard Reference Material 1575a” trace elements in pine needles (Pinus taeda); Table S4: Quality control results (µg g−1 dry weight) obtained from ICP-MS analysis of “Standard Reference Material 2709a” trace elements in San Joaquin soil.

Author Contributions

Conceptualization, T.G., X.F. and F.C.-B.; methodology, T.G., X.F. and F.C.-B.; data analysis, T.G.; investigation, T.G. and F.S.; resources, X.F. and F.S.; writing—original draft preparation, T.G.; supervision, T.G. and F.C.-B.; project administration, T.G.; funding acquisition, T.G. and F.C.-B.; writing—review and editing, T.G., X.F. and F.C.-B. All authors have read and agreed to the published version of the manuscript.

Funding

This study was funded by Fondo Nacional de Desarrollo Científico y Tecnológico FONDECYT Iniciación, grant number 11200853, and the Centre for Environmental Technologies (CETAM-UTFSM).

Institutional Review Board Statement

Not applicable.

Informed Consent Statement

Not applicable.

Data Availability Statement

Not applicable.

Acknowledgments

Ilustre Municipalidad de Puchuncaví and the Centre for Environmental Technologies (CETAM-UTFSM).

Conflicts of Interest

The authors declare no conflict of interest.

References

  1. Hardaway, C.; Sneddon, J.; Sneddon, E.; Boggavarapu, K.; Brent, J.L.; McCray, T.C.; Bowser, D.Q.; Douvris, C. Study of selected metal concentrations in sediments by inductively coupled plasma-optical emission spectrometry from a metropolitan and more pristine bayou in Southwest Louisiana, United States. Microchem. J. 2016, 127, 213–219. [Google Scholar] [CrossRef]
  2. Bussan, D.; Harris, A.; Douvris, C. Monitoring of selected trace elements in sediments of heavily industrialized areas in Calcasieu Parish, Louisiana, United States by inductively coupled plasma-optical emission spectroscopy (ICP-OES). Microchem. J. 2019, 144, 51–55. [Google Scholar] [CrossRef]
  3. De Gregori, I.; Fuentes, E.; Rojas, M.; Pinochet, H.; Potin-Gautie, M. Monitoring of copper, arsenic and antimony levels in agricultural soils impacted and non-impacted by mining activities, from three regions in Chile. J. Environ. Monit. 2003, 5, 287–295. [Google Scholar] [CrossRef]
  4. Ginocchio, R. Effects of a copper smelter on a grassland community in the Puchuncaví Valley, Chile. Chemosphere 2000, 41, 15–23. [Google Scholar] [CrossRef]
  5. Parra, S.; Bravo, M.A.; Quiroz, W.; Moreno, T.; Karanasiou, A.; Font, O.; Vidal, V.; Cereceda, F. Distribution of trace elements in particle size fractions for contaminated soils by a copper smelting from different zones of the Puchuncaví Valley (Chile). Chemosphere 2014, 111, 513–521. [Google Scholar] [CrossRef]
  6. Parra, S.; Bravo, M.A.; Quiroz, W.; Moreno, T.; Karanasiou, A.; Font, O.; Vidal, V.; Cereceda-Balic, F. Source apportionment for contaminated soils using multivariate statistical methods. Chemometr. Intell. Lab. Syst. 2014, 138, 127–132. [Google Scholar] [CrossRef]
  7. Verdejo, J.; Ginocchio, R.; Sauvé, S.; Salgado, E.; Neaman, A. Thresholds of copper phytotoxicity in field-collected agricultural soils exposed to copper mining activities in Chile. Ecotoxicol. Environ. Saf. 2015, 122, 171–177. [Google Scholar] [CrossRef]
  8. Salmani-Ghabeshi, S.; Palomo-Marín, M.R.; Bernalte, E.; Rueda-Holgado, F.; Miró-Rodríguez, C.; Cereceda-Balic, F.; Fadic, X.; Vidal, V.; Funes, M.; Pinilla-Gil, E. Spatial gradient of human health risk from exposure to trace elements and radioactive pollutants in soils at the Puchuncaví-Ventanas industrial complex, Chile. Environ. Pollut. 2016, 218, 322–330. [Google Scholar] [CrossRef]
  9. Tapia-Gatica, J.; González-Miranda, I.; Salgado, E.; Bravo, M.; Tessini, C.; Dovletyarova, E.; Paltseva, A.; Neaman, A. Advanced determination of the spatial gradient of human health risk and ecological risk from exposure to As, Cu, Pb, and Zn in soils near the Ventanas Industrial Complex (Puchuncaví, Chile). Environ. Pollut. 2020, 258, 113488. [Google Scholar] [CrossRef]
  10. Tapia-Gatica, J.; Selles, I.; Bravo, M.; Tessini, C.; Barros-Parada, W.; Novoselov, A.; Neaman, A. Global issues in setting legal limits on soil metal contamination: A case study of Chile. Chemosphere 2022, 290, 133404. [Google Scholar] [CrossRef]
  11. Salmanighabeshi, S.; Palomo-Marín, M.R.; Bernalte, E.; Rueda-Holgado, F.; Miró-Rodríguez, C.; Fadic-Ruiz, X.; Vidal-Cortez, V.; Cereceda-Balic, F.; Pinilla-Gil, E. Long-term assessment of ecological risk from deposition of elemental pollutants in the vicinity of the industrial area of Puchuncaví-Ventanas, central Chile. Sci. Total Environ. 2015, 527–528, 335–343. [Google Scholar] [CrossRef] [PubMed]
  12. Salmani-Ghabeshi, S.; Fadic-Ruiz, X.; Miró-Rodríguez, C.; Pinilla-Gil, E.; Cereceda-Balic, F. Trace Element Levels in Native Plant Species around the Industrial Site of Puchuncaví-Ventanas (Central Chile): Evaluation of the Phytoremediation Potential. Appl. Sci. 2021, 11, 713. [Google Scholar] [CrossRef]
  13. Muñoz, A.A.; Klock-Barría, K.; Sheppard, P.; Aguilera-Betti, I.; Toledo, I.; Christie, D.; Gorena, T.; Gallardo, L.; Gonzalez-Reyes, A.; Lara, A.; et al. Multidecadal environmental pollution in a mega-industrial area in central Chile registered by tree rings. Sci. Total Environ. 2019, 696, 133915. [Google Scholar] [CrossRef]
  14. Gorena, T.; Fadic, X.; Cereceda-Balic, F. Cupressus macrocarpa leaves for biomonitoring the environmental impact of an industrial complex: The case of Puchuncaví-Ventanas in Chile. Chemosphere 2020, 260, 127521. [Google Scholar] [CrossRef]
  15. CODELCO (Corporación Nacional del Cobre de Chile), 2016 Annual Report. 2016. Available online: https://www.codelco.com/prontus_codelco/site/edic/base/port/memorias.html (accessed on 21 July 2022).
  16. Figueiredo, A.M.G.; Nogueira, C.A.; Saiki, M.; Milian, F.M.; Domingos, M. Assessment of atmospheric metallic pollution in the metropolitan region of São Paulo, Brazil, employing Tillandsia usneoides L. as biomonitor. Environ. Pollut. 2007, 145, 279–292. [Google Scholar] [CrossRef]
  17. De La Cruz, A.R.H.; De La Cruz, J.K.H. Trace element biomonitoring in the Peruvian andes metropolitan region using Flavoparmelia caperata lichen. Chemosphere 2018, 210, 849–858. [Google Scholar] [CrossRef]
  18. Barbier, M. The Importance of Enrichment Factor (EF) and Geoaccumulation Index (Igeo) to Evaluate the Soil Contamination. J. Geol. Geophys. 2016, 5, 1000237. [Google Scholar] [CrossRef]
  19. Kaiser, H.F. The Varimax criterion for analytic rotation in factor analysis. Psychometrika 1958, 23, 187–200. [Google Scholar] [CrossRef]
  20. Rodríguez, J.A.; De Arana, C.; Ramos-Miras, J.J.; Gil, C.; Boluda, R. Impact of 70 years urban growth associated with heavy metal pollution. Environ. Pollut. 2015, 196, 156–163. [Google Scholar] [CrossRef] [PubMed]
  21. Rossini Oliva, S.; Mingorance, M.D. Assessment of airborne heavy metal pollution by aboveground plant parts. Chemosphere 2006, 65, 177–182. [Google Scholar] [CrossRef]
  22. Al-Alawi, M.; Mandiwana, K. The use of Aleppo pine needles as a bio-monitor of heavy metals in the atmosphere. J. Hazard. Mater. 2007, 148, 43–46. [Google Scholar] [CrossRef] [PubMed]
  23. Bui, H.-T.; Odsuren, U.; Kim, S.-Y.; Park, B.-J. Particulate Matter Accumulation and Leaf Traits of Ten Woody Species Growing with Different Air Pollution Conditions in Cheongju City, South Korea. Atmosphere 2022, 13, 1351. [Google Scholar] [CrossRef]
  24. Jiménez-Ballesta, R.; Bravo, S.; Amorós, J.A.; Pérez-de-los-reyes, C.; García-Pradas, J.; Sanchez, M.; García-Navarro, F.J. Soil and Leaf Mineral Element Contents in Mediterranean Vineyards: Bioaccumulation and Potential Soil Pollution. Water Air Soil Pollut. 2022, 233, 20. [Google Scholar] [CrossRef]
  25. Du, L.; Turner, J. Using PM2.5 lanthanoid elements and nonparametric wind regression to track petroleum refinery FCC emissions. Sci. Total Environ. 2015, 529, 65–71. [Google Scholar] [CrossRef]
  26. Kulkarni, P.; Chellam, S.; Flanagan, J.B.; Jayanty, R.K.M. Microwave digestion ICP-MS for elemental analysis in ambient airborne fine particulate matter: Rare earth elements and validation using a filter borne fine particle certified reference material. Anal. Chim. Acta. 2007, 599, 170–176. [Google Scholar] [CrossRef]
  27. Kulkarni, P.; Chellam, S.; Fraser, M.P. Lanthanum and lanthanides in atmospheric fine particles and their apportionment to refinery and petrochemical operations in Houston, TX. Atmos. Environ. 2006, 40, 508–520. [Google Scholar] [CrossRef]
  28. Owoade, O.K.; Fawole, O.G.; Olise, F.S.; Ogundele, L.T.; Olaniyi, H.B.; Almeida, M.S.; Ho, M.D.; Hopke, P.K. Characterization and source identification of airborne particulate loadings at receptor site-classes of Lagos Mega-City, Nigeria. J. Air Waste Manag. Assoc. 2013, 63, 1026–1035. [Google Scholar] [CrossRef]
  29. Rueda-Holgado, F.; Calvo-Blázquez, L.; Cereceda-Balic, F.; Pinilla-Gil, E. Temporal and spatial variation of trace elements in atmospheric deposition around the industrial area of Puchuncaví-Ventanas (Chile) and its influence on exceedances of lead and cadmium critical loads in soils. Chemosphere 2016, 144, 1788–1796. [Google Scholar] [CrossRef]
  30. Talan, D.; Huang, Q. A review study of rare Earth, Cobalt, Lithium, and Manganese in Coal-based sources and process development for their recovery. Miner. Eng. 2022, 189, 107897. [Google Scholar] [CrossRef]
  31. Schauer, J.J.; Lough, G.C.; Shafer, M.M.; Christensen, W.F.; Arndt, M.F.; De Minter, J.T.; Park, J.-S. Characterization of Metals Emitted from Motor Vehicles; Research Report, 133; Health Effects Institute: Boston, MA, USA, 2006. [Google Scholar]
  32. Dzierżanowski, K.; Popek, R.; Gawrońska, H.; Sæbø, A.; Gawroński, S.W. Deposition of Particulate Matter of Different Size Fractions on Leaf Surfaces and in Waxes of Urban Forest Species. Int. J. Phytoremediation 2011, 13, 1037–1046. [Google Scholar] [CrossRef]
  33. Sæbø, A.; Popek, R.; Nawrot, B.; Hanslin, H.M.; Gawronska, H.; Gawronski, S.W. Plant species differences in particulate matter accumulation on leaf surfaces. Sci. Total Environ. 2012, 427–428, 347–354. [Google Scholar] [CrossRef] [PubMed]
  34. Sgrigna, G.; Sæbø, A.; Gawronski, S.; Popek, R.; Calfapietra, C. Particulate Matter deposition on Quercus ilex leaves in an industrial city of central Italy. Environ. Pollut. 2015, 197, 187–194. [Google Scholar] [CrossRef] [PubMed]
Figure 1. Sampling sites area in the Puchuncaví Valley.
Atmosphere 14 00893 g001
Table 3. Matrix of loads for principal component analysis (PCA) with Varimax rotation in leaves 1.
EF Element F1F2F3F4
Na 0.9510.0230.0400.064
Mg 0.683−0.0800.3610.581
Al0.9300.2760.2050.096
S 0.2660.5370.4770.416
K 0.4250.1110.6270.625
Ca0.0360.3840.2510.878
Ti 0.9440.2020.2430.016
V 0.9400.2660.2000.001
Cr0.5690.5530.504−0.061
Mn 0.0680.0140.9840.024
Fe 0.8250.4990.2340.107
Co0.2990.3290.8690.155
Ni 0.5310.1700.7620.110
Cu0.4750.746−0.1300.082
Zn0.1260.7770.4090.402
As0.3910.8530.1600.237
Sr −0.3570.6000.0040.703
Mo 0.4910.7870.1440.252
Cd 0.758−0.200−0.0930.234
Sb 0.5980.5330.3540.342
Ba 0.3000.539−0.1900.750
La 0.8820.3140.2300.175
Ce 0.9180.2870.2250.044
Pb 0.1050.9210.1750.255
% Cumulative variance37.7662.1379.2393.20
1 The significant variables (values > |0.7|) are bolded.
Table 4. Matrix of loads for principal component analysis (PCA) with Varimax rotation in soil 1.
EF ElementF1F2F3
Li0.0120.973−0.005
Na0.3820.831−0.056
Mg0.6340.705−0.045
Al0.7450.0630.429
K0.5370.687−0.365
Ca0.0860.9840.043
Ti0.5000.259−0.013
V0.0420.3400.631
Cr0.147−0.0500.865
Mn0.1060.7390.487
Co0.3310.2430.768
Ni0.8520.3100.370
Cu0.9650.091−0.019
As0.8700.3820.174
Sr0.1350.9220.314
Ba0.7950.2960.180
Pb0.9510.1850.162
% Cumulative variance40.0366.7982.23
1 The significant variables (values > |0.7|) are bolded.
Disclaimer/Publisher’s Note: The statements, opinions and data contained in all publications are solely those of the individual author(s) and contributor(s) and not of MDPI and/or the editor(s). MDPI and/or the editor(s) disclaim responsibility for any injury to people or property resulting from any ideas, methods, instructions or products referred to in the content.

