Article

Analysis of Data on Air Pollutants in the City by Machine-Intelligent Methods Considering Climatic and Geographical Features

by
Nurlan Temirbekov
1,2,
Syrym Kasenov
1,2,*,
Galym Berkinbayev
3,
Almas Temirbekov
1,2,
Dinara Tamabay
1,2 and
Marzhan Temirbekova
1,4
1
National Engineering Academy of RK, Almaty 050010, Kazakhstan
2
Faculty of Mechanics and Mathematics, Al-Farabi Kazakh National University, Almaty 050040, Kazakhstan
3
Limited Liability Partnership “Ecoservice-S”, Almaty 050009, Kazakhstan
4
Department of International Cooperation and Academic Mobility, Almaty University of Power Engineering and Telecommunications Named after G. Daukeyev, Almaty 050013, Kazakhstan
*
Author to whom correspondence should be addressed.
Atmosphere 2023, 14(5), 892; https://doi.org/10.3390/atmos14050892
Submission received: 14 April 2023 / Revised: 11 May 2023 / Accepted: 16 May 2023 / Published: 20 May 2023
(This article belongs to the Section Atmospheric Techniques, Instruments, and Modeling)

Abstract

:
In the world, air pollution ranks among the primary sources of risk to human health and the environment. To assess the risk of impact of atmospheric pollution, a comprehensive research cycle was designed to develop a unified ecosystem for monitoring air pollution in industrial cities in Kazakhstan. Research involves analyzing data for the winter period from 20 automated monitoring stations (AMS) located in Almaty and conducting chemical-analytical studies of snowmelt water samples from 22 points to identify such pollutants as fine particulate matters, petroleum products, and heavy metals. Research includes a bio-experiment involving the cultivation of watercress on samples of melt water collected from snow cover to examine the effects of pollution on plants. In the framework of this research, we determined API based on data obtained from AMS. In order to determine the influence of atmospheric pollution on the environment, a multiple regression model was developed using machine learning algorithms to reveal the relationship between the bio-experiment data and data on pollutants of chemical-analytical research. The results revealed a wide spread of pollutants in the snow cover of the urban environment, a correlation between pollutants in the snow cover and the airspace of the city, and their negative impact on flora.

1. Introduction

Almaty is the largest megalopolis of Kazakhstan located in the foothills of the Trans–Ili Alatau. Currently, the city is a cultural, economic, scientific, and educational center with a population of 2,147,113 people [1], which is about 12% of the total population of the country.
The city of Almaty is located at the foot of the Tien Shan Mountains (the Trans–Ili Alatau ridge), in the southeastern part of the Republic of Kazakhstan. Almaty is a unique city in terms of its physical, geographical, and climatic characteristics, which have a great influence on its ecological features.
The climate of the city of Almaty is sharply continental characterized by the influence of pronounced mountain–valley circulations and a sufficiently high belt, which is especially brightly felt in the northern part of the city located in the transition zones of mountain slopes to the plain [2,3].
With the altitude zone and the peculiarity of the location in the heart of the mainland, which cools down quickly in the winter, the climate of Almaty is cool unlike Tbilisi, Sofia, Barcelona, and other Mediterranean cities located on the same 43rd parallel [4].
In Almaty’s foothill zone, weak self-purification resources and low wind speeds are observed throughout the year, with up to 71% weak winds in summer and 79% in winter. The average annual wind speed is 1.7 m/s, rising to 2.2 m/s only in the warm season due to frontal processes and mining circulation. The mountains create resistance to the movement of air masses from the north, which hinders optimal aeration by mountain runoff, limiting it to the upper and southern parts within 20 km of the foothills. Polluted air is removed from the northern part of the city through airflows related to the general atmospheric circulation, but temperature inversions in the lower layer of the troposphere exacerbate the situation, leading to smog with a thickness of over 300 m under certain weather conditions [5,6]. The city experiences two main air flow directions—regional sublatitudinal, and local submeridional—caused by winds from the southwest to northeast, and mountain–valley wind circulation, respectively. However, the city’s location in an unventilated foothill basin results in poor air quality, as it is in an “aerodynamic shadow” regardless of wind direction. The atmosphere self-purification rate is only average for 2.4 h at night and 5.8 h in the daytime, and overall wind self-purification factors are insufficient to maintain acceptable air hygiene [7]. Another important factor is the mountain–valley circulation. Although mountain–valley circulation in general should contribute to the purification of the air basin, it can contribute to the transfer of pollutants [8]. During the daytime, the polluted air, together with the local wind from the high-pressure area above the city, is directed up the mountain gorges, reaching the high-altitude areas. At night, the opposite picture is observed—the air from the high-pressure area in the mountains descends the gorges and river valleys to the city, thereby displacing polluted air. The planning structure of Almaty is determined by the complex landscape and geographical conditions of the city location where residential areas predominate. More than 70% of industrial enterprises are located in the northern and central districts of the city. In recent years, there has been a tendency to increase the density and height of buildings in the southern part of the city, which is a transit zone of mountain air flow.
Rapid socio-economic development, constant population growth, lack of use of the best available technologies (BAT) in industrial enterprises and thermal power plants, undeveloped public transport infrastructure, and poor environmental education of the population have caused the city of Almaty to become one of the most polluted cities in Kazakhstan [9].
In 2021, Kazakhstan ranked 23rd in the list of the most polluted countries in the world [10]. Most cities in Kazakhstan are not included in the global air quality ratings due to the lack of monitoring data associated with global databases. This is typical for many cities of the post-Soviet space.
Air pollution, which is a major environmental health risk, is a particular problem. According to a study published by the World Bank [11], air pollution cost the globe about $8.1 trillion in 2019, which is equivalent to 6.1 percent of the global GDP. More than 95 percent of deaths caused by air pollution occur in low- and middle-income countries.
It was found that fine particulate matter (PM2.5) [12,13] is the fifth most important global mortality factor, causing 7.6% of the total number of deaths worldwide in 2015 [14].
In [15,16], the spread of chronic obstructive pulmonary disease (COPD) with concomitant diseases, such as cardiovascular diseases and a history of pneumonia, was investigated for some CIS countries. The prevalence of COPD “diagnosed by spirometry” was 31.9, 66.7, and 37.5 per 1000 people in Kiev (Ukraine), Almaty (Kazakhstan), and Baku (Azerbaijan), respectively. According to the results, it can be seen that the indicator in Almaty is 2.09 times higher than in Kiev and 1.77 times higher than in Baku.
In [17,18], the health risks associated with the level of atmospheric air pollution in twenty-six cities of Kazakhstan were considered. An extremely high risk of chronic effects of exposure to heavy metals was identified in Ust-Kamenogorsk, Almaty, and Balkhash. There was an increased level of heavy metals such as barium (Ba), manganese (Mn), lead (Pb), vanadium (V), and zinc (Zn) in the blood of residents of Aksu and Ust-Kamenogorsk, possibly due to the activities of metallurgical enterprises.
According to estimates, in 2019, atmospheric air pollution caused the premature death of 4.2 million people worldwide [19].
In 2015, the total volume of primary energy consumed in Almaty amounted to 42.4 billion kWh, of which coal, natural gas, and automobile fuel accounted for about 30% each, respectively [20]. Coal and gas are mainly used for heat generation or cogeneration of thermal and electric energy.
Additionally, increased concentrations of harmful substances such as nitrogen dioxide (NO2) and carbon monoxide (CO) in Almaty indicate the contribution of the urban transport sector [21]. The quality of petroleum products is one of the problems due to frequent cases of non-compliance with fuel quality standards.
Moreover, taking into account the fact that the number of registered passenger cars has been increasing in recent years, ultimately, as of May 2022, the number of passenger cars in Almaty has reached 508.7 thousand vehicles [22], excluding unregistered vehicles entering the city daily from suburban areas and regions.
The results of the study of air quality in industrial cities carried out by foreign and domestic scientists indicate a lack of information about atmospheric pollution and note the need for detailed studies [20,21,22].
The methods and approaches of atmospheric air research used in the scientific literature can be conditionally divided into physico-chemical methods of analysis, probabilistic and statistical methods, artificial intelligence methods with elements of machine learning, and methods of mathematical and computer modeling based on systems of differential equations.
In [23], the air quality in Almaty was assessed using the DPSIR approach. The focus is on the component of transport traffic, which is the main source of air pollution in the city. The driving forces and pressures were considered, and a detailed chemical analysis of samples of gasoline, car exhaust gases, and ambient air was carried out. A wide range of organic substances, including aliphatic, aromatic, and polycyclic aromatic hydrocarbons, was found in the urban air.
In [24], spatial and temporal patterns of pollutants such as PM10, PM2.5, NO2, SO2, and CO in Almaty in the period from 2013 to 2018 were investigated. Annual concentrations of pollutants were obtained from the newsletter on the state of the environment (Kazhydromet) [25]. The data showed that the average annual concentrations of PM10, PM2.5, and NO2 exceeded the WHO annual limits by 5.3, 3.9, and 3.2 times, respectively. The difference between winter and summer seasons was more noticeable for PM2.5 than for other pollutants.
The research in [26] is devoted to the study of various air pollutants in eight cities of Kazakhstan during the quarantine period due to COVID-19, using data from the National Air Quality Monitoring Network. A positive effect of the COVID-19 quarantine (spring 2020) on NO2 and CO levels was observed in five and three cities, respectively.
The authors of [26] claim that according to the results of the studied industrial cities (Ust-Kamenogorsk and Karaganda), quarantine measures had no effect on air quality, but seasonal changes were significant. In addition, despite some improvements during the quarantine period, air quality in seven of the eight cities remained below the safety level. In our opinion, this issue is debatable and requires further scientific research using methods of numerical modeling of the microclimate of the city and machine learning, which are well-established approaches used by the world’s leading centers in this direction.
Studies conducted at the Center for Physico-Chemical Methods of Analysis (CPCMA) of Al-Farabi Kazakh National University [23,24,25,26] show a qualitative result only for one-time experimental studies, but do not provide for constant monitoring of air quality.
A probabilistic statistical model proposed in [27,28] provides an alternative approach for modeling the spread of harmful impurities in the atmosphere. This method significantly reduces the number of calculations required without compromising accuracy. The Monte Carlo method is used to determine the intensity of impurity transitions in the atmosphere. The concentration fractions entering and leaving the cell in the expected directions are calculated. Computational experiments have demonstrated that this approach produces results in good agreement with those of other authors.
Probabilistic-statistical methods are practical when working with different types of data. However, a significant drawback in scientific research based on data analysis using probabilistic and statistical methods is that the non-stationarity of the process of atmospheric air pollution is not considered.
In recent years, with the development of computer technology, the use of deep machine learning using artificial neural networks has shown effective results in scientific research. Researchers all over the world are developing platforms for monitoring and forecasting atmospheric air quality using artificial intelligence and machine learning (ML).
The research in [29] presents the OSSO algorithm using a hybrid deep-learning model for monitoring air pollution (OSSO HDLAPM) in the environment.
The research in [30] is based on the development of an inexpensive real-time air quality monitoring system that uses an Arduino Nano development board equipped with a Wi-Fi module to efficiently send readings to the ThingSpeak online channel platform for instant display of air quality in real time.
In [31], PM10 concentrations in the Caribbean are predicted using machine learning models using six machine learning (ML) methods: support vector regression (SVR), k-nearest neighbor regression (kNN), random forest regression (RFR), gradient-enhanced regression (GBR), Tweedie regression (TR), and Bayesian ridge regression (BRR).
The use of machine learning methods is optimal in tasks for which it is impossible to create a rigorous mathematical model. The trained system, only with the available expert assessments, is able to reproduce a hidden pattern that is difficult and impossible to formalize.
A lot of scientific publications around the world, including in Kazakhstan, are devoted to various methods of modeling the spread of pollutants in the atmosphere. The works of Aidosov A. [32,33], Abdibekov U.S. [34], and Issakhov A.A. [35,36] are devoted to the mathematical modeling of the process of atmospheric air pollution.
In [37,38], a mathematical model of urban atmospheric air pollution is considered, taking into account photochemical transformations, and a set of application programs “Eco Modeling” has been developed to visualize the corresponding scenarios. The results of numerical modeling of the spread and transformation of harmful impurities against the background of mesometeorological processes, taking into account the terrain and water surfaces, are presented.
One of the main ways to reduce the impact of the main sources of atmospheric air pollution is the adoption of legislative and administrative measures that promote the development of more environmentally friendly vehicles, increase the energy efficiency of buildings, electric power, heat, and industrial production, as well as improve urban waste disposal systems, preventing exceeding the maximum permissible concentrations of harmful impurities in the atmosphere [39].
The main purpose of this study is to assess the spread of atmospheric pollutants in the urban environment using snow cover as a sampling method, as well as to study the effect of these pollutants on the flora of the environment by growing watercress. The level of influence of each pollutant on flora is determined using machine learning methods.
The purpose of our research cycle is to implement a program aimed at developing a unified ecosystem for collecting and processing air pollution monitoring data in industrial cities in Kazakhstan using modern monitoring systems, mathematical modeling, and information and communication technologies; in this work, the following parts are performed: (i) analyzing data for the winter period for 20 monitoring automated stations, which are located in the city of Almaty [40]; (ii) chemical-analytical study of samples of snowmelt water on 22 points to identify pollutants, petroleum products, and heavy metals; (iii) bio-experiment with the cultivation of watercress on samples of melt water-collected snow cover; (iv) determination of the index of atmospheric pollution and a comprehensive indicator of atmospheric pollution based on the data obtained with automated monitoring stations (AMS); and (v) development of a multiple regression model using ML algorithms, which reveals the relationship between the bio-experiment data and data on pollutants of chemical-analytical research.

2. Materials and Methods

2.1. Air Quality Data from Automated Monitoring Stations (AMS)

Atmospheric air pollution in large and industrial cities has a large spatial and temporal heterogeneity. This factor is due to the dispersed placement of emission sources, the meteorological situation, the terrain, and the heterogeneity of buildings, which affects the aerodynamics of air flows and affects the formation of technogenic anomalies.
Ecoservice-S LLP has a total of 20 AMS ecological posts (Figure 1) in the city of Almaty, the data of which are posted on the website [40]. These posts allow obtaining reliable information about the spatial distribution of pollutants throughout the city. The study of linear and nonlinear functional dependencies of the content of pollutants in the atmospheric air and their content in the snow cover allows the use of melt water for geochemical indications of urban pollution.
In the works on the assessment of the geochemical state of the snow cover, it was revealed that the concentration of pollutants in it is usually 2–3 orders of magnitude higher than in atmospheric air during the formation and precipitation of snow; therefore, chemical analyses of the content of these substances were carried out in the laboratory of chemical-analytical studies of LLP “Institute of Hydrogeology and Geoecology named after U.M. Akhmedsafin” (according to the agreement No. 18-09 dated 19 January 2023) with a high degree of reliability.
Numerical processing of the chemical analysis results has allowed obtaining a digitized map of the spread of harmful substances in the city.
Snow fell in Almaty on 10 January 2023. Representative samples of “stale” snow were taken throughout the entire thickness of the snow cover on 20–21 January 2023 at 22 points in the city. A total of 20 snow sampling points correspond to the location of AMS of Ecoservice-S LLP.
For the basis concentration, the Izveskovyi area (21st point in Figure 1) above the city of Kaskelen was selected. For comparative analysis, the selection of snow cover was carried out in the most polluted area along Al-Farabi Avenue (22nd point in Figure 1) in front of the Kazakhfilm microdistrict.

2.2. Chemical-Analytical Research

The snow cover has a high sorption quality and is an informative and convenient object for detecting technogenic pollution of the city territory. This paper presents the results of a study of the chemical composition of snow that fell in Almaty during the winter period of 2022–2023. The links between the level of anthropogenic impact on the atmosphere are analyzed.
The study covered the territories of Almaty where AMS of Ecoservice-S LLP are located.
A method of sampling snow and preparing melt water was chosen according to [41]. Snow sampling was carried out in areas where the snow cover remained intact. Snow removal was carried out using a shovel. To obtain an average sample, snow samples were taken at twenty points. Snow samples were taken on 21–22 January 2023 from all sites at the same time. The snow was placed in glass pots. Banks for obtaining melt water were placed in a warm room with a temperature of +20 °C.
The results of a chemical-analytical study to identify pollutants such as suspended solids, carbon dioxide, hydrogen sulfide, petroleum products, nitrites, sulfates, lead (Pb), zinc (Zn2+), copper (Cu), cadmium (Cd), cobalt (Co), and nickel (Ni) are presented in the following diagrams. The hydrogen index of the melt water samples was also studied.

2.3. Bio Experiment with the Cultivation of Watercress

The next method for studying the pollution of snow cover in Almaty was the method of biotesting using watercress (Lepidium sativum L.). The subject of the study is the bioindicator watercress. The experiment with the cultivation of watercress was carried out in laboratory conditions. Watercress is an annual short-fruited herbaceous plant, whose height during the ripening period is 20–50 cm. The leaves are pinnately dissected, and the upper ones are rectilinear. The plant has a thin taproot.
The experiment was conducted in a special room with natural light, at a temperature of 23–25 °C of heat. The study is aimed at studying the influence of the snow meltwater contamination level, taken at different points in Almaty, on the germination of watercress seeds.
The same melt water samples taken at 22 points in Almaty were used, which were subjected to chemical analysis in the laboratory of LLP “Institute of Hydrogeology and Geoecology named after U. M. Ahmadsafin”.
Seeds of watercress were placed in medical glass jars of 10 seeds each with an amount of snow melt water of 30 mL. Seeds of watercress were laid in 9 samples of melt water on 22 January 2023 and in 14 samples of melt water on 23 January 2023.

2.4. Building Models of Atmospheric Air Quality with Elements of Machine Learning

Based on the data on snow cover pollution obtained as a result of chemical analytical studies on seven pollutants, models were compiled using machine learning elements to identify the relationship between them and the parameters of the cultivated watercress. Three machine learning algorithms for building models were considered.

2.4.1. Problem Statement and Model Training

In this paragraph, the task of analyzing data on the impact of atmospheric air pollutants on the environment is considered. There is a need to choose the best combination of independent variables (pollutants) and dependent variables (environmental parameters) to build an optimal model.
For this purpose, data on the concentration of seven pollutants from a chemical-analytical study were selected, as well as the characteristics of the watercress bioindicator as an environmental parameter. Models describing the dependencies between them are constructed.
Data on the particulate matters (PM2.5/PM10) was selected as the independent variable X1, data on carbon dioxide (CO2) was selected as the variable X2, data on petroleum products (PP) was selected as X3, data on sulfates (SO42−) was selected as the variable X4, data on lead (Pb) was selected as the variable X5, data on zinc (Zn2+) was selected as the variable X6, and data on cadmium (Cd) was selected as the variable X7. These variables were used as input data. The data of grown watercress such as the number of germinated seeds (Y1) and the length of seedlings (Y2) and roots (Y3) were used as output data.
The task of monitoring atmospheric air quality was solved by several methods of machine learning multiple regression. Three methods were used for the study: random forest regression, AdaBoost regression, and Multilayer Perceptron regressor [42].

2.4.2. Implementation Algorithm

The analytical packages numpy, matplotlib, pandas, seaborn, scikit-learn, and keras for the Python programming language were used as tools.
The implementation algorithm is as follows:
  • Preparation of input data, reduction to a dimensionless form;
  • Getting input data;
  • Identification of the relationship between the parameters. This is done by calculating the correlation coefficients for all columns, that is, with a check for multicollinearity;
  • The following methods are considered for constructing regression models: Multilayer Perceptron Regressor (MLPR), Forest Regressor (RFR), and AdaBoost regression algorithm;
  • After preparing the models, the initial data is divided into 2 subsamples: test and training;
  • Model evaluation measures were carried out using the coefficient of determination (R-squared), MSE and MAE estimates;
  • The analysis of the results and conclusions were carried out.

3. Results

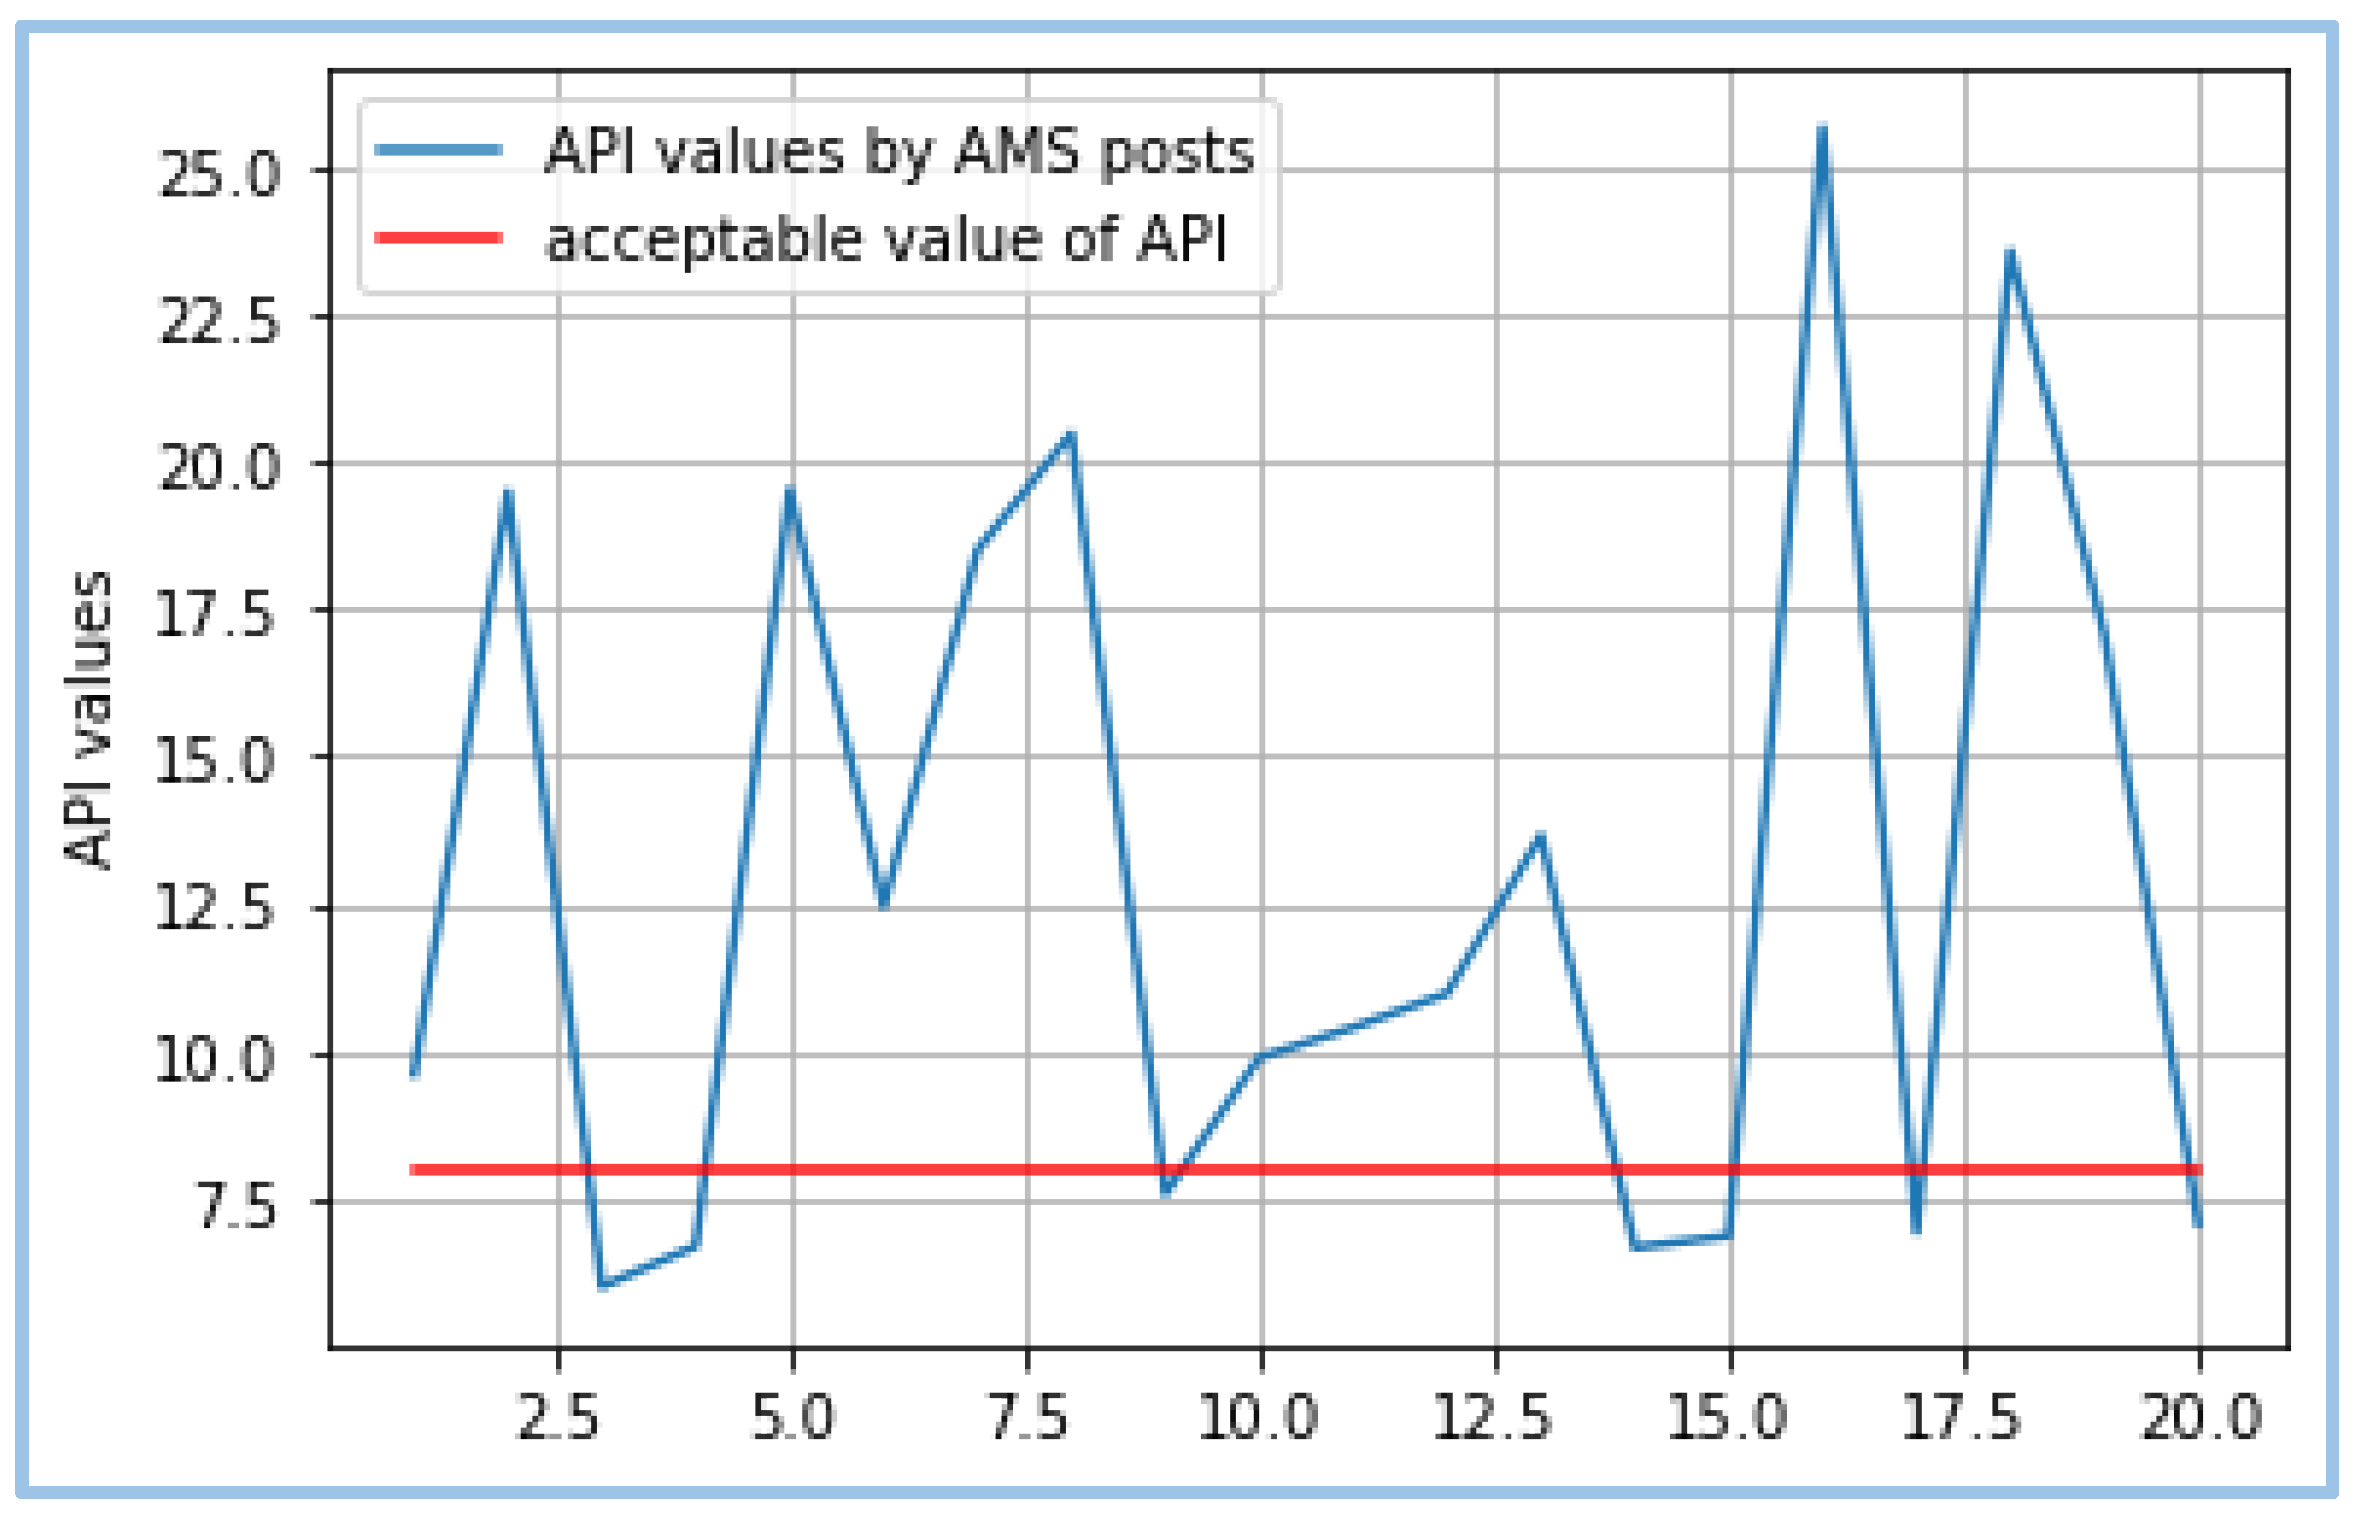
3.1. Air Pollution Index (API)

A comprehensive characteristic of the state of atmospheric air-air pollution index (API) was calculated according to the data of 20 AMS posts (Figure 1).
When calculating the complex indicator, the data of the main 5 substances were used, which make the maximum contribution to the level of atmospheric air pollution in the territory of the city of Almaty. It is set to 8 < Il < 15, which means that the level of atmospheric air pollution is above average. Figure 2 shows that the complex API is much higher than the permissible value.

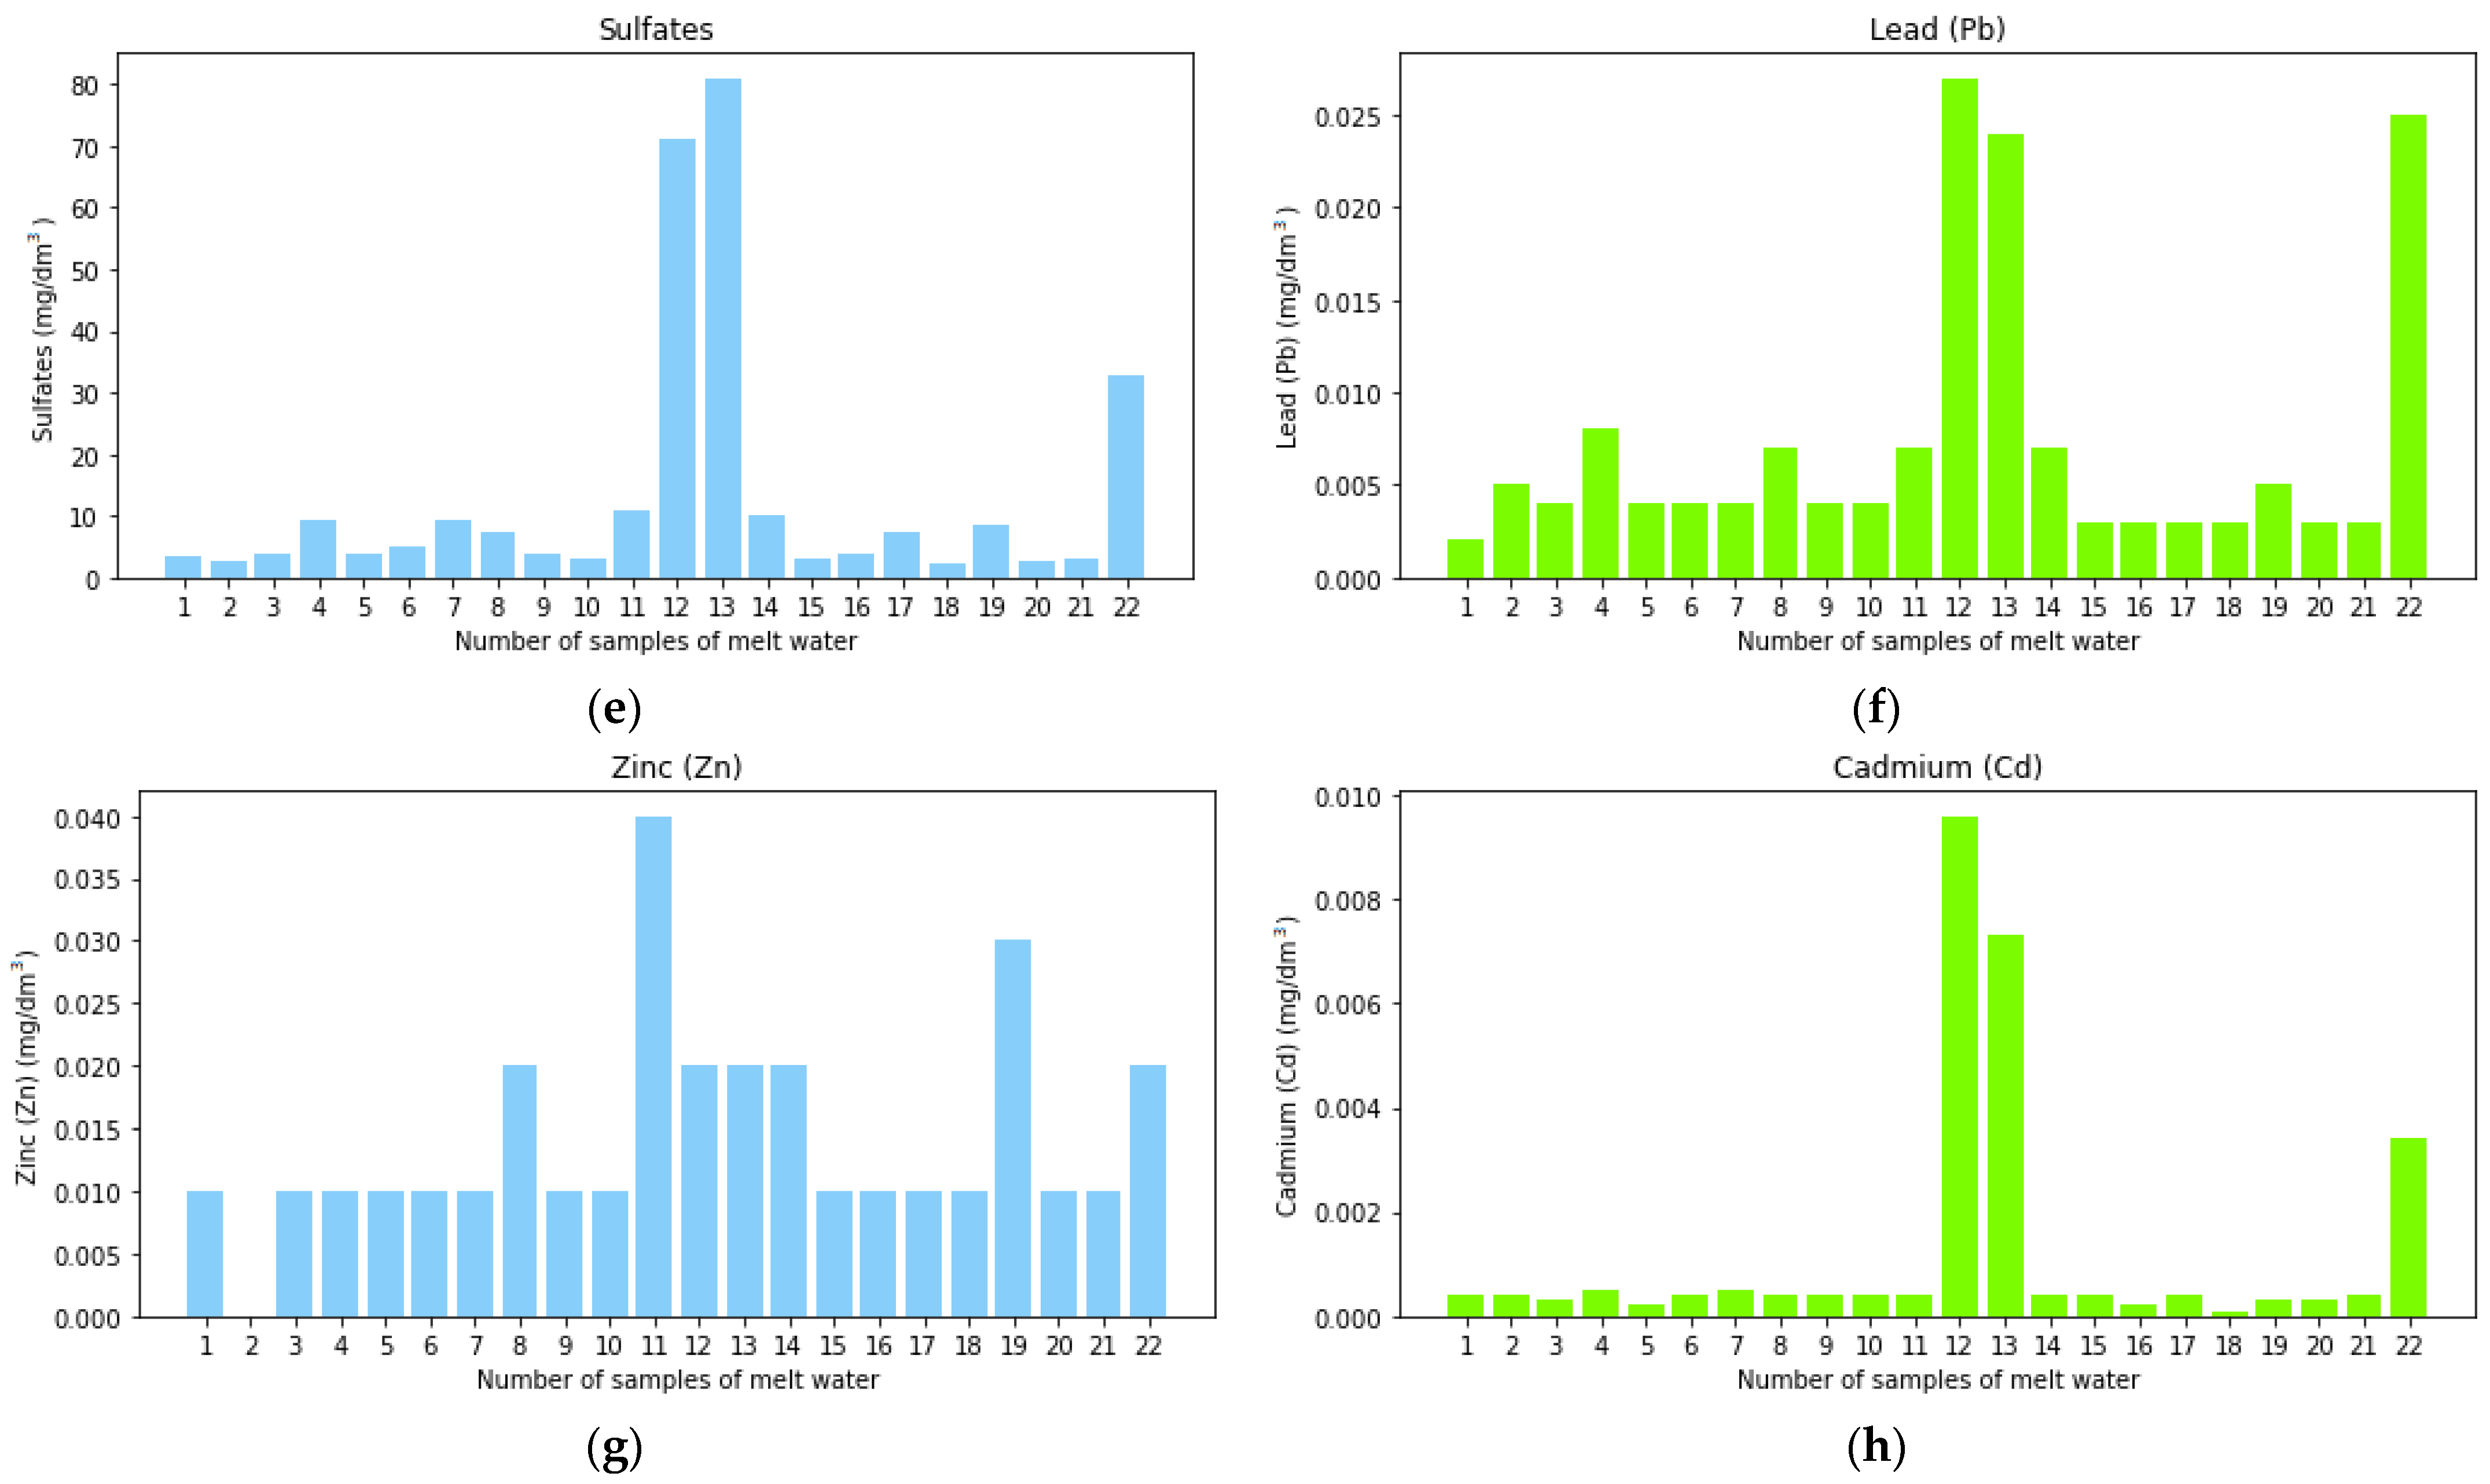
3.2. Results and Analysis of Chemical-Analytical Research

Figure 3a–h shows diagrams of indicators of the most significant pollutants identified as a result of chemical analytical studies. According to Figure 3, the numbers of AMS posts are located horizontally, and the level of pollutants is located vertically.
Indicators of pollutants such as hydrogen sulfide, nitrites, as well as heavy metals such as copper (Cu), cobalt (Co), and nickel (Ni) were not detected during the analysis or were detected in very small and acceptable quantities.
According to the results of the hydrochemical analysis, it can be said that the indicators of pollutants in the snow cover collected near automated monitoring stations located on 97 Bokeikhanov Street (12), 33 Pavlodarskaya Street (13), as well as along al-Farabi Avenue (22) were much higher than at other snow cover collection points.
The reasons why the indicators of pollutants at these points are high are the location of nearby sources of pollution. For example, a large number of vehicles move along al-Farabi Avenue (22nd point in Figure 1); despite the standards introduced for vehicles and fuel, the indicators for all pollutants (22nd point in Figure 3b–h) in this area of the city are very high.
Additionally, low indicators of pollutants were obtained at the points of Saduakasuly str. 47 (school No. 176) (15), Kerey Zhanibek Khandar str. 276 (18), and on the territory of the Medeu Natural Park (20) according to the data.
Low readings of pollutants can be explained by the fact that these points are located outside the city or on its outskirts, as well as there are no sources of pollution nearby.

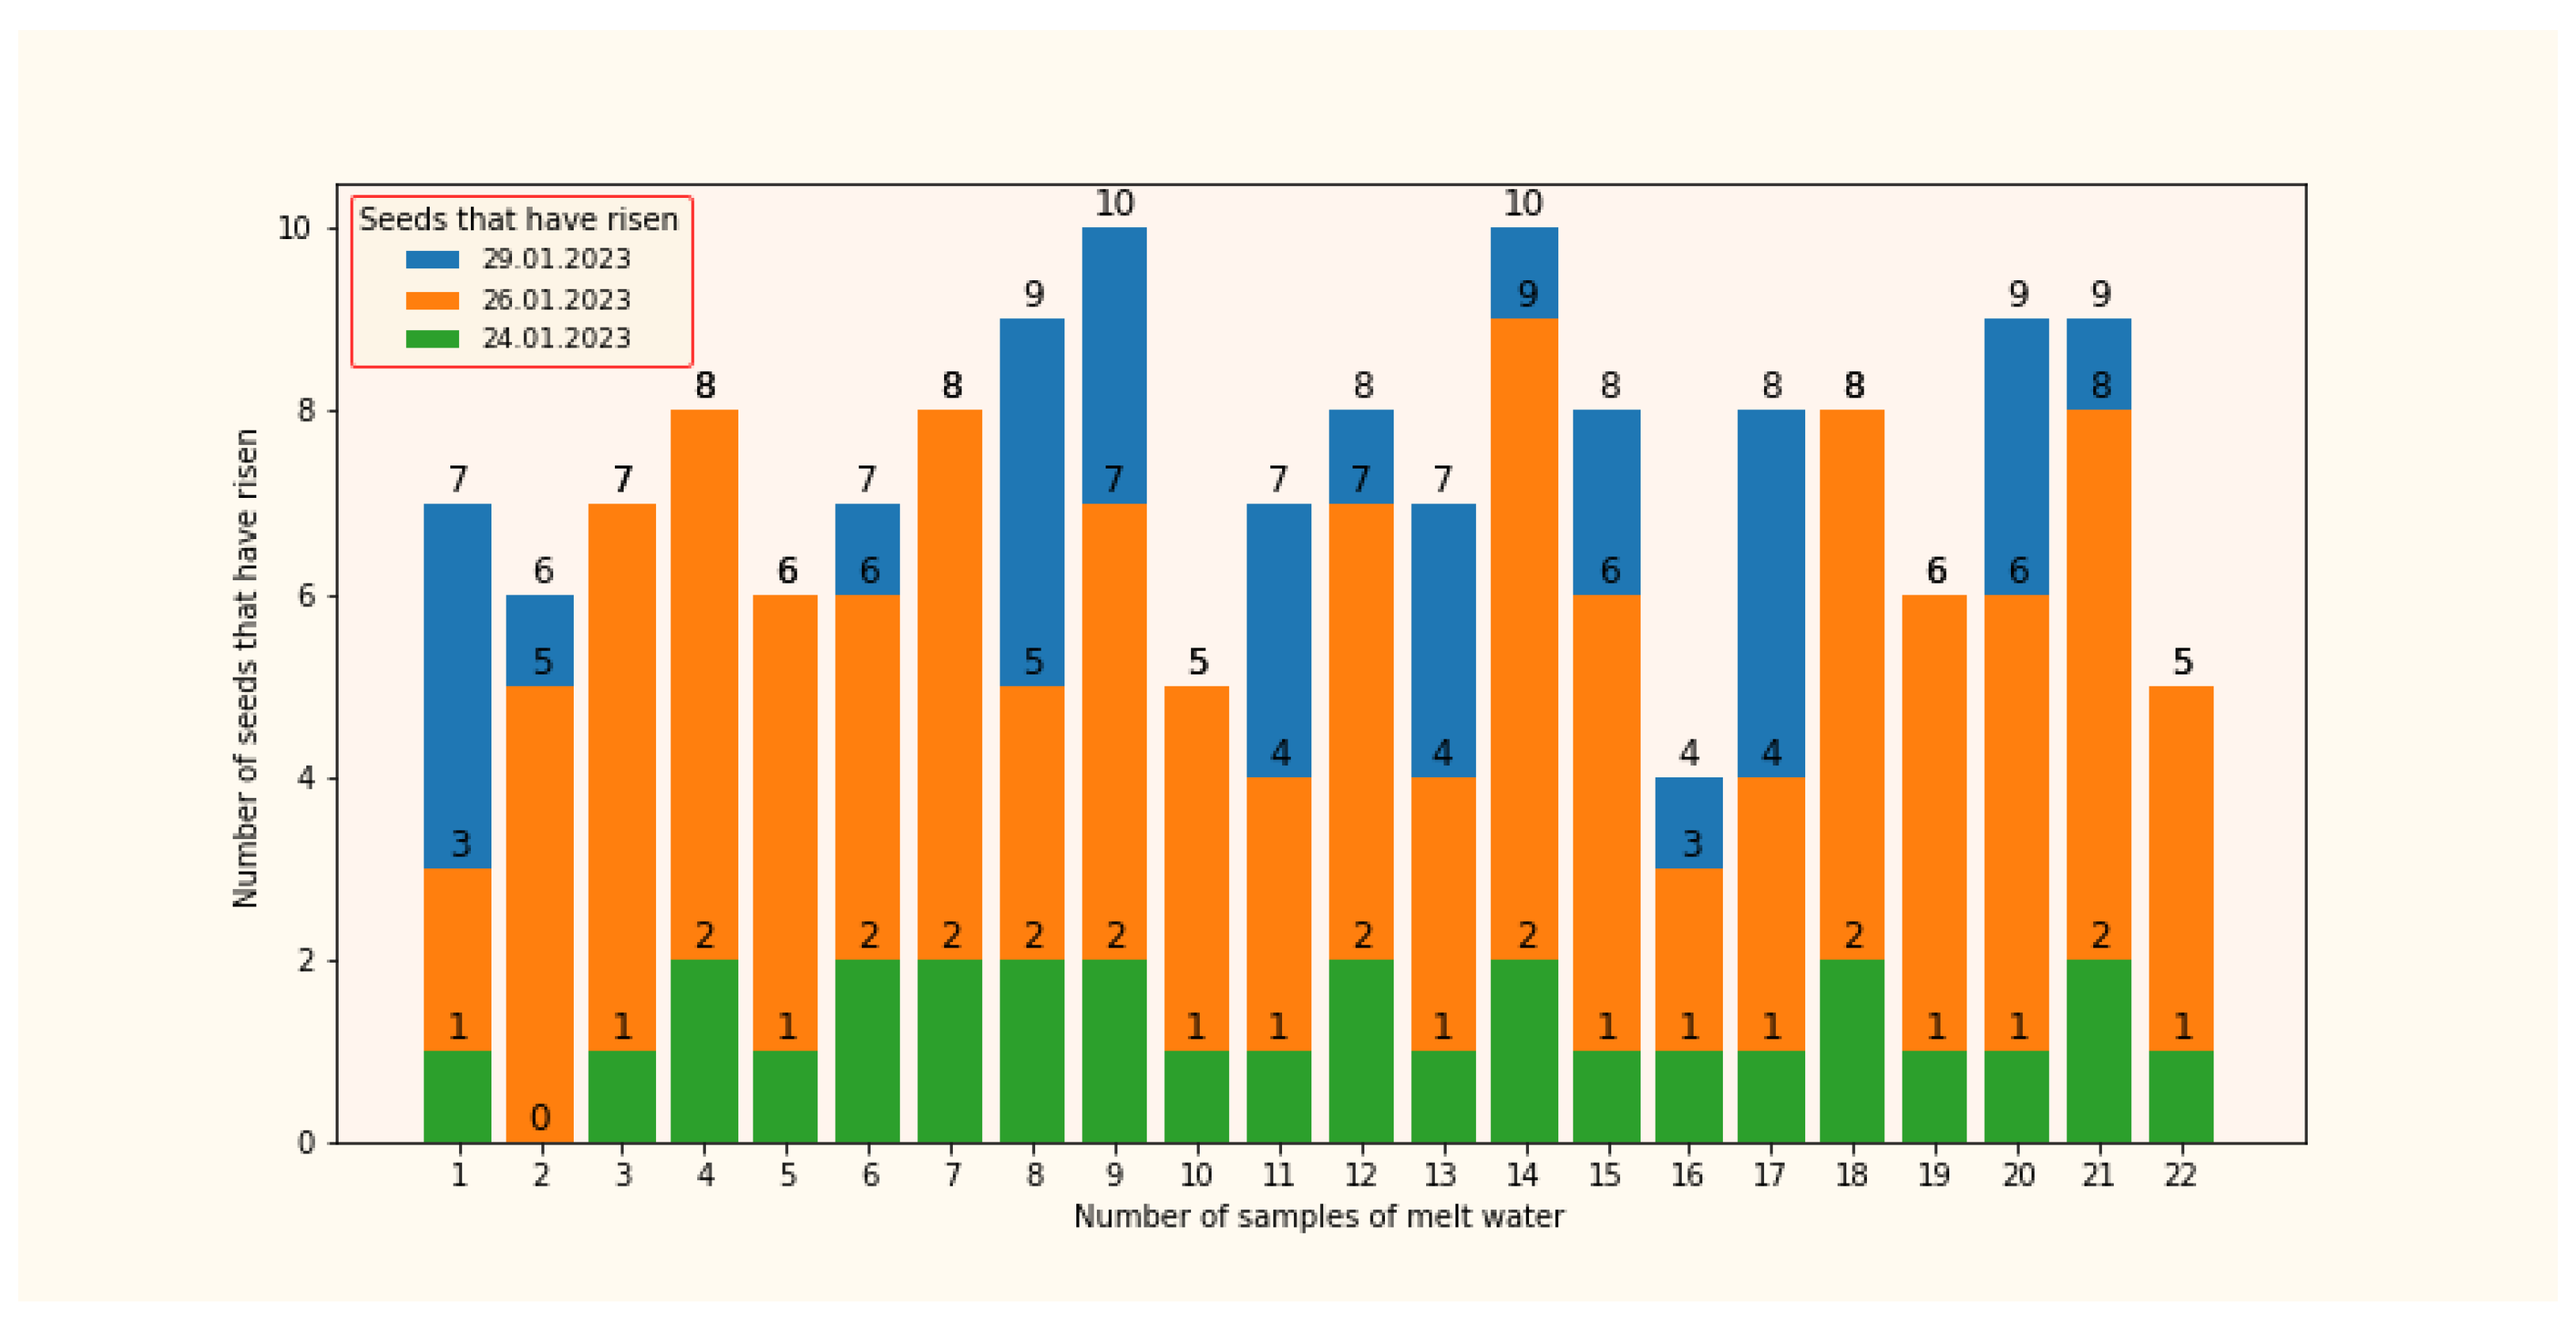
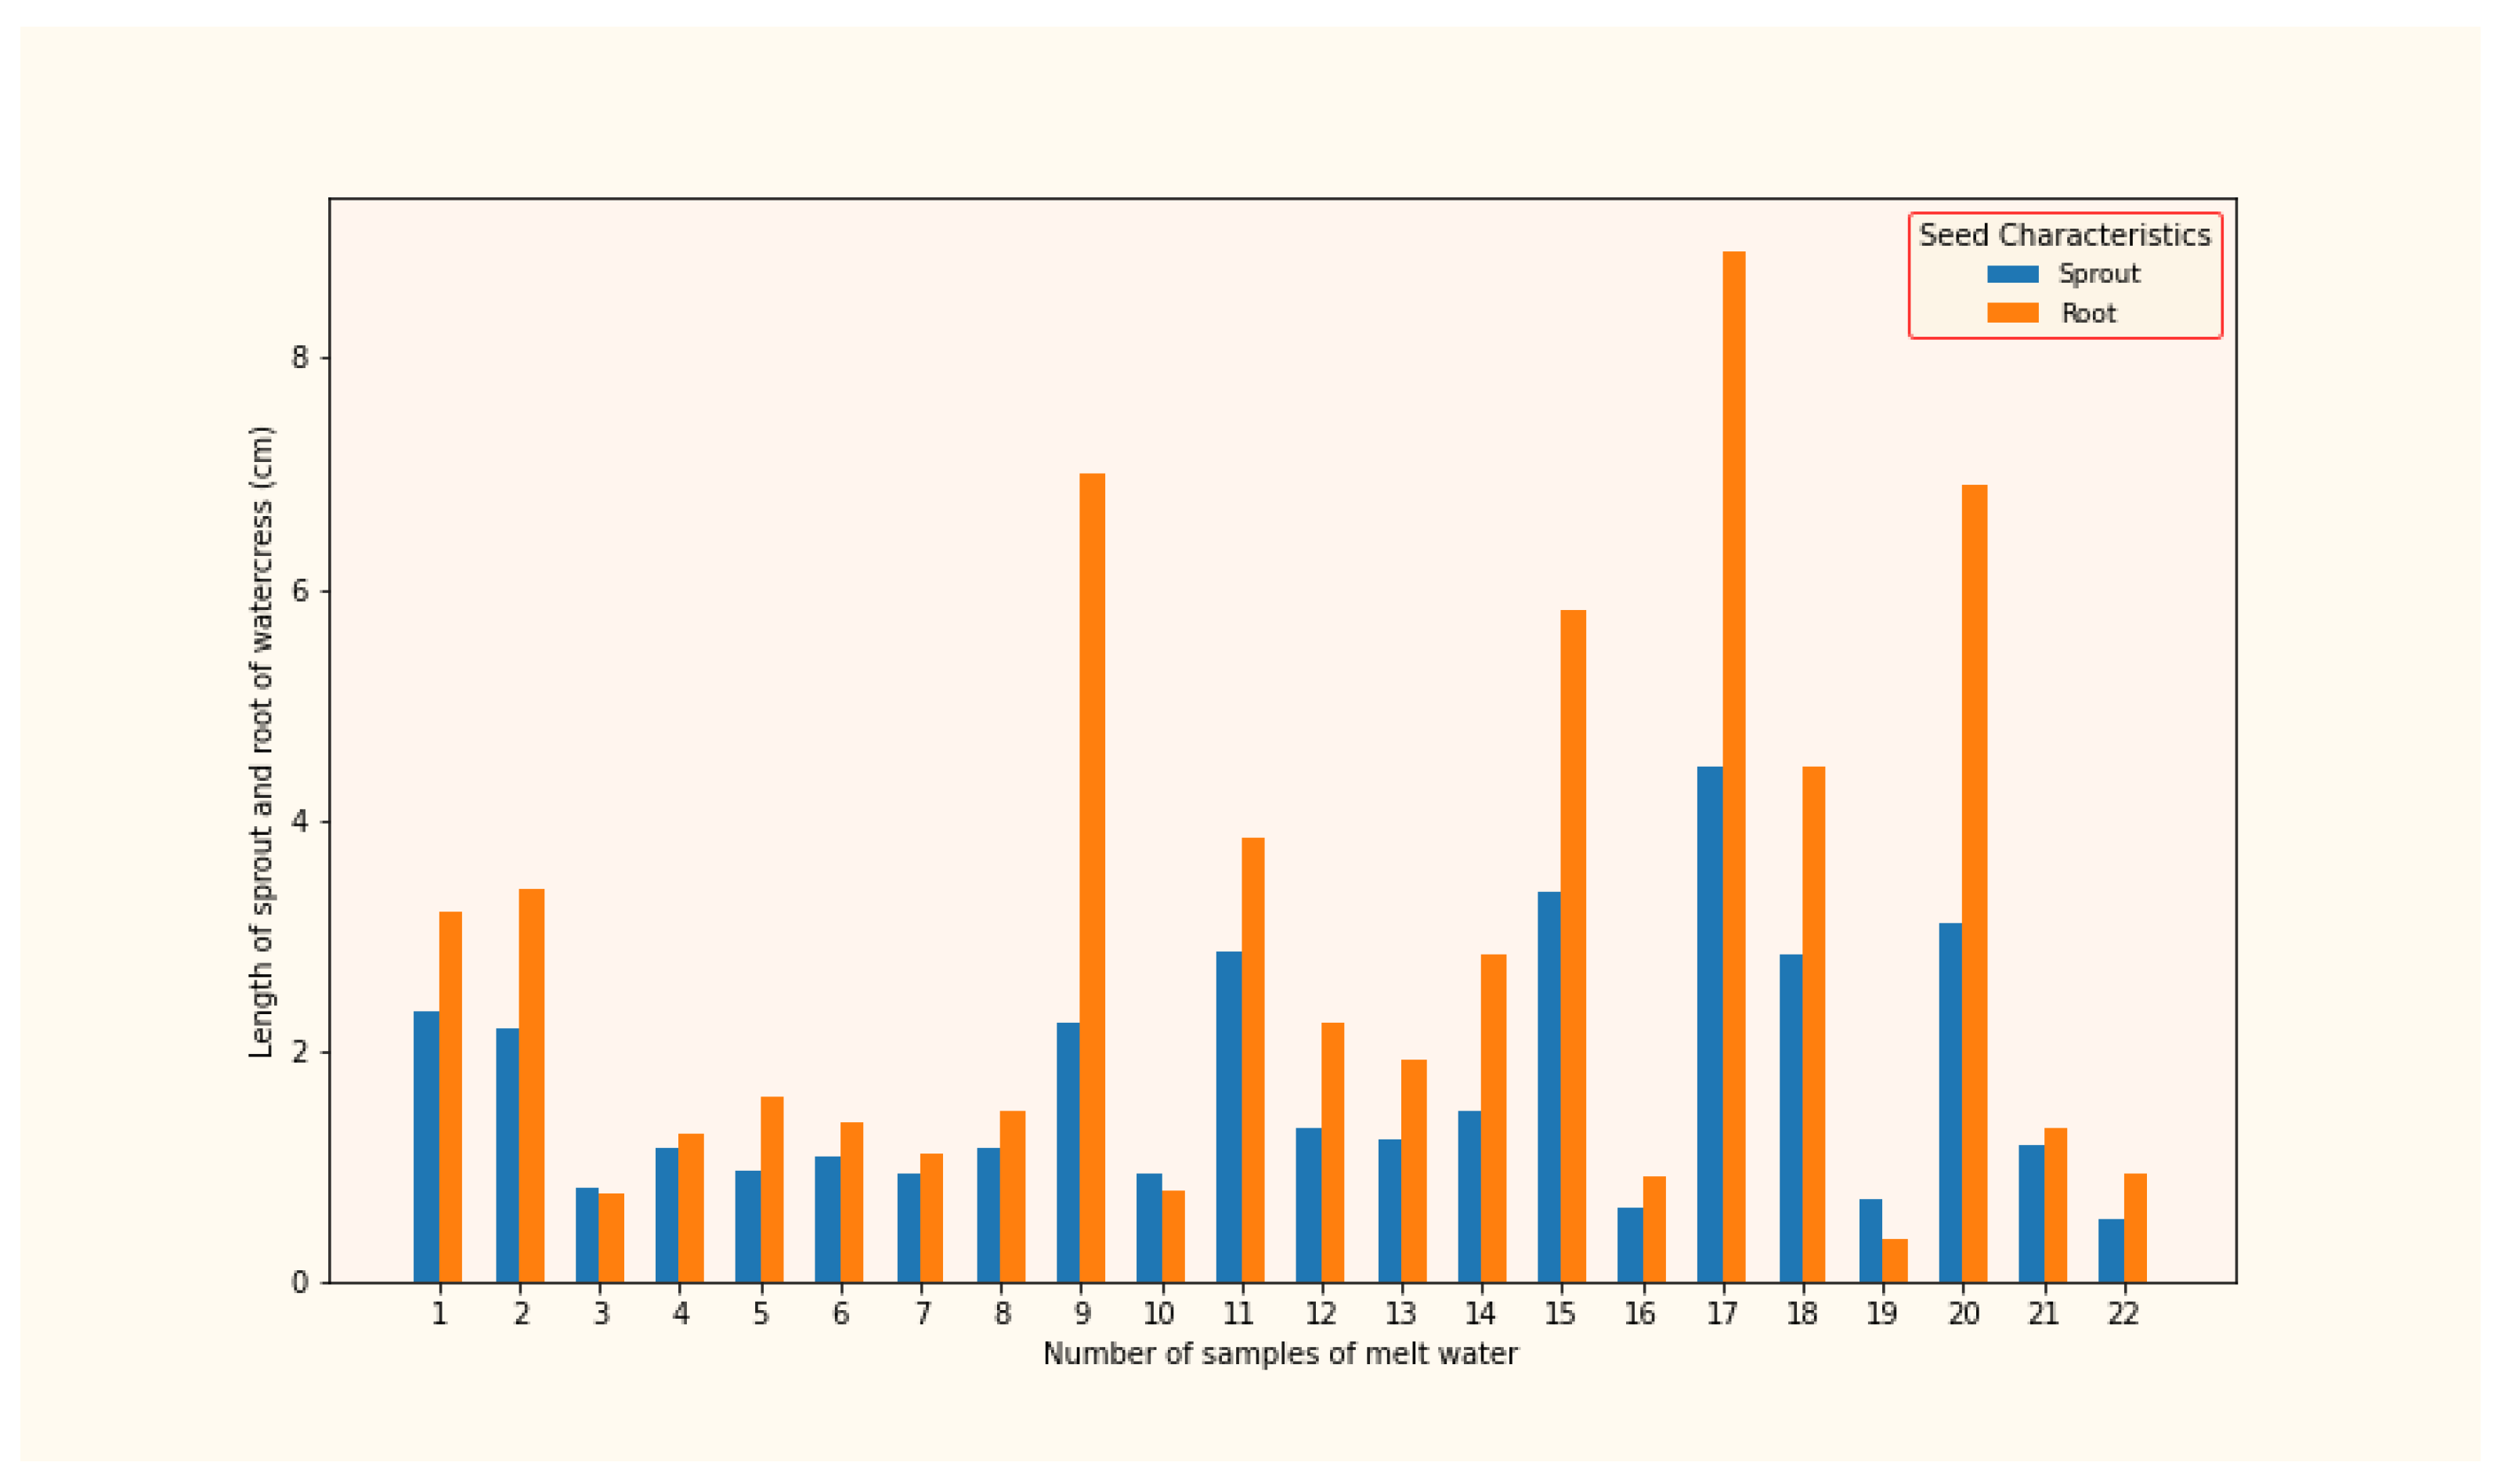
3.3. Results of the Bio Experiment with the Cultivation of Watercress

For 7 days, the seeds of watercress sprouted in melted snow water from different collection sites. During the experiment, the number of seedlings and seed roots were determined on these samples of melt water. The seeds began to sprout by the third day of the experiment, and their numbers by day are shown in Figure 4. The lengths of seedlings and roots of plants were also measured; their results are shown in Figure 5.
As a result of the experiment, it was revealed based on the seed germination table that the best growth rates of watercress seeds are observed on the territory of Medeu and (009) School 86. Further, 80% of germination was detected at points (018) Kerey and Zhanibek Khandar, (015) Saduakasuly str., 47, school No. 176, and (017) KazNMU. Moreover, 70% of germinated seeds are observed at points 013 Pavlodarskaya str. 33, (011) Kuldzhinsky tract, and (001) Kindergarten No. 130. The lowest germination rates are observed in the area 002 Kindergarten No. 11 as can be seen from Figure 4.
During the observation of the next 14 samples, the following conclusions can be drawn: the best indicators of seed germination were observed in the control sample and in the sample from point (014) of Sagadat Nurmagambetov. There was 90% seed germination in samples (021) Lime and (008) School No. 144. The indicators of germinated seeds in samples (012) Bokeikhanov, (007) School No. 150, and (004) Kensai Cemetery 1 were 80%. In two samples, (006) Kindergarten No. 149 and (003) Kindergarten No. 184, the percentage of germinated seeds was 70%. In samples (005) School No. 52 and (019) Tatibekov, 60% of seeds germinated. Seed germination in samples (010) Kindergarten No. 66 and (022) Al-Farabi ave. was only 50%. The lowest rate of lettuce germination was detected in the sample (016) Algabas (40%).
As a result, it can be said that prolonged exposure to atmospheric air pollution can lead to degradation of plant ecosystems, a decrease in biodiversity, and disruption of the ecological balance.

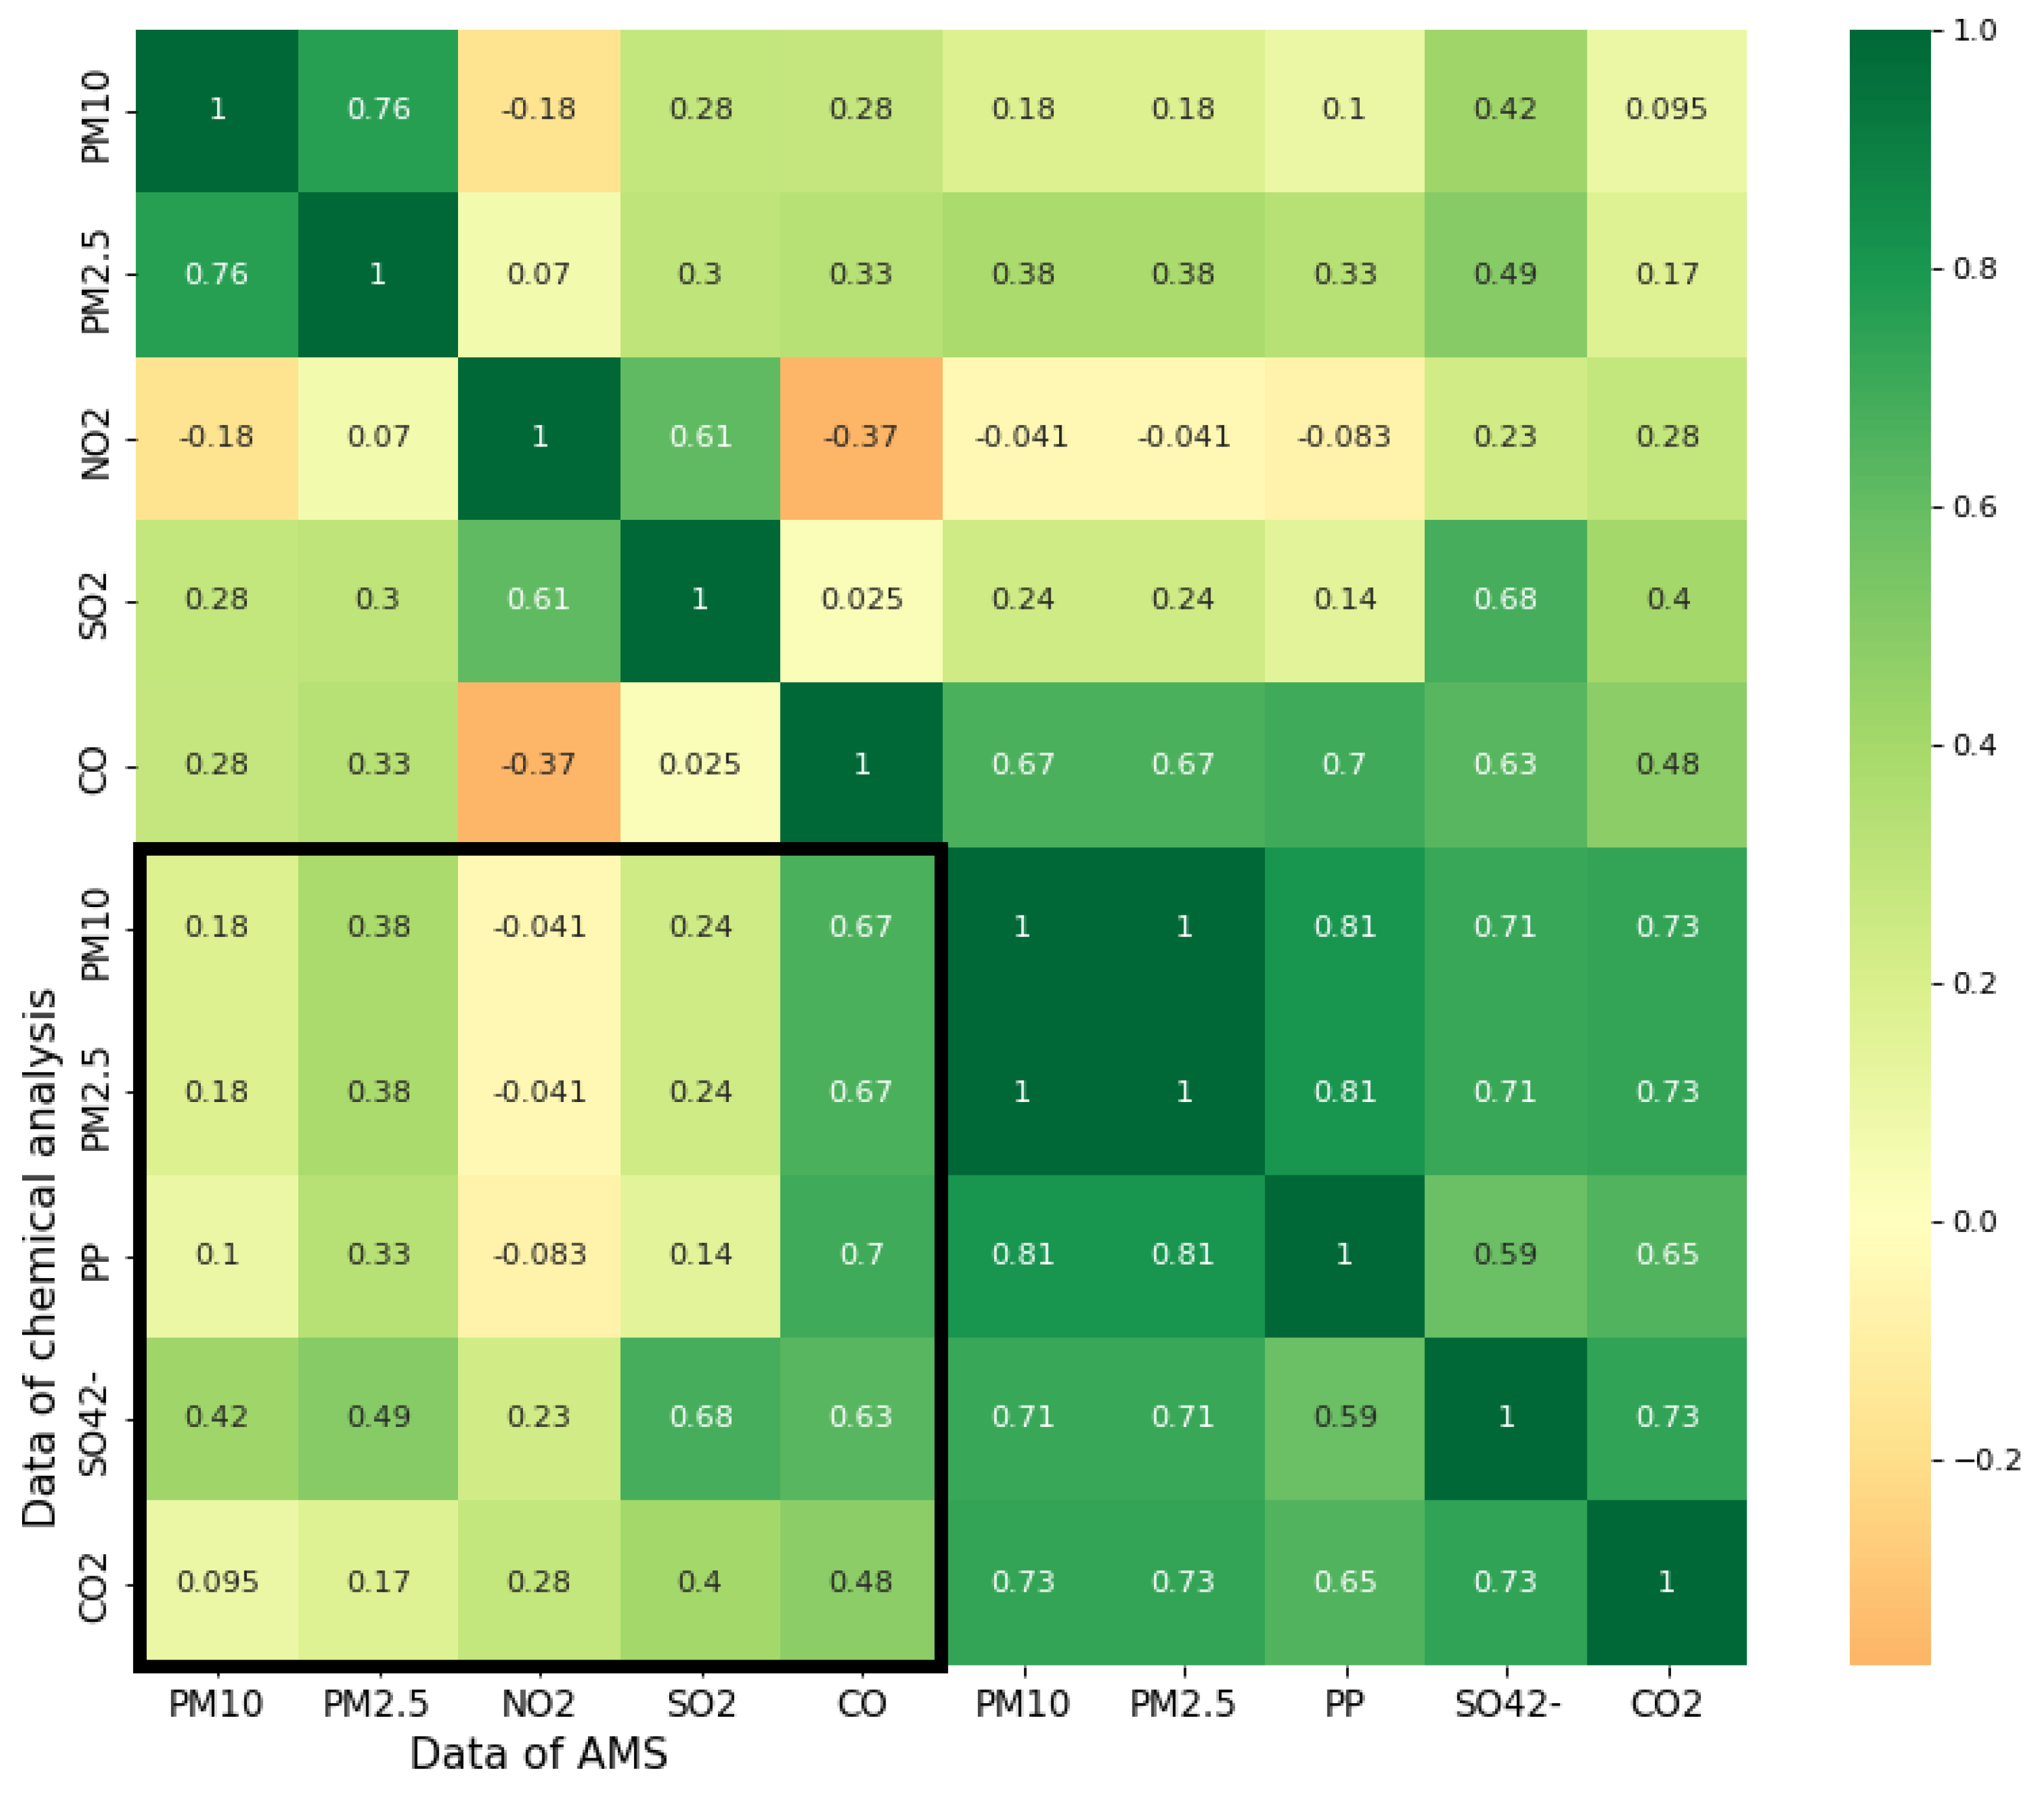
3.4. Relationship between AMS and Chemical-Analytical Research Indicators

Indicators of nitrogen dioxide NO2 with AMS were compared with indicators of petroleum products (PP) in a chemical analytical study, carbon monoxide CO indicators were compared with carbon dioxide CO2, and sulfur dioxide SO2 indicators were compared with indicators of sulfates.
According to Figure 6, the results of the constructed correlogram indicate that there is a relationship (48%) between CO2 from the chemical analytical research and CO data from the AMS. Similarly, for SO42− and SO2 data, the correlation coefficient in the case of these pollutants is 68%.
There is also a strong correlation between data of the carbon monooxide (CO) from the AMS and the data of PM10 (67%), PM2.5 (67%), NO2 (70%), and SO2 (63%) from chemical analytical research, which may indicate the presence of common sources of emissions of these substances in the environment.
In addition, a correlation was observed between SO42− data from chemical-analytical research and data on PM10 (42%) and PM2.5 (49%) from AMS. This may indicate a link between SO2 and dust emissions in the environment.
Thus, the results of the correlation suggest that there is some connection between the pollutants that are captured by AMS and the indicators of pollutants in the snowmelt water of the snow cover determined by chemical-analytical research.

3.5. Assessment of Model Quality in Various Metrics

When constructing regression models, the choice of metrics for evaluating the quality of the model is no less significant. The effectiveness of machine learning methods can be assessed using statistical indicators such as the coefficient of determination (R2), mean absolute error (MAE), and mean squared error (MSE). R2 represents the proportion of variance explained by the model. The quality of the model is significant when the R2 value is close to 1 (100%).
MAE and MSE were used to quantify forecast errors, which should be close to zero.
As mentioned above, the training was conducted on three data (Y1—the number of germinated seeds, Y2—the length of seedlings, and Y3—the length of roots). All data is randomly divided into two subsets: trainable and test data. According to the testing results presented in Table 1, the random forest and AdaBoost algorithms give very good results. The MLPR method for all models has very low coefficients of determination (for Y1, Y2, Y3 correspondingly 25%, 5%, 12%). The highest coefficients of determination for all models are in the case of the random forest algorithm (95%, 92%, 97% correspondingly for three models).
MSE and MAE were used to quantify learning errors, which should be close to zero. For data of Y1, the minimal number of germinated seeds is 4, for data of Y2, the minimal length of seedlings is 0.55 cm, and for data of Y3, the minimal length of roots is 0.36 cm; corresponding MSE and MAE values are presented in Table 1. In the random forest method, the MSE and MAE values are very close to its minimal values (Table 1), which is an indicator of the accuracy of the model.

3.6. Analysis of Model Construction Results

A correctly formulated task with correctly selected input and output parameters allowed us to quickly target a suitable model, use the correct learning algorithm, and choose the optimal set of hyperparameters for the existing task. The constructed stages of the algorithms made it possible to debug the program code faster and analyze the results using machine learning methods.
Based on the results of this study, which examines the effect of air pollution on the cultivation of watercress, it can be concluded that for all the models considered (Y1, Y2, Y3), the random forest method gave the best results.
According to Table 2, suspended particles PM10/PM2.5 (21%), carbon monoxide CO2 (15%), as well as sulfates SO42− (23%) have the greatest effect on the amount of cress seeds grown (Y1), totaling 59% of the effect. The length of the seedlings (Y2) is most affected by carbon monoxide CO2 (32%), sulfates SO42− (17%), and cadmium Cd (19%), totaling 68% of the effect. The root length (Y3) is most affected by carbon monoxide CO2 (20%), sulfates SO42− (37%), and cadmium Cd (21%), totaling 78% of the effect.
The results show that suspended particles PM10/PM22.5, carbon monoxide CO2, and sulfates SO42− have the greatest effect on the number of cress seeds, while the length of seedlings and roots are most affected by carbon monoxide CO2, sulfates SO42−, and cadmium Cd.
In addition, it can be noted that the total percentage of influence on each of the three aspects of growth is quite high (the amounts are 59%, 68%, and 78%, respectively), which indicates the significance of the factors under consideration.
This indicates that it is necessary to control the level of harmful substances in the air and develop a strategy to combat air pollution and maintain a healthy environment.

4. Discussion

From the presented data, it can be concluded that a high level of atmospheric air pollution is observed in the territory of Almaty, which exceeds the permissible value. According to the API indicator, the level of air pollution is above average, which indicates the presence of problems in the ecological situation of the city. High levels of pollutants in the snow cover near automated monitoring stations indicate the presence of certain sources of emissions that need to be identified and eliminated.
The results of the experiment on the cultivation of watercress show that the state of the environment on the territory of the Medeu Nature Park and in the area of School No. 86 is more favorable for flora growth than at other observation points. The germination rates of watercress seeds were low in other areas, which is an indicator of high levels of air and soil pollution.
The correlation matrix for AMS and chemical analytical study data showed a strong relationship between the CO data of the chemical analytical study and the PM10, PM2.5, NO2, and SO2 data with AMS. This may indicate the presence of common sources of emissions of these substances, which may be another cause of environmental pollution.
The results of the constructed models to identify the relationship between pollutants and the parameters of grown plants using machine learning algorithms show that atmospheric air pollution has a strong impact on the state of the environment and flora in the city.
Thus, in order to improve the environmental situation of the city, it is necessary to take measures to reduce emissions of harmful substances into the atmosphere and on the soil surface, as well as conduct a more detailed monitoring study to identify sources of pollution and develop an action plan to solve the problem.
Overall, the presented data suggests that the environmental situation in Almaty is alarming and urgent measures are required to address the issue. Reducing emissions of harmful substances into the atmosphere and soil surface is crucial to improve the situation, and a detailed monitoring study should be conducted to identify the sources of pollution. Based on this information, an action plan must be developed to mitigate the impact of pollution on the environment and public health. The findings of this study can be used as a valuable input for policymakers to implement appropriate measures to improve the ecological situation of the city.

Author Contributions

Supervision, project administration and conceptualization have been developed by N.T.; data collection have been made by A.T.; literature review have been made by M.T.; methodology have been considered by S.K. and G.B.; data analysis have been made by S.K. and D.T.; writing and editing have been made by D.T.; final review have been considered by N.T. and S.K. All authors have read and agreed to the published version of the manuscript.

Funding

The Science Committee of the Ministry of Higher Education and Science of the Republic of Kazakhstan (grant number BR18574148 «Development of geoinformation systems and monitoring of environmental objects»).

Institutional Review Board Statement

Not applicable.

Informed Consent Statement

Not applicable.

Data Availability Statement

Data about air quality of Almaty have been received from the website of LLP Ecoservice-S http://185.125.44.116:8085/Maps/AlmatyFree (accessed on 19 April 2023). Data of chemical-analytical research was realized based on the contract with the laboratory of chemical-analytical studies of LLP “Institute of Hydrogeology and Geoecology named after U.M. Akhmedsafin” (according to the agreement No. 18-09 dated 19 January 2023). Authors in laboratory conditions in the National Engineering Academy of RK collected data about watercress.

Conflicts of Interest

The authors declare no conflict of interest.

References

  1. Bureau of National Statistics. On the Change in the Population of the Republic of Kazakhstan from the Beginning of 2022 to October 1, 2022. 9 November 2022. Available online: https://new.stat.gov.kz/ru/industries/social-statistics/demography/ (accessed on 10 April 2023). (In Russian)
  2. Kozybayev, M.K. (Ed.) Kazakh Soviet Encyclopedia; Macmillan: Almaty, Kazakhstan, 1983; p. 12. Available online: http://www.encyclopedia.ru/cat/books/book/37415/ (accessed on 9 April 2023). (In Russian)
  3. Nurgaliev, R.N. (Ed.) The Kazakh SSR: A short encyclopedia. In Kazakh Soviet Encyclopedia; Macmillan: Almaty, Kazakhstan, 1988; Volume 2, pp. 69–71. ISBN 5-89800-002-X. (In Russian) [Google Scholar]
  4. Cherednichenko, A.V. Time Series of Temperature and Precipitation; Statistical analysis; MegaPrint: Almaty, Kazakhstan, 2013; 365p, pp. 36–37. (In Russian) [Google Scholar]
  5. A Comprehensive Program for Improving the Environmental Situation in Almaty for 1999–2015. “Taza aua—Zhanga daua”; Almaty City Department for Environmental Protection: Almaty, Kazakhstan, 2002; pp. 1–11. Available online: https://adilet.zan.kz/rus/docs/V99R000057_/links (accessed on 1 April 2023). (In Russian)
  6. Belyi, A.V. The Role of Climatic Factors in the Processes of Pollution and Purification of the Atmosphere of the Southwestern Part of the Almaty Region. Ph.D. Thesis, Kazakh National Pedagogical University, Almaty, Kazakhstan, 21 November 1997; pp. 22–25. Available online: https://earthpapers.net/rol-klimaticheskih-faktorov-v-protsessah-zagryazneniya-i-oyischeniya-atmosfery-yugo-zapadnoy-chasti-almatinskoy-oblasti (accessed on 2 April 2023). (In Russian).
  7. Vilesov, E.N. Climatic Conditions of Almaty; Publishing House of Al-Farabi Kazakh National University: Almaty, Kazakhstan, 2010; pp. 75–78. Available online: https://elibrary.kaznu.kz/wp-content/uploads/2020/05/vilesov_evgenii_nikolaevich.pdf (accessed on 5 April 2023). (In Russian)
  8. Helmholtz, N.F. Mountain-Valley Circulation of the Northern Slopes of the Tien Shan; Hydrometeoizdat: Leningrad, Russia, 1963; 330p, Available online: https://vital.lib.tsu.ru/vital/access/services/Download/vtls:000574703/SOURCE1 (accessed on 3 April 2023). (In Russian)
  9. Kerimray, A.; Kenesov, B.; Karaja, F. Trends and health impacts of major urban air pollutants in Kazakhstan. J. Air Waste Manag. Assoc. 2019, 69, 1331–1347. [Google Scholar] [CrossRef] [PubMed]
  10. The Most Polluted Countries in the World IQAir in 2021—Rating PM2.5 AirVisual. Available online: https://www.airvisual.com/world-most-polluted-countries (accessed on 1 April 2023).
  11. The World Bank. Global Health Costs Associated with Air Pollution PM2.5: Rationale for Action after 2021. International Development Is in the Spotlight; World Bank: Washington, DC, USA, 2022. [Google Scholar] [CrossRef]
  12. Almaty City Air Quality Monitoring. Available online: https://www.airkaz.org/index.php (accessed on 2 April 2023).
  13. Airnow On the Air of the State Department. 2021. Available online: https://www.airnow.gov/international/usembassies-and-consulates/#Kazakhstan$Almaty (accessed on 2 April 2023).
  14. Cohen, A.J.; Brower, M.; Burnett, R.; Anderson, H.R.; Frostad, J.; Estep, K.; Balakrishnan, K.; Brunekrif, B.; Dandona, L.; Dandona, R.; et al. Estimates and 25-year trends of the global burden of diseases caused by ambient air pollution: Analysis of data from the global burden study diseases. Lancet 2015, 389, 1907–1918. [Google Scholar] [CrossRef]
  15. Nugmanova, D.; Sokolova, L.; Feshchenko, Y.; Iashyna, L.; Gyrina, O.; Malynovska, K.; Mustafayev, I.; Aliyeva, G.; Makarova, J.; Vasylyev, A.; et al. Prevalence, burden and risk factors associated with bronchial asthma in the countries of the Commonwealth of Independent States (Ukraine, Kazakhstan and Azerbaijan): The results of the MAIN study. BMC Pulm. Med. 2018, 18, 110. [Google Scholar] [CrossRef]
  16. Nugmanova, D.; Feshchenko, Y.; Yashina, L.; Girina, O.; Malinovskaya, K.; Mammadbekov, E.; Akhundova, I.; Nurkina, N.; Tarik, L.; Makarova, J.; et al. Prevalence, burden and risk factors associated with chronic obstructive pulmonary disease in the Commonwealth of Independent States (Ukraine, Kazakhstan and Azerbaijan): The results of the MAIN study. BMC Pulm. Med. 2018, 18, 26. [Google Scholar] [CrossRef] [PubMed]
  17. Kenesari, D.; Kenesari, A.; Adilgireuly, Z.; Akzholova, N.; Yerzhanova, A.; Dosmukhametov, A.; Syzdykov, D.; Masud, A.-R.; Saliev, T. Air pollution in Kazakhstan and assessment of its health risk. Ann. Glob. Health 2019, 85, 133. [Google Scholar] [CrossRef] [PubMed]
  18. Semenova, Y.; Zhunusov, Y.; Pivina, L.; Abisheva, A.; Tinkov, A.; Belikhina, T.; Skalnyi, A.; Zhanaspaev, M.; Bulegenov, T.; Glushkova, N.; et al. Trace element biomonitoring in hair and blood of occupationally unexposed population residing in polluted areas of East Kazakhstan and Pavlodar regions. J. Trace Elem. Med. Biol. 2019, 56, 31–37. [Google Scholar] [CrossRef] [PubMed]
  19. World Health Organization. Available online: https://www.who.int/ru/news-room/fact-sheets/detail/ambient-(outdoors)-air%20quality%20and%20health (accessed on 12 April 2023).
  20. World Bank. The World Bank Municipal Energy Efficiency Improvement Plan for the City of Almaty; World Bank: Washington, DC, USA, 2017; Available online: http://documents.worldbank.org/curated/en/855641510934183633/pdf/121463-ESM-P130013-PUBLIC-KEEPAmatyEEPlan%20Novengfinal.pdf (accessed on 1 August 2019).
  21. World Bank. Towards a Cleaner Industry and Improved Air Quality Monitoring in Kazakhstan; The World Bank: Washington, DC, USA, 2013; Available online: http://documents.worldbank.org/curated/en/132151468047791898/Towards-cleaner-idustry-and-improved-airquality-monitoring-in-Kazakhstan (accessed on 5 April 2023).
  22. Statistics Committee of the Ministry of National Economy of the Republic of Kazakhstan. Transportation of Passenger Cars. Available online: http://old.stat.gov.kz/getImg?id=ESTAT099960 (accessed on 9 April 2023).
  23. Carlsen, L.; Baimatova, N.K.; Kenessov, B.N.; Kenessova, O.A. Assessment of air quality in Almaty. Focusing on the traffic component. Int. J. Biol. Chem. 2013, 5, 46–69. Available online: https://ijbch.kaznu.kz/index.php/kaznu/article/view/82 (accessed on 1 April 2023).
  24. Kerimray, A.; Azbanbayev, E.; Kenessov, B.; Plotitsyn, P.; Alimbayeva, D.; Karaca, F. Spatio-temporal fluctuations and contributing factors of air pollution in Almaty, Kazakhstan. Aerosols Air Qual. Res. 2020, 20, 1340–1352. [Google Scholar] [CrossRef]
  25. Newsletters on the State of the Environment of the Republic of Kazakhstan. Kazhydromet. 2021. Available online: https://www.kazhydromet.kz/en/ecology/informacionnye-byulleteni-o-sostoyanii-okruzhayuschey-sredy-respubliki-kazahstan (accessed on 11 April 2023).
  26. Baimatova, N.; Omarova, A.; Muratuly, A.; Tursumbayeva, M.; Ibragimova, O.P.; Bukenov, B.; Kerimray, A. Seasonal fluctuations and the impact of quarantine due to COVID-19 on air quality in cities of Kazakhstan. Environ. Process. 2022, 9, 48. [Google Scholar] [CrossRef]
  27. Voychik, V.; Adikanova, S.; Madiyarov, M.N.; Myrzagalieva, A.B.; Temirbekov, N.M.; Junisbekov, M.; Pavlovsky, L. Probabilistic and statistical modeling of harmful transport impurities in the atmosphere from motor transport. J. Chronol. Affin. 2017, 19, 795–808. Available online: https://ros.edu.pl/images/roczniki/2017/48_ROS_V19_R2017.pdf (accessed on 1 April 2023).
  28. Adikanova, S.; Madiyarov, M.N.; Temirbekov, N.M. Probabilistic statistical modeling of air pollution from vehicles. AIP Conf. Proc. 2017, 1880, 060017. [Google Scholar] [CrossRef]
  29. Dutta, A.K.; Sampson, J.; Ahmad, S.; Avudaiappan, T.; Narayanasamy, K.; Pustokhina, I.V.; Pustokhin, D.A. Monitoring of air pollution in the environment using hybrid deep learning. Comput. Mater. Contin. 2023, 75, 3993–4008. [Google Scholar] [CrossRef]
  30. Kelechi, A.H.; Alsharif, M.H.; Agbaetuo, C.; Ubadike, O.; Aligbe, A.; Uthansakul, P.; Kannadasan, R.; Aly, A.A. Ali Development of an inexpensive air quality monitoring system using Arduino and ThingSpeak. Comput. Mater. Contin. 2022, 70, 151–169. [Google Scholar] [CrossRef]
  31. Plocoste, T.; Laventure, S. Forecasting PM10 Concentrations in the Caribbean Area Using Machine Learning Models. Atmosphere 2023, 14, 134. [Google Scholar] [CrossRef]
  32. Aydosov, A.; Aydosov, G.; Zaurbekov, N.; Zaurbekova, N.; Zaurbekova, G.; Zaurbekov, I. Mathematical modeling of atmospheric pollution in an industrial region in order to develop software for an information system for assessing the environmental situation. Ecology 2019, 28, 349–358. Available online: https://ekolojidergisi.com/download/mathematical-modelling-of-atmospheric-pollution-in-an-industrial-region-with-a-view-to-design-an-5601.pdf (accessed on 1 April 2023).
  33. Zaurbekov, N.; Aidosov, A.; Zaurbekova, N.; Aidosov, G.; Zaurbekova, G.; Zaurbekov, I. Emission spread from mass and energy exchange in the atmospheric surface layer: Two-dimensional simulation. Energy Sources Part A Recovery Util. Environ. Eff. 2018, 40, 2832–2841. [Google Scholar] [CrossRef]
  34. Abdibekov, U.; Karzhaubayev, K. Numerical Simulation of Turbulent Pollution Transport in Thermally Stratified Atmosphere. J. Math. Mech. Comput. Sci. 2015, 86, 10–13. Available online: https://bm.kaznu.kz/index.php/kaznu/article/view/305 (accessed on 1 April 2023).
  35. Issakhov, A.; Omarova, P.; Issakhov, A. Numerical study of thermal influence to pollutant dispersion in the idealized urban street road. Air Qual. Atmos. Health 2020, 13, 1045–1056. [Google Scholar] [CrossRef]
  36. Issakhov, A.; Alimbek, A.; Issakhov, A. A numerical study for the assessment of air pollutant dispersion with chemical reactions from a thermal power plant. Eng. Appl. Comput. Fluid Mech. 2020, 14, 1035–1061. [Google Scholar] [CrossRef]
  37. Temirbekov, A.N.; Danaev, N.T.; Malgazhdarov, E.A. Modeling of Polutants in the Atmosphere Based on Photochemical Reactions. Eurasian Chem. Technol. J. Int. High. Educ. Acad. Sci. 2014, 16, 61–71. [Google Scholar] [CrossRef]
  38. Temirbekov, A.N.; Urmashev, B.A.; Gromaszek, K. Investigation of the stability and convergence of difference schemes for the three-dimensional equations of the atmospheric boundary layer. Int. J. Electron. Telecommun. 2018, 64, 391–396. [Google Scholar] [CrossRef]
  39. Hygienic Standards for Atmospheric Air in Urban and Rural Settlements. Order of the Minister of National Economy of the Republic of Kazakhstan. 2015. Available online: http://adilet.zan.kz/rus/docs/V1500011036 (accessed on 17 January 2021).
  40. Monitoring of the Air Quality of the City of Almaty by Automated Monitoring Stations SmartEco. Available online: http://185.125.44.116:8085/Maps/AlmatyFree (accessed on 19 April 2023).
  41. Siudek, P.; Frankowski, M.; Siepak, J. Trace element distribution in the snow cover from an urban area in central Poland. Environ. Monit. Assess. 2015, 187, 225. [Google Scholar] [CrossRef] [PubMed]
  42. Aurelien, G. Applied Machine Learning Using Scikit-Learn and TensorFlow: Concepts, Tools and Techniques for Creating Intelligent Systems; Alfa-book LLC.: St. Petersburg, Russia, 2018; 688p. [Google Scholar]
Figure 1. Addresses of AMS posts located in the city of Almaty, where samples of snow cover were collected.
Atmosphere 14 00892 g001
Figure 2. Complex characteristics of the state of atmospheric air-air pollution index (API) for 20 AMS posts.
Atmosphere 14 00892 g002
Figure 3. Levels of pollutants of the chemical-analytical study of snowmelt water in the vicinity of AMS posts: (a) Hydrogen index (pH), (b) Particulate matters (PM10, PM2.5), (c) Carbon dioxide (CO2), (d) Petroleum products, (e) Sulfates, (f) Lead (Pb), (g) Zinc (Zn), (h) Cadmium (Cd) are measured in mg/dm3.
Atmosphere 14 00892 g003aAtmosphere 14 00892 g003b
Figure 4. The number of sprung cress seeds on 23 samples.
Atmosphere 14 00892 g004
Figure 5. Average length of seedlings and roots of watercress (in cm) on 23 samples.
Atmosphere 14 00892 g005
Figure 6. Correlation matrix of AMS data and chemical-analytical research.
Atmosphere 14 00892 g006
Table 1. Performance estimates of machine learning models based on the metrics coefficient of determination R2, root-mean-square error (MSE), and mean-absolute error (MAE).
Y1Y2Y3
MethodsR2MSEMAER2MSEMAER2MSEMAE
Random Forest95%0.02 cm0.12 cm92%0.025 cm0.12 cm97%0.017 cm0.14 cm
AdaBoost85%0.05 cm0.443 cm84%0.052 cm0.31 cm92%0.054 cm0.535 cm
MLPR25%0.27 cm0.9 cm5%0.3 cm0.86 cm12%0.61 cm1.73 cm
Table 2. Data on the weight multipliers of the constructed models by the random forest method (RFR) for three models.
Concentrations of PollutantsPM10/PM2.5CO2PPSO42−PbZnCd
Y1 (number of germinated seeds)0.210.150.130.230.120.030.13
Y2 (length of seedlings)0.130.320.10.170.020.070.19
Y3 (length of roots)0.110.20.050.370.030.030.21
Disclaimer/Publisher’s Note: The statements, opinions and data contained in all publications are solely those of the individual author(s) and contributor(s) and not of MDPI and/or the editor(s). MDPI and/or the editor(s) disclaim responsibility for any injury to people or property resulting from any ideas, methods, instructions or products referred to in the content.

