Abstract
Extreme heat events are frequent in the Beijing–Tianjin–Hebei (BTH) region due to global warming and accelerated urbanization. While previous studies have analyzed the trend of extreme heat events in the Beijing–Tianjin–Hebei (BTH) region, the interdecadal changes of these events remain unclear. Therefore, this study aims to analyze the interdecadal temporal and spatial characteristics of summer extreme heat events in the BTH region using daily mean and maximum temperature datasets from 174 stations over the period 1979–2020. The results are shown as follows: (1) From 1979 to 2020, extreme heat events showed an overall upward trend in the BTH region. There were similarities in the changes in the extreme maximum temperature (TXx) and the number of high-temperature days (Htd) between different generations, and both were low until the mid-1990s. (2) In terms of the spatial pattern, TXx and Htd both showed the spatial distribution characteristics of being high in the south and low in the north. Extreme heat events in the BTH region were mainly concentrated in Beijing City, Tianjin City, and the eastern region of Hebei, and the TXx increase in most areas reached 1.5–2.0 °C. (3) The number of high-temperature days (Htd) increased significantly in the background of global warming, especially in Beijing, Tianjin, and Shijiazhuang Cities. (4) Extreme heat events in the BTH region mainly occurred in June and July, and the interdecadal changes showed a decreasing trend in June and an increasing trend in July. A high proportion of Htd was concentrated in Northern Hebei Province in July.
1. Introduction
Regional climate responses to global warming, including changes in temperature extremes, have received extensive attention in recent decades [1]. Increased warming leads not only to an increase in annual mean temperature, but also to an increase in the frequency and intensity of extreme weather events, and changes in mean temperature are likely to trigger a series of extreme temperature events [2,3]. With the global mean temperature rapidly rising in recent decades, increases in the frequency, intensity, duration, and spatial extent of extreme heat events have been evident and significant in countries such as the United States, South Korea, and China [4,5,6]. These changes in extreme heat events can easily cause the formation of mighty heatwaves that can induce severe meteorological disasters and bring huge damage to the ecosystem and the human society [6,7,8]. There is a warm–dry climate tendency over most parts of Northern China, and increased heatwave-related disasters have been observed during recent decades [9]. For example, in the summer of 2018, a heatwave event with a record-breaking duration and intensity occurred in North China and Northeast China, which induced huge economic losses [10,11]. The threat of extreme heat events is increasing. Therefore, it is very important and urgent to understand the spatiotemporal characteristics and occurrence mechanisms of extreme heat events.
China is a sensitive and significant area of global climate change. In the past 100 years, the warming rate of China has been significantly higher than the global mean level for the same period [12]. At the same time, the trend of climate warming is accelerating [13]. The intensity and frequency of extreme weather and climate events in China have increased significantly over the past 50 years [14]. Domestic and foreign scholars have conducted much research on extreme heat events in different regions of China, and they have obtained relatively consistent results. For example, Guo et al. [15] studied the spatiotemporal variation trends of seven extreme temperature indices in Northeast China, and they found that against the background of an average temperature increase of about 1.56 °C in Northeast China, the extreme temperature indices had a significant upward trend, and most regions became warmer and drier, which had a certain impact on regional climate change. In 2018, Northeast China suffered from an unusual summer extreme heat event with the maximum air temperature anomaly exceeding 6 °C [16]. Ma et al. [17] studied the extreme temperatures in Northern China and pointed out that the change in extreme temperatures is closely related to regional warming; they concluded that since the 1990s, the frequency of the highest temperature in most parts of Northern China has increased significantly. Ma et al. [18] discussed and studied the detailed characteristics of the future changes in summer heat waves over three major urban agglomerations (Beijing–Tianjin–Hebei (BTH) region; the Yangtze River Delta (YRD); the Pearl River Delta (PRD)) in Eastern China under the 1.5 and 2.0 °C warming scenarios, and they found that the predicted change in the heat wave index in urban areas is much higher than that in non-urban areas, which means that urban areas will face higher heat-related disease or environmental risks than suburban or rural areas in the future. In addition, studies on the spatiotemporal characteristics of extreme heat events in the Yellow River Basin [19], the Huaihai Basin [20], the Qinghai–Tibet Plateau [21], and other regions showed that the change in extreme temperature will lead to regional climate change and be affected by many factors.
Compared with in other regions in China, the heating rate in North China is higher than the national level, and it is one of the most severely affected areas with frequent extreme heat events in summer [22]. The Beijing–Tianjin–Hebei (BTH) region in North China is a typical rapidly urbanized region, with rapid urban expansion and great impact from human activities [23,24]. Due to its special geographical location, the BTH region is increasingly socially and economically affected by extreme heat events [25,26]. The occurrence of extreme heat events is affected by many factors, and the variation results are different in different research periods. Atmospheric circulation is usually considered as the direct cause of extreme heat events [27]. For Beijing, extreme heat events are caused by abnormal south and north winds, resulting in an increase or decrease in the humidity in Beijing [28]. Zheng et al. [29] pointed out that the extreme heat events in the three major cities of Beijing, Tianjin, and Shijiazhuang showed a significant upward trend in the interannual changes and climate warming and the heat island effect are the most important factors enhancing the change in extreme heat events. Wang et al. [26] conducted a study on extreme heat events in the BTH region in the context of climate change. They concluded that extreme heat events in the region are on the rise, with the largest change range in extreme heat event indices observed in the central areas of Beijing, Tianjin, and Shijiazhuang. Their research provides scientific evidence for understanding extreme events in the BTH region and highlights the increasing threat that extreme heat events pose to the region’s development. Building upon the work of Wang et al. [26], our study aims to investigate the interdecadal spatiotemporal evolution characteristics of extreme heat events in the BTH region and develop adaptation strategies for extreme climate events.
The aim of this study was to examine the temporal trend and the spatial heterogeneity of extreme heat events during summers in the BTH region, utilizing both up-to-date and long-term observational data. Drawing on previous research on the duration of heat waves in the region, we investigated whether the intensity and frequency of extreme heat events underwent greater changes in certain decades. Therefore, in our study, the daily maximum temperatures at 174 meteorological stations from 1979 to 2020, along with the extreme maximum temperatures (TXx) and the number of high-temperature days (Htd), were selected as the typical indicators of extreme heat events. The temporal and spatial variation patterns of summer extreme heat events in the BTH region in these recent 42 years were analyzed on the monthly and annual scales. Then, we explored the space–time evolution characteristics of the two indicators between different ages. This study is of great significance for revealing the changes in extreme high-temperature events in time and space and their regional response to global warming.
2. Data and Methods
2.1. Study Area and Data Source
Our analysis was based on the daily temperature data from 174 meteorological stations in the Beijing–Tianjin–Hebei (BTH) region for 42 summers (June, July, and August) from 1979 to 2020. The original temperature data for each station were obtained from the National Meteorological Information Center of the China Meteorological Administration (http://data.cma.cn/, accessed on 5 May 2022), and the quality of the data was strictly controlled. None of these stations missed more than 5% of measurements during the study period. Among the 174 stations, there were 20 stations in Beijing City, 12 stations in Tianjin City, and 142 stations in Hebei Province. The BTH region presents topographic characteristics of the high northwest and the low southeast regions, and the height of the station increases from south to north. According to historical data, topographic features, and geographical distribution maps, the BTH region was divided into six regions: Beijing City, Tianjin City, Northern Hebei (Zhangjiakou and Chengde), Eastern Hebei (Qinhuangdao and Tangshan), Central Hebei (Shijiazhuang, Hengshui, Baoding, Cangzhou, and Langfang), and Southern Hebei (Xingtai and Handan). The locations of these stations and the topography of the BTH region are shown in Figure 1.
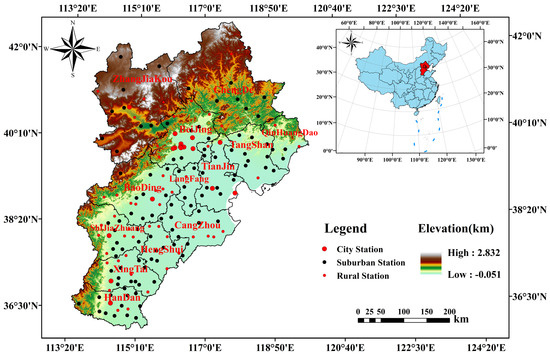
Figure 1.
The spatial distribution of meteorological stations over the BTH region.
2.2. Indices of Temperature Extremes
We used two of the extreme temperature indices from the ETCCDI of the World Meteorological Organization’s (WMO) Climate Panel (CCI) [30]: the extreme daily maximum temperature (TXx) and the number of high-temperature days (Htd). These two indices have been widely used in analyzing the changes in extreme heat events over different regions, including the BTH region [31]. In this study, TXx was defined as the largest daily maximum temperature in a year, and Htd was defined as the number of days in a year with a daily maximum temperature of ≥35 °C (Table 1). The probability distribution function curve yields that the daily maximum temperature of 35 °C in summer over the BTH region in the last 42 years corresponds to 95.34 percentile values, so it is reasonable to use 35 °C to define Htd (the figure was omitted). These two indices were used to represent the intensity and the frequency of extreme heat events, respectively.

Table 1.
Indices of extreme heat events.
2.3. Methods
We used a linear regression method to analyze the trends in extreme heat events, and we used the Mann–Kendall test to identify whether there were transitions in changes in TXx over the BTH region. As shown in Figure 2, the results of the Mann–Kendall test indicated a transition in the mid-1990s (UB and UF are parameters of the M–K test). Therefore, we separated the study period into two periods to further study the interdecadal variation of extreme heat events over the BTH region: P1 was for the period from 1979 to 1994, and P2 was for 1997 to 2020. In addition, the linregress function in Python was used to test the significance of the linear trend of extreme heat events at each station over the BTH region. Finally, Kriging interpolation was used to characterize the spatial distribution of extreme heat events.
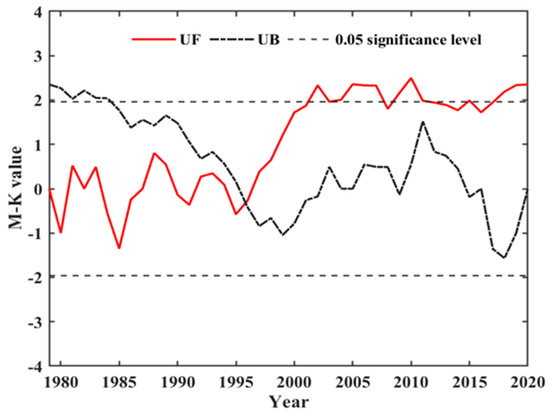
Figure 2.
Mann–Kendall mutation test results for the regional mean TXx index over the BTH region.
3. Results
3.1. Climatic Characteristics of Temperature over the BTH Region
The climatic features of temperature are provided as a background to understand the changes in temperature extremes over the BTH region during recent decades. There were evident seasonal differences in the monthly mean values of daily mean temperatures and daily maximum temperatures (Figure 3). Both the daily mean temperatures and the daily maximum temperatures were obviously higher in summer (June, July, and August) and lower in winter (December, January, and February). During 1979 to 2020, the 12-month mean value of daily mean temperatures was 12.1 °C; the highest monthly mean of daily mean temperatures was in July, at 26.1 °C, while the lowest monthly mean of daily mean temperatures was in January, at −4.4 °C (Figure 3a). The features of the monthly mean values of daily maximum temperatures (Figure 3b) were consistent with those of daily mean temperatures (Figure 3a). The highest and lowest monthly means of daily maximum temperatures were also in July and January, at 31.1 °C and 1.7 °C, respectively. The summer mean values of daily mean temperatures and daily maximum temperatures were 25.4 °C and 30.6 °C, respectively, and were apparently higher than those for the other seasons. Thus, we studied the variation characteristics of extreme heat events in summer.
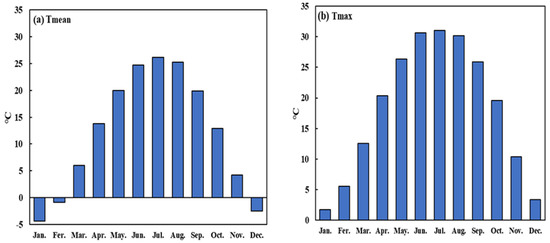
Figure 3.
Monthly mean values of daily mean temperatures (a) and daily maximum temperatures (b) for 1979 to 2020 over the BTH region.
There were temperature gradients between the south and north of the BTH region, where the summer mean values of both daily mean temperatures (Figure 4a) and daily maximum temperatures (Figure 4b) were higher in the south and lower in the north. The summer mean values of daily mean temperatures and daily maximum temperatures ranged from 25 to 27 °C and from 31 to 33 °C, respectively, in areas south of 40° N, and they ranged from 21 to 25 °C and from 27 to 31 °C, respectively, in areas north of 40° N. This spatial pattern of being higher in the south and lower in the north was also detected in the temperature extremes. Over regions south of 40° N, TXx was usually higher than 35 °C, and the highest values, above 39 °C, were detected over the southern parts of Hebei Province (Figure 4c). Consistent with TXx, the Htd value was higher in the south and lower in the north of BTH region (Figure 4d). Htd was 15 to 18 d over the southern parts of Hebei Province, while it was only 0 to 3 over the regions north of 40° N.
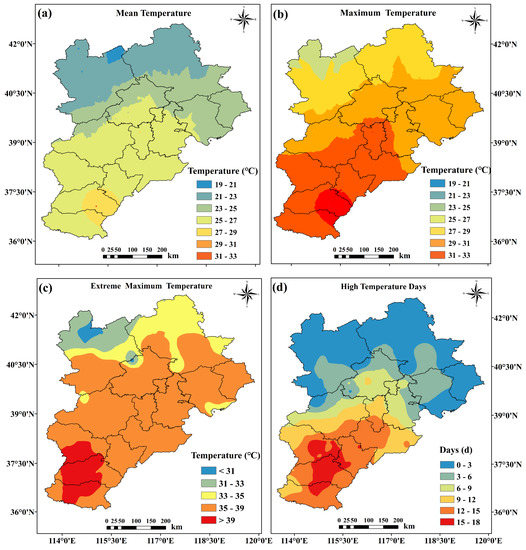
Figure 4.
Spatial distribution of summer mean values of daily mean temperatures (a), daily maximum temperatures (b), TXx (c), and Htd (d) over the BTH region during 1979 to 2020.
We statistically calculated the spatial distribution of the correlation coefficients between the extreme heat event indicators of each station over the BTH region and the regional mean over the BTH region from 1979 to 2020, to investigate the influence of the topographic features of the BTH region on the changes in extreme heat events. The results show that the correlation coefficients of TXx for all stations over the BTH region and the whole regional mean were above 0.5 and most stations had correlation coefficients above 0.7, showing a good correlation. The Htd values of most stations over the BTH region also showed a strong correlation, and only five stations showed a weak correlation (0.2 < r < 0.4) with the BTH regional mean, which had a small effect on the whole regional mean. Therefore, the influence of topographic features on extreme heat events over the BTH region was weak, and the spatial and temporal variation characteristics of the mean values of extreme heat events can summarize the variation characteristics of extreme heat events in the whole BTH region.
3.2. Interdecadal Variation in Summer Extreme Maximum Temperatures over the BTH Region during 1979 to 2020
There were evident interdecadal differences in TXx between P1 and P2. In the 1980s and the early 1990s, the TXx value of the BTH region fluctuated steadily, but it then suddenly increased in the mid-1990s until the early 2010s, from which point the TXx value of the BTH region remained high. In 2018, TXx began to decline over the BTH region. In general, TXx showed a significant positive linear trend from the summer of 1979 to 2020. In different time periods, TXx showed a downward trend in P2 and a slight upward trend and weak volatility in P1 (Figure 5a).
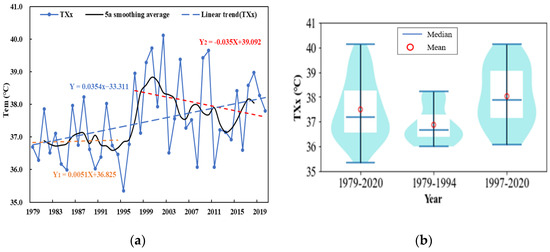
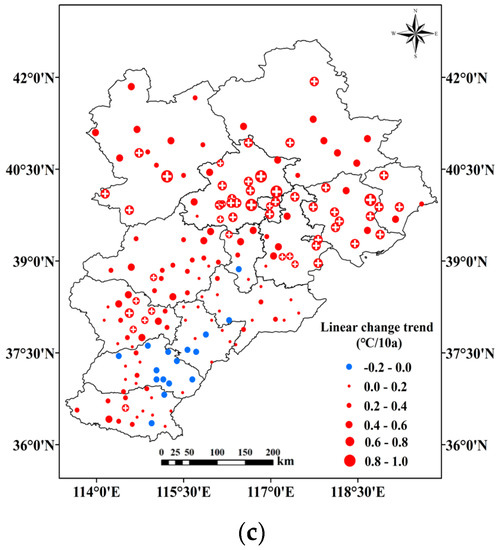
Figure 5.
(a) Time series (dot line) and linear trends (dash lines) of TXx over the BTH region during 1979–2020; (b) violin plots of TXx for different periods; (c) linear change trend of TXx (⊕ means that it passed the 99%-significance test).
The violin plot of TXx during different periods also showed clear interdecadal differences between P1 and P2 (Figure 5b). Obviously higher values and larger interannual variabilities were observed during P2. During P1, the value of TXx was mainly concentrated between 36 °C and 37 °C, with a mean value of 37 °C. However, during P2, it mainly concentrated in the temperature ranges of 37 °C to 38 °C and 39 to 40 °C, with a mean value of 38 °C. The mean value for P2 was higher than both that for P1 and that for the entire study period. In general, against the background of global warming, TXx in the BTH region showed an increasing trend during the whole study period, and it showed obvious interdecadal variation characteristics.
There were differences in the linear change trend of TXx in different regions, but the overall trend was one of the increases over the BTH region (Figure 5c). TXx showed an increasing trend at 158 (90.8%) stations, and most of the stations had a larger and more significant TXx growth rate (passing the 99%-significance test) in Beijing and Eastern Hebei Province. The stations showing a weakly decreasing trend for TXx were mainly concentrated in Central and Eastern Hebei Province.
An evident rise in TXx was observed over nearly the entire BTH region between the two periods, particularly in the northeastern parts. During P1, TXx was usually above 37 °C over Central and Southern Hebei Province, between 35 and 37 °C for Beijing City and Tianjin City and below 35 °C over Northern Hebei Province (Figure 6a). Compared with those during P1, during P2, areas with TXx above 37 °C were extended to Beijing and Tianjin, while areas with relatively high temperatures of 39 °C were extended to Shijiazhuang City in Southern Hebei Province and Central Hebei Province. The area with a relatively low TXx of 35 °C was narrowed to a small part of the northern mountainous area of Northern Hebei Province (Figure 6b).
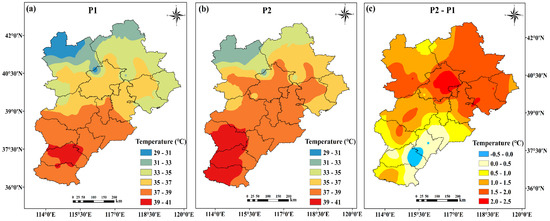
Figure 6.
Summer mean values of TXx for P1 (a) and P2 (b); and (c) the differences of summer mean values of TXx between P2 and P1.
Positive differences in TXx between P2 and P1 were observed over the entire BTH region, except for Xingtai City in Southern Hebei Province (Figure 6c). Apparently, the rise in TXx was larger in the northern parts of the BTH region during recent decades. The difference was less than 1.0 °C in the southern parts of Hebei Province, but it was larger than 1.0 °C in the central and northern parts of the BTH region. A relatively larger difference was detected in the northeastern parts, with a rise of 1.5−2.0 °C, and the largest difference was in Beijing City, with a rise of 2.0−2.5 °C. We note that there were small or negative differences in TXx between P2 and P1 over regions such as Handan, Xingtai, Hengshui, and Cangzhou. This may be related to the influence of irrigation in Southern and Central Hebei. Irrigation has a certain cooling effect on the daily maximum temperature, which weakens the influence of urbanization [32,33].
According to our statistical analysis of the data, the interdecadal change in the monthly TXx was also evident (Table 2). The monthly scale change for TXx in different interdecadal (P1 and P2) periods is represented by the number of stations. The statistical method was as follows: For each month in summer (June to August), we calculated the total number of stations reporting TXx in that month for each year in periods P1 (16a) and P2 (24a). The numbers of stations in each year were added for all of P1 or P2, and the result was divided by the total number of years in period P1 or P2 separately to give the monthly scale distribution of TXx. The number of TXx stations in the BTH region decreased in June and increased in July from P1 to P2. During P1, June was the month with a dominant TXx occurrence for the BTH stations, while during P2, the occurrences of TXx in June and July were nearly equal. This increase in TXx in July may have resulted from more long-lasting heat waves or much hotter temperatures in July in P2 [34].
Table 2.
Numbers of TXx stations in different months of summer by the period over the BTH region (number).
We analyzed the distribution of the indicator TXx in Table 2 in two different periods by superimposing the wind field and the geopotential height field model (the figure was omitted). It was concluded that the TXx values in June and July were influenced by warm wind anomalies and sinking air, resulting in different periods of P1 and P2. The occurrence of the TXx in August during P2 may be influenced by cold and warm advection.
3.3. Interdecadal Variation in Summer High-Temperature Days over the BTH Region during 1979 to 2020
Interdecadal variation in temperature extremes over the BTH region was also evident in the results for Htd between the two periods. Htd showed a downward trend from 1979 to the mid-1990s; It suddenly rose in the late 1990s and remained high until the mid-2000s and then showed a downward trend. Therefore, Htd showed a downward trend in different periods of P1 and P2, and the change of standard deviation reflected the greater dispersion and volatility of Htd in P2 (Figure 7a). There were some similarities in the long-term changes in Htd and TXx. The summer mean values of Htd and TXx were both lowest in the 1980s and the early 1990s, but they abruptly shifted to high values in the mid-1990s, with a negative trend in P2. The mean values and interannual variabilities of Htd in P2 were obviously larger than those in P1 and in the entire study period (Figure 7b), which was the same as TXx. In the whole period, the mean value of Htd was 9 d, and its minimum value was 3 d. During P1, the value of Htd was mainly concentrated between 4 and 6 d, with a mean value of 7 d. The mean value for P2 was higher than that for P1, which was 12 d. During P2, Htd was mainly concentrated between 6 and 9 d.
Figure 7.
(a) Time series (dot line) and linear trends (dash lines) of Htd over the BTH region during 1979–2020; (b) violin plots of Htd for different periods; (c) linear change trend of Htd (⊕ means that it passed the 99%-significance test).
Almost the entire BTH region showed an increasing trend for Htd, and it decreased at only three stations, with values from −0.2 to 0.0 d/10a (Figure 7c). Most of the stations in the three major cities, Beijing City, Tianjin City, and Shijiazhuang City, had relatively large growth rates and a significant increasing trend (passing the 99%-significance test).
In the whole study period, the summer Htd was mainly concentrated in July over the BTH region. The mean proportions of Htd in June to August in summer were 44.4%, 46.2%, and 9.4%, respectively. In June, the proportion of Htd was usually below 30% over the northern mountainous Hebei Province, and the proportion of Htd was usually between 40% and 60% over Central and Southern Hebei Province (Figure 8a). In July, the proportion of Htd was above 50% over nearly the entire BTH region, accompanied by a northward migration of the regions with a high proportion (Figure 8b). Compared with those in June and July, the proportion of Htd was significantly decreased in August over the BTH region, at less than 30% (Figure 8c).
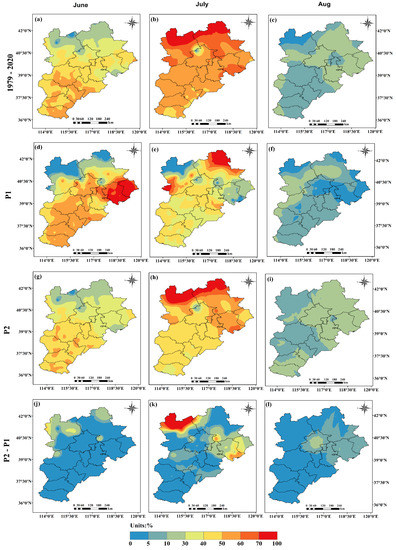
Figure 8.
The proportions of Htd in June (a), July (b), and August (c) to summer totals for the period 1979 to 2020; the proportions of Htd in June (d), July (e), and August (f) to summer totals for P1; the proportions of Htd in June (g), July (h), and August (i) to summer totals for P2; the difference of the proportions of Htd in June (j), July (k), and August (l) to summer totals between P2 and P1.
The monthly mean proportion and spatial distribution of Htd had certain regional variation characteristics between different decades over the BTH region. The proportion of Htd decreased in June and increased in July from P1 to P2. This is consistent with the interdecadal change in TXx monthly statistics in Table 2. During P1, the proportion of Htd was relatively high in June, reaching 55.2%. The high value areas were mainly concentrated in Eastern Hebei Province, accounting for more than 70%. During P2, the proportion of Htd was only 38.2% in June. In July, the proportion of Htd was increased in P2, and the area of the high proportion expanded from Chengde City to the northern mountainous Hebei Province. In August, the proportion of Htd was usually below 30% in P1 and P2 over the BTH region. Further analysis of the difference between periods P1 and P2 of Htd over the BTH region was conducted. It can be seen more visually that in June, the proportion of Htd decreased significantly in almost the entire BTH region, except for the mountainous areas in Northern Hebei Province. In particular, the largest decrease in the proportion was observed in Eastern Hebei Province (Figure 8j). In July, the largest increase in Htd was observed in the northern region of Zhangjiakou City in Northern Hebei Province, and the proportion of Htd in Eastern Hebei Province also increased significantly during P2 (Figure 8k). In August, the proportions of Htd in Beijing and Eastern Hebei Province increased significantly, while the rates of increase in Central and Southern Hebei Province were insignificant (Figure 8l).
4. Discussion and Conclusions
In this study, based on the daily maximum temperature dataset from 174 stations in BTH during summers from 1979 to 2020, two extreme heat event indices—the extreme maximum temperature (TXx) and the number of high-temperature days (Htd)—were selected to analyze the spatial and temporal changes in extreme heat events in the Beijing–Tianjin–Hebei region at different scales, such as monthly, annual, and interdecadal. Based on the results of the study, our main findings are as follows:
- (1)
- During the period 1979–2020, extreme heat events showed an overall upward trend, and TXx and Htd reflected significant interdecadal differences and some similarities in the BTH region. Before the mid-1990s (P1), both TXx and Htd were low values. After the mid-1990s (P2), both indices showed an interrupted increase to high values, but a decreasing trend was observed in the later period.
- (2)
- Extreme heat events primarily occurred in the southern part of the BTH region. The most significant interannual changes in TXx were concentrated in Beijing City, Tianjin City, and the Northeastern Hebei Province, with most regions experiencing an increase in TXx by 1.5–2.0 °C. Notably, the Handan–Xingtai–Hengshui–Cangzhou area exhibited either negative or small TXx values.
- (3)
- In regions experiencing a notable increase in Htd over different decades, there was a discernible migration of high-value areas from south to north. Specifically, in the background of global warming, Htd increased most significantly in Beijing, Tianjin, and Shijiazhuang Cities.
- (4)
- In terms of interdecadal variation, the extreme heat events in the BTH region showed a decreasing trend in June and an increasing trend in July. An increase in the number of stations reporting TXx in July was observed from P1 to P2. For Htd, the number of high-temperature days in July contributed the most over the whole summer. From P1 to P2, the percentage of Htd in July increased for almost the entire BTH region.
The frequent occurrence of extreme heat events has many impacts on social and economic development and human health over the BTH region. Therefore, understanding the characteristics and trends of extreme heat events is crucial for the sustainable development of rapidly urbanized regions. This study mainly divided the BTH into small regions based on the geographical location and analyzed extreme heat events based on a single station per region. In this study, the interannual and inter-monthly spatiotemporal variation characteristics of the extreme heat event index during P1 and P2 showed a downward trend during P2, which may be related to extreme precipitation and land irrigation [32,35]. At the same time, we also found spatial characteristics of regional differences between the high extreme heat events in the south and the low extreme heat events in the north over the BTH region, especially the proportions of Htd in different years and months, which can provide a reference for future regional disaster prevention and reduction. In addition, the increase in TXx can reach 1.5–2.0 °C in big cities such as Beijing and Tianjin, which may be related to the dense population in big cities and the accelerated urbanization process [36].
Extreme heat events have become more obvious and more frequent in response to global warming, and further studies are needed to discuss their causes and effects over the BTH region. Extreme heat events in urban agglomerations are the result of climate change, urbanization, and atmospheric circulation, and their mechanism is more complex [37,38]. Summer precipitation [38], subtropical highs, and ENSO [39] are also important factors affecting extreme heat events [40,41]. Xie et al. [42] analyzed the interdecadal variation of extreme high-temperature days from June and early July to midsummer in North China from 1981 to 2021. They found that there is a significant interdecadal cycle of extreme heat events in North China and its annual variability is related to the Indian Ocean Pacific Warm Pool and the Northwest Pacific Dipole (IPOD). We have calculated the correlation coefficients between the extreme heat events indices TXx and Htd at different time periods over the BTH region and the modes indices at different rates based on previous research results (Table 3). The results showed that during the P1 period, extreme heat events over the BTH region were mainly regulated by PDO, which played a positive role. The correlation coefficients between PDO and TXx and Htd were 0.35 and 0.55, respectively. Monsoon intensity mainly played a negative role. During P2, monsoon intensity positively affected the interannual variation of extreme heat events over the BTH region, while TBO played a negative role. Therefore, in future studies, we will focus on the influence of PDO and the monsoon intensity on extreme heat events over the BTH region to reveal the physical mechanisms of their variability. In addition, regional climate models can be further combined to study future changes in extreme heat events in the BTH region and improve the region’s ability to cope with climate change and extreme heat events.
Table 3.
Correlation coefficients of TXx and Htd with different modes at different periods.
Author Contributions
Methodology, T.X.; Writing—original draft, Y.L.; Writing—review & editing, J.Z.; Funding acquisition, J.W. All authors have read and agreed to the published version of the manuscript.
Funding
This research was funded by (1) the Innovation and Development Project of China Meteorological Administration: CXFZ2022J030; (2) the National Science Foundation of China: 42175078; (3) the “Disaster Risk Assessment of Extreme Climate Events and Resilient Livable Strategy Research in the Beijing-Tianjin-Hebei Region” of Science and Technology Innovation 2035 Program of Beijing University of Civil Engineering and Architecture: 30080922013.
Institutional Review Board Statement
Not applicable.
Informed Consent Statement
Not applicable.
Data Availability Statement
Daily temperature data of the meteorological stations can be downloaded from the National Information Center of the China Meteorological Administration http://data.cma.cn/, accessed on 5 May 2022.
Acknowledgments
The authors would like to express their sincere thanks to funding organizations. We would like to thank the reviewers for their valuable suggestions and comments.
Conflicts of Interest
The authors declare no conflict of interest.
References
- IPCC. Climate Change 2021: The Physical Science Basis. 2021. Available online: https://www.ipcc.ch/report/ar6/wg1/#FullReport (accessed on 1 August 2022).
- Shi, J.; Cui, L.; Wen, K.; Tian, Z.; Wei, P.; Zhang, B. Trends in the consecutive days of temperature and precipitation extremes in China during 1961–2015. Environ. Res. 2018, 161, 381–391. [Google Scholar] [CrossRef] [PubMed]
- Wang, Y.; Ding, Z.; Ma, Y. Spatial and temporal analysis of changes in temperature extremes in the non-monsoon region of China from 1961 to 2016. Theor. Appl. Clim. 2019, 137, 2697–2713. [Google Scholar] [CrossRef]
- Alexander, L.V.; Zhang, X.; Peterson, T.C.; Caesar, J.; Gleason, B.; Klein Tank, A.M.G.; Haylock, M.; Collins, D.; Trewin, B.; Rahimzadeh, F.; et al. Global observed changes in daily climate extremes of temperature and precipitation. J. Geophys. Res. 2006, 111, 1–22. [Google Scholar] [CrossRef]
- Donat, M.G.; Alexander, L.V.; Yang, H.; Durre, I.; Vose, R.; Dunn, R.J.H.; Willett, K.M.; Aguilar, E.; Brunet, M.; Caesar, J.; et al. Updated analyses of temperature and precipitation extreme indices since the beginning of the twentieth century: The HadEX2 dataset. J. Geophys. Res. Atmos. 2013, 118, 2098–2118. [Google Scholar] [CrossRef]
- Gao, J.; Sun, Y.; Liu, Q.; Zhou, M.; Lu, Y.; Li, L. Impact of extreme high temperature on mortality and regional level definition of heat wave: A multi-city study in China. Sci. Total. Environ. 2015, 505, 535–544. [Google Scholar] [CrossRef] [PubMed]
- Diffenbaugh, N.S.; Singh, D.; Mankin, J.S.; Horton, D.E.; Swain, D.L.; Touma, D.; Charland, A.; Liu, Y.; Haugen, M.; Tsiang, M.; et al. Quantifying the influence of global warming on unprecedented extreme climate events. Proc. Natl. Acad. Sci. USA 2017, 114, 4881–4886. [Google Scholar] [CrossRef] [PubMed]
- Li, K.; Amatus, G. Spatiotemporal Changes of Heat Waves and Extreme Temperatures in Main Cities of China from 1955 to 2014. Nat. Hazards Earth Syst. Sci. 2020, 20, 1889–1901. [Google Scholar] [CrossRef]
- Ye, L.; Shi, K.; Xin, Z.; Wang, C.; Zhang, C. Compound Droughts and Heat Waves in China. Sustainability 2019, 11, 3270. [Google Scholar] [CrossRef]
- Ren, L.; Zhou, T.; Zhang, W. Attribution of the record-breaking heat event over Northeast Asia in summer 2018: The role of circulation. Environ. Res. Lett. 2020, 15, 054018. [Google Scholar] [CrossRef]
- Xu, K.; Lu, R.; Mao, J.; Chen, R. Circulation anomalies in the mid–high latitudes responsible for the extremely hot summer of 2018 over northeast Asia. Atmos. Ocean. Sci. Lett. 2019, 12, 231–237. [Google Scholar] [CrossRef]
- Lianchun, S. Bule Book of Climate Change in China 2021; Science Press: Beijing, China, 2021. [Google Scholar]
- Ding, Y.; Wang, H. Newly acquired knowledge on the scientific issues related to climate change over the recent 100 years in China. Chin. Sci. Bull. 2015, 61, 1029–1041. [Google Scholar] [CrossRef]
- Ren, G.; Ding, Y.; Zhao, Z.; Zheng, J.; Wu, T.; Tang, G.; Xu, Y. Recent progress in studies of climate change in China. Adv. Atmos. Sci. 2012, 29, 958–977. [Google Scholar] [CrossRef]
- Guo, E.; Zhang, J.; Wang, Y.; Quan, L.; Zhang, R.; Zhang, F.; Zhou, M. Spatiotemporal variations of extreme climate events in Northeast China during 1960–2014. Ecol. Indic. 2018, 96, 669–683. [Google Scholar] [CrossRef]
- Tao, P.; Zhang, Y. Large-scale circulation features associated with the heat wave over Northeast China in summer 2018. Atmos. Ocean. Sci. Lett. 2019, 12, 254–260. [Google Scholar] [CrossRef]
- Ma, Z.G.; Fu, C.B.; Ren, X.B.; Yang, C. Relationship between annual extreme temperature trends and regional warming in northern China. J. Geogr. Sci. 2003, S1, 11–20. [Google Scholar] [CrossRef]
- Ma, H.; Wang, Y.; Lin, Z. Future Changes of Summer Heat Waves over Urban Agglomerations in Eastern China under 1.5 °C and 2.0 °C Global Warming. Front. Earth Sci. 2022, 10, 823286. [Google Scholar] [CrossRef]
- Feng, K.P. Temporal and Spatial Characteristics of Extreme Temperature in the Middle Reach of the Yellow River, China. Appl. Ecol. Environ. Res. 2019, 17, 11869–11885. [Google Scholar] [CrossRef]
- Sun, P.; Zhang, Q.; Yao, R.; Singh, V.P.; Song, C. Spatiotemporal Patterns of Extreme Temperature across the Huai River Basin, China, during 1961–2014, and Regional Responses to Global Changes. Sustainability 2018, 10, 1236. [Google Scholar] [CrossRef]
- You, Q.; Kang, S.; Aguilar, E.; Yan, Y. Changes in daily climate extremes in the eastern and central Tibetan Plateau during 1961–2005. J. Geophys. Res. Atmos. 2008, 113. [Google Scholar] [CrossRef]
- Xing, P.; Yang, R.Z.; Du, W.P.; Dang, B.; Xuan, C.Y.; Xiong, F.L. Spatiotemporal variation of high temperature day and heat wave in North China during 1961−2017. Sci. Geogr. Sin. 2020, 40, 1365–1376. [Google Scholar]
- Chu, M.; Lu, J.; Sun, D. Influence of Urban Agglomeration Expansion on Fragmentation of Green Space: A Case Study of Beijing-Tianjin-Hebei Urban Agglomeration. Land 2022, 11, 275. [Google Scholar] [CrossRef]
- Li, S.; Sun, Z.; Wang, Y.; Wang, Y. Understanding Urban Growth in Beijing-Tianjin-Hebei Region over the Past 100 Years Using Old Maps and Landsat Data. Remote Sens. 2021, 13, 3264. [Google Scholar] [CrossRef]
- Fang, C.; Luo, K.; Kong, Y.; Lin, H.; Ren, Y. Evaluating Performance and Elucidating the Mechanisms of Collaborative Development within the Beijing–Tianjin–Hebei Region, China. Sustainability 2018, 10, 471. [Google Scholar] [CrossRef]
- Wang, Y.; Ren, Y.; Song, L.; Xiang, Y. Responses of extreme high temperatures to urbanization in the Beijing–Tianjin–Hebei urban agglomeration in the context of a changing climate. Meteorol. Appl. 2021, 28, e2024. [Google Scholar] [CrossRef]
- Lin, W.; Chen, R.; Wen, Z.; Chen, W. Large-scale circulation features responsible for different types of extreme high temperatures with extreme coverage over South China. Int. J. Climatol. 2021, 42, 974–992. [Google Scholar] [CrossRef]
- Chen, R.; Lu, R. Large-scale circulation anomalies associated with ‘tropical night’ weather in Beijing, China. Int. J. Climatol. 2014, 34, 1980–1989. [Google Scholar] [CrossRef]
- Zheng, Z.; Xu, G.; Wang, Y.; Li, Q.; Li, J. Characteristics and main influence factors of heat waves in Beijing–Tianjin–Shijiazhuang cities of northern China in recent 50 years. Atmos. Sci. Lett. 2020, 21, e1001. [Google Scholar] [CrossRef]
- Wang, J.; Yan, Z.; Li, Z.; Liu, W.; Wang, Y. Impact of urbanization on changes in temperature extremes in Beijing during 1978–2008. Chin. Sci. Bull. 2013, 58, 4679–4686. [Google Scholar] [CrossRef]
- Jiang, R.; Yu, X.; Xie, J.; Zhao, Y.; Li, F.; Yang, M. Recent changes in daily climate extremes in a serious water shortage metropolitan region, a case study in Jing-Jin-Ji of China. Theor. Appl. Clim. 2017, 134, 565–584. [Google Scholar] [CrossRef]
- Shi, W.J.; Tao, F.L.; Liu, J.Y. Regional temperature change over the Huang-Huai-Hai Plain of China: The roles of irrigation versus urbanization. Int. J. Climatol 2014, 34, 1181–1195. [Google Scholar] [CrossRef]
- Lobell, D.B.; Bonfils, C.J.; Kueppers, L.M.; Snyder, M.A. Irrigation cooling effect on temperature and heat index extremes. Geophys. Res. Lett. 2008, 35. [Google Scholar] [CrossRef]
- Ren, F.J.; Zhong, Z.; Hu, Y.J.; Liu, B. Analysis of the causes for a continuous high temperature event over Beijing in early July 2010. In Proceedings of the 2011 International Conference on Machine Intelligence (ICMI 2011), Manila, Philippines, 25 July 2011; pp. 306–311. [Google Scholar]
- Tong, R.; Sun, W.; Han, Q.; Yu, J.; Tian, Z. Spatial and Temporal Variations in Extreme Precipitation and Temperature Events in the Beijing–Tianjin–Hebei Region of China over the Past Six Decades. Sustainability 2020, 12, 1415. [Google Scholar] [CrossRef]
- Luo, M.; Lau, N.C. Increasing Heat Stress in Urban Areas of Eastern China: Acceleration by Urbanization. Geophys. Res. Lett. 2018, 45, 13060–13069. [Google Scholar] [CrossRef]
- Li, M.; Luo, D.; Yao, Y.; Zhong, L. Large-scale atmospheric circulation control of summer extreme hot events over China. Int. J. Clim. 2019, 40, 1456–1476. [Google Scholar] [CrossRef]
- Jin, D.; Huo, L. Influence of tropical Atlantic sea surface temperature anomalies on the East Asian summer monsoon. Q. J. R. Meteorol. Soc. 2018, 144, 1490–1500. [Google Scholar] [CrossRef]
- Zhang, M.; Jin, D.; Wang, X.; Chen, L.; Luo, J.; Wang, Z. Seasonal transition of precedent Indian Ocean basin mode and subsequent Indian Ocean Dipole without El Niño–Southern Oscillation impact. Int. J. Clim. 2022, 42, 9023–9031. [Google Scholar] [CrossRef]
- Ding, T.; Gao, H.; Li, W. Extreme high-temperature event in southern China in 2016 and the possible role of cross-equatorial flows. Int. J. Clim. 2018, 38, 3579–3594. [Google Scholar] [CrossRef]
- Luo, M.; Lau, N.-C. Summer heat extremes in northern continents linked to developing ENSO events. Environ. Res. Lett. 2020, 15, 074042. [Google Scholar] [CrossRef]
- Xie, T.J.; Wang, J.; Feng, T.C.; Ding, T.; Zhao, L. Linkage of the decadal variability of extreme summer heat in North China with the IPOD since 1981. Adv. Atmos. Sci. 2023. [Google Scholar] [CrossRef]
Disclaimer/Publisher’s Note: The statements, opinions and data contained in all publications are solely those of the individual author(s) and contributor(s) and not of MDPI and/or the editor(s). MDPI and/or the editor(s) disclaim responsibility for any injury to people or property resulting from any ideas, methods, instructions or products referred to in the content. |
© 2023 by the authors. Licensee MDPI, Basel, Switzerland. This article is an open access article distributed under the terms and conditions of the Creative Commons Attribution (CC BY) license (https://creativecommons.org/licenses/by/4.0/).