Article

Compositional Difference and Health Risk Assessment of Polycyclic Aromatic Hydrocarbons over the Coal Spontaneous Combustion Zone

1
School of Earth Sciences and Resources, China University of Geosciences, Beijing 100083, China
2
Key Laboratory of Metallogeny and Mineral Resource Assessment, Institute of Mineral Resources, Chinese Academy of Geological Sciences, Beijing 100037, China
3
Geological Survey Institute of Ningxia Hui Autonomous Region, Yinchuan 750021, China
4
Research Institute of Petroleum Exploration and Development, Changqing Oilfield Company of CNPC, Xi’an 710018, China
*
Author to whom correspondence should be addressed.
Atmosphere 2023, 14(5), 855; https://doi.org/10.3390/atmos14050855
Submission received: 3 April 2023 / Revised: 6 May 2023 / Accepted: 10 May 2023 / Published: 11 May 2023
(This article belongs to the Section Air Quality and Human Health)

Abstract

:
In this study, the U.S. Environmental Protection Agency prioritized polycyclic aromatic hydrocarbons (PAHs), associated pollution level, and health risks were assessed in a typical coal spontaneous combustion zone in the Rujigou coal mine in Northwestern China. This study used gas chromatography-mass spectrometry (GC-MS) to detect the chemical composition, spatial variation, distribution profiles, impact of coal spontaneous combustion, and health risks of PAHs. The entire study area is divided into three zones according to different features: the spontaneous combustion zone (C-zone), the living zone (L-zone), and the non-spontaneous combustion zone (N-zone). The results showed that: (1) the highest concentrations were measured in the C-zone, and the average concentrations of PAHs in the C-zone, N-zone, and L-zone were 13.28 ng·m−3, 9.56 ng·m−3, and 7.67 ng·m−3, respectively. (2) The PAHs of the study area were mainly composed of three ring to five ring PAHs. (3) EPA positive matrix factorization (PMF) analysis of qualitative source apportionment of PAHs showed that chemical production was the major source of atmospheric PAHs in all three zones, followed by coal combustion. (4) The inhalation of PAHs showed higher potential cancer risk for children than for adults, and the impact of coal combustion in the C-zone was much greater than the other zone. The adverse health impacts associated with PAH exposure indicates the need for mitigation measures of pollution control in this region.

1. Introduction

Polycyclic aromatic hydrocarbons (PAHs), associated with emissions from incomplete combustion of fossil fuel and biomass burning, have well documented influences on global climate change, air quality, and health implications [1,2,3,4,5]. This research has shown that PAHs exist in almost every environment, including the atmosphere, rivers, soil, oceans, and even the interstellar medium [6]. PAHs have become a hot topic for worldwide research in recent years [7,8,9,10,11]. Research on PAHs has mostly focused on the existence of PAHs in the environment, biological toxicity, and degradation treatments [1,12,13,14,15,16]. PAHs have carcinogenic, teratogenic, and mutagenic effects. In 1977, the U.S. Environmental Protection Agency (US EPA) listed 16 PAHs in a priority pollutant list.
Spontaneous combustion of coal is an important problem for coal mines. Self-heating of coal begins when adequate oxygen from the air is sufficient to support the reaction between coal and oxygen. The heat produced by low-temperature oxidation of coal is not sufficiently dissipated either by conduction or convection. Hence, an increase in temperature within the coal mass arises [17], eventually leading to spontaneous combustion of coal.
The formation of PAHs during coal combustion mainly includes two processes: pyrolysis and high temperature synthesis [18]. Pyrolysis: the original structure of coal is destroyed during combustion and heating, the molecular bonds are broken, and the aromatic compounds break off to form PAHs. With the increase in temperature, the exfoliated high-ring PAHs may continue to decompose into low-ring PAHs [19]. High temperature synthesis: unsaturated long-chain aliphatic hydrocarbons are cyclized and dehydrogenated to form benzene rings. After the benzene rings are formed, according to the HACA (H-abstraction-C2H2-addition) reaction mechanism [20], acetylene and benzene rings react and become dehydrogenated. Then, acetylene adsorbs onto the benzene ring or the first reacted acetylene, followed by ring closure to achieve ring growth of the PAHs.
The Rujiigou coal mine is located in Ningxia, China, on the edge of the Helan Mountain Nature Reserve. It is famous for producing Taixi coal, a type of anthracite [21]. In the Rujigou coal mine, there are about 25 fire areas formed by spontaneous combustion of coal, five of which are within nature reserves [22]. The total area affected by the coal spontaneous combustion has exceeded 3.3 km2, and the deepest area is 280 m in depth [23]. It is estimated that this coal mine has already burned about 1.15 million tons of Taixi coal [24].
Coal spontaneous combustion is a big issue for the Rujigou coal mine in the Helan Mountains of Northwestern China. It not only causes the loss of coal resources, but it also releases a large amount of atmospheric particulate matter and PAHs, which will be ingested by people and pose a huge threat to the local environment and a significant human health hazard. According to the research, it is possible that spontaneous combustion in the Rujigou coal mine was due to the accumulations of coal litter and dust in combination with exposure to air, resulting in internal heating that leads to spontaneous combustion [25]. The area of spontaneous combustion in the coal mine is continuously increasing [26]. Therefore, it is necessary to conduct research on PAHs associated with coal spontaneous combustion in this area.
However, there are only few studies on PAHs in the spontaneous combustion zone in specific areas of the Taixi coal producing area of Northwestern China, which is considered to be one of the cleanest coal mines in the world [21,27]. Previous studies in this area have focused on the determination and control of the combustion range [22,23,24], and studies focusing on the resulting pollution are limited. There is a lack of comprehensive research examining the concentrations of PAHs in the atmosphere and their impact on human health.
In this study, results from field campaigns, focusing on the levels, sources, and health risks of 16 parent PAHs over the coal spontaneous combustion zone in the Helan Mountains, are presented. The specific research aims were as follows: (1) to characterize the distribution of PAHs in different specified regions of the Rujigou coal mine, (2) to analyze the composition distribution profiles, (3) to identify the sources of PAHs in the atmosphere, and (4) to evaluate human exposure to carcinogenic PAHs and human impacts based on ILCR.
To assess soil quality, air quality, and health risks, soil samples and atmospheric PAHs were collected around the coal mine. In addition, this study applied correlation analysis and positive matrix factorization (PMF) to analyze the source of pollutants in the study area and to determine the degree of the environmental impact of the spontaneous combustion of coal.
This work highlights the role of factors associated with coal spontaneous combustion that affect the character and variability of 16 PAHs and their individual influence on different regions. Results from this study fill the void of PAHs in typical coal spontaneous combustion processes, and it is crucially important for a better understanding on how to construct a harmonious regional environment in the Helan Mountains of Northwestern China. The results of this study also help to identify the main pollution sources and help to formulate appropriate policies to deal with pollutants from the spontaneous combustion of coal.

2. Materials and Methods

2.1. Sampling Site Characteristics

The Rujigou coal mine is located in the hinterland of the Helan Mountains. The mining area is about 90 km2. From 1958 to 2003, the cumulative production and sales of coal were 24.97 million tons, with an output value of 1.65 billion yuan (CNY). The average annual output in recent years has been about 300,000 tons. The Helan Mountains have a typical continental monsoon climate, with long and cold winters, short and hot summers, and a relatively dry climate. A northwest wind prevails throughout the year, with an annual average wind speed of 7.5 m·s−1 [28], and the average wind speed during the sampling period was 2 m/s, with peak gusts reaching up to 8 m/s. The water and heat conditions of the Helan Mountains have clear differences with increasing altitude. The annual average temperature of the east slope is 8.2 °C, and the annual average precipitation is 183.3 mm [29].
The sampling was conducted during spring, prior to the rainy season (July to September). In order to research the impact of coal spontaneous combustion on the environment and human health, a large-scale investigation was performed in three distinct zones (Figure 1):
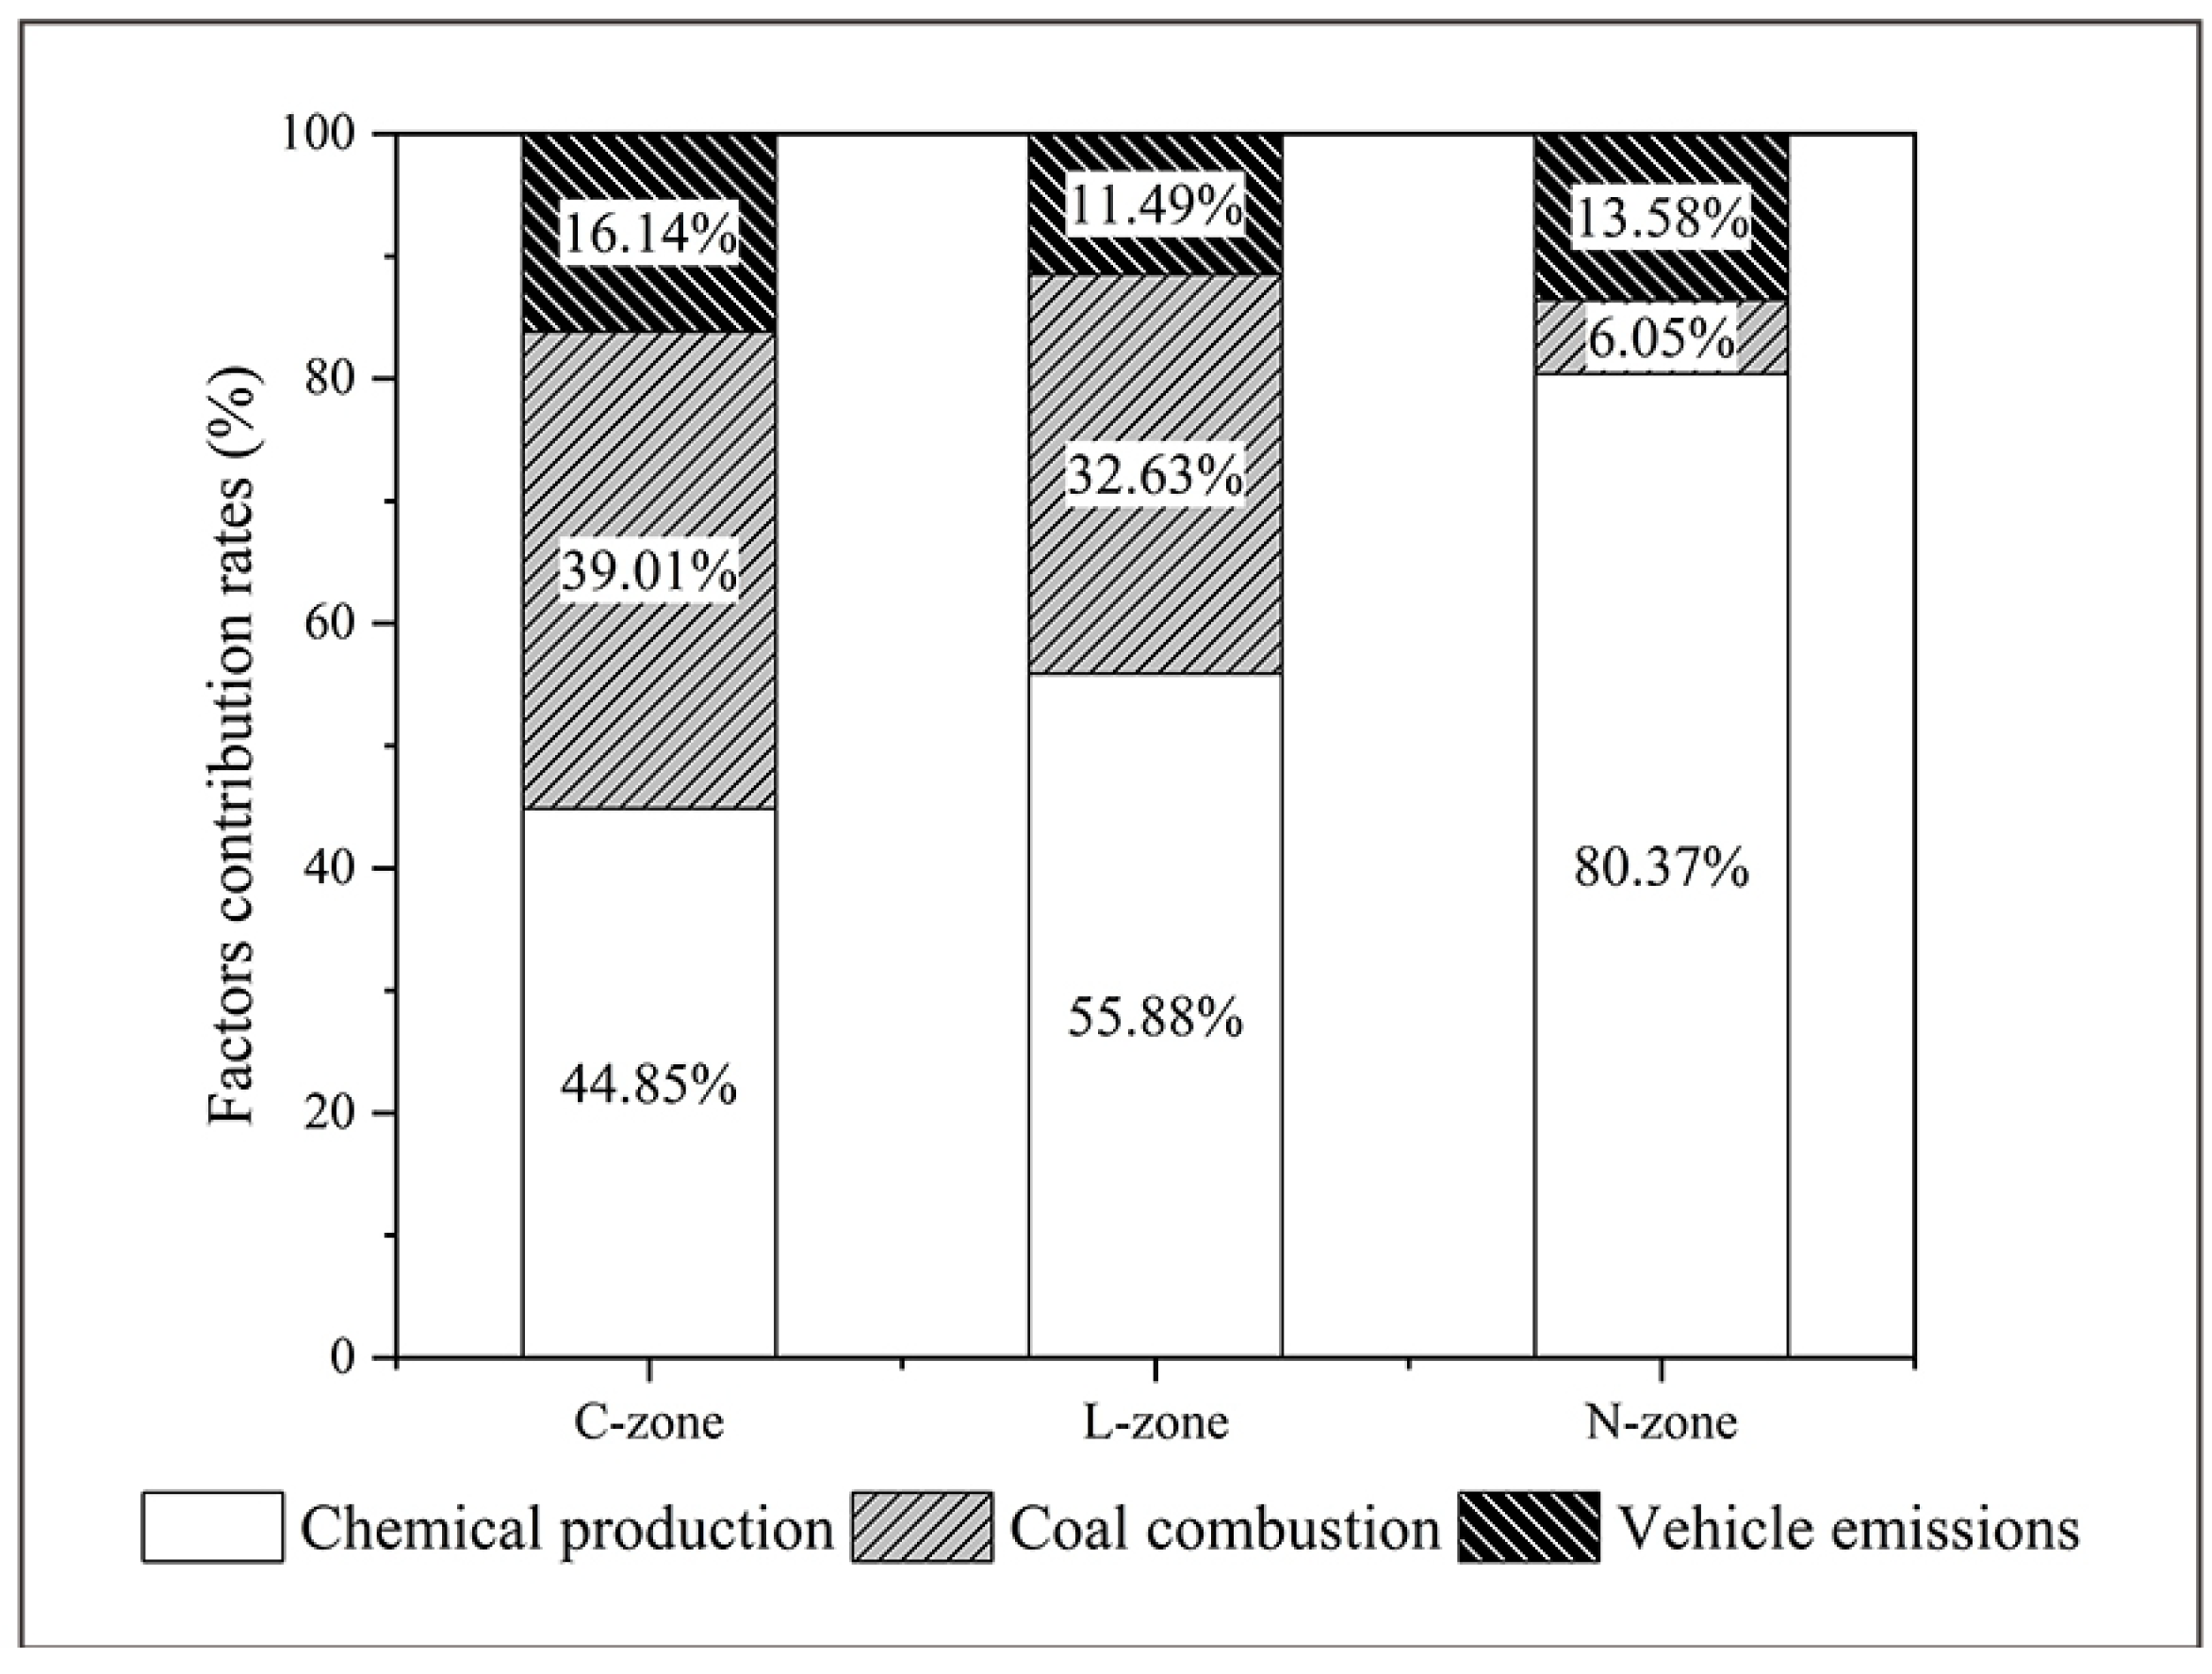
  • The spontaneous combustion zone (C-zone): there are two main spontaneous combustion zones, which are located in the northeast and southwest of the mining area (sampling sites 1 to 4 and 6 to 9);
  • The living zone (L-zone): the living zone is located between the two spontaneous combustion zones, in the middle of the mining area, and it is mainly used for the residence of miners and their families (sampling site 5).
  • The non-spontaneous combustion zone (N-zone) represents the other zones away from the mining area (sampling site 10).

2.2. PAH Measurements

In this study, we analyzed 16 PAHs that were prioritized by the US EPA. The 16 PAHs include Naphthalene (Nap), Acenaphthylene (Acy), Acenaphthene (Ace), Fluorene (Flu), Phenanthrene (Phe), Anthracene (Ant), Fluoranthene (Fluo), Pyrene (Pyr), Chrysene (Chry), Benzo[a]anthracene (BaA), Benzo[b]fluoranthene (BbF), Benzo[k]fluoranthene (BkF), Benzo[a]pyrene (BaP), Dibenzo[a,h]anthrancene (DbahA), Indeno [1,2,3-cd]pyrene (IncdP), and Benzo[g,h,i]perylene (BghiP). In total, 16 PAH samples were collected by passive sampling. In this study, we used the passive atmospheric sampler (PAS) to sample the PAHs in the atmosphere. The PAHs were adsorbed on a polyurethane foam (PUF) disk, which was protected by stainless steel chambers, shielding it from sunlight and wind effects. The radius of the PUF disks is 7 cm, with a thickness of 1.35 cm, a weight of 4.35 g, and a surface area of 367 cm2. All the PUF disks were decontaminated before sampling. Specific steps are as follows: washing with pure water, washing using Soxhlet extraction with n-hexane and acetone for 16 h, vacuum drying, and being stored away from light and air using aluminum foil and polyethylene bags. The sampling device needs to be cleaned with acetone before installing the PUF disk. During the sampling process, the samplers were fixed at a distance of 1.5 m from the ground, which is the altitude of human breathing [30]. When the sampling ended, sampling devices were taken apart, and the PUF disks were collected carefully to avoid contamination. The sampled PUF disks also need to be stored away from light and air using aluminum foil and polyethylene bags.

2.3. Sampling Pre-Treatment and Extraction

The detection method for PAHs in the PUF disk follows the protocols outlined in Chen et al. [30] and Yang et al. [31]. Each sampled PUF disk was extracted by Soxhlet extraction with a 250 mL solvent mixture for 24 h. The solvent mixture is composed of dichloromethane and n-hexane (1:1, v/v), with spiking with 200 ng deuterated PAHs (benzo[a]pyrene-d12, acenaphthene-d10) being performed as surrogate standards. The extract was concentrated to 2 mL, and it was purified by an extraction column. The extraction column needs to be precleaned before being used with a 15 mL solvent mixture of dichloromethane and n-hexane (1:1, v/v). After adding the concentrated extraction solution, the column was eluted sequentially with a solution of 25 mL n-hexane and a 50 mL solvent mixture of dichloromethane and n-hexane (1:1, v/v). The cleaned extraction solution was vacuum-evaporated and reconstituted to exactly 1.0 mL under a mild nitrogen flow by n-hexane solvent. The final extraction solution was stored in gas chromatography vials for analysis.
The concentrations of PAHs were analyzed by gas chromatography-mass spectrometry (GC-MS). The type of the GC-MS is Agilent 7890, with a 5977A mass selective detector (Agilent 5977A, Santa Clara, CA, USA) and a DB-5 capillary column (30 m × 0.25 mm × 0.25 μm) being equipped, and the detection limit for the analytical procedure was 0.037–0.099 ng·m−3. The temperature of the oven was programmed to be maintained at 60 °C for 1 min, and then it was increased to 160 °C at a rate of 10 °C·min−1, followed by an increase to 260 °C at a rate of 8 °C·min−1, and, finally, it was increased to 300 °C at a rate of 6 °C·min−1. The field blanks, procedural blanks, spiked blanks, and replicate samples were analyzed along with field samples. All of the data were subjected to strict quality control procedures.

2.4. Health Risk Assessment

PAHs are carcinogenic and pose a risk to human beings [32]. Benzo[a]pyrene has a strong toxicity and is a common PAH. To estimate the physiological toxicity of PAHs, the toxicity equivalent factor (TEF) is commonly used to convert the concentration of other PAH monomers into the corresponding concentration of Benzo[a]pyrene (BaPeq) (ng·m−3). The total toxicity of PAHs was assessed using toxic equivalent quantity (TEQ) (ng·m−3), which is a sum of each PAH monomer concentration expressed as BaPeq. The calculation equation is as follows:
T E Q = B a P e q = i = 1 n C i × T E F i
where Ci is the concentration of PAH monomer i, and TEFi is its corresponding toxicity equivalent factor. The TEF values of Nap, Acy, Ace, Flu, Phe, Ant, Fluo, Pyr, Chry, BaA, BbF, BkF, BaP, DbahA, IncdP, and BghiP are 1.0 × 10⁻³, 1.0 × 10⁻³, 1.0 × 10⁻³, 1.0 × 10⁻³, 1.0 × 10⁻³, 1.0 × 10⁻², 1.0 × 10⁻³, 1.0 × 10⁻³, 1.0 × 10⁻¹, 1.0 × 10⁻¹, 1.0 × 10⁻¹, 1.0 × 10⁻¹, 1.0, 1.0 × 10⁻¹, 5.0, and 1.0 × 10⁻², respectively [33].
PAHs in the atmosphere enter the human body mainly through the respiratory system and are toxic to human beings. This was evaluated by calculating the incremental lifetime cancer risk (ILCR) for inhalation of PAHs. It is expressed as the following:
I L C R = T E Q × C S F × I n h R × E F × E D × C F B W × A T
where carcinogenic slope factor (CFS) is 3.14 kg·d−1·mg−1 for children, as well as for adults [33]; the inhalation rate (InhR) is 5 m3·d−1 for children, and it is 20 m3·d−1 for adults; the exposure frequency (EF) is 365 d·yr−1 for both children and adults; the exposure durations (Eds) are 6 and 24 years for children and adults, respectively; the conversion factor (CF) is 1.0 × 10⁻⁶ mg·ng−1 for either children or adults; the body weights (BWs) are 15 kg for children and 61.80 kg for adults [34]); the averaging exposure time (AT) is ED × 365 d for both children and adults.
If ILCR values are observed at <1.00 × 10⁻⁶, this indicates an acceptable risk to people, while >1.00 × 10⁻⁴ shows the potential of significant risk, and the values between 1.00 × 10⁻⁶ and 1.00 × 10⁻⁴ indicate a potentially carcinogenic risk to humans [35].

3. Results

3.1. Concentration Levels, Compositions and Spatial Variation of PAHs

The concentrations of PAHs in the atmosphere for three zones were summarized in Table 1 and Figure 2. BaP, Ace, and BaA were the most critical pollutants in the L-zone and the N-zone. In addition, Nap also accounted for a large proportion of PAHs in the non-spontaneous combustion zone. The C-zone exhibited similar characteristics compared to the other two zones. BaP, Ace, and Nap were the primary PAH pollutants in the C-zone. Meanwhile, BaA, Ant, IncdP, and DbahA also had relatively high proportions. The higher proportions of Nap and Ace in the PAHs of the C-zone were consistent with the characteristics of PAHs generated by coal combustion [36,37]. The total concentrations of 16 PAHs (ΣPAHs) in three zones are shown in Figure 3. The results indicate that the spontaneous combustion zone has the highest mean value (13.28 ng·m−3), indicating that spontaneous combustion of coal has a strong effect on PAH concentrations in the atmosphere.
The distribution of PAHs over different zones and different ring numbers in the study area is shown in Figure 4. The proportions of PAHs with different ring numbers in ΣPAHs for the spontaneous combustion zone were five rings > three rings > four rings > two rings > six rings, which was consistent with the living zone. Previous studies on the mining and mine fire areas in Dhanbad City, India, have shown that the PAHs were arranged in the order of four rings > six rings > five rings [38]. The different characteristics observed in the Rujiigou coal mine may be attributed to the mixing of PAHs from different sources. The proportions in the non-spontaneous combustion zone, on the other hand, were three rings > five rings > four rings > six rings > two rings.
The proportions of PAHs with different ring numbers in each zone were not very different, indicating that coal spontaneous combustion has little effect on the composition of atmospheric PAHs in the study area, suggesting that it may not be the main source of PAHs in the atmosphere.

3.2. Potential Health Risk Assessment of PAHs

By expressing each PAH monomer concentration as BaPeq, the risks of 16 PAHs for children and adults were assessed. The mean ILCR values of children and adults in the spontaneous combustion zone, the non-spontaneous combustion zone, and the living zone were (7.41 × 10⁻⁶, 7.20 × 10⁻⁶), (2.92 × 10⁻⁶, 2.83 × 10⁻⁶), and (3.59 × 10⁻⁶, 3.48 × 10⁻⁶), respectively. All the results were between 1.00 × 10⁻⁶ and 1.00 × 10⁻⁴ for both children and adults, belonging to a potentially carcinogenic risk level. The ILCR values (4.168 × 10⁻⁵ for children and 4.048 × 10⁻⁵ for adults), with the highest PAH concentration sampling site (Sampling site 9), were an order of magnitude lower than the maximum limit of significant risk. The mean values of ILCR in each zone decreased in the order of the spontaneous combustion zone, the living zone, and the non-spontaneous combustion zone, which was consistent with the trend of PAHs concentration in each zone.

4. Discussion

Qualitative source apportionment of PAHs in the atmosphere of the study area was based on the EPA positive matrix factorization (PMF) 5.0 model [39]. In this work, the datasets of concentrations and uncertainty were introduced into the model to estimate the source contributions to PAHs. The model ran 20 times for the dataset, each time starting from a random start seed, and each run requiring convergence. This was performed to better understand the stability of the model solutions [40]. Three source factors were extracted in this study. The results obtained from the PMF model are presented in Figure 5.
In factor 1, Acy, Ace, BaA, and BaP were the predominant loading compounds, and their contribution ratios were 70.74%, 78.09%, 78.36%, and 83.48%, respectively. This is believed to be indicative of volatilization from creosote or coal tar, which have been characterized as volatile PAHs with low ring numbers [41]. Acy, Ace, and BaA have a low number of rings and belong to volatile PAHs, which correspond to this characteristic. Additionally, oil combustion could generate a similar bimodal pattern, heavily weighted in the more volatile PAH species with moderate loadings of higher-molecular-weight compounds [42]. The four predominant loading compounds correspond to this bimodal pattern, with volatile PAHs (Acy, Ace, and BaA) having a greater percentage. Meanwhile, high-molecular-weight PAH (BaP) had a moderately proportional percentage. These references, along with many coal processing enterprises around the study area, indicate that this factor is a chemical production source.
Factor 2 was heavily weighted by Nap, Flu, Phe, Ant, Fluo, and Pyr, which are three- and four-ring PAHs (except Nap). According to past research, the source appeared to be coal combustion. The proportion of low-ring compounds, such as fluorene, phenanthrene, and anthracene in the coal combustion source, is very high [42,43]. The high loading of phenanthrenes might relate to insufficient combustion of fuel, according to the research by Khairy and Lohmann [40] and Lee et al. [44]. Furthermore, several authors reported phenanthrene, anthracene, fluoranthene, and pyrene as predominant compounds resulting from the coal combustion process [22,41,42,45,46,47].
Factor 3 was consistent with vehicle emissions, which was mainly dominated by Chry, BbF, BkF, DbahA, IncdP, and BghiP. The profiles of these factors showed a significant contribution from the five- and six-ringed PAHs. The concentration of IncdP was consistent with the source of diesel engine emissions [29,48]. Additionally, this factor had a great contribution from BghiP and BkF, which have been previously been used as a marker for gasoline emissions [29,48,49,50]. Accordingly, Factor 3 was selected to represent vehicle emissions.
The contribution of the 3 factors for atmospheric PAHs in sampling sites was obtained by multiple linear regression, and the regression coefficient quantified the contribution of each factor. The results showed that chemical production was the major source of atmospheric PAHs in the spontaneous combustion zone, the living zone, and the non-spontaneous combustion zone, with contributions of 44.85%, 55.88%, and 80.37%, respectively (Figure 6). Coal combustion had the most obvious impact on the spontaneous combustion zone, followed by the living zone, which had much higher contributions than observed in the non-spontaneous combustion zone. Coal spontaneous combustion had an impact on atmospheric PAHs in the spontaneous combustion zone and living zone, while it was far less than the contribution of chemical production. In the non-spontaneous combustion zone, it had hardly any effect. The contributions of vehicle emissions to the atmospheric PAHs in the three zones were similar, with a contribution of around 15%.

5. Conclusions

The mean concentrations of PAHs in the spontaneous combustion zone (C-zone) were higher than that in the other zones, and a variable distribution profile of ΣPAHs was observed, as follows: C-zone > L-zone > N-zone. The concentration distribution of PAHs is mainly dominated by the middle rings (three to five rings). The relative contribution to the ΣPAHs showed pretty clear differences between different regions of the study area, with the highest proportion of six rings being found in the C-zone, which has a relatively higher potential for causing cancers. The health risk assessments for these PAHs showed an almost equal health risk for both adults and children. The mean values of ILCR were highest in the C-zone, and they decreased in the order of the C-zone, the L-zone, and the N-zone, which was consistent with the trend of PAHs concentration in each zone. Although ILCR were generally not exceeded, further attention to the higher value in the C-zone is still needed. Moreover, PMF extracted the three major sources for PAHs and showed that chemical production was the main source, while the proportion of coal combustion source PAHs of the ΣPAHs in C-zone is significantly higher than that in other areas. Overall, the study concluded that coal spontaneous combustion did increase the concentrations of PAHs in the atmosphere, the health risks to human beings, and changed the composition of PAHs in the atmosphere. Therefore, it is necessary to strengthen the monitoring of PAHs in this area and take certain measures to stop or reduce the emission of PAHs. For instance, measures, such as controlling spontaneous combustion in Rujigou coal mines and incorporating smoke and dust treatment devices in chemical plants nearby, can be implemented.

Author Contributions

Investigation, F.Y., J.G. and C.W.; writing—original draft preparation, F.Y.; writing—review and editing, Y.Y., N.A. and F.H.; supervision, Y.Y. All authors have read and agreed to the published version of the manuscript.

Funding

This research was funded by National Key Technologies Research and Development Program of China, grant numbers 2021YFC2901905 and 2021YFC2901900, as well as the China Geological Survey Project, grant numbers DD20221695, DD20230034, and DD20230290.

Institutional Review Board Statement

Not applicable.

Informed Consent Statement

Not applicable.

Data Availability Statement

The data can be obtained by contacting the author.

Conflicts of Interest

The authors declare that there are no conflicts of interest regarding the publication of this paper.

References

  1. Dat, N.-D.; Chang, M.B. Review on Characteristics of PAHs in Atmosphere, Anthropogenic Sources and Control Technologies. Sci. Total Environ. 2017, 609, 682–693. [Google Scholar] [CrossRef] [PubMed]
  2. Galarneau, E. Source Specificity and Atmospheric Processing of Airborne PAHs: Implications for Source Apportionment. Atmos. Environ. 2008, 42, 8139–8149. [Google Scholar] [CrossRef]
  3. Lin, Y.; Ma, Y.; Qiu, X.; Li, R.; Fang, Y.; Wang, J.; Zhu, Y.; Hu, D. Sources, Transformation, and Health Implications of PAHs and Their Nitrated, Hydroxylated, and Oxygenated Derivatives in PM2. 5 in Beijing. J. Geophys. Res. Atmos. 2015, 120, 7219–7228. [Google Scholar] [CrossRef]
  4. Xin, J.; Gong, C.; Liu, Z.; Cong, Z.; Gao, W.; Song, T.; Pan, Y.; Sun, Y.; Ji, D.; Wang, L. The Observation-based Relationships between PM2. 5 and AOD over China. J. Geophys. Res. Atmos. 2016, 121, 10701–10716. [Google Scholar] [CrossRef]
  5. Zhang, Y.; Tao, S. Global Atmospheric Emission Inventory of Polycyclic Aromatic Hydrocarbons (PAHs) for 2004. Atmos. Environ. 2009, 43, 812–819. [Google Scholar] [CrossRef]
  6. Jager, C.; Mutschke, H.; Henning, T.; Huisken, F. From PAHs to Solid Carbon. In PAHs and the Universe; EDP Sciences: Les Ulis, France, 2021; pp. 293–304. ISBN 2-7598-2482-9. [Google Scholar]
  7. Idowu, O.; Semple, K.T.; Ramadass, K.; O’Connor, W.; Hansbro, P.; Thavamani, P. Beyond the Obvious: Environmental Health Implications of Polar Polycyclic Aromatic Hydrocarbons. Environ. Int. 2019, 123, 543–557. [Google Scholar] [CrossRef]
  8. Liu, G.; Xin, J.; Wang, X.; Si, R.; Ma, Y.; Wen, T.; Zhao, L.; Zhao, D.; Wang, Y.; Gao, W. Impact of the Coal Banning Zone on Visibility in the Beijing-Tianjin-Hebei Region. Sci. Total Environ. 2019, 692, 402–410. [Google Scholar] [CrossRef]
  9. Lv, S.; Liu, X.; Li, Z.; Lu, F.; Guo, M.; Liu, M.; Wei, J.; Wu, Z.; Yu, S.; Li, S. Causal Effect of PM1 on Morbidity of Cause-Specific Respiratory Diseases Based on a Negative Control Exposure. Environ. Res. 2023, 216, 114746. [Google Scholar] [CrossRef]
  10. Si, R.; Xin, J.; Zhang, W.; Li, S.; Wen, T.; Wang, Y.; Ma, Y.; Liu, Z.; Xu, X.; Li, M. Source Apportionment and Health Risk Assessment of Trace Elements in the Heavy Industry Areas of Tangshan, China. Air Qual. Atmos. Health 2019, 12, 1303–1315. [Google Scholar] [CrossRef]
  11. Wang, S.Y.; Wang, M.Y.; Peng, H.X.; Tian, Y.H.; Guo, H.D.; Wang, J.T.; Yu, H.; Xue, E.C.; Chen, X.; Wang, X.H. Synergism of Cell Adhesion Regulatory Genes and Instant Air Pollutants on Blood Pressure Elevation. Chemosphere 2023, 312, 136992. [Google Scholar] [CrossRef]
  12. Ghosal, D.; Ghosh, S.; Dutta, T.K.; Ahn, Y. Current State of Knowledge in Microbial Degradation of Polycyclic Aromatic Hydrocarbons (PAHs): A Review. Front. Microbiol. 2016, 7, 1369. [Google Scholar] [CrossRef] [PubMed]
  13. Haritash, A.K.; Kaushik, C.P. Biodegradation Aspects of Polycyclic Aromatic Hydrocarbons (PAHs): A Review. J. Hazard. Mater. 2009, 169, 1–15. [Google Scholar] [CrossRef] [PubMed]
  14. Kim, K.-H.; Jahan, S.A.; Kabir, E.; Brown, R.J. A Review of Airborne Polycyclic Aromatic Hydrocarbons (PAHs) and Their Human Health Effects. Environ. Int. 2013, 60, 71–80. [Google Scholar] [CrossRef] [PubMed]
  15. Wilcke, W. Global Patterns of Polycyclic Aromatic Hydrocarbons (PAHs) in Soil. Geoderma 2007, 141, 157–166. [Google Scholar] [CrossRef]
  16. Wilcke, W. Synopsis Polycyclic Aromatic Hydrocarbons (PAHs) in Soil—A Review. J. Plant Nutr. Soil Sci. 2000, 163, 229–248. [Google Scholar] [CrossRef]
  17. Onifade, M.; Genc, B. A Review of Research on Spontaneous Combustion of Coal. Int. J. Min. Sci. Technol. 2020, 30, 303–311. [Google Scholar] [CrossRef]
  18. Jiang, N.; Zhang, L.P.; Meng, Y.R.; Yu, Y.; Liu, J. Analysis on Influencing Factors of Polycyclic Aromatic Hydrocarbons Formation during Coal Combustion. China Energy Environ. Prot. 2012, 12–14. [Google Scholar] [CrossRef]
  19. Li, X.D.; Qi, M.F.; You, X.F.; Yan, J.H.; Chi, Y.; Ni, M.J.; Cen, K.F. Study on the Formation of Polycyclic Aromatic Hydrocarbon (PAH) Mechanisms in Bituminous Coal Combustion Process. Proc. CSEE 2002, 22, 128–133. [Google Scholar]
  20. Wang, H.; Frenklach, M. A Detailed Kinetic Modeling Study of Aromatics Formation in Laminar Premixed Acetylene and Ethylene Flames. Combust. Flame 1997, 110, 173–221. [Google Scholar] [CrossRef]
  21. Wang, W.; Qin, Y.; Sang, S.; Jiang, B.; Guo, Y.; Zhu, Y.; Fu, X. Partitioning of Minerals and Elements during Preparation of Taixi Coal, China. Fuel 2006, 85, 57–67. [Google Scholar] [CrossRef]
  22. Wang, J.H.; Chen, B.L. Fire Zone Governance and Monitoring Method Selection and Application in Rujigou Coalmine Area. Coal Geol. China 2021, 33, 81–86. [Google Scholar]
  23. Mao, Y.B. Research on Hyperspectral Quantitative Remote Sensing Detection of the Rujigou Coal Fire Area in Ningxia. Remote Sens. Nat. Resour. 2010, 85, 69–75. [Google Scholar]
  24. Huang, D.Q.; Zhao, Y.T.; Xie, Z.Q. The Remote Sensing Survey of Coal Fire in the Rujigou Coal Mine, Ningxia. Geophys. Geochem. Explor. 2007, 31, 41–42+125–126. [Google Scholar]
  25. Rosema, A.; Guan, H.; Veld, H. Simulation of Spontaneous Combustion, to Study the Causes of Coal Fires in the Rujigou Basin. Fuel 2001, 80, 7–16. [Google Scholar] [CrossRef]
  26. Huo, H.; Jiang, X.; Song, X.; Li, Z.-L.; Ni, Z.; Gao, C. Detection of Coal Fire Dynamics and Propagation Direction from Multi-Temporal Nighttime Landsat SWIR and TIR Data: A Case Study on the Rujigou Coalfield, Northwest (NW) China. Remote Sens. 2014, 6, 1234–1259. [Google Scholar] [CrossRef]
  27. Yang, H.; Mao, Z.; Ai, N.; Wu, D. The World’s Best Taixi Coal. Northwest. Geol. 2016, 49, 98. [Google Scholar]
  28. Wang, B.; Chen, Y.; Zhou, Z. Study of soil nitrogen mineralization at different altitudes on western slopes of Helan Mountains, China. J. Desert Res. 2007, 27, 483–490. [Google Scholar]
  29. Wang, B.; Zhou, Z.; Zhang, G. Research on the relationship between phosphorus in soil and plant system at different altitudes on the western slope of Helan Mountains. J. Anhui Agric. Sci. 2009, 37, 17630–17634+17674. [Google Scholar] [CrossRef]
  30. Chen, Z.; Tian, Z.; Liu, X.; Sun, W. The Potential Risks and Exposure of Qinling Giant Pandas to Polycyclic Aromatic Hydrocarbon (PAH) Pollution. Environ. Pollut. 2022, 292, 118294. [Google Scholar] [CrossRef]
  31. Yang, B.; Liu, S.; Liu, Y.; Li, X.; Lin, X.; Liu, M.; Liu, X. PAHs Uptake and Translocation in Cinnamomum Camphora Leaves from Shanghai, China. Sci. Total Environ. 2017, 574, 358–368. [Google Scholar] [CrossRef]
  32. Menzie, C.A.; Potocki, B.B.; Santodonato, J. Exposure to Carcinogenic PAHs in the Environment. Environ. Sci. Technol. 1992, 26, 1278–1284. [Google Scholar] [CrossRef]
  33. Hu, Y.D.; Du, X.H.; Qi, F.Q.; Chen, N. Pollution characteristics, source analysis and population health risk assessment of polycyclic aromatic hydrocarbons in PM2.5 during heating and non-heating periods in an industrial area in Northwest China. Mod. Prev. Med. 2022, 49, 227–235. [Google Scholar]
  34. NHCPRC. Report on Chinese Residents’ Chronic Diseases and Nutrition; People’s Medical Publishing House: Beijing, China, 2015. [Google Scholar]
  35. Han, J.B.; Xiao, Y.N.; Liu, C.F.; Han, K. Characteristics and human health risk of polycyclic aromatic hydrocarbons components in fine particle in Baoding, Hebei. J. Saf. Environ. 2020, 20, 1459–1466. [Google Scholar]
  36. Wen, X.; Zhao, J.; Zeng, F. Distribution of Polycyclic Aromatic Hydrocarbons in Coal Gangue and Emitted Gas with Low-Temperature Spontaneous Combustion in Situ. Energy Fuels 2019, 33, 176–184. [Google Scholar] [CrossRef]
  37. Wang, H.; Cheng, C.; Chen, C. Characteristics of Polycyclic Aromatic Hydrocarbon Release during Spontaneous Combustion of Coal and Gangue in the Same Coal Seam. J. Loss Prev. Process Ind. 2018, 55, 392–399. [Google Scholar] [CrossRef]
  38. Roy, D.; Seo, Y.-C.; Sinha, S.; Bhattacharya, A.; Singh, G.; Biswas, P.K. Human Health Risk Exposure with Respect to Particulate-Bound Polycyclic Aromatic Hydrocarbons at Mine Fire-Affected Coal Mining Complex. Environ. Sci. Pollut. Res. 2019, 26, 19119–19135. [Google Scholar] [CrossRef] [PubMed]
  39. Li, D.Y.; Qi, X.B.; Wu, J.; Huang, S.F.; Wang, M.; Sha, X.Y.; Shen, C. Distribution Characteristics and Source Apportionment of Polycyclic Aromatic Hydrocarbons in Atmospheric Deposition in Areas Adjacent to a Large Petrochemical Enterprise. Environ. Sci.-Ger. 2021, 42, 106–113. [Google Scholar] [CrossRef]
  40. Khairy, M.A.; Lohmann, R. Source Apportionment and Risk Assessment of Polycyclic Aromatic Hydrocarbons in the Atmospheric Environment of Alexandria, Egypt. Chemosphere 2013, 91, 895–903. [Google Scholar] [CrossRef]
  41. Larsen, R.K.; Baker, J.E. Source Apportionment of Polycyclic Aromatic Hydrocarbons in the Urban Atmosphere:  A Comparison of Three Methods. Environ. Sci. Technol. 2003, 37, 1873–1881. [Google Scholar] [CrossRef]
  42. Harrison, R.M.; Smith, D.J.T.; Luhana, L. Source Apportionment of Atmospheric Polycyclic Aromatic Hydrocarbons Collected from an Urban Location in Birmingham, U.K. Environ. Sci. Technol. 1996, 30, 825–832. [Google Scholar] [CrossRef]
  43. Miao, R.F.; Lu, X. Pollution characteristics and source apportionment of polycyclic aromatic hydrocarbons in aerosol from north suburb of Nanjing. Meteorol. Environ. Sci. 2017, 40, 78–83. [Google Scholar] [CrossRef]
  44. Lee, J.H.; Gigliotti, C.L.; Offenberg, J.H.; Eisenreich, S.J.; Turpin, B.J. Sources of Polycyclic Aromatic Hydrocarbons to the Hudson River Airshed. Atmos. Environ. 2004, 38, 5971–5981. [Google Scholar] [CrossRef]
  45. Masclet, P.; Mouvier, G.; Nikolaou, K. Relative Decay Index and Sources of Polycyclic Aromatic Hydrocarbons. Atmos. Environ. 1967 1986, 20, 439–446. [Google Scholar] [CrossRef]
  46. Mastral, A.M.; Callén, M.; Murillo, R. Assessment of PAH Emissions as a Function of Coal Combustion Variables. Fuel 1996, 75, 1533–1536. [Google Scholar] [CrossRef]
  47. Simcik, M.F.; Eisenreich, S.J.; Lioy, P.J. Source Apportionment and Source/Sink Relationships of PAHs in the Coastal Atmosphere of Chicago and Lake Michigan. Atmos. Environ. 1999, 33, 5071–5079. [Google Scholar] [CrossRef]
  48. Zhu, L.Z.; Wang, J.; Du, Y.; Xu, Q.Q. Research on PAHs fingerprints of vehicle discharges. Environ. Sci.-Ger. 2003, 24, 26–29. [Google Scholar] [CrossRef]
  49. Chen, H.; Teng, Y.; Wang, J.; Song, L.; Zuo, R. Source Apportionment of Sediment PAHs in the Pearl River Delta Region (China) Using Nonnegative Matrix Factorization Analysis with Effective Weighted Variance Solution. Sci. Total Environ. 2013, 444, 401–408. [Google Scholar] [CrossRef]
  50. Li, A.; Jang, J.-K.; Scheff, P.A. Application of EPA CMB8.2 Model for Source Apportionment of Sediment PAHs in Lake Calumet, Chicago. Environ. Sci. Technol. 2003, 37, 2958–2965. [Google Scholar] [CrossRef]
Figure 1. Schematic diagram of 10 sampling sites around the Rujigou mining area. The orange, gray, and blue colors indicate the spontaneous combustion zone (C-zone), the non-spontaneous combustion zone (N-zone), and the living zone (L-zone), respectively. The squares represent the atmospheric passive sampling sites (1–10).
Atmosphere 14 00855 g001
Figure 2. The concentrations of polycyclic aromatic hydrocarbons in three zones. C-zone, N-zone, and L-zone stand for the spontaneous combustion zone, the non-spontaneous combustion zone, and the living zone, respectively.
Atmosphere 14 00855 g002
Figure 3. The total concentrations of polycyclic aromatic hydrocarbons in three zones. C-zone, N-zone, and L-zone stand for the spontaneous combustion zone, the non-spontaneous combustion zone, and the living zone, respectively.
Atmosphere 14 00855 g003
Figure 4. Contribution of polycyclic aromatic hydrocarbons with different ring numbers in three zones. C-zone, N-zone, and L-zone stand for the spontaneous combustion zone, the non-spontaneous combustion zone, and the living zone, respectively.
Atmosphere 14 00855 g004
Figure 5. Source results of the atmospheric polycyclic aromatic hydrocarbons obtained from the PMF in the study area.
Atmosphere 14 00855 g005
Figure 6. The polycyclic aromatic hydrocarbons sources contribution rates of atmosphere in the three different zones. C-zone, N-zone, and L-zone stand for the spontaneous combustion zone, the non-spontaneous combustion zone, and the living zone, respectively.
Atmosphere 14 00855 g006
Table 1. Descriptive statistical values for polycyclic aromatic hydrocarbons in the atmosphere for three zones (unit: ng·m−3).
C-Zone (N = 8)N-Zone (N = 1)L-Zone (N = 1)
MinMaxMeanMedianS.D. 1
Nap0.263.371.761.611.391.510.31
Acy0.060.290.200.220.090.060.22
Ace1.701.941.821.820.091.741.88
Flu0.090.600.320.230.210.330.10
Phe0.171.420.700.410.590.470.25
Ant0.091.930.980.700.790.200.45
Fluo0.071.340.480.410.430.410.07
Pyr0.091.230.320.200.380.310.09
Chry0.060.970.180.070.320.220.09
BaA0.961.111.041.040.051.121.07
BbF0.103.970.600.111.360.290.14
BkF0.063.680.530.081.270.250.10
BaP0.872.982.032.050.572.092.24
DbahA0.115.750.910.191.960.240.53
IncdP0.097.060.960.092.460.240.09
BghiP0.043.420.460.041.200.080.04
1 Standard deviation. C-zone, N-zone, and L-zone stand for the spontaneous combustion zone, the non-spontaneous combustion zone, and the living zone, respectively.
Disclaimer/Publisher’s Note: The statements, opinions and data contained in all publications are solely those of the individual author(s) and contributor(s) and not of MDPI and/or the editor(s). MDPI and/or the editor(s) disclaim responsibility for any injury to people or property resulting from any ideas, methods, instructions or products referred to in the content.

