Article

Organic Acids in Sequential Volume-Based Rainwater Samples in Shanghai: Seasonal Variations and Origins

School of Environmental Science and Engineering, Shanghai Jiao Tong University, Shanghai 200240, China
*
Authors to whom correspondence should be addressed.
Atmosphere 2022, 13(9), 1502; https://doi.org/10.3390/atmos13091502
Submission received: 7 August 2022 / Revised: 5 September 2022 / Accepted: 8 September 2022 / Published: 15 September 2022
(This article belongs to the Section Climatology)

Abstract

:
Organic acids were investigated in the rain sequence. Samples were collected in Shanghai (East China) over a one-year period using an automatic volume-based sequential rain sampler designed by ourselves. Organic acids significantly contributed (17.8 ± 10.2%) to the acidity of rainfall events in Shanghai. We observed that the concentration of each water-soluble ion in the sequential volume-based rainwater samples did not change significantly after the cumulative rainfall reached ~1.2 mm, on average. The volume-weighted mean (VWM) concentrations of formic acid, acetic acid, and oxalic acid were 13.54 μeq L−1, 8.32 μeq L−1, and 5.85 μeq L−1, respectively. Organic acids might mostly come from fine particles, which was the reason for the differences in acid concentrations in rainfall events, cloud water, and early sequences of rainfall events. The VWM concentrations of organic acids in rainfall events, cloud water, and early sequences of rainfall events were highest in spring and lowest in winter. Further analysis, including positive matrix factorization (PMF), suggested that vehicle exhaust and secondary emission sources were dominant contributors of organic acids in rainfall events (40.5%), followed by biological emission sources (37.3%), and biomass combustion sources (18.6%). The overall results not only reveal the critical role of organic acids in cloud water and rainfall events but also indicate organic acids might pose an ecological threat to the local surface ecosystem.

1. Introduction

Organic acids are ubiquitous and abundant components in precipitation [1,2,3]. Organic acids are generally characterized by high hygroscopicity and polarity, which means that organic acids in the atmosphere could serve as condensation nuclei to drive the spontaneous growth of atmospheric particles [4,5]. It was found that oxalic acid had a significant effect on aerosol-cloud nucleation activity via laboratory experiments [6]. Furthermore, organic acids were found to be an important cause of acid rain [7,8,9,10,11]. Cloud droplets can continuously absorb organic acids from aerosols and gaseous phases, and thus increase the concentration of organic acids in rainwater (regional precipitation) [12]. Since the 1990s, studies on the contributions of organic acids to rainwater acidity have been carried out [6]. For example, a previous study showed that the contributions of organic acids to the free acidity of rainwater are 25–69% in remote areas [13]. Organic acids are responsible for 44% of the free acidity in rainwater in Sao Paulo [14]. In China, organic acids have been found to contribute 18% to the free acidity in rainwater on Mount Lu [15]. The contributions of organic acids to total free acidity in rainwater are 14% in Lin’an [4]. Previous studies have suggested that formic acid, acetic acid, and oxalic acid are the most predominant organic acids in rainwater, together contributing to more than 90% of organic acids in rainwater [1,4,15]. However, a few studies have simultaneously focused on organic acids in both rainwater and cloud water. In particular, little attention has been paid to organic acids in cloud water in megacities.
Previous studies on organic acids in the atmosphere have shown that the concentrations of organic acids in and below clouds were quite different. The concentration of oxalic acid (the most abundant of dicarboxylic acids in the troposphere) in the cloud (0.11 ± 0.11 μeq m−3) was more than that below the cloud (0.08 ± 0.10 μeq m−3) [16]. Field observations on organic acids in rainwater in Mount Lu showed that the VWM concentration of organic acids in rainwater (33.39 μeq L−1) was less than that in cloud water (38.42 μeq L−1) [15]. Because the height of rainfall cloud is usually more than 1 km, it is challenging to collect cloud water on flat ground. Therefore, most cloud water sampling points were situated in mountainous areas. As a result, previous studies on the differences between organic acids in rainwater and cloud water were limited to mountainous areas [15]. However, recent research has shown that cloud water and rainwater could be distinguished by analyzing the data obtained from sequential rain samples [17]. Accordingly, this provides us with the possibility to explore the organic acids of cloud water in urban areas.
It has previously been documented that the sources of organic acids in rainwater include primary and secondary sources. The former contains direct emissions from vehicle emissions, biomass combustion, fossil fuel combustion, and biological emissions [18,19,20,21,22]. The latter consists of the photochemistry reactions of precursors from artificial and natural sources [23,24,25,26]. Previous studies showed that biological emissions accounted for 73.0% of formic acid, 65.3% of acetic acid, and 52.8% of oxalic acid in cloud water in Mount Lu (Central China) [15]. Moreover, researchers have found that primary emissions were the dominant sources of organic acids in rainwater in Anshun (Southwest China) [27]. Indeed, due to the limited investigations on the organic acids in the sequential volume-based rainwater samples, large uncertainties exist in the relative impacts of primary and secondary production processes on organic acid abundances in cloud water and rainwater in urban areas.
Shanghai is situated in the middle part of the east coast of China, with an average elevation of 4 m. It is the center of economy, science and technology, industry, finance, and trade in China. However, with the city’s rapid development, the population and the number of cars are increasing rapidly, and the atmosphere in Shanghai is threatened by high anthropogenic pollutant inputs. Therefore, Shanghai is an ideal region to study the effects of organic acids in rainwater on the atmosphere and surface ecosystems. In this study, in-cloud water (rain in the later stage of a precipitation event (cloud water); at this stage, the rainout effect largely controls the chemical compositions in rainwater) will be distinguished from rainfall events via a homemade automatic sequential rainfall event sampler. Subsequently, the concentration levels and seasonal variations of organic acids in cloud water and rainfall events were discussed. Furthermore, the formic acid to acetic acid (F/A) ratio and the PMF analysis was carried out to identify the potential sources of organic acids in cloud water and rainfall events in Shanghai.

2. Materials and Methods

2.1. Sampling Location

The sampling site is located on the roof of the College of Agriculture and Biology, Shanghai Jiao Tong University, Shanghai (31.03° N, 121.45° E) (Figure S1). There are no high-rise buildings near this sampling point. Typical pollution sources, such as factories, and waste incineration plants, are not found within 20 km of the sampling site. The nearest coastline is 26 km away. The average temperature from June to August in Shanghai is about 28 °C, and the rainfall is 931 mm. From September to November, the average temperature is about 20 °C, and the rainfall is about 314 mm. The average temperature is about 8 °C from December to February, and the rainfall is about 202 mm. The average temperature is about 17 °C, and the rainfall is about 277 mm from March to May. Meteorological data were obtained from the National Meteorological Science Data Center (http://data.cma.cn/) (accessed on 30 August 2021).

2.2. Sampling Equipment and Sampling Method

A homemade automatic sequential rainfall event sampler is shown in Figure S2. The liquid level sensor controls the amount of rainwater collected by each bottle. The point sensors ensure that each water outlet for each horizontal duct is aligned with the bottle mouth. Sample leakage will not occur during sample collection. Rainwater is first collected into the funnel through the canopy and then flows into the bottle through the horizontal conduit. The liquid level sensor gives a signal to the point level sensor when rainwater collection reaches a certain height (Figure 1). The horizontal conduit port goes to the next bottle port via an electric motor and cycles back and forth. The canopy of the experimental device is made up of two stainless steel plates (1.3 m × 0.8 m), both of which are inclined at an angle of 30° with the horizontal plane. The outer rim of this sampler was wrapped with transparent waterproof cloth and covered with an acrylic plate. A fixed collection volume of 350 mL was set for each bottle, which corresponds to a cumulative rainfall of ~0.2 mm.
The customized bottles used in this study were washed and dried prior to sample collection. The sampling period for this study was from August 2020 to May 2021. A total of 61 rain events were investigated. The total number of samples was 616. The pH and electrical conductivity (EC) values of rainwater samples were measured on-site. Then, the rainwater samples were filtered with 0.45 μm microporous filter (polyether sulfone) immediately. All rainwater samples were stored in the refrigerator (–40 °C).
Figure 1. Conceptual diagram showing an automatic volume-based sequential rain sampler. When the blue liquid level reaches the sensing line (corresponding to the purple liquid height), the horizontal conduit goes to the next point.
Atmosphere 13 01502 g001

2.3. Analysis of Chemical Components in Rainwater

Inorganic ions (Na+, NH4+, K+, Mg2+, Ca2+, F, Cl, NO2, Br, NO3 and SO42−) and organic acids (formic acid, acetic acid, Methane Sulfonic Acid (MSA), succinixc acid, glutaric acid, oxalic acid) were measured by Thermo Fisher Dionex Aquion Ion Chromatography [28,29]. EC and pH were analyzed by a DZS-706A Multiparameter Analyzer.

2.4. The Data Analysis

2.4.1. Ionic Balance Analysis

Ion balance can be used to detect the data quality of rainwater samples. For rainwater samples with total ion concentrations greater than 100 μeq L−1, a difference in concentrations between total cations and total anions of 15–30% is acceptable, while 30–60% of the concentrations difference between the total cations and total anions is acceptable for rainwater samples with total ion concentrations in the range 50–100 μeq L−1 [30]. The difference in concentrations of all rainwater samples in this study was within the error range. There was a great correlation (R2 = 0.87) between total anions and total cations (Figure S3). These results showed that our experimental data were reliable.

2.4.2. The Contribution of Organic Acids to Total Free Acidity

The calculation method proposed by (Keene et al., 1983) [13] was used to evaluate the contributions of organic acids to total free acidity (TFA) in rainfall events, shown below.
η   ( % ) =   [ A ] [ H + ]
[ A ] = K a [ M ] K a + [ H + ]
where [H+] represents the concentration of hydrogen ion (μmol L−1). K a is the ionization constant of mono-carboxylic acid. The ionization constant of formic acid and acetic acid is 1.78 × 10⁻⁴ and 1.77 × 10⁻⁵ (T = 298.15 K), respectively. [ M ] is the concentration of formic or acetic acid (μmol L−1). The free acidity [A] of formic acid and acetic acid was calculated by Equation (2).
The free acidity [A] of oxalic acid was calculated by the following equations (Sakugawa et al., 1993) [31].
[A] = [HC2O4] + [C2O4]
[ HC 2 O 4 ] = [ M ] 1 + [ H + ] K 1 + K 2 [ H + ]
[ C 2 O 4 ] = [ M ] 1 + [ H + ] 2 K 1 K 2 + [ H + ] K 2 [ H + ]
TFA = 2 × [SO42−] + [NO3] + [Cl] +T[A]
where the first order ionization constant K 1   of oxalic acid is 5.9 × 10⁻² (T = 298.15 K), and the second order ionization constant K 2 of oxalic acid is 6.4 × 10⁻⁵ (T = 298.15 K). T[A] represents the sum of [A] of formic acid, acetic acid, and oxalic acid.
The following equation was used to calculate the contributions of organic acids (OA) to free acidity (COA) in rainfall events [13]:
COA = OA / TFA   = T [ A ] TFA     ×   100 %

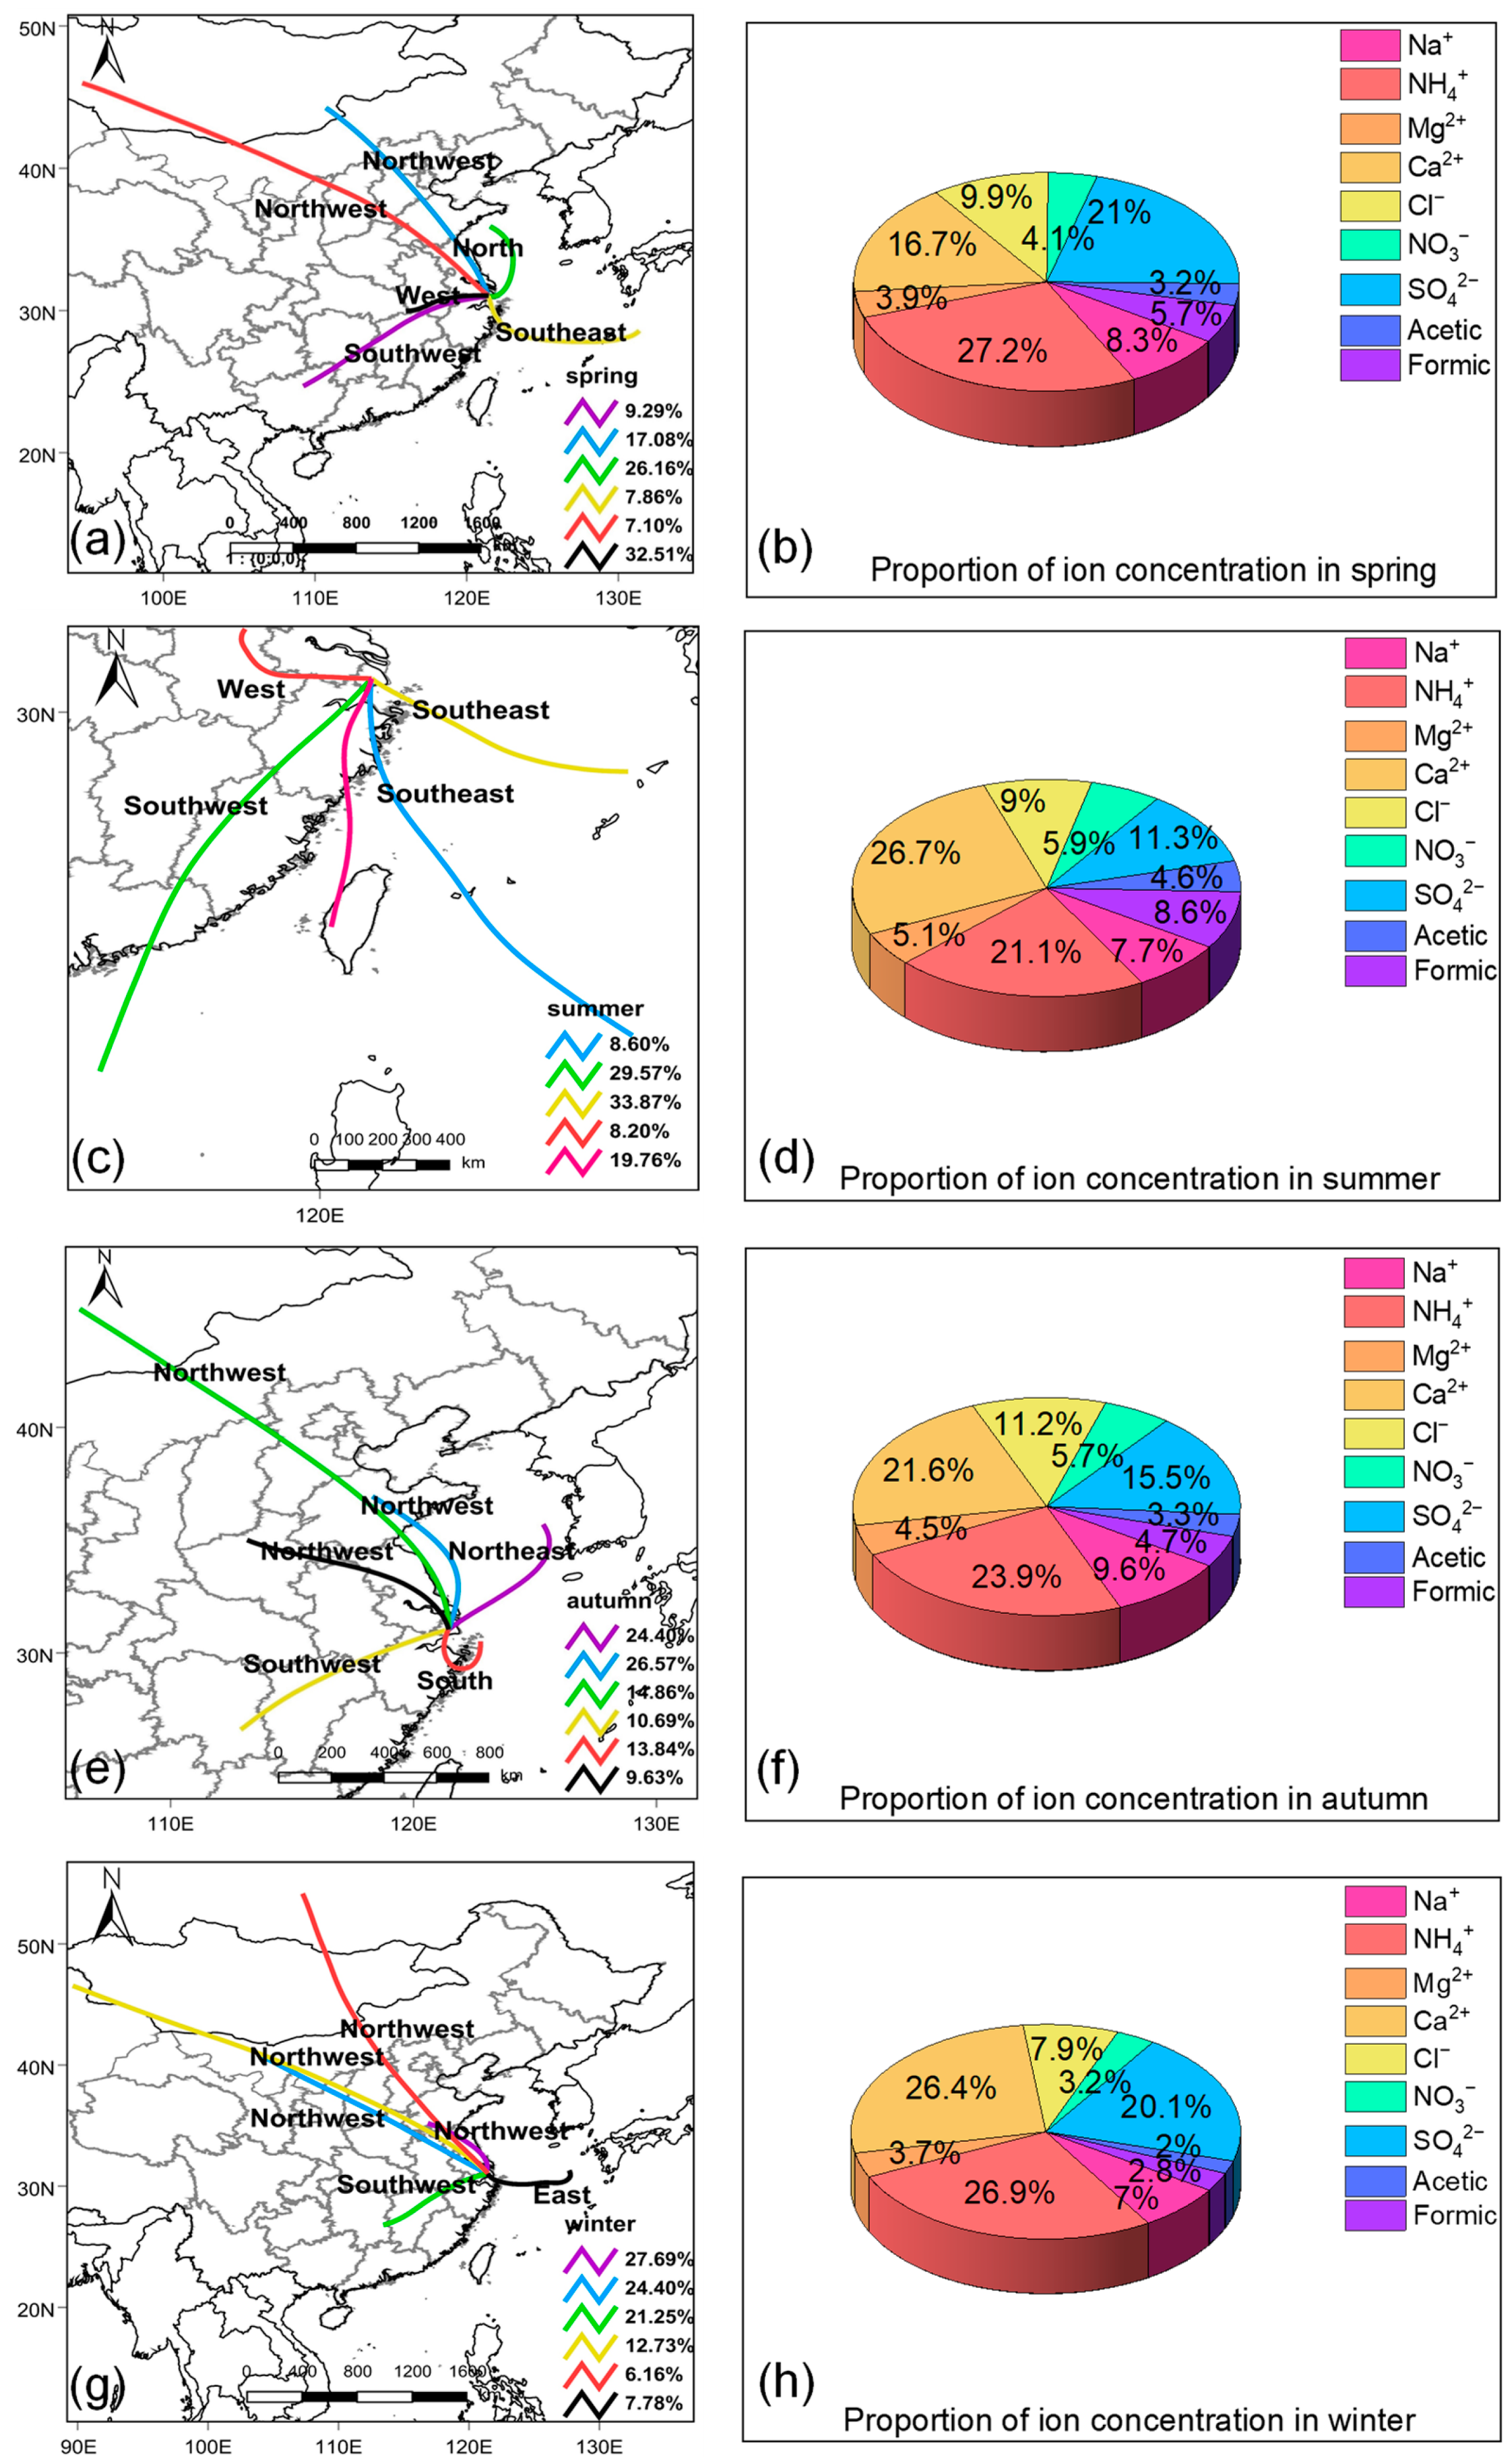
2.4.3. Backward Trajectory Analysis

In this study, Meteoinfo software (http://www.meteothink.org/) (accessed on 10 June 2021) were used to analyze the backward trajectories of the air masses arriving at the sampling site in every investigated precipitation event [32]. The Global Data Assimilation System (GDAS) provided by Air Resources Laboratory (NOAA ARL) (http://ready.arl.noaa.gov/HYSPLIT.php) (accessed on 10 June 2021) was used to calculate 2-day (48 h) back trajectories of air masses starting at 1500 m above sea level.

2.4.4. The Formic to Acetic Acid (F/A) Ratio

The F/A ratio can be utilized to identify the relative importance of the contribution of primary and secondary sources to organic acids in rainwater. If F/A > 1, it indicates that the organic acids in rainwater mainly come from secondary sources. If F/A < 1, it indicates that the organic acids in rainwater mainly come from primary source [33,34]. The F/A ratio in the liquid phase is related to the Henry coefficient, dissociation coefficient, and pH value [35]. The [F/A]M value can be calculated according to the following equation.
[F/A] = [F]/[A]
[ F / A ] M = Measured   [ F ] / Measured   [ A ] =   K H 1 ( [ H + ] + K a ) K H 2 ( [ H + ] + K b )     [ F / A ]
where KH1 = 5.6 × 10³ mol L−1 atm−1, KH2 = 8.8 × 10³ mol L−1 atm−1, Ka = 1.77 × 10⁻⁴ mol L−1, and Kb = 1.76 × 10⁻⁵ mol L −1 (T = 298.15 K). [F] represents the concentration of formic acid (μmol L−1), [A] represents the concentration of acetic acid (μmol L−1) [31].
In addition, a positive matrix factorization (PMF) model (version 5.0) (Environmental Protection Agency, EPA, New York City, NY, USA) was applied to identify the potential sources of organic acids in rainwater (Text S1) [36,37,38]. Correlation analysis was conducted via SPSS 20.0 (International Business Machines Corporation, IBM, New York City, NY, USA) to explore potential relationships in the response and explanatory variables.

3. Results and Discussion

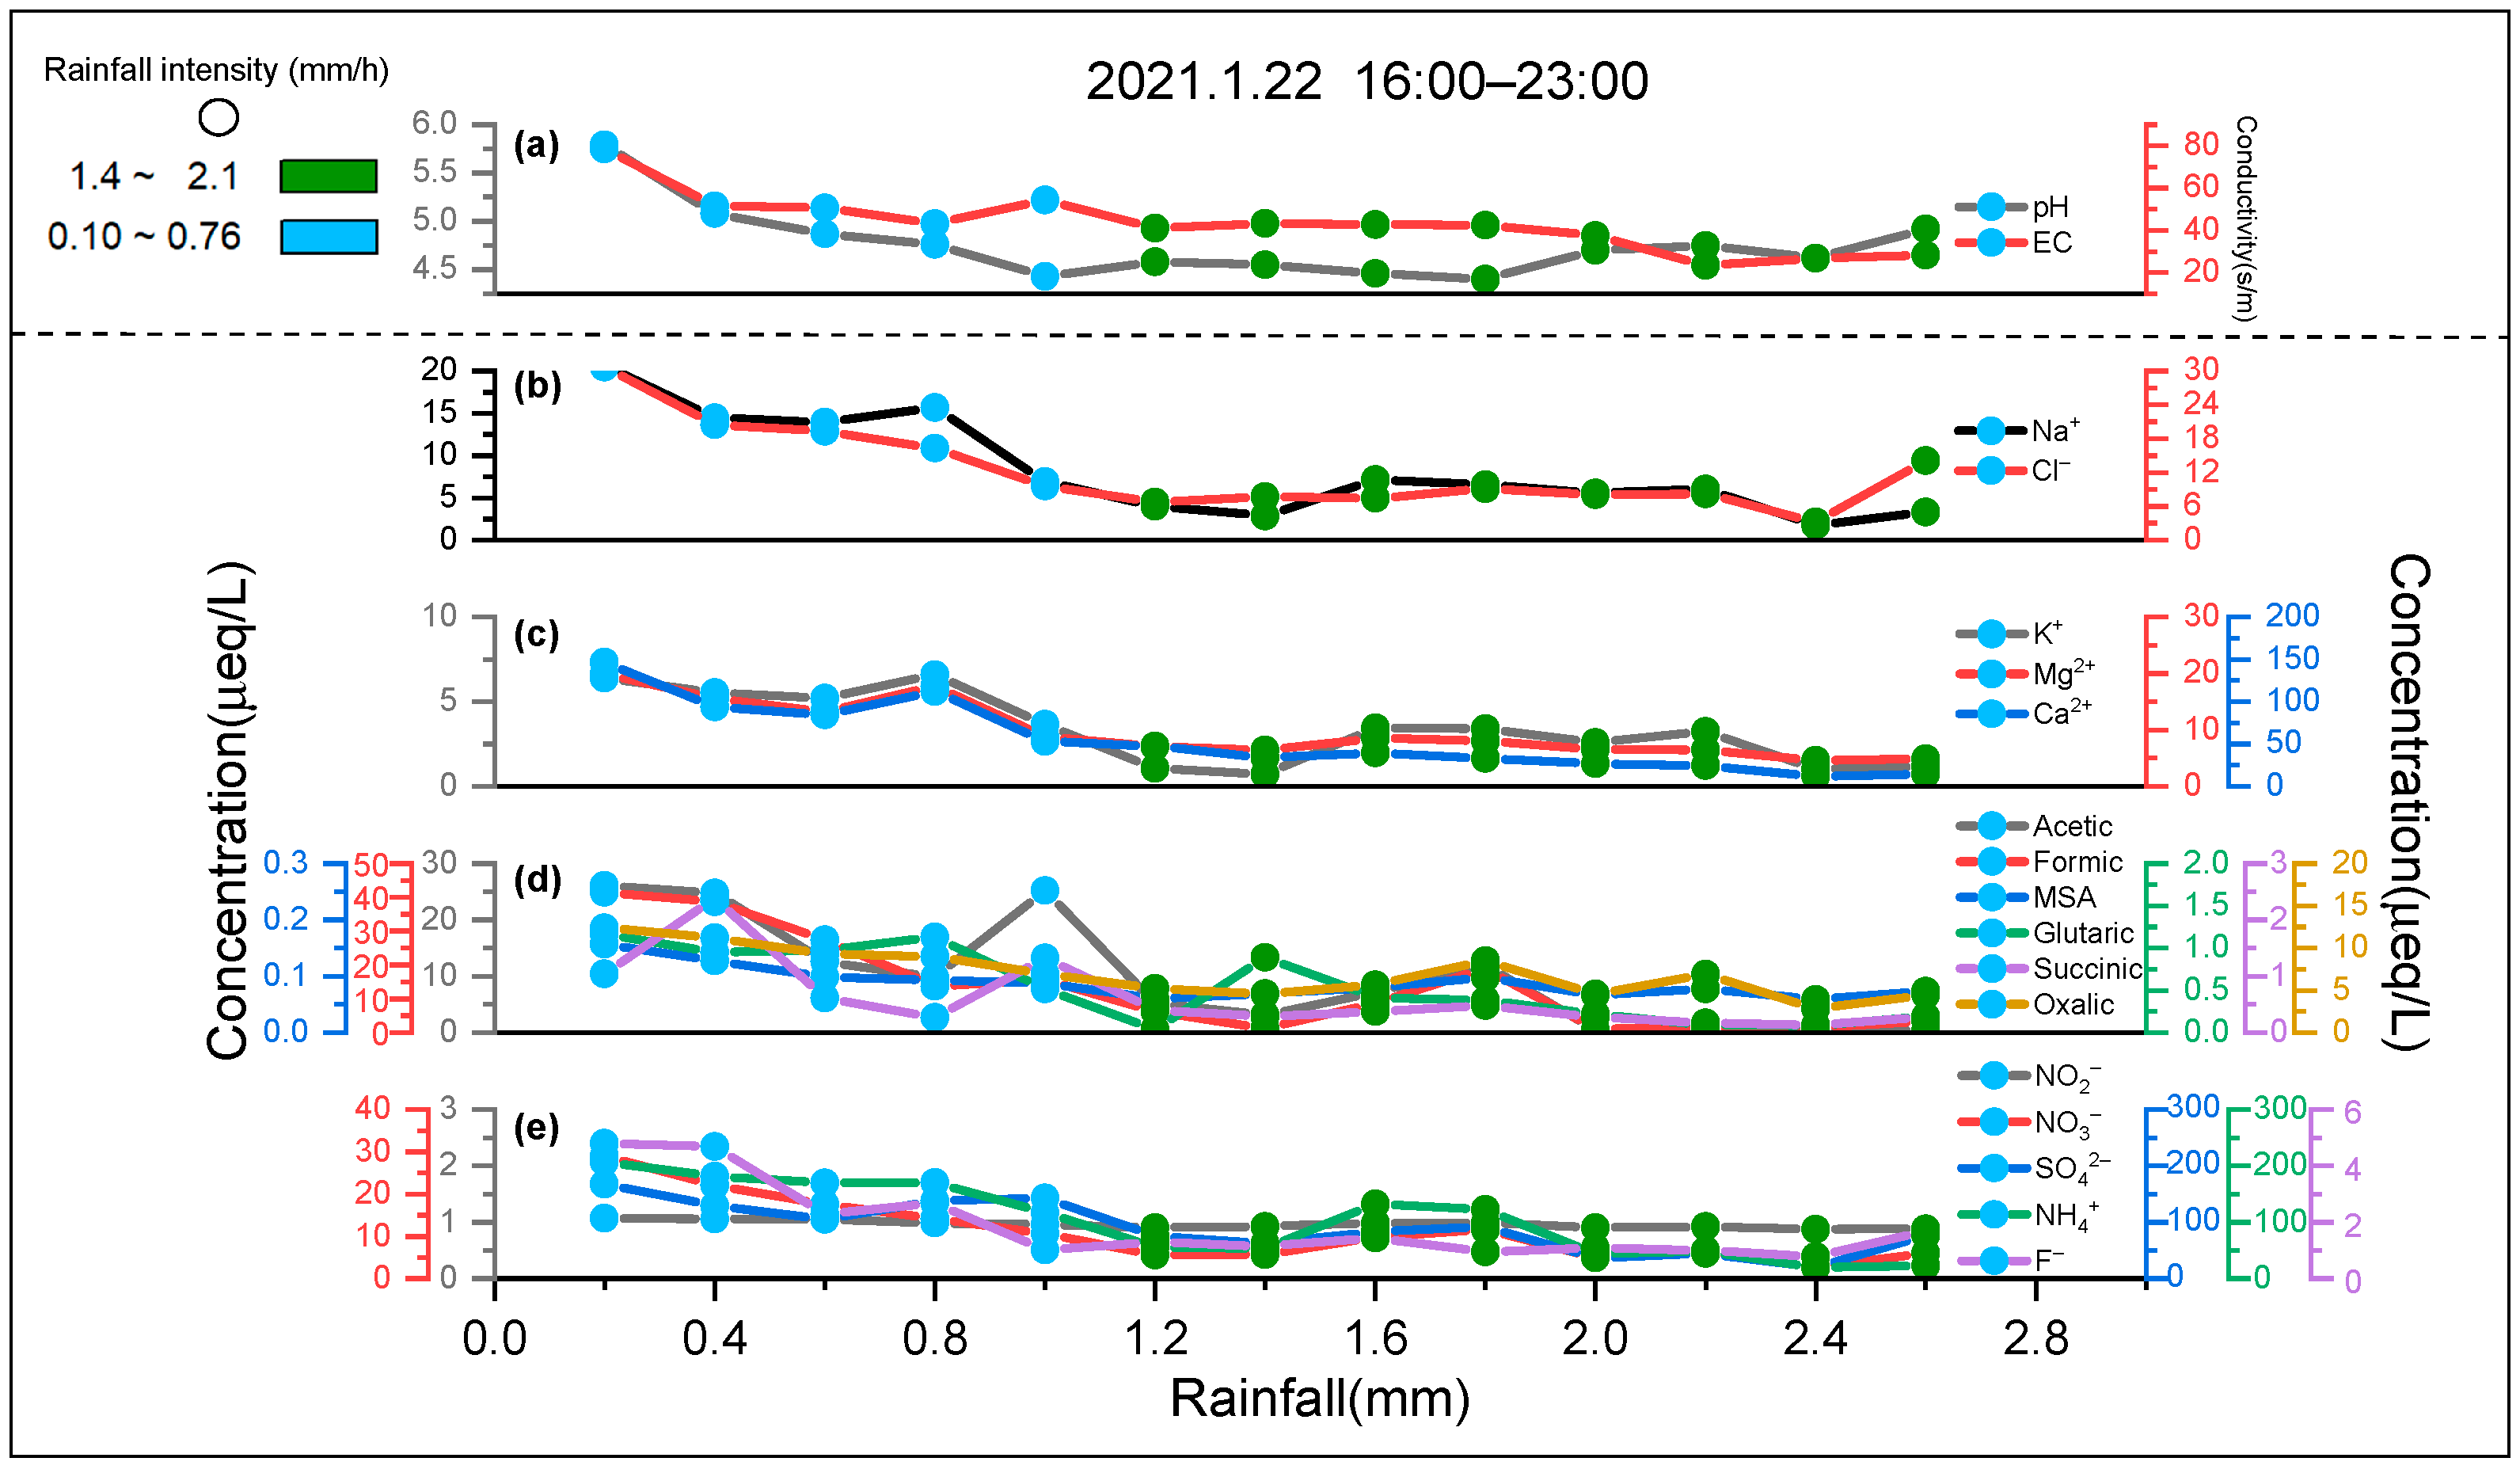
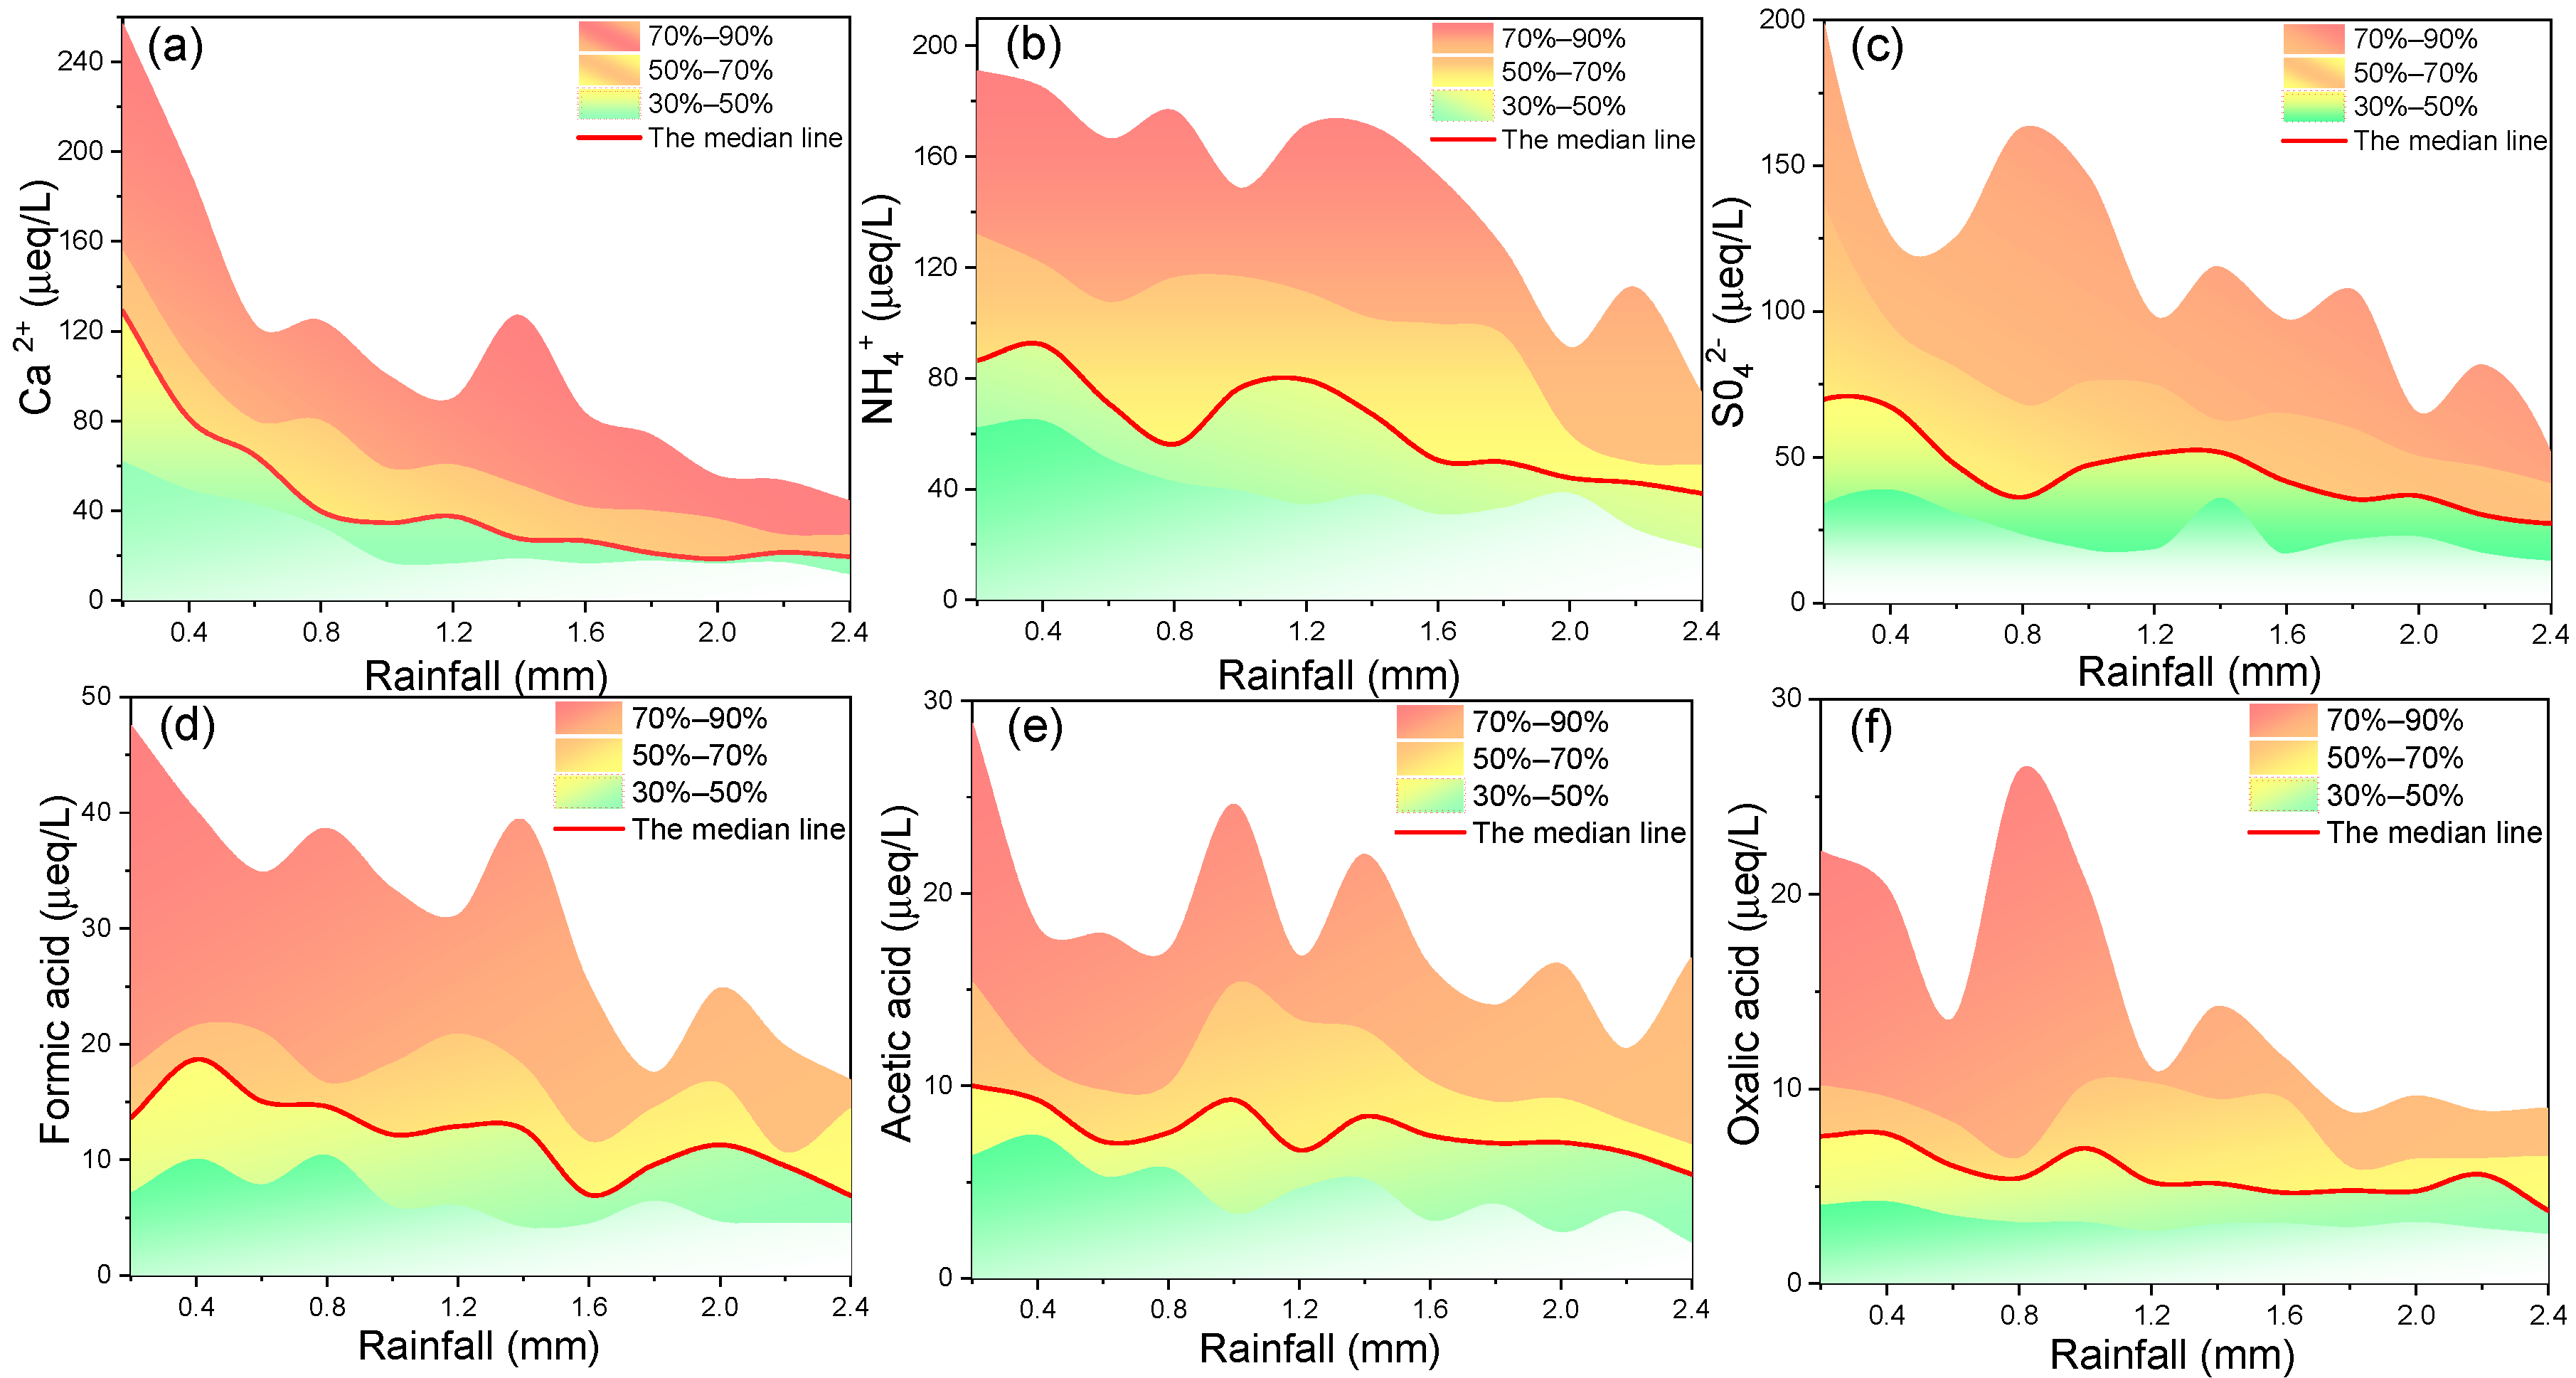
3.1. General Variation Patterns of Chemical Compositions in the Sequential Rainwater Samples

A representative rainfall was chosen from all rainfall events to show the general variation patterns of the chemical compositions in the sequential volume-based rainwater samples in Shanghai (Figure 2). The removal efficiency of quantified chemical compositions of the first sample (cumulative rainfall is 0.2 mm) (22.9 ± 10.1%) was highest (Figure 2). Precipitation is an effective pathway to remove particulate matter (PM) in the atmosphere, which is usually divided into two parts: in-cloud (rainout) and below-cloud (washout) scavenging processes [17,39,40,41]. Previous studies have shown that most ions and major elements would be washed away in the first few mm of precipitation. Data from several studies suggest that the process of washout contributes 50 to 80% to ions concentrations in rainfall events [41,42]. In the later rainfall process, the ion concentrations in the sequential volume-based rainwater samples changed slowly and gradually approached a constant value. The rainfall process was gradually transferred from the process of washout to the process of rainout [43]. We observed that the concentration of each water-soluble ion in the sequential volume-based rainwater samples changed insignificantly after the cumulative rainfall reached 1.0~1.6 mm (1.2 mm, on average) (Figure 2). It could be inferred that the component of rainfall events might be dominated by the process of washout before ~1.2 mm of accumulated rainfall; the rainfall events in this stage were called the early sequences of rainfall events. After ~1.2 mm of accumulated rainfall, the process of rainout might dominate the component of rainfall events. The rainfall events in this stage were called cloud water [17,42].
The variations in concentrations of all detected inorganic ions and organic acids in the sequential volume-based rainwater samples were further studied (Figure S4). Before the accumulated rainfall of 1.2 mm, the concentration proportion of Ca2+ showed a decline, while the concentration proportion of NH4+ demonstrated an increase. After accumulated rainfall of 1.2 mm, the concentrations of all ions in the sequential volume-based rainwater samples tended to balance, further supporting that it is reasonable to divide cloud water by judging general variation patterns of chemical compositions in the sequential rainwater samples. The concentration proportion changes in formic acid, acetic acid, and oxalic acid did not change significantly from the beginning to the end of rainfall, which was similar to that of SO42− and NO3. The reason might be that with the increase in rainfall, the process of washout contributed less and less to the composition of rainfall events [44]. It has been proved by relevant research that ions such as SO42−, NO3, and NH4+ mainly exist in fine particles, while ions including Ca2+ primarily exist in coarse particles [16,45]. The removal way of coarse particles was mainly through the process of washout, and the removal way of fine particles was mainly through the process of rainout [46]. It can be concluded that organic acids in rainfall events might mostly come from fine particles, and organic acids in cloud water might contribute significantly to the concentrations of organic acids in rainfall events in Shanghai [17,47,48,49,50].
Several major organic acids (formic acid, acetic acid, and oxalic acid) and inorganic ions (Ca2+, NH4+, and SO42−) were chosen to analyze the variation differences in the concentrations of inorganic ions and organic acids in the sequential volume-based rainwater samples in Shanghai (Figure 3). From top to bottom, the concentration range includes four concentration percentile intervals (70–90%, 50–70%, 30–50% and 0–30%). On the one hand, because extreme values usually occur in the concentration range of 70–90% and 0–30%, we focus on the changes in the concentration ranges of 30–50% and 50–70%. We selected the cumulative rainfall of 0.2 mm, 1.2 mm, and 2.4 mm as three comparison nodes. The concentration differences in the range 50–70% of Ca2+, NH4+, and SO42− decreased with the increase in accumulated rainfall, especially Ca2+. A similar situation was also found in the range of 30–50% (Ca2+ and SO42−). However, insignificant changes were found in the concentration ranges 30–50% and 50–70% of formic acid, acetic acid, and oxalic acid. It could be clearly found that the concentration ranges of inorganic ions change more than that of organic acids with rainfall. On the other hand, the slopes of the median line of Ca2+, SO42−, and NH4+ were −6.26, −5.12, and −5.08, respectively. Additionally, the slopes of the median line of formic acid, acetic acid, and oxalic acid were −1.02, −0.71, and −0.22, respectively. If the absolute value of the change slope of ion concentration was smaller, the difference of which between the early and late stages of rainfall was smaller. From the comparisons of concentration ranges and slopes, the influence of cumulative rainfall on the concentrations of organic acids in Shanghai rainfall events was less than that on inorganic ions. It was known that the scouring process of atmospheric compounds was dependent not only on rain intensity and cumulative rainfall, but also on their size distributions and aerosol sources [51]. Therefore, the slight variations in the concentrations of organic acids in the sequential volume-based rainwater samples might relate to the small difference in the concentrations of organic acids between cloud water and rainfall events in Shanghai [12,52,53].

3.2. Concentrations and Seasonal Changes of Organic Acids in Rainfall Events, Early Sequences of Rainfall Events and Cloud Water

3.2.1. Chemical Characteristics of Organic Acids in Rainfall Events, Early Sequences of Rainfall Events and Cloud Water

Six organic acids (formic acid, acetic acid, MSA, glutaric acid, succinic acid, and oxalic acid) in rainfall events were detected in this study. The concentration of formic acid ranged from 0.77 to 126.29 μeq L−1, the concentration of acetic acid was from 0.11 to 63.4 μeq L−1, and the concentration of oxalic acid varied between 0 μeq L−1 (below determination limit) and 40.21 μeq L−1. The highest VWM concentration of organic acids in rainfall events was formic acid (13.54 μeq L−1), followed by acetic acid (8.32 μeq L−1), oxalic acid (5.85 μeq L−1), succinic acid (1.18 μeq L−1), glutaric acid (0.54 μeq L−1), and MSA (0.1 μeq L−1). The highest VWM concentration of inorganic ions in rainfall events was NH4+ (73.35 μeq L−1), followed by Ca2+ (59.72 μeq L−1), SO42− (52.12 μeq L−1), Cl (27.79 μeq L−1), Na+ (23.87μeq L−1), NO3 (12.59 μeq L−1), and Mg2+ (11.64 μeq L−1). Formic acid, acetic acid, and oxalic acid were the main organic acids in rainfall events in Shanghai, together accounting for 95% of organic acids. SO42− and NO3 were the main inorganic acid components in acid rain, accounting for more than 90% [54]. It has been observed that the concentration of oxalic acid was generally highest among PM [55]. The reason might be that the water solubility of oxalic acid was lower than that of formic acid and acetic acid [50,56,57]. The regional comparisons of the VWM concentrations of organic acids in rainfall events are shown in Table 1. Studies about organic acids in rainfall events have been carried out extensively in mountainous areas, such as Mount Lu, Mount Heng, Mount Mangdang, and Anshun area with high fractional vegetation [15,27,58], the authors suggested the VWM concentration of acetic acid was greater than that of formic acid in rainfall events. However, the VWM concentration of organic acids in urban areas showed an opposite pattern, such as Shanghai, Xiamen, Beijing, and Shenzhen areas [59,60,61]. It was well established from various studies that formic acid in the atmosphere mainly comes from the photochemical formation of natural hydrocarbons (terpene and isoprene) emitted by plants [14,18,62,63]. Therefore, the high formic acid concentration in urban rainfall events could be attributed to the secondary production processes [64]. Moreover, the concentration of acetic acid in rainfall events in mountainous areas was found to be relatively higher. A plausible reason is that organic acids in rainfall events were greatly affected by biological emission sources in the suburban areas where the plants were very luxuriant [4,14].
The concentrations of inorganic ions and organic acids in early sequences of rainfall events and cloud water were also compared systematically, as shown in Figure S5. In cloud water, formic acid (VWM = 11.38 μeq L−1) was the predominant organic acid species, followed by acetic acid (VWM = 6.83 μeq L−1), and oxalic acid (VWM = 5.13 μeq L−1). The VWM concentration of NH4+ (62.46 μeq L−1) was much higher than that of SO42− (40.96 μeq L−1), Ca2+ (37.60 μeq L−1), and NO3 (9.80 μeq L−1). In early sequences of rainfall events, the VWM concentration of formic acid (16.79 μeq L−1) was more than that of acetic acid (9.87 μeq L−1) and oxalic acid (6.53 μeq L−1). The largest VWM concentration of water-soluble ions was Ca2+ (82.93 μeq L−1), and second NH4+ (82.85 μeq L−1), SO42− (61.53 μeq L−1), and NO3 (16.18 μeq L−1). The VWM concentrations of Ca2+, NH4+, SO42−, NO3, formic acid, acetic acid, and oxalic acid in early sequences of rainfall events were 2.2, 1.3, 1.5, 1.65, 1.48, 1.45, and 1.27 times than that in cloud water, respectively. If the ratio was smaller, the difference between the concentration of the corresponding ion in cloud water and early sequences of rainfall events was smaller. We previously suggested that ions, such as SO42−, NO3, and NH4+ mainly exist in fine particles, while Ca2+ primarily exists in coarse particles [16,45]. Thus, the ratios of NH4+, SO42−, NO3, formic acid, acetic acid, and oxalic acid showed insignificant differences. This could be further supported by the fact that cloud water might be the primary contributor to organic acids in rainfall events [52,53]. The concentrations of organic acids in this study were comparable to those studied in cloud water in other regions. Higher concentrations of organic acids in cloud water were found in most mountain sites and tropical ecosystems, such as Mount Lu, Mount Heng, and the forest ecosystems of Taiwan [15,61,69]. The concentrations of organic acids in cloud water in the marine environment were lower than in most other areas [6]. The concentrations of acetic acid and oxalic acid in cloud water in Shanghai were lower than that in Mount Lu and Taiwan, while the concentration of formic acid in cloud water was higher than that in Mount Lu and Taiwan [15,69].

3.2.2. Seasonal Changes of Organic Acids in Rainfall Events, Early Sequences of Rainfall Events and Cloud Water

The seasonal changes in organic acids and inorganic ions in rainfall events in Shanghai were investigated (Figure 4). The concentrations of formic acid and acetic acid in rainfall events peaked in spring and reached the minimum in winter. Formic acid showed a similar temporal trend to acetic acid, glutaric acid, and succinic acid. Although the concentration of oxalic acid in rainfall events was also highest in spring, it was lowest in summer. Photooxidation of aliphatic diolefins and cycloolefins emitted by vehicle exhaust was observed to be an important source of oxalic acid [70]. The lower concentration of oxalic acid in summer might be the reason for lower vehicle exhaust emission strength and greater rainfall in summer. The reaction between oxalic acid and calcium carbonate can lead to the production of water-insoluble calcium oxalate, which also partly explained the relatively low concentration of oxalic acid in summer [71,72]. However, the seasonal variations in inorganic ions in rainfall events differed from that of organic acids. The concentrations of inorganic ions in rainfall events reached maximum in winter, while that of organic acids in rainfall events reached maximum in spring. NH4+ showed similar seasonal variation with Ca2+, Na+, Cl, and SO42−, with the highest concentrations in winter, followed by spring, autumn, and summer. Low rainfall frequency and intensity were likely responsible for the high concentration of inorganic ions in rainfall events in winter [4]. Previous research has indicated that biological emissions are important sources of organic acids in rainfall events [73,74,75]. Plant growth mainly occurs in spring, when emissions of biogenic volatile organic compounds and primary biological aerosol particles are expected to be large. In particular, the yellow pollen grains can be directly observed in the rainwater in spring [76,77]. Therefore, these considerations might explain the high concentrations of organic acids in rainfall events in spring.
The seasonal variations of organic acids and inorganic ions in cloud water and early sequences of rainfall events are shown in Figure S6. We found that the temporal trends of organic acids in cloud water and early sequences of rainfall events were similar to that of the rainfall events mentioned above. However, the concentrations of organic acids in cloud water were the lowest in summer. Great rainfall might increase the scouring efficiency of atmospheric organic acids in summer [65,78]. The study conducted on Mount Lu showed that the concentrations of organic acids in rainwater and cloud water were similar in spring and summer. Moreover, acetic acid was the most abundant species in Mount Lu cloud water [15]. However, formic acid was found to be predominant in Shanghai cloud water. Because Mount Lu is lush with trees, the concentrations of organic acids in summer rainwater were high in Mount Lu [4,79]. In addition, we found that the ratios of the concentrations of organic acids in cloud water to that in early sequences of rainfall events were lowest in spring (formic acid: 1.35; acetic acid: 1.1; oxalic acid: 1.65). It was further confirmed that organic acids in rainwater mainly came from cloud water [18,61,80,81].

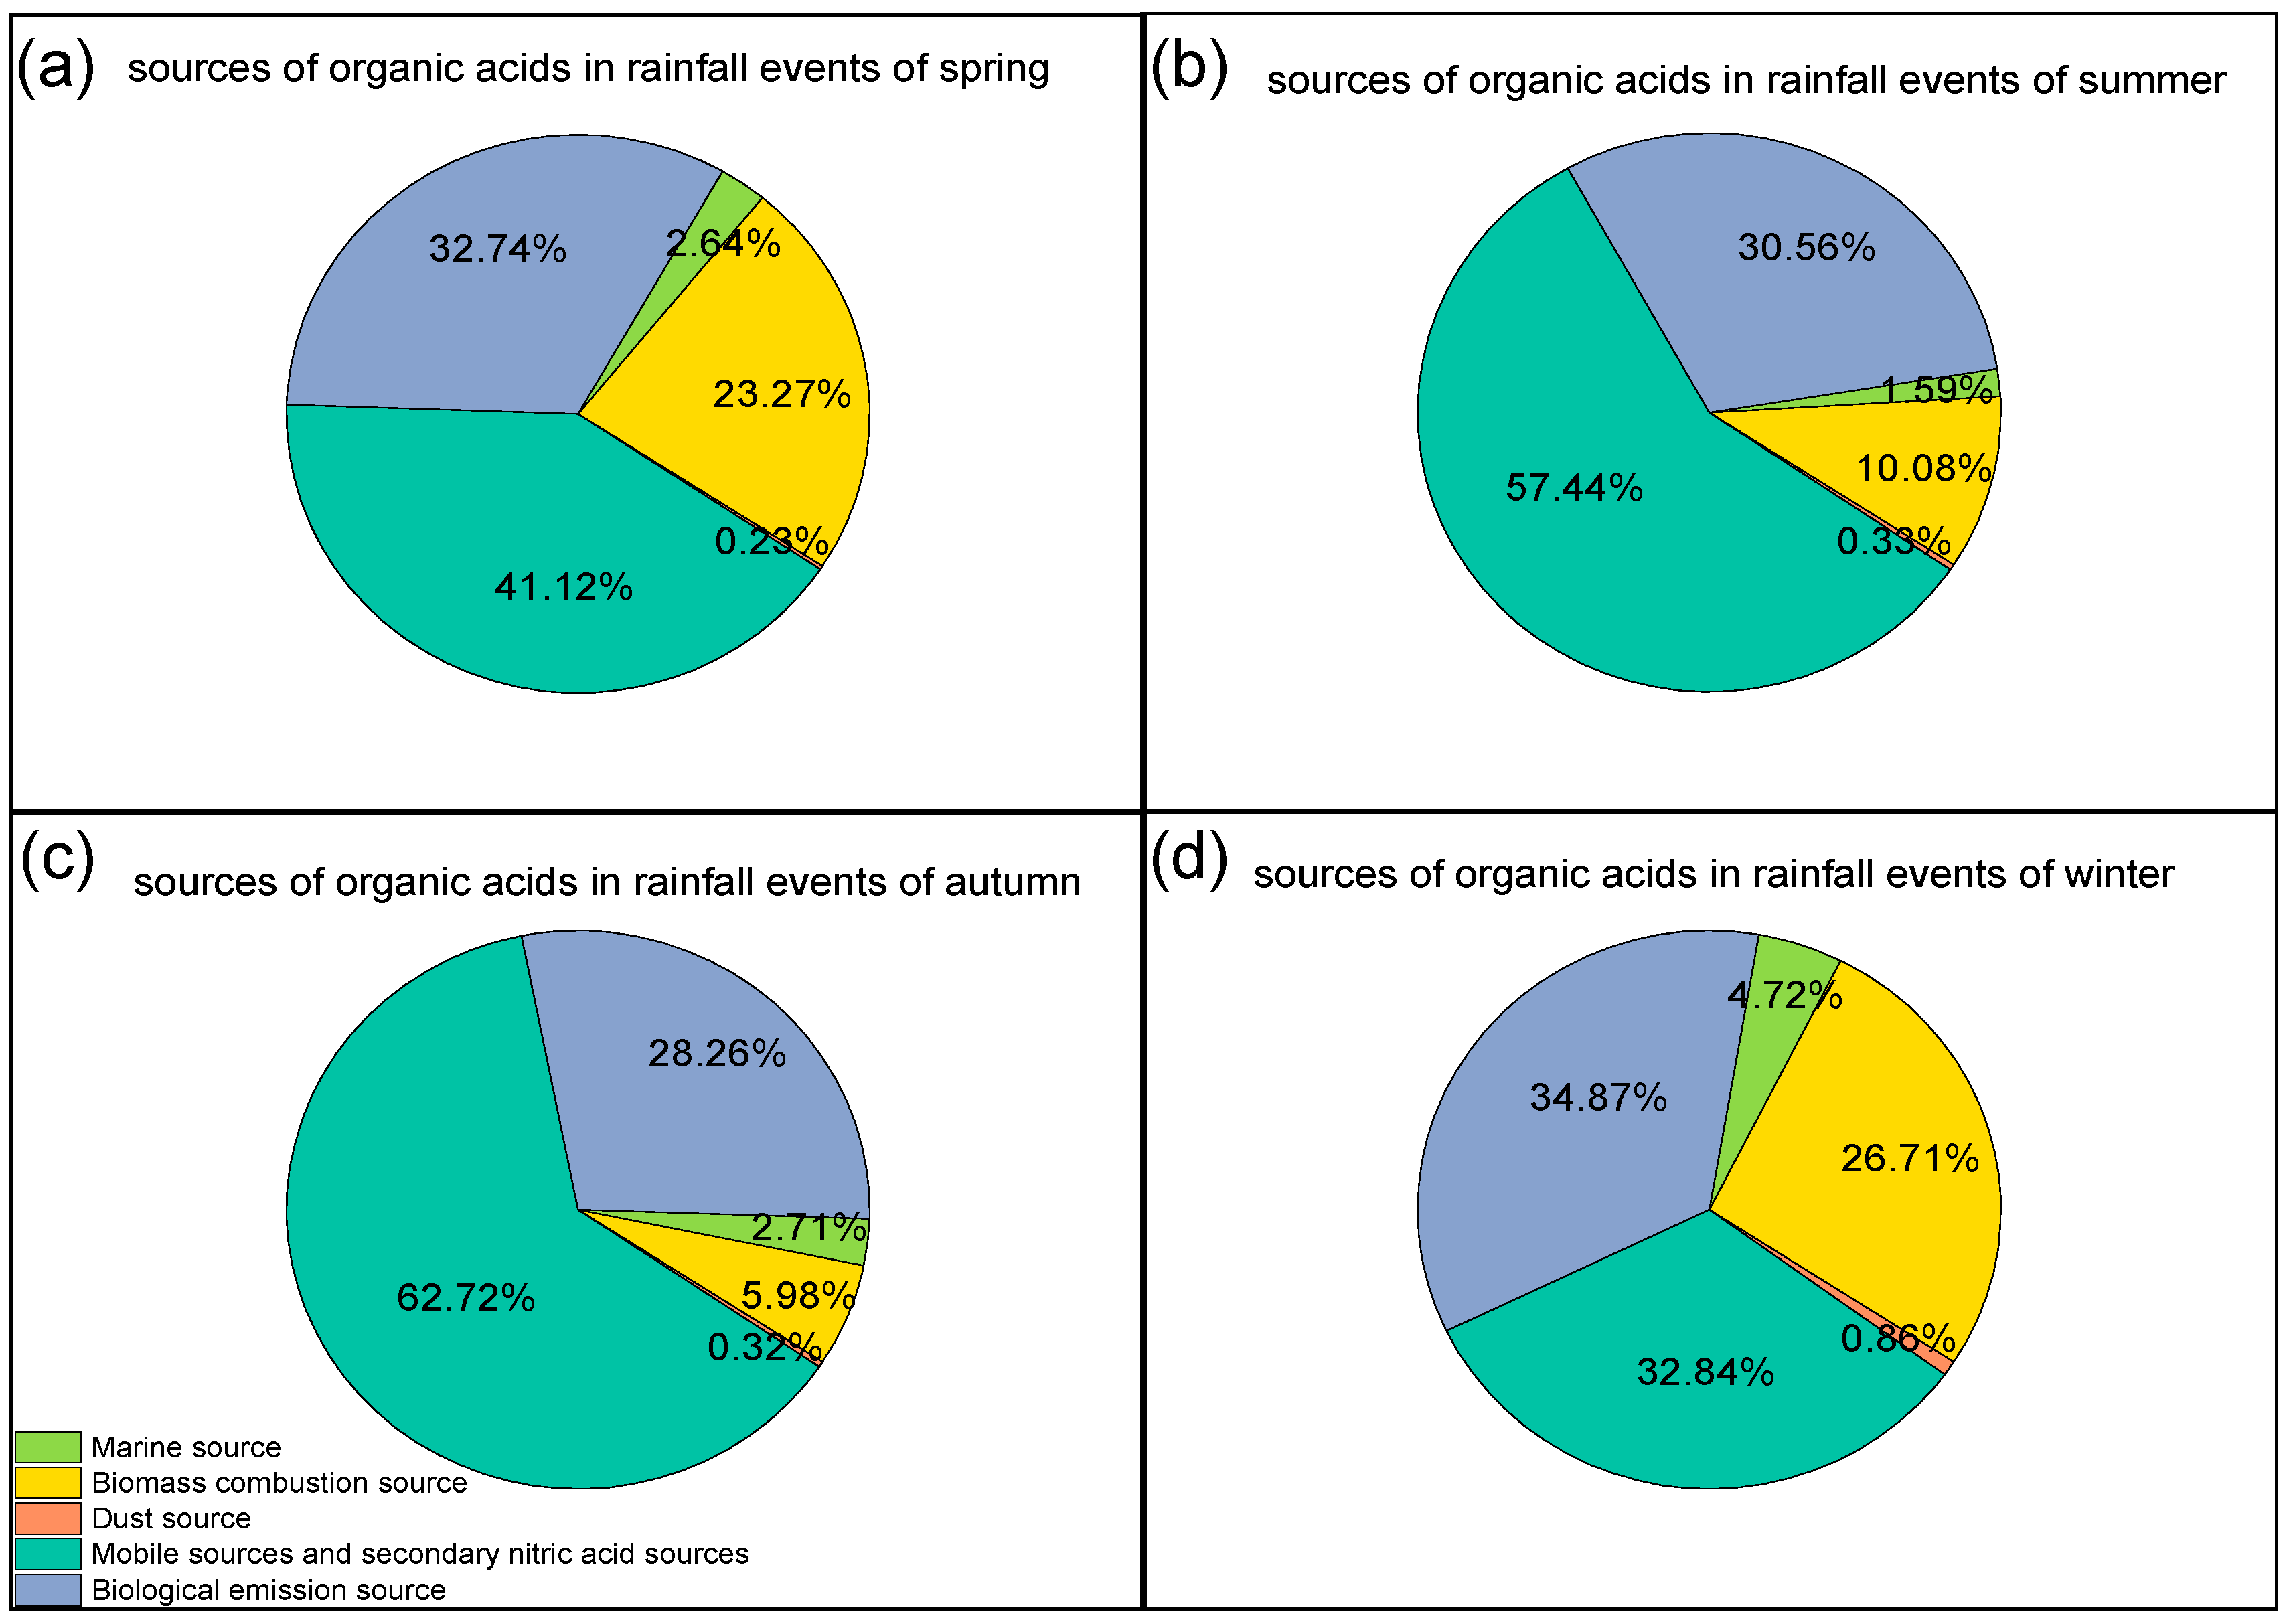
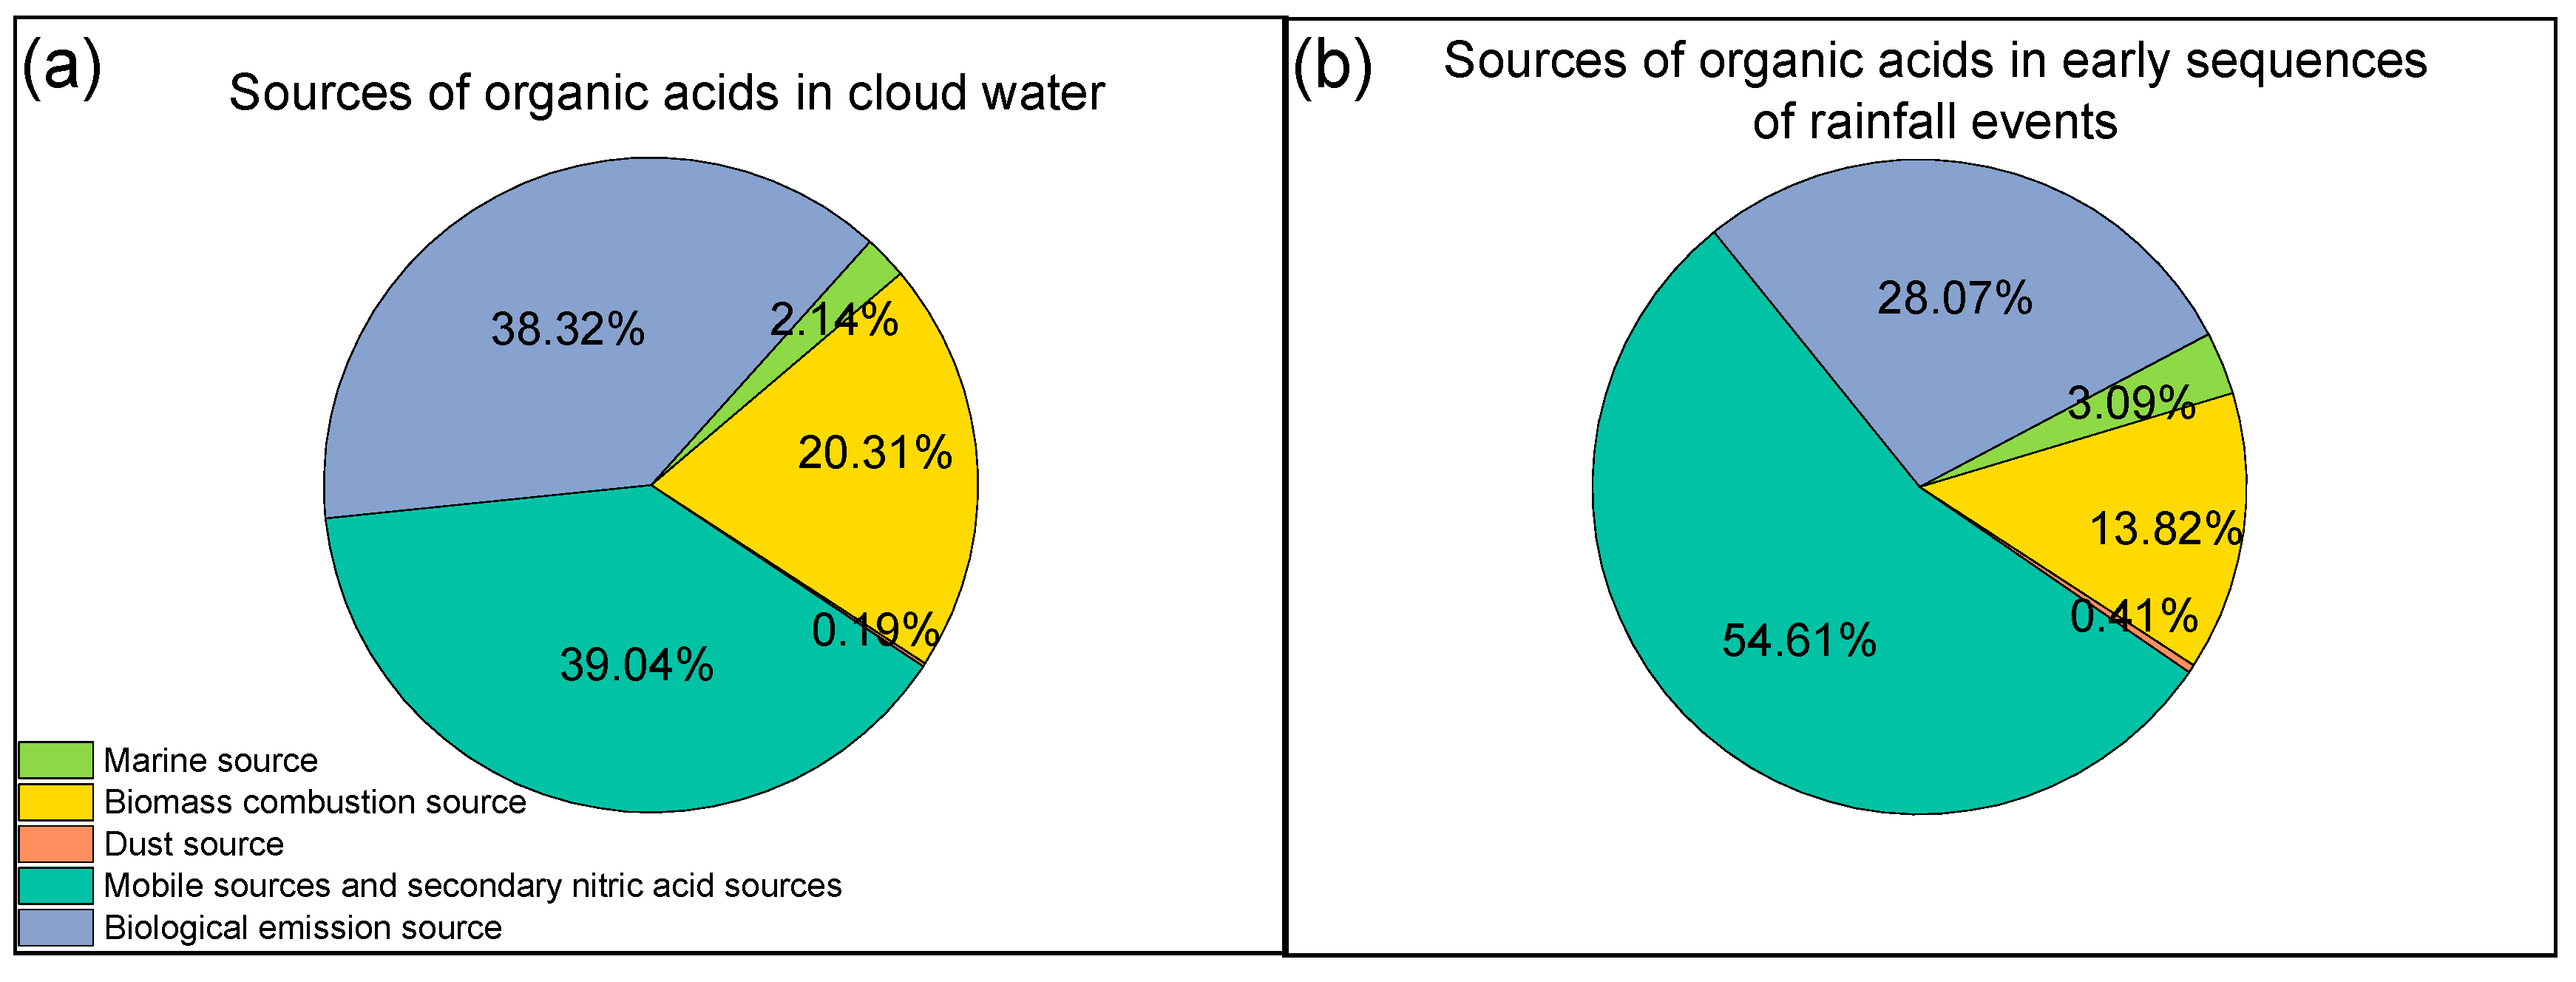
3.3. Sources of Organic Acids in Rainfall Events, Early Sequences of Rainfall Events and Cloud Water

The backward trajectory was analyzed with the concentration proportions of water-soluble ions (Figure 5). In spring, the concentrations of organic acids in rainfall events were highest, corresponding to a large influence from local air masses (32.5%). High organic acid concentrations measured in rainfall events in Shanghai during spring could be associated with generous precursors (terpene and isoprene) discharged by plants in spring, as suggested by many previous studies [15,59,69]. In summer, the proportions of formic acid and acetic acid in rainfall events were highest. As we know, photo-oxidation of terpenes and isoprene might be a significant source of formic acid [18,82]. Summer and autumn had a high incidence of photochemical reactions in Shanghai due to high temperatures [83]. Therefore, secondary sources might also be significant sources of formic acid in Shanghai’s rainfall events. However, the proportion of formic acid in rainfall events in summer was about twice the proportion of that in autumn rainfall events. The reason might be related to the direction of air masses and the intensity of plant emission [59]. The air masses arriving at the sampling site in autumn mostly came from the ocean (50.9%), while the back trajectory showed that the southern winds prevailed in summer (91.8%). Therefore, marine sources might contribute less to the organic acids in rainfall events in Shanghai [18].
The F/A ratio was applied to evaluate the contributions of primary and secondary sources to organic acids in rainfall events in Shanghai (Figure 6). The black curve represented “[F/A] = 1”. The data points under the curve represented “[F/A] < 1”, indicating that organic acids in these rainfall events mainly came from primary emission sources. The rainfall events occurred on the curve ([F/A] > 1), suggested that secondary emission sources were dominant contributors to organic acids in rainfall events. The cases of “F/A > 1” were greater than that of “F/A < 1” in each season, indicating that organic acids in rainfall events in Shanghai were mainly attributable to secondary production processes [84], which also supported our consideration.
Figure 5. Backward trajectory of the major air mass clusters arriving at the sampling site and pie chart of ion concentrations in rainfalls in (a,b) spring, (c,d) summer, (e,f) autumn, and (g,h) winter.
Atmosphere 13 01502 g005
Significant correlations were found between organic acids and some dominant inorganic ions (NH4+, NO3) (r = 0.46–0.59, p < 0.01) (Table S1), suggesting that organic acids and some inorganic ions in rainfall events might have similar sources. In order to make clear their source contributions, correlation analysis and the PMF analysis between organic acids and inorganic ions in rainfall events were investigated (Figure 7). Formic acid, acetic acid, and oxalic acid showed significant correlations with NO3 (r = 0.55, 0.53, and 0.536, respectively, p < 0.01) (Table S1), indicating similar sources of organic acids and NO3 [85,86]. The origins of NO3 in urban rainwater mainly include vehicle exhaust and secondary emission sources [87]. Therefore, these sources could be the sources of organic acids in Shanghai’s rainfall events, contributing 85.6% to formic acid, 22.3% to acetic acid, 18.4% to oxalic acid, and 40.5% to organic acids (Text S1). Oxalic acid was well correlated with K+ (r = 0.48, p < 0.01), which was often used as a tracer for biomass combustion [88]. Biomass combustion was reported previously to release organic acids [89,90]. Therefore, organic acids abundance in rainfall events in Shanghai might be affected by biomass combustion. The contributions of biomass combustion to acetic acid, oxalic acid, and organic acids were 6.5%, 57.1%, and 18.6% (Figure 7). Additionally, biological emissions could be the other sources of organic acids in rainfall events in Shanghai, suggested by the conspicuous correlation of formic acid and acetic acid (r = 0.76, p < 0.01) [91,92]. Biological emissions contributed 73.1% to acetic acid, 7.8% to formic acid, and 37.3% to organic acids in Shanghai’s rainfall events (Figure 7). It has been suggested that DMS, the precursor of MSA, mainly originated from phytoplankton in the sea [91]. Marine sources could explain 3.6% of organic acids in Shanghai’s rainfall events (Figure 7). In summary, organic acids in rainfall events in Shanghai could be primarily derived from vehicle exhaust and secondary emission sources (40.5%), biological emission sources (37.3%), biomass combustion sources (18.6%), and marine sources (3.6%). Meanwhile, significant correlations were found between NH4+ with SO42− and NO3 (r = 0.74, 0.64, p < 0.01) (Table S1), suggesting that the sources of NH4+ might be related to the formation processes of SO42− and NO3. Moreover, the results of PMF analysis further showed that NH4+ in rainfall events in Shanghai could be primarily derived from secondary sulfate sources (61.3%), vehicle exhaust and secondary emission sources (27.3%) and biomass combustion sources (10.4%).
The seasonal variations in the contributions of each source to organic acids in rainfall events are shown in Figure 8. Vehicle exhaust and secondary emission sources, biological emission sources, and biomass combustion sources were the three major sources, both in the spring (41.1%, 32.7%, and 23.3%, respectively) and in winter (32.8%, 34.9%, and 26.7%, respectively), while only vehicle exhaust and secondary emission sources and biological emission sources were the main contribution sources in summer (57.4% and 30.7%) and autumn (62.7% and 28.3%). In summer, organic acids were quickly produced with the photolysis of the precursor of vehicle exhaust emissions by solar radiation in the atmosphere [93,94,95]. Biomass combustion was a significant contribution source in winter (26.7%), as suggested by the prevailing winds that were northwesterly in Shanghai, and there was also large-scale biomass combustion in northern China in winter (Figure 5) [96].
This study analyzed the sources of organic acids in early sequences of rainfall events and cloud water, with the results calculated by the PMF (Figure 9). The contribution ratio of each contributing factor to organic acids in early sequences of rainfall events and cloud water was different. The contributions of vehicle exhaust and secondary emission sources to organic acids in cloud water and early sequences of rainfall events were 39.0% and 54.6%, respectively. Many studies have suggested that the potential sources of coarse particle composition mainly include crustal materials and vehicle emissions [97,98,99]. The proportions of coarse particles in early sequences of rainfall events were higher than that in cloud water [17]. Therefore, the contribution ratios of vehicle exhaust to organic acids in early sequences of rainfall events were more than that of organic acids in cloud water. Nevertheless, the contribution ratios of biological emissions to organic acids in early sequences of rainfall events (28.1%) were less than that of organic acids in cloud water (38.3%). Previous studies have shown that 70–80% of organic acids in cloud water collected near Atlanta originated from biological emissions [100]; the majority of organic acids observed in the cloud water corresponded to photochemical oxidation of monoterpenes and isoprene caused by the significant biological emissions from a local forest in Alabama [101]. Biological emissions contributed 61.8% to organic acids in cloud water in Mount Lu [15]. In addition, biological combustion contributed 20.3% to organic acids in cloud water and 13.8% to that in rainfall events. The distributions of biological combustion sources in cloud water and rainfall events were similar to biological emission sources. Therefore, organic acids from biological emission sources and biological combustion sources might mainly exist in cloud water in Shanghai.
Figure 8. Illustrations of the percentage of factor contributions to organic acids in (a) spring, (b) summer, (c) autumn, and (d) winter.
Atmosphere 13 01502 g008

3.4. Atmospheric Environmental Implications

Shanghai is located at the mouth of the Yangtze River. Although the overall atmospheric environment has improved with the implementation of a series of energy conservation and emission reduction policies, the frequency of acid rain still exceeded 40% [87]. In this study, the range of pH values of rainfall events was from 3.95 to 7.52 (VWM = 5.31). The pH values in cloud water varied between 3.95 and 7.40 (VWM = 5.14). The contributions of organic acids to the acidity of rainfall events were 17.8 ± 10.2% (Table 1). In addition to some inorganic acids, such as sulfuric acid and nitric acid, it has been confirmed that organic acids have a significant effect on the acidity of rainwater [14,102]. It was found that the contributions of organic acids to the acidity of rainfall events in Lin ‘an (17.7%), Anshun (58.1%), Mount Lu (12.3%), Mount Heng (16.8%), and Mount Mangdang (18.4%) with lush plants were higher, compared to the contributions in urban sites, such as Xiamen and Shenzhen (less than 2%) (Table 1) [4,12,27,45,59,103]. Organic acids in the United States, Brazil, and South America contributed more than 25% to the free acidity of rainwater (Table 1) [25,31,66,68]. Therefore, the contributions of organic acids to the acidity of rainfall events in Shanghai might be greater than that of most cities in China [15,104]. Moreover, the contributions of organic acids to the acidity of cloud water were 18.1 ± 10.2%, similar to rainfall events, indicating that the contributions of organic acids to the acidity of rainfall events were greatly affected by cloud water. The study might provide a referential data set for the scientific control of acid rain in the future.
A previous study has evaluated the time series data from more than 500 remote streams and lakes in Northern Europe and North America, showing that the increase in the concentrations of organic acids was proportional to the decline rate of sea salt and anthropogenic sulfur deposited in the atmosphere [105]. The change in organic acidity partially buffered the acid deposition in these ecosystems, and the increase in organic acids was a necessary condition for recovery from acidification [105,106,107]. In recent years, the concentrations of sulfate and sea salt ions in rainfall events in shanghai have decreased [104], while the concentrations of organic acids and their contributions to rainwater acidity showed the opposite trend [54]. It should be noted that the concentrations of organic acids in the atmosphere might continue to increase, which would have unpredictable consequences for the global carbon cycle [105]. Source differences in organic acids in cloud water and early sequences of rainfall events analyzed in this study could improve current understanding of in-cloud and below-cloud origins and the transformation mechanism of organic acids.

4. Conclusions

In this study, an automatic volume-based sequential rain sampler was designed to collect rainwater samples from August 2020 to May 2021, with 616 samples. Firstly, we found that the ion concentrations in the sequential volume-based rainwater samples did not change significantly after the cumulative rainfall reached 1.0~1.6 mm (1.2 mm, on average). This could be the standard to distinguish cloud water from rainfall events. Secondly, we compared the VWM concentration of organic acids in cloud water and early sequences of rainfall events. It could be concluded that organic acids in rainfall events might mainly exist in fine particles. Finally, the PMF was introduced to analyze the sources of organic acids in Shanghai’s rainfall events. The contributions of vehicle exhaust and secondary emission sources, biological emission sources, biomass combustion sources, and marine sources to organic acids in rainfall events were 40.5%, 37.3%, 18.6%, and 3.6%. Vehicle exhaust and secondary emission sources accounted for more than half of the contributions of organic acids in early sequences of rainfall events. The contributions of biological emission sources to organic acids in cloud water were 10% more than that of organic acids in early sequences of rainfall events. Meanwhile, the contributions of organic acids to the acidity of rainfall events were 17.8 ± 10.2% in Shanghai.
The analysis results of chemical characteristics and source analysis of organic acids in rainfall events could provide suggestions for controlling rainwater acidity and the control of global carbon emissions. In the following research, we will improve the sampler by adding automatically timing elements and collecting PM samples in the same period to further study the sources and transformation mechanism of organic acids in cloud water and rainfall events. Meanwhile, there are possibilities of Synoptic weather patterns influencing the variability of organic acids. Therefore, it is necessary to consider the influence of Synoptic weather patterns on the formation and content of organic acids in future research.

Supplementary Materials

The following are available online at https://www.mdpi.com/article/10.3390/atmos13091502/s1, Figure S1. Map showing the location of the sampling site and its surrounding; Figure S2. Automatic volume-based sequential rain sampler; Figure S3. Ion balance between total cations (TZ+) and total anions (TZ); Figure S4. The proportions of ion concentration in rainfall events change with rainfall. The cumulative rainfall is taken as the abscissa and the total ion concentration as the ordinate. Each pie chart represents the concentration proportions of the corresponding cumulative rainfall; Figure S5. Concentration comparisons of inorganic ions and organic acids in early sequences of rainfall events and cloud water. (a) Concentration comparisons of inorganic ions in early sequences of rainfall events and cloud water. (b) Concentration comparisons of organic acids in early sequences of rainfall events and cloud water. The upper half-circle represents cloud water. The lower circle represents early sequences of rainfall events; Figure S6. Seasonal concentration variations of organic acids and inorganic ions in early sequences of rainfall events and cloud water. (a) Seasonal concentration variations of organic acids in cloud water. (b) Seasonal concentration variations of organic acids in early sequences of rainfall events. (c) Seasonal concentration variations of inorganic ions in cloud water. (d) Seasonal concentration variations of inorganic ions in early sequences of rainfall events. Table S1. The rainfall events with corresponding ranges and mean of pH values; Table S2. Correlation analysis of organic acids and inorganic ions. References [85,89,91,92,108,109,110,111,112] are cited in the supplementary materials.

Author Contributions

Conceptualization, Z.X., H.X. and Y.X.; methodology, Z.X., H.X. and Y.X.; Design and processing of sampler, Z.X. and H.X.; Sampling, Z.X.; Sample detection, Z.X.; data curation, Z.X.; writing—original draft preparation, Z.X., H.X. and Y.X.; writing—review and editing, Z X., H.X. and Y.X.; supervision, H.X. and Y.X.; project administration, H.X.; funding acquisition, H.X. All authors have read and agreed to the published version of the manuscript.

Funding

This study was supported by Shanghai “Science and Technology Innovation Action Plan” Shanghai Sailing Program through grant 22YF1418700 (Y. Xu) and the National Key Research and Development Program of China through grant 2016YFA0601000 (H.Y. Xiao).

Institutional Review Board Statement

Not applicable.

Informed Consent Statement

Not applicable.

Data Availability Statement

The datasets are available from the corresponding author upon reasonable request.

Conflicts of Interest

The authors declare no conflict of interest.

References

  1. Barbaro, E.; Padoan, S.; Kirchgeorg, T.; Zangrando, R.; Toscano, G.; Barbante, C.; Gambaro, A. Particle size distribution of inorganic and organic ions in coastal and inland Antarctic aerosol. Environ. Sci. Pollut. Res. 2016, 24, 2724–2733. [Google Scholar] [CrossRef] [PubMed]
  2. Gao, S.; Hegg, D.A.; Hobbs, P.V.; Kirchstetter, T.W.; Magi, B.; Sadilek, M. Water-soluble organic components in aerosols associated with savanna fires in southern Africa: Identification, evolution, and distribution. J. Geophys. Res. Earth Surf. 2003, 108, 8491. [Google Scholar] [CrossRef]
  3. Kawamura, K.; Bikkina, S. A review of dicarboxylic acids and related compounds in atmospheric aerosols: Molecular distributions, sources and transformation. Atmos. Res. 2016, 170, 140–160. [Google Scholar] [CrossRef]
  4. Niu, Y.; Li, X.; Pu, J.; Huang, Z. Organic acids contribute to rainwater acidity at a rural site in eastern China. Air Qual. Atmos. Health 2018, 11, 459–469. [Google Scholar] [CrossRef]
  5. Zhang, R. Getting to the Critical Nucleus of Aerosol Formation. Science 2010, 328, 5984. [Google Scholar] [CrossRef]
  6. Gioda, A.; Reyes-Rodríguez, G.J.; Santos-Figueroa, G.; Collett, J.L., Jr.; Decesari, S.; Ramos, M.D.C.K.V.; Netto, H.J.C.B.; Neto, F.R.D.A.; Mayol-Bracero, O.L. Speciation of water-soluble inorganic, organic, and total nitrogen in a background marine environment: Cloud water, rainwater, and aerosol particles. J. Geophys. Res. Earth Surf. 2011, 116, D05203. [Google Scholar] [CrossRef]
  7. Ovadnevaite, J.; Ceburnis, D.; Leinert, S.; Dall’Osto, M.; Canagaratna, M.; O’Doherty, S.; Berresheim, H.; O’Dowd, C. Submicron NE Atlantic marine aerosol chemical composition and abundance: Seasonal trends and air mass categorization. J. Geophys. Res. Atmos. 2014, 119, 11850–11863. [Google Scholar] [CrossRef]
  8. Bardouki, H.; Berresheim, H.; Vrekoussis, M.; Sciare, J.; Kouvarakis, G.; Oikonomou, K.; Schneider, J.; Mihalopoulos, N. Gaseous (DMS, MSA, SO2, H2SO4 and DMSO) and particulate (sulfate and methanesulfonate) sulfur species over the northeastern coast of Crete. Atmos. Chem. Phys. 2003, 3, 1871–1886. [Google Scholar] [CrossRef]
  9. Gondwe, M.; Krol, M.; Klaassen, W.; Gieskes, W.; de Baar, H. Comparison of modeled versus measured MSA:nss SO4= ratios: A global analysis. Glob. Biogeochem. Cycles 2004, 18, 1–18. [Google Scholar] [CrossRef]
  10. Sorooshian, A.; Padró, L.T.; Nenes, A.; Feingold, G.; McComiskey, A.; Hersey, S.P.; Gates, H.; Jonsson, H.H.; Miller, S.D.; Stephens, G.L.; et al. On the link between ocean biota emissions, aerosol, and maritime clouds: Airborne, ground, and satellite measurements off the coast of California. Glob. Biogeochem. Cycles 2009, 23, 34. [Google Scholar] [CrossRef] [Green Version]
  11. van Drooge, B.L.; Grimalt, J.O. Particle size-resolved source apportionment of primary and secondary organic tracer compounds at urban and rural locations in Spain. Atmos. Chem. Phys. 2015, 15, 7735–7752. [Google Scholar] [CrossRef]
  12. Sun, M.; Wang, Y.; Wang, T.; Fan, S.; Wang, W.; Li, P.; Guo, J.; Li, Y. Cloud and the corresponding precipitation chemistry in south China: Water-soluble components and pollution transport. J. Geophys. Res. Earth Surf. 2010, 115, D22303. [Google Scholar] [CrossRef]
  13. Keene, W.C.; Galloway, J.; Holden, J.D. Measurement of weak organic acidity in precipitation from remote areas of the world. J. Geophys. Res. Earth Surf. 1983, 88, 5122–5130. [Google Scholar] [CrossRef]
  14. Fornaro, A.; Gutz, I.G. Wet deposition and related atmospheric chemistry in the São Paulo metropolis, Brazil: Part 2—Contribution of formic and acetic acids. Atmos. Environ. 2003, 37, 117–128. [Google Scholar] [CrossRef]
  15. Sun, X.; Wang, Y.; Li, H.; Yang, X.; Sun, L.; Wang, X.; Wang, T.; Wang, W. Organic acids in cloud water and rainwater at a mountain site in acid rain areas of South China. Environ. Sci. Pollut. Res. 2016, 23, 9529–9539. [Google Scholar] [CrossRef]
  16. Sorooshian, A.; Lu, M.-L.; Brechtel, F.J.; Jonsson, H.; Feingold, G.; Flagan, R.C.; Seinfeld, J.H. On the Source of Organic Acid Aerosol Layers above Clouds. Environ. Sci. Technol. 2007, 41, 4647–4654. [Google Scholar] [CrossRef]
  17. Karşı, M.B.B.; Yenïsoy-Karakaş, S.; Karakaş, D. Investigation of washout and rainout processes in sequential rain samples. Atmos. Environ. 2018, 190, 53–64. [Google Scholar] [CrossRef]
  18. Kavouras, I.; Mihalopoulos, N.; Stephanou, E.G. Formation of atmospheric particles from organic acids produced by forests. Nature 1998, 395, 683–686. [Google Scholar] [CrossRef]
  19. Wu, S.-P.; Schwab, J.; Liu, B.-L.; Li, T.-C.; Yuan, C.-S. Seasonal variations and source identification of selected organic acids associated with PM10 in the coastal area of Southeastern China. Atmos. Res. 2015, 155, 37–51. [Google Scholar] [CrossRef]
  20. Gomez, S.L.; Carrico, C.M.; Allen, C.; Lam, J.; Dabli, S.; Sullivan, A.P.; Aiken, A.C.; Rahn, T.; Romonosky, D.; Chylek, P.; et al. Biomass Burning Smoke Hygroscopicity: The Role of Plant Phenology, Chemical Composition, and Combustion Properties. J. Geophys. Res. Atmos. 2018, 123, 5416–5432. [Google Scholar] [CrossRef]
  21. Huang, X.-F.; He, L.-Y.; Hu, M.; Zhang, Y.-H. Annual variation of particulate organic compounds in PM2.5 in the urban atmosphere of Beijing. Atmos. Environ. 2006, 40, 2449–2458. [Google Scholar] [CrossRef]
  22. Cheung, K.L.; Ntziachristos, L.; Tzamkiozis, T.; Schauer, J.J.; Samaras, Z.; Moore, K.F.; Sioutas, C. Emissions of Particulate Trace Elements, Metals and Organic Species from Gasoline, Diesel, and Biodiesel Passenger Vehicles and Their Relation to Oxidative Potential. Aerosol Sci. Technol. 2010, 44, 500–513. [Google Scholar] [CrossRef]
  23. Altieri, K.E.; Hastings, M.G.; Peters, A.J.; Sigman, D.M. Molecular characterization of water soluble organic nitrogen in marine rainwater by ultra-high resolution electrospray ionization mass spectrometry. Atmos. Chem. Phys. 2012, 12, 3557–3571. [Google Scholar] [CrossRef]
  24. da Rocha, G.O.; Allen, A.G.; Cardoso, A.A. Influence of Agricultural Biomass Burning on Aerosol Size Distribution and Dry Deposition in Southeastern Brazil. Environ. Sci. Technol. 2005, 39, 5293–5301. [Google Scholar] [CrossRef]
  25. Mphepya, J.N.; Pienaar, J.J.; Galy-Lacaux, C.; Held, G.; Turner, C.R. Precipitation Chemistry in Semi-Arid Areas of Southern Africa: A Case Study of a Rural and an Industrial Site. J. Atmos. Chem. 2004, 47, 1–24. [Google Scholar] [CrossRef]
  26. Chebbi, A.; Carlier, P. Carboxylic acids in the troposphere, occurrence, sources, and sinks: A review. Atmos. Environ. 1996, 30, 4233–4249. [Google Scholar] [CrossRef]
  27. Zhang, Y.; Lee, X.; Cao, F. Chemical characteristics and sources of organic acids in precipitation at a semi-urban site in Southwest China. Atmos. Environ. 2011, 45, 413–419. [Google Scholar] [CrossRef]
  28. Guo, W.; Zhang, Z.; Zheng, N.; Luo, L.; Xiao, H.; Xiao, H. Chemical characterization and source analysis of water-soluble inorganic ions in PM2.5 from a plateau city of Kunming at different seasons. Atmos. Res. 2019, 234, 104687. [Google Scholar] [CrossRef]
  29. Xie, Y.; Lu, H.; Yi, A.; Zhang, Z.; Zheng, N.; Fang, X.; Xiao, H. Characterization and source analysis of water–soluble ions in PM2.5 at a background site in Central China. Atmos. Res. 2020, 239, 104881. [Google Scholar] [CrossRef]
  30. Niu, Y.; Li, X.; Huang, Z.; Zhu, C. Chemical characteristics and possible causes of acid rain at a regional atmospheric background site in eastern China. Air Qual. Atmos. Health 2017, 10, 971–980. [Google Scholar] [CrossRef]
  31. Sakugawa, H.; Kaplan, I.R.; Shepard, L.S. Measurements of H2O2, aldehydes and organic acids in Los Angeles rainwater: Their sources and deposition rates. Atmos. Environ. Part B Urban Atmos. 1993, 27, 203–219. [Google Scholar] [CrossRef]
  32. Wang, Y.Q. MeteoInfo: GIS software for meteorological data visualization and analysis. Meteorol. Appl. 2012, 21, 360–368. [Google Scholar] [CrossRef]
  33. Andreae, M.; Talbot, R.W.; Berresheim, H.; Beecher, K.M. Precipitation chemistry in central Amazonia. J. Geophys. Res. Earth Surf. 1990, 95, 16987–16999. [Google Scholar] [CrossRef]
  34. Winiwarter, W.; Puxbaum, H.; Fuzzi, S.; Facchini, M.C.; Orsi, G.; Beltz, N.; Enderle, K.; Jaeschke, W. Organic acid gas and liquid-phase measurements in Po Valley fall-winter conditions in the presence of fog. Tellus B Chem. Phys. Meteorol. 1988, 40B, 348–357. [Google Scholar] [CrossRef]
  35. Johnson, B.J.; Dawson, G.A. A preliminary study of the carbon-isotopic content of ambient formic acid and two selected sources: Automobile exhaust and formicine ants. J. Atmos. Chem. 1993, 17, 123–140. [Google Scholar] [CrossRef]
  36. Paatero, P.; Tapper, U. Positive matrix factorization: A non-negative factor model with optimal utilization of error estimates of data values. Environmetrics 1994, 5, 111–126. [Google Scholar] [CrossRef]
  37. Xu, Y.; Xiao, H.-Y.; Wu, D.; Long, C. Abiotic and Biological Degradation of Atmospheric Proteinaceous Matter Can Contribute Significantly to Dissolved Amino Acids in Wet Deposition. Environ. Sci. Technol. 2020, 54, 6551–6561. [Google Scholar] [CrossRef]
  38. Zhou, Y.; Xiao, H.; Guan, H.; Zheng, N.; Zhang, Z.; Tian, J.; Qu, L.; Zhao, J.; Xiao, H. Chemical composition and seasonal variations of PM2.5 in an urban environment in Kunming, SW China: Importance of prevailing westerlies in cold season. Atmos. Environ. 2020, 237, 117704. [Google Scholar] [CrossRef]
  39. Al-Khashman, O.A. Chemical characteristics of rainwater collected at a western site of Jordan. Atmos. Res. 2009, 91, 53–61. [Google Scholar] [CrossRef]
  40. Akoto, O.; Darko, G.; Nkansah, M. Chemical Composition of Rainwater over a Mining Area in Ghana. Int. J. Environ. Res. 2011, 5, 847–854. [Google Scholar] [CrossRef]
  41. White, E.M.; Landis, M.S.; Keeler, G.J.; Barres, J.A. Investigation of mercury wet deposition physicochemistry in the Ohio River Valley through automated sequential sampling. Sci. Total Environ. 2013, 448, 107–119. [Google Scholar] [CrossRef] [PubMed]
  42. Anil, I.; Alagha, O.; Karaca, F. Effects of transport patterns on chemical composition of sequential rain samples: Trajectory clustering and principal component analysis approach. Air Qual. Atmos. Health 2017, 10, 1193–1206. [Google Scholar] [CrossRef]
  43. Aikawa, M.; Hiraki, T.; Eiho, J. Study on the acidification and pollution of precipitation based on a data set collected on a 0.5-mm precipitation basis. Atmos. Environ. 2008, 42, 7043–7049. [Google Scholar] [CrossRef]
  44. Löflund, M.; Kasper-Giebl, A.; Schuster, B.; Giebl, H.; Hitzenberger, R.; Puxbaum, H. Formic, acetic, oxalic, malonic and succinic acid concentrations and their contribution to organic carbon in cloud water. Atmos. Environ. 2002, 36, 1553–1558. [Google Scholar] [CrossRef]
  45. Wan, X.; Kang, S.; Xin, J.; Liu, B.; Wen, T.; Wang, P.; Wang, Y.; Cong, Z. Chemical composition of size-segregated aerosols in Lhasa city, Tibetan Plateau. Atmos. Res. 2016, 174–175, 142–150. [Google Scholar] [CrossRef]
  46. Zhou, S.; Wu, L.; Guo, J.; Chen, W.; Wang, X.; Zhao, J.; Cheng, Y.; Huang, Z.; Zhang, J.; Sun, Y.; et al. Measurement report: Vertical distribution of atmospheric particulate matter within the urban boundary layer in southern China—Size-segregated chemical composition and secondary formation through cloud processing and heterogeneous reactions. Atmos. Chem. Phys. 2020, 20, 6435–6453. [Google Scholar] [CrossRef]
  47. Wanqing, L. The characterization of hydrogen ion concentration in sequential cumulative rainwater. Atmos. Environ. 2001, 35, 6219–6225. [Google Scholar] [CrossRef]
  48. Lim, B.; Jickells, T.; Davies, T. Sequential sampling of particles, major ions and total trace metals in wet deposition. Atmos. Environ. Part A Gen. Top. 1991, 25, 745–762. [Google Scholar] [CrossRef]
  49. Kawamura, K.; Kaplan, I.R. Compositional change of organic matter in rainwater during precipitation events. Atmos. Environ. 1986, 20, 527–535. [Google Scholar] [CrossRef]
  50. Sorooshian, A.; Ng, N.L.; Chan, A.W.H.; Feingold, G.; Flagan, R.C.; Seinfeld, J.H. Particulate organic acids and overall water-soluble aerosol composition measurements from the 2006 Gulf of Mexico Atmospheric Composition and Climate Study (GoMACCS). J. Geophys. Res. Earth Surf. Atmos. 2007, 112, D13201. [Google Scholar] [CrossRef] [Green Version]
  51. He, J.; Balasubramanian, R. Semi-volatile organic compounds (SVOCs) in ambient air and rainwater in a tropical environment: Concentrations and temporal and seasonal trends. Chemosphere 2010, 78, 742–751. [Google Scholar] [CrossRef] [PubMed]
  52. Jung, J.; Tsatsral, B.; Kim, Y.J.; Kawamura, K. Organic and inorganic aerosol compositions in Ulaanbaatar, Mongolia, during the cold winter of 2007 to 2008: Dicarboxylic acids, ketocarboxylic acids, and α-dicarbonyls. J. Geophys. Res. Earth Surf. 2010, 115, D22203. [Google Scholar] [CrossRef]
  53. Sun, L.; Wang, Y.; Yue, T.; Yang, X.; Xue, L.; Wang, W. Evaluation of the behavior of clouds in a region of severe acid rain pollution in southern China: Species, complexes, and variations. Environ. Sci. Pollut. Res. 2015, 22, 14280–14290. [Google Scholar] [CrossRef] [PubMed]
  54. Huang, K.; Zhuang, G.; Xu, C.; Wang, Y.; Tang, A. The chemistry of the severe acidic precipitation in Shanghai, China. Atmos. Res. 2008, 89, 149–160. [Google Scholar] [CrossRef]
  55. Martinelango, P.K.; Dasgupta, P.; Al-Horr, R.S. Atmospheric production of oxalic acid/oxalate and nitric acid/nitrate in the Tampa Bay airshed: Parallel pathways. Atmos. Environ. 2007, 41, 4258–4269. [Google Scholar] [CrossRef]
  56. Wang, B.; Kelly, S.T.; Sellon, R.; Shilling, J.; Tivanski, A.V.; Moffet, R.C.; Gilles, M.K.; Laskin, A. Field and laboratory studies of reactions between atmospheric water soluble organic acids and inorganic particles. In Proceedings of the Paper presented at the AIP Conference Proceedings, Fort Collins, CO, USA, 23–28 June 2013; Colorado State University: Fort Collins, CO, USA, 2013. [Google Scholar]
  57. Chowhan, Z. pH–Solubility Profiles of Organic Carboxylic Acids and Their Salts. J. Pharm. Sci. 1978, 67, 1257–1260. [Google Scholar] [CrossRef]
  58. Huo, M.; Sun, Q.; Bai, Y.; Xie, P.; Liu, Z.; Li, J.; Wang, X.; Lu, S. Chemical character of precipitation and related particles and trace gases in the North and South of China. J. Atmos. Chem. 2010, 67, 29–43. [Google Scholar] [CrossRef]
  59. Du, W.; Hong, Z.; Chen, Y.; Deng, J.; Chen, J.; Xu, L.; Hong, Y.-W.; Xiao, H. Spatiotemporal distribution and source apportionment of low molecular weight organic acids in wet precipitation at a coastal city, China. Environ. Sci. Pollut. Res. 2017, 24, 8399–8410. [Google Scholar] [CrossRef]
  60. Hu, M.; Zhang, J.; Wu, Z. Chemical compositions of precipitation and scavenging of particles in Beijing. Sci. China Ser. B Chem. 2005, 48, 265–272. [Google Scholar] [CrossRef]
  61. Wang, Y.; Sun, M.; Li, P.; Li, Y.; Xue, L.; Wang, W. Variation of low molecular weight organic acids in precipitation and cloudwater at high elevation in South China. Atmos. Environ. 2011, 45, 6518–6525. [Google Scholar] [CrossRef]
  62. Souza, S. Low molecular weight carboxylic acids in an urban atmosphere: Winter measurements in São Paulo City, Brazil. Atmos. Environ. 1999, 33, 2563–2574. [Google Scholar] [CrossRef]
  63. Sanhueza, E.; Figueroa, L.; Santana, M. Atmospheric formic and acetic acids in Venezuela. Atmos. Environ. 1996, 30, 1861–1873. [Google Scholar] [CrossRef]
  64. Xu, J.; Chen, J.; Shi, Y.; Zhao, N.; Qin, X.; Yu, G.; Liu, J.; Lin, Y.; Fu, Q.; Weber, R.J.; et al. First Continuous Measurement of Gaseous and Particulate Formic Acid in a Suburban Area of East China: Seasonality and Gas–Particle Partitioning. ACS Earth Space Chem. 2019, 4, 157–167. [Google Scholar] [CrossRef]
  65. Gang, X.; Lee, X.; Lü, Y.; Chen, Y.; Huang, D. Seasonal Variations of Carboxylic Acids and Their Contributions to the Rainwater Acidity: A Case Study of Guiyang and Shangzhong, China. Chin. Sci. Bull. 2010, 55, 1667–1673. [Google Scholar] [CrossRef]
  66. Willey, J.D.; Glinski, D.A.; Southwell, M.; Long, M.S.; Avery, G.B., Jr.; Kieber, R.J. Decadal variations of rainwater formic and acetic acid concentrations in Wilmington, NC, USA. Atmos. Environ. 2011, 45, 1010–1014. [Google Scholar] [CrossRef]
  67. Peña, R.M.; García, S.; Herrero, C.; Losada, M.; Vázquez, A.; Lucas, T. Organic acids and aldehydes in rainwater in a northwest region of Spain. Atmos. Environ. 2002, 36, 5277–5288. [Google Scholar] [CrossRef]
  68. Coelho, C.H.; Allen, A.G.; Fornaro, A.; Orlando, E.A.; Grigoletto, T.L.; Campos, M.L.A. Wet deposition of major ions in a rural area impacted by biomass burning emissions. Atmos. Environ. 2011, 45, 5260–5265. [Google Scholar] [CrossRef]
  69. Tsai, Y.I.; Kuo, S.-C. Contributions of low molecular weight carboxylic acids to aerosols and wet deposition in a natural subtropical broad-leaved forest environment. Atmos. Environ. 2013, 81, 270–279. [Google Scholar] [CrossRef]
  70. Nolte, C.G.; Fraser, M.P.; Cass, G.R. Gas Phase C2−C10 Organic Acids Concentrations in the Los Angeles Atmosphere. Environ. Sci. Technol. 1999, 33, 540–545. [Google Scholar] [CrossRef]
  71. Salve, P.R.; Maurya, A.; Wate, S.R.; Devotta, S. Chemical Composition of Major Ions in Rainwater. Bull. Environ. Contam. Toxicol. 2008, 80, 242–246. [Google Scholar] [CrossRef]
  72. Gierlus, K.M.; Laskina, O.; Abernathy, T.L.; Grassian, V.H. Laboratory study of the effect of oxalic acid on the cloud condensation nuclei activity of mineral dust aerosol. Atmos. Environ. 2012, 46, 125–130. [Google Scholar] [CrossRef]
  73. Carlton, A.G.; Turpin, B.J.; Lim, H.-J.; Altieri, K.E.; Seitzinger, S. Link between isoprene and secondary organic aerosol (SOA): Pyruvic acid oxidation yields low volatility organic acids in clouds. Geophys. Res. Lett. 2006, 33, 6822. [Google Scholar] [CrossRef]
  74. Davis, D.; Chen, G.; Kasibhatla, P.; Jefferson, A.; Tanner, D.; Eisele, F.; Lenschow, D.; Neff, W.; Berresheim, H. DMS oxidation in the Antarctic marine boundary layer: Comparison of model simulations and held observations of DMS, DMSO, DMSO2, H2SO4(g), MSA(g), and MSA(p). J. Geophys. Res. Earth Surf. 1998, 103, 1657–1678. [Google Scholar] [CrossRef]
  75. Sorooshian, A.; Crosbie, E.; Maudlin, L.C.; Youn, J.; Wang, Z.; Shingler, T.; Ortega, A.M.; Hersey, S.; Woods, R.K. Surface and airborne measurements of organosulfur and methanesulfonate over the western United States and coastal areas. J. Geophys. Res. Atmos. 2015, 120, 8535–8548. [Google Scholar] [CrossRef]
  76. Xu, Y.; Miyazaki, Y.; Tachibana, E.; Sato, K.; Ramasamy, S.; Mochizuki, T.; Sadanaga, Y.; Nakashima, Y.; Sakamoto, Y.; Matsuda, K.; et al. Aerosol Liquid Water Promotes the Formation of Water-Soluble Organic Nitrogen in Submicrometer Aerosols in a Suburban Forest. Environ. Sci. Technol. 2020, 54, 1406–1414. [Google Scholar] [CrossRef]
  77. Helin, A.; Sietiö, O.-M.; Heinonsalo, J.; Bäck, J.; Riekkola, M.-L.; Parshintsev, J. Characterization of free amino acids, bacteria and fungi in size-segregated atmospheric aerosols in boreal forest: Seasonal patterns, abundances and size distributions. Atmos. Chem. Phys. 2017, 17, 13089–13101. [Google Scholar] [CrossRef]
  78. Orué, M.R.; Gaiero, D.; Kirschbaum, A. Seasonal characteristics of the chemical composition of rainwaters from Salta city, NW Argentina. Environ. Earth Sci. 2019, 78, 16. [Google Scholar] [CrossRef]
  79. Khan, I.; Brimblecombe, P.; Clegg, S.L. Solubilities of pyruvic acid and the lower (C1-C6) carboxylic acids. Experimental determination of equilibrium vapour pressures above pure aqueous and salt solutions. J. Atmos. Chem. 1995, 22, 285–302. [Google Scholar] [CrossRef]
  80. Calvert, J.G.; Lazrus, A.L.; Kok, G.L.; Heikes, B.G.; Walega, J.G.; Lind, J.A.; Cantrell, C.A. Chemical mechanisms of acid generation in the troposphere. Nature 1985, 317, 27–35. [Google Scholar] [CrossRef]
  81. Marion, A.; Brigante, M.; Mailhot, G. A new source of ammonia and carboxylic acids in cloud water: The first evidence of photochemical process involving an iron-amino acid complex. Atmos. Environ. 2018, 195, 179–186. [Google Scholar] [CrossRef]
  82. Ervens, B.; Wang, Y.; Eagar, J.; Leaitch, W.R.; Macdonald, A.M.; Valsaraj, K.T.; Herckes, P. Dissolved organic carbon (DOC) and select aldehydes in cloud and fog water: The role of the aqueous phase in impacting trace gas budgets. Atmos. Chem. Phys. 2013, 13, 5117–5135. [Google Scholar] [CrossRef]
  83. Chen, G.; Hanukovich, S.; Chebeir, M.; Christopher, P.; Liu, H. Nitrate Removal via a Formate Radical-Induced Photochemical Process. Environ. Sci. Technol. 2018, 53, 316–324. [Google Scholar] [CrossRef] [PubMed]
  84. Hartmann, W.; Andreae, M.; Helas, G. Measurements of organic acids over central Germany. Atmos. Environ. 1989, 23, 1531–1533. [Google Scholar] [CrossRef]
  85. Meng, Y.; Zhao, Y.; Li, R.; Li, J.; Cui, L.; Kong, L.; Fu, H. Characterization of inorganic ions in rainwater in the megacity of Shanghai: Spatiotemporal variations and source apportionment. Atmos. Res. 2019, 222, 12–24. [Google Scholar] [CrossRef]
  86. Khare, P.; Satsangi, G.; Kumar, N.; Kumari, K.M.; Srivastava, S. HCHO, HCOOH and CH3COOH in air and rain water at a rural tropical site in North Central India. Atmos. Environ. 1997, 31, 3867–3875. [Google Scholar] [CrossRef]
  87. Li, Z.; Walters, W.W.; Hastings, M.G.; Zhang, Y.; Song, L.; Liu, D.; Zhang, W.; Pan, Y.; Fu, P.; Fang, Y. Nitrate Isotopic Composition in Precipitation at a Chinese Megacity: Seasonal Variations, Atmospheric Processes, and Implications for Sources. Earth Space Sci. 2019, 6, 2200–2213. [Google Scholar] [CrossRef]
  88. Hu, G.; Balasubramanian, R.; Wu, C. Chemical characterization of rainwater at Singapore. Chemosphere 2003, 51, 747–755. [Google Scholar] [CrossRef]
  89. Lee, S.; Liu, W.; Wang, Y.; Russell, A.G.; Edgerton, E.S. Source apportionment of PM2.5: Comparing PMF and CMB results for four ambient monitoring sites in the southeastern United States. Atmos. Environ. 2008, 42, 4126–4137. [Google Scholar] [CrossRef]
  90. Scalabrin, E.; Zangrando, R.; Barbaro, E.; Kehrwald, N.M.; Gabrieli, J.; Barbante, C.; Gambaro, A. Amino acids in Arctic aerosols. Atmos. Chem. Phys. 2012, 12, 10453–10463. [Google Scholar] [CrossRef]
  91. Bates, T.S.; Lamb, B.K.; Guenther, A.; Dignon, J.; Stoiber, R.E. Sulfur emissions to the atmosphere from natural sourees. J. Atmos. Chem. 1992, 14, 315–337. [Google Scholar] [CrossRef] [Green Version]
  92. Kerminen, V.-M.; Aurela, M.; Hillamo, R.E.; Virkkula, A. Formation of particulate MSA: Deductions from size distribution measurements in the Finnish Arctic. Tellus B Chem. Phys. Meteorol. 1997, 49, 159–171. [Google Scholar] [CrossRef]
  93. Pui, D.Y.; Chen, S.-C.; Zuo, Z. PM 2.5 in China: Measurements, sources, visibility and health effects, and mitigation. Particuology 2014, 13, 1–26. [Google Scholar] [CrossRef]
  94. Cottrell, B.A.; Gonsior, M.; Isabelle, L.M.; Luo, W.; Perraud, V.; McIntire, T.M.; Pankow, J.F.; Schmitt-Kopplin, P.; Cooper, W.J.; Simpson, A.J. A regional study of the seasonal variation in the molecular composition of rainwater. Atmos. Environ. 2013, 77, 588–597. [Google Scholar] [CrossRef]
  95. Kumar, N.; Kulshrestha, U.C.; Saxena, A.; Khare, P.; Kumari, K.M.; Srivastava, S.S. Formate and acetate levels compared in monsoon and winter rainwater at Dayalbagh, Agra (India). J. Atmos. Chem. 1996, 23, 81–87. [Google Scholar] [CrossRef]
  96. Liu, Y.; Yan, C.; Ding, X.; Wang, X.; Fu, Q.; Zhao, Q.; Zhang, Y.; Duan, Y.; Qiu, X.; Zheng, M. Sources and spatial distribution of particulate polycyclic aromatic hydrocarbons in Shanghai, China. Sci. Total Environ. 2017, 584/585, 307–317. [Google Scholar] [CrossRef] [PubMed]
  97. Clements, N.; Eav, J.; Xie, M.; Hannigan, M.P.; Miller, S.L.; Navidi, W.; Peel, J.L.; Schauer, J.J.; Shafer, M.M.; Milford, J.B. Concentrations and source insights for trace elements in fine and coarse particulate matter. Atmos. Environ. 2014, 89, 373–381. [Google Scholar] [CrossRef]
  98. Amato, F.; Viana, M.; Richard, A.; Furger, M.; Prévôt, A.S.H.; Nava, S.; Lucarelli, F.; Bukowiecki, N.; Alastuey, A.; Reche, C.; et al. Size and time-resolved roadside enrichment of atmospheric particulate pollutants. Atmos. Chem. Phys. 2011, 11, 2917–2931. [Google Scholar] [CrossRef]
  99. Corrigendum on Seasonal and Spatial Coarse Particle Elemental Concentrations in the Los Angeles Area. Aerosol Sci. Technol. 2011, 45, 1528–1529. [CrossRef]
  100. Weber, R.J.; Sullivan, A.P.; Peltier, R.E.; Russell, A.; Yan, B.; Zheng, M.; De Gouw, J.; Warneke, C.; Brock, C.; Holloway, J.S.; et al. A study of secondary organic aerosol formation in the anthropogenic-influenced southeastern United States. J. Geophys. Res. 2007, 112, D13302. [Google Scholar] [CrossRef]
  101. Boone, E.J.; Laskin, A.; Laskin, J.; Wirth, C.; Shepson, P.B.; Stirm, B.H.; Pratt, K.A. Aqueous Processing of Atmospheric Organic Particles in Cloud Water Collected via Aircraft Sampling. Environ. Sci. Technol. 2015, 49, 8523–8530. [Google Scholar] [CrossRef]
  102. Avery, G.; Tang, Y.; Kieber, R.J.; Willey, J.D. Impact of recent urbanization on formic and acetic acid concentrations in coastal North Carolina rainwater. Atmos. Environ. 2001, 35, 3353–3359. [Google Scholar] [CrossRef]
  103. Huang, X.-F.; Li, X.; He, L.-Y.; Feng, N.; Hu, M.; Niu, Y.-W.; Zeng, L.-W. 5-Year study of rainwater chemistry in a coastal mega-city in South China. Atmos. Res. 2010, 97, 185–193. [Google Scholar] [CrossRef]
  104. Ye, S.; Yusen, D.; Qing, L. The Trend of Acidity and Ion Compositions of Precipitation During 2000–2019 in Shanghai. Environ. Chem. 2021, 40, 3672–3680. [Google Scholar] [CrossRef]
  105. Monteith, D.T.; Stoddard, J.; Evans, C.; de Wit, H.A.; Forsius, M.; Høgåsen, T.; Wilander, A.; Skjelkvåle, B.L.; Jeffries, D.S.; Vuorenmaa, J.; et al. Dissolved organic carbon trends resulting from changes in atmospheric deposition chemistry. Nature 2007, 450, 537–540. [Google Scholar] [CrossRef]
  106. Chapman, P.J.; Clark, J.M.; Reynolds, B.; Adamson, J.K. The influence of organic acids in relation to acid deposition in controlling the acidity of soil and stream waters on a seasonal basis. Environ. Pollut. 2008, 151, 110–120. [Google Scholar] [CrossRef]
  107. Wu, J.; Liang, G.; Hui, D.; Deng, Q.; Xiong, X.; Qiu, Q.; Liu, J.; Chu, G.; Zhou, G.; Zhang, D. Prolonged acid rain facilitates soil organic carbon accumulation in a mature forest in Southern China. Sci. Total Environ. 2016, 544, 94–102. [Google Scholar] [CrossRef]
  108. Müller, A.; Miyazaki, Y.; Tachibana, E.; Kawamura, K.; Hiura, T. Evidence of a Reduction in Cloud Condensation Nuclei Activity of Water-Soluble Aerosols Caused by Biogenic Emissions in a Cool-Temperate Forest. Sci. Rep. 2017, 7, 8452. [Google Scholar] [CrossRef]
  109. Brown, S.G.; Eberly, S.; Paatero, P.; Norris, G.A. Methods for Estimating Uncertainty in Pmf Solutions: Examples with Ambient Air and Water Quality Data and Guidance on Reporting PMF Results. Sci. Total Environ. 2015, 518, 626–635. [Google Scholar] [CrossRef]
  110. Wang, Q.; Zhuang, G.; Huang, K.; Liu, T.; Deng, C.; Xu, J.; Lin, Y.; Guo, Z.; Chen, Y.; Fu, Q.; et al. Probing the Severe Haze Pollution in Three Typical Regions of China: Characteristics, Sources and Regional Impacts. Atmos. Environ. 2015, 120, 76–88. [Google Scholar] [CrossRef]
  111. Dentener, F.J.; Crutzen, P.J. A Three-Dimensional Model of the Global Ammonia Cycle. J. Atmos. Chem. 1994, 19, 331–369. [Google Scholar] [CrossRef]
  112. Li, Y.C.; Zhang, M.; Shu, M.; Ho, S.S.H.; Liu, Z.F.; Wang, X.X.; Zhao, X.Q. Chemical Characteristics of Rainwater in Sichuan Basin, a Case Study of Ya’an. Environ. Sci. Pollut. Res. 2016, 23, 13088–13099. [Google Scholar] [CrossRef] [PubMed]
Figure 2. The change patterns of water-soluble ions in rainfall event with rainfall intensity and rainfall in Shanghai: (a) pH and EC, (b) Na+ and Cl, (c) K+, Mg2+, and Ca2+, (d) acetic, formic, MSA, glutaric, succinic, and oxalic acid, (e) NO2, NO3, SO42−, NH4+, and F.
Atmosphere 13 01502 g002
Figure 3. The changes in concentrations of (a) Ca2+, (b) NH4+, (c) SO42−, (d) formic acid, (e) acetic acid, and (f) oxalic acid with accumulated rainfall. The ion concentrations were divided into four percentiles to observe the ion concentrations in each concentration interval (0–30%, 30–50%, 50–70%, 70–90%).
Atmosphere 13 01502 g003
Figure 4. Seasonal variations of (a) water-soluble inorganic ions and (b) organic acids in rainfall events.
Atmosphere 13 01502 g004
Figure 6. The [F/A]M judgment equation curve and [F/A]M of rainfall events for Spring, Summer, Autumn, and Winter. The proportion [F/A]M > 1 in each season is represented in pie charts.
Atmosphere 13 01502 g006
Figure 7. The percentages and concentrations of species in rainfall events in the six factors identified by PMF are illustrated. Total organic acids are represented by TOA, total ion concentrations are represented by TIC. The bar graphs corresponded to the left ordinate (percentage of component), and the grey points corresponded to the right ordinate (concentration of component). Six factors at this site were identified: (a) marine sources, (b) vehicle exhaust and secondary emission sources, (c) secondary sulfate sources, (d) biological emission sources, (e) biomass combustion sources, and (f) dust sources.
Atmosphere 13 01502 g007
Figure 9. Illustrations of the percentage of factor contributions to organic acids in (a) cloud water and (b) early sequences of rainfall events.
Atmosphere 13 01502 g009
Table 1. VWM concentrations (μeq L−1) of major organic acids, corresponding contributions of organic acids to the acidity in rainwater in different representative regions.
LocationFormicAceticOxalicOA/TFA (%)TimeReference
Shanghai, China13.548.325.8517.82020–2021This study
Lin’an, China10.213.892.0117.72014–2015[30]
Xiamen, China4.621.840.44<22012–2013[59]
Mt. Lu, China4.1211.205.0712.32011–2012[15]
Mt. Heng, China14.3016.463.3116.82009[61]
Mt. Mangdang, China7.909.903.6018.4March–April 2009[58]
Anshun, China4.956.932.8458.12007–2008[27]
Shangzhong, China2.261.352.312.92006–2007[65]
Shenzhen, South China1.340.051.150.42005–2009[21]
Beijing, China5.604.601.17/2003[60]
Wilmington, NC, USA26.902.60/31.62008[66]
Amersfoort, South Africa7.506.10/10.01986–1999[25]
Los Angeles12.44.10/27.41985–1991[31]
Northwest Spain/9.503.00/1996–1997[67]
São Paulo State, Brazil7.805.002.4039.82003–2007[68]
Publisher’s Note: MDPI stays neutral with regard to jurisdictional claims in published maps and institutional affiliations.

