Abstract
Building on previous studies of western North Pacific formation and intensity predictions along the ECMWF ensemble medium-range track forecasts, the first objective of this transition to the eastern North Pacific was to provide earlier forecasts of the Time-to-Formation (T2F) and Time-to-Hurricane (T2H) than are available from the National Hurricane Center Advisories. For the first six hurricanes of the 2021 season, the first detections in the ECMWF ensemble were 8 days to 12 days in advance of the T2F times and 9 days to 13 days in advance of the T2H times. The major advance in this study has been to document that the ECMWF ensemble is also capable of predicting Ending-T2H and Ending-T2F timings and positions along those 15-day ECMWF ensemble track forecasts. This study for the first time documents the opportunity for high wind warnings during the entire lifecycle of the 2021 season hurricanes even days in advance of formation. Validations of the pre-hurricane and Ending-hurricane tracks and timings are provided for the lifecycles of seven hurricanes and the “Almost-Hurricane Guillermo”. Because the technique has been accepted for operational testing at the Joint Typhoon Warning Center, a companion article has been submitted that will describe the flowchart methodology for evaluating the twice-daily ECMWF ensemble forecasts to select the most likely pre-hurricane circulation as early as possible while non-selecting the likely false alarm circulations.
1. Introduction
1.1. Background on Previous Studies
The purpose of this article is to describe the extension to the eastern North Pacific of the Elsberry et al. (2020) [1] global model ensemble forecasts of western North Pacific tropical cyclone (TC) formation and intensity predictions along medium-range track forecasts that typically begin 5 days in advance of the formation. In this article, the Marchok (2002, 2020) [2,3] vortex tracker outputs from the European Centre for Medium-range Weather Forecasts ensemble prediction system (ECEPS) will again be utilized to provide Time-to-Formation (T2F of 25 kt or 35 kt) timing and positions along the weighted-mean vector-motion (WMVM) track forecasts of up to 15 days. It is important to note that in the WMVM calculation, the largest (smallest) weight is given to the ensemble member motion vector that is closest to (farthest from) the most recent 12-h WMVM vector. The T2F(25 kt) timing is defined to be the weighted-mean (same weighting factors as for the track) intensities of the various ensemble members that exceed the 25 kt threshold (>22.5 kt for the ECEPS). For the T2F(35 kt, hereafter just 35) timing, two genesis parameters from the Hart (2003) [4] Cyclone Phase Space (CPS) are utilized to calculate the weighted-mean (same weighting factors as for track forecast) Warm Core Magnitude (WCM) along the WMVM track forecast: (i) CPS Lower-layer warm core and (ii) Upper-layer warm core, which are positive (negative) for a warm-core TC (cold-core extratropical cyclone). As in Elsberry et al. [1], the Upper-layer (600-300 mb) warm core is weighted two times the Lower-layer (900-600 mb) in the WCM calculation to reflect the 1/p factor in the hypsometric equation. The basic hypothesis is that the T2F(35) can be inferred when the ECEPS-predicted WCM evolution of the pre-TC circulation begins to increase and passes some positive threshold corresponding to an intensity of 35 kt.
Elsberry et al. [1] used examples of pre-TC circulations in the western North Pacific during the latter half of the 2019 season to calibrate the weighted-mean WCM thresholds that are associated with the T2F(35) for both the ECEPS and the National Centers for Environmental Predictions ensemble (GEFS). Elsberry et al. [1] provided detailed validations for Typhoons Lingling and Bualoi (and one hurricane in the eastern North Pacific and one hurricane in the Atlantic). The T2F(35) timing and position errors were often smaller and more consistent than the T2F(25 kt) timing and position errors. The likely explanation for the more erratic T2F(25 kt) timing errors is that the initial intensities of the pre-TC circulations in the ECEPS and (especially) the GEFS were often already 25 kt.
Tsai et al. (2020) [5] demonstrated how the ECEPS and the GEFS could have provided early (10 days in advance) warnings of the threat of Typhoon Lekima (2019), which made landfall on the densely populated East China coast with high winds and heavy rainfall. Tsai et al. [5] provide a detailed description of the ECEPS forecast from 12 UTC 28 July that predicted that the pre-Lekima circulation would begin at the model forecast time Tau =138 h near the correct position, and it would make landfall near Zhejiang after 9–10 days. The weighted-mean of the intensities of the ensemble members first exceeded 25 kt just six hours early compared to the verifying T2F(25 kt). Furthermore, the weighted-mean WCM along the WMVM track forecast perfectly predicted the verifying T2F(35) timing. In addition, the maximum WCM value indicated that the pre-Lekima circulation would later become at least a typhoon. Tsai et al. [5] provided detailed validations of five other early ECEPS track forecasts and the associated T2F(25 kt) and T2F(35) predictions. Although Lekima is just one typhoon case, it is an excellent example of the opportunity to issue earlier warnings of a landfalling typhoon based on the ECEPS forecasts.
Elsberry et al. [1] also documented that the maximum positive WCM for ECEPS forecasts could be utilized to distinguish the Likely Storm Category: Maximum WCM < 25.0 for Tropical Depression; 25.0 ≤ WCM < 46.0 for Tropical Storm; and WCM ≥ 46.0 for Typhoon. Elsberry et al. (2021) [6] provided additional examples from the second half of the 2019 western North Pacific season that the T2F(35) timing could be accurately estimated from the ECEPS-predicted weighted-mean WCM evolution. When the environmental conditions over the western North Pacific are favorable for TC formation, a rapid intensification (RI; 30 kt increase in intensity in 24 h) event will frequently follow formation [6]. In almost all of the 2019 season RI events examined, the ECEPS-predicted weighted-mean WCM evolution indicated the WCM threshold for a Likely Storm Category of “Typhoon”. Because an RI event lasting longer than 24 h is well-known to contribute to the most intense typhoons, the time differences between the WCM thresholds for a hurricane and for a tropical storm will also be examined in this study for the eastern North Pacific during the 2021 season.
A special emphasis required for TCs in the eastern and central North Pacific is the ending storm stage. For the western North Pacific, Elsberry et al. [1] dealt with three ending-storm situations: (i) landfall on the East Asia coast, or adjacent islands, and the WMVM track forecast is critical to achieve the best-possible estimate of the landfall position and timing; (ii) extratropical transition of a TC along a recurving WMVM track forecast, which Elsberry et al. [1] defined as the time the weighted-mean WCM changes from positive (warm-core TC) to negative (cold-core extratropical cyclone); and (iii) decay of a TC over open ocean, which in the western North Pacific typically occurs when the TC translates into a region of large vertical wind shear, which is revealed as the weighted-mean WCM decreases as the Upper-layer warm core is sheared off of the low-level center.
Landfall along the west coast of Mexico is also an important ending-storm stage for eastern North Pacific TCs, and again, the WMVM track forecast is a critical factor in predicting the landfall timing and position. Extratropical transition of eastern North Pacific TCs is relatively rare compared to the western North Pacific where large-amplitude midlatitude troughs more frequently extend into the tropics and interact with the TCs. The more common reason for an eastern North Pacific TC to decay over the open ocean is that they move poleward and cross a sea-surface temperature (SST) gradient region extending west–southwest from the southern tip of Baja California. As the TC moves over the colder water, the deep convection near the TC center is lost, and the Upper-layer warm core decays, which is then reflected as a rapid decay in the weighted-mean WCM. The WMVM track forecast relative to that SST gradient is the most important factor in these cases of eastern North Pacific TCs decaying over open ocean. A critical threat factor for the civilian population and the many Department of Defense facilities in the Hawaiian Islands is whether the TC will cross 140 °W south of the western extension of that SST gradient region. Because of the extensive disaster preparedness activities for both the civilian population and military agencies that will be triggered when a TC is predicted to cross 140 °W, it would be very beneficial to have the earliest possible prediction of the formation of a TC with such a track.
Although the primary focus of Elsberry et al. [1] was on western North Pacific TCs, they also provided the ECEPS forecast from 00 UTC 8 September 2019 when the WMVM track forecast indicated that the pre-Hurricane Kiko circulation would subsequently pass into the Central Pacific (cross 140 °W) and approach the Hawaiian Islands on Day 15. The track spread about the WMVM track forecast was quite small until Kiko was forecast to pass 130 °W. The ECEPS weighted-mean WCM evolution precisely predicted the verifying T2F(35) time of 00 UTC 13 September (Day 5.0), and the maximum positive WCM value of 43.7 indicated a Likely Storm Category of Hurricane. Such a large WCM value continued to be predicted by the ECEPS until 00 UTC 18 September (Day 10.0), which will here be referred to as the ending-Hurricane time. While the corresponding GEFS forecast started quite near the ECEPS starting position, the GEFS had a more poleward track that ended near 25 °N, 130 °W (i.e., would not cross 140 °W) on Day 13.5 [1]. However, the GEFS-predicted WCM evolution indicated a T2F(35) at 06 UTC 13 September, which is only 12 h late. Furthermore, the GEFS WCM evolution even more strongly indicated that the pre-Kiko circulation would likely become a hurricane. Even though the GEFS-predicted track had large errors at later times, the WCM evolution would have provided early forecasts of the T2F(35) for the pre-Kiko circulation [1].
1.2. NHC First Advisories of T2F and T2H for the 2021 Hurricanes
The National Hurricane Center (NHC) in Miami, Florida is the warning center that is officially responsible for TC warnings in the eastern North Pacific east of 140 °W. The timing (MMDDHH) and initial intensity of the first advisory for the eight hurricanes during the 2021 eastern North Pacific season are provided in column 2 of Table 1. For the first three of these Hurricanes, the initial intensity in the advisories was 35 kt or 40 kt, which means that these disturbances were already tropical storms at the time of the first advisory. The T2H timings for these first three hurricanes are given in column 5 of Table 1, and the number of hours between this T2H and the T2F(35) timing (recall this is also the advisory 1 timing) is provided in column 6. The fact that there were no official warnings issued in advance of these three already tropical storms, and then there were only an additional 24–27 h to the “Hurricane” stage, is an illustration of the strong need for a guidance product that provides earlier T2F(35) and T2H timings and positions.

Table 1.
National Hurricane Center advisories for pre-Hurricanes during the eastern North Pacific 2021 season.
For the last five hurricanes in Table 1, the initial intensities in the first advisories were always 30 kt (column 2), and the T2F(35) timings were only 6–18 h after the first advisories (column 4). Then, adding the (T2H-T2F(35)) time differences in column 6, the T2H timings in the NHC advisories of these five hurricanes ranged from only 24 h (Rick) to 60 h (Nora) after the first advisory (i.e., advisories 5 to 11, respectively). As will be shown later, these eastern North Pacific hurricanes tend to form in a relatively small region offshore of the west coast of Mexico, and most do not make landfall. Nevertheless, maritime interests plus the economies and populations that are affected by those landfalling TCs would really benefit from earlier warnings of eastern North Pacific hurricane development.
1.3. Objectives of this Study
The first objective is to document the capability of the 15-day ECEPS forecasts to provide much earlier guidance in the eastern North Pacific than the NHC advisories for the T2F(35) and T2H timing and positions along the WMVM tracks. The ECEPS-predicted weighted-mean WCM evolutions will be evaluated for the T2F(35) and the T2H timings and positions during the pre-formation stage as in Elsberry et al. [1], and we will also evaluate the ending stage T2H and T2F(35) timings and positions for seven hurricanes during the 2021 season. How the prior western North Pacific version was transitioned to the eastern North Pacific will be illustrated in Section 2 utilizing the ECEPS forecasts of pre-Hurricane Linda that later threatened the Hawaiian Islands. Evaluations of the ECEPS forecasts for the pre-formation and the ending stage for six other hurricanes will be given in Section 3. A special case of strong TS Guillermo that might have almost become a hurricane will also be evaluated. A brief discussion will be given of the major challenge to deal with false alarm disturbances that originate in the Caribbean Sea along the north coast of South America and propagate westward to serve as initial conditions for TC formation in the eastern North Pacific. A summary and discussion will be provided in Section 4.
2. Example of ECEPS Guidance Product for Pre-Hurricane Linda (2021)
2.1. NHC Advisories for Pre-Linda
Hurricane Linda was of high interest because it eventually passed over the Hawaiian Islands (Figure 1). As was indicated in Table 1, the intensity was already at 30 kt in the first NHC advisory, and then, it was 35 kt (i.e., T2F) just 12 h later, and it was declared a hurricane after another 42 h (synoptic times are utilized in Figure 1). Each NHC advisory includes a five-day track and intensity forecast, from which the NHC forecast of the T2F(35) and the T2H (65 kt) timings and positions can be extracted (columns 2–3 and 4–5, respectively). The T2F(35) timing errors (column 2, Figure 1) for Advisories 1 and 2 are quite small at Early 6 h and Late 6 h, respectively, as might be expected when the T2F(35) is only 12 h after the first advisory. While the Advisory 1 T2F(35) position forecast error (column 3) was 1.2 degrees latitude to the south and 1.2 degrees longitude to the east, for Advisory 2, these T2F(35) position errors are only 0.2 degrees latitude to the south and 0.4 degrees longitude to the west.
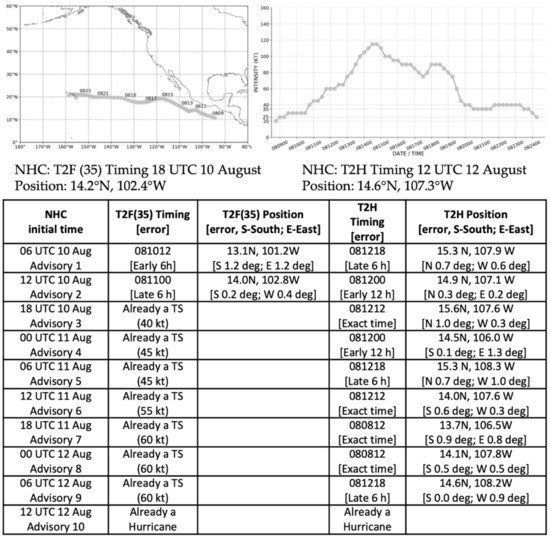
Figure 1.
National Hurricane Center (NHC) Working Best Track (WBT) track and intensities are provided at top to assist in evaluating the NHC forecasts of the T2F(35) and the T2H timing and positions during pre-Linda extracted from the NHC advisories, which are typically each 6 h unless a Special Advisory is issued. Timing errors and position errors relative to the verifying T2F(35) and T2H values at the top of the table are provided within the brackets on the line below the forecasts.
The initial intensities from which Tropical Storm Linda intensified to a hurricane during Advisories 3-10 are listed in column 2. The NHC forecasts of the T2H in those advisories are very accurate with most of them the exact times. Similarly, the position errors of those NHC forecasts of the T2H are quite small (column 5), especially when the initial intensities in Advisories 6–9 are 55 to 60 kt. In summary, the NHC forecasts of the T2F(35) and T2H in their advisories for pre-Hurricane Linda can be quite accurate when NHC waits until the initial intensity is already 30 kt in the first advisory. The first objective of this study is to utilize the ECEPS forecasts to provide earlier guidance of the T2F(35) and the T2H timing and positions.
2.2. Original Format ECEPS Validation Summary
A validation summary table for the ECEPS forecasts of pre-Linda is presented in Figure 2 in the original format of Elsberry et al. [1] to illustrate the objectively provided guidance from the Marchok [2,3] vortex tracker files (each row is the summary for that 12-hourly ECEPS forecast). First, note that in column 1, the first ECEPS forecast was from 00 UTC 4 August, which is 6.25 days prior to the first NHC Advisory in Figure 1. The information in row 1, columns 2–7 includes the storm number, maximum number of ensemble members, and the starting time and position in the ECEPS forecast, which is useful guidance to the analyst/forecaster in assessing how much confidence should be given to such an early forecast. Looking down columns 2 and 4, more confidence can be given as the storm number decreases, and especially when the maximum number of ensemble members contributing to the WMVM track forecast approaches all 51 members. As mentioned in Section 1, there is often large variability in the storm starting positions, and this large variability in both starting latitude (column 6) and longitude (column 7) positions for these first three pre-Linda forecasts is a good example. Clearly, a forecaster may label these three forecasts as ones “to watch” when the storm was not forecast to exist (i.e., meeting the Marchok vortex tracker criteria for a TC) during the first 4–5 days of these three ECEPS forecasts (column 5), and there is a large uncertainty in that starting position. However, this is also an example in which close coordination between the forecaster and the satellite analyst could result in a more confident starting position. The listing of maximum WCM values in column 8, and thus the Likely Storm Category in column 9, provides the forecaster guidance as to the threat, and even from the first ECEPS forecast in Figure 2, the pre-Linda circulation was expected to become a hurricane.
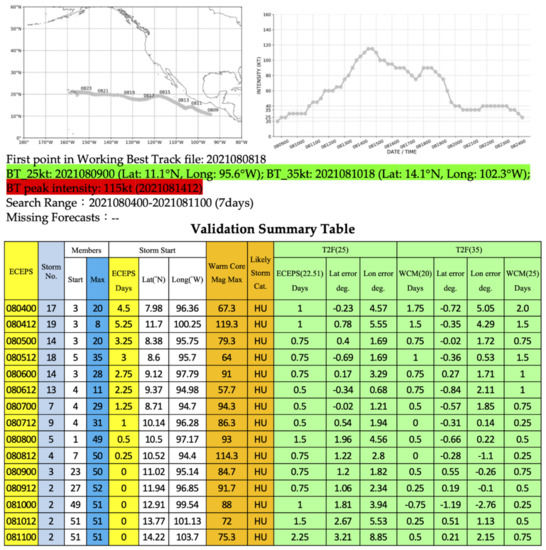
Figure 2.
Hurricane Linda track and intensity plots with a validation summary table similar to Figure 1, except for the ECEPS pre-Linda forecasts and here in the original format of Elsberry et al. [1] to illustrate the information that is objectively derived from each forecast to assist the forecaster in evaluating and summarizing in time the guidance.
Whereas the maximum WCM values in all of these ECEPS forecasts for pre-Linda surpassed the WCM > 37 threshold for a hurricane in the eastern North Pacific, there is considerable variability in those maximum WCM values in the first three forecasts that the forecaster should consider whether to issue such an early alert for pre-Linda. Note that ECMWF does not include a bogus vortex in its initialization procedure, which may account for some of this variability in the predicted maximum WCM values. Nevertheless, the objective of this study is to provide first the T2F(35) timing and position along the WMVM track forecast, and then both the pre-Linda and ending-Linda T2H timings and positions from the ECEPS-predicted WCM evolution.
In this original validation summary format of Elsberry et al. [1], the T2F(25 kt) based on the weighted-mean ECEPS vortex intensities of the ensemble storm members was provided in columns 10–12 as well as the WCM-based T2F(35) that is the focus in this study. Note that the pre-Linda T2F(25 kt) errors in column 10 are almost all less than 1.0 days. Furthermore, the T2F(25 kt) latitude errors in column 11 for this westward-moving pre-Linda track are also mostly small. However, the T2F(25 kt) longitude (i.e., along-track) errors are much larger than the latitude errors. These large along-track errors may also be related to the absence of some bogus vortex initialization procedure for the ECEPS, which would have adjusted the initial vortex positions toward updated satellite fix positions. Another change from the original validation summary format of Elsberry et al. [1] in Figure 2 is in the specification of the WCM = 20 threshold for the T2F(35) timing and position in columns 13–15, which was based only on the Hurricane Kiko evaluation. Based on the evaluations of the ECEPS forecasts for the eight hurricanes in the eastern North Pacific during 2021, an alternate WCM = 25 threshold for the T2F(35) and WCM = 37 for the T2H were adopted. For this pre-Linda case in which the intensity increased rapidly from 30 kt, the T2F(35) timings with the WCM = 25 threshold (column 16) were identical to the timings with the WCM = 20 threshold (column 13). While the smaller WCM = 20 threshold (earlier achievement of T2H (35 kt)) timing and associated position was retained in this study for some slower-developing tropical storms, the larger WCM = 25 threshold for the T2F(35) was generally adopted for the 2021 season summary.
2.3. New Format ECEPS Validation Summary for Pre-Formation Linda
In addition to the changes in the original format of the validation summary, the major change is to include the WCM-based T2H timing and position errors of the ECEPS in comparison with the NHC forecasts of T2F(35) and T2H included in the NHC advisories (Table 2). Thus, the new-format validation summary for the ECEPS forecasts of pre-Linda is given in Table 2. Note that two earlier ECEPS forecasts have been added so that the first forecast from 00 UTC 3 August provides a T2F(35) 7.75 days in advance (in comparison with 12 h in advance for the NHC Advisory 1). As indicated in column 2 of Table 2, that first ECEPS forecast of T2F(35) verifies 60 h late, and not surprisingly, it therefore verifies 9.6 degrees to the west (column 3). Scanning further down in column 2, the late T2F(35) timing errors decrease to 24 h for the 6 August forecasts, and then, they decrease to between 6 and 12 h late on 10 August when the NHC advisories begin. Consequently, the westward bias in the ECEPS-predicted T2F(35) positions (column 3) becomes smaller in time, but is still ≈3 degrees longitude for the 6 August forecasts. This westward bias then decreases to less than 1 degree for the 8–9 August forecasts, but the bias strangely increases to more than 1 degree for the 10 August forecasts. While a general expectation with ensemble track forecasts is a slow along-track bias, these larger position biases on 10 August are likely a contribution from less accurate initial positions due to an absence of a bogus vortex procedure for the ECEPS. By 10 August, the NHC forecast had much smaller six-hour and 12 h T2F(35) position errors (Figure 1, column 3), which means the NHC forecaster had to have more accurate initial positions than in the ECEPS forecasts on 10 August.
Table 2.
ECEPS Timing and Position Predictions of T2F(35) and T2H during pre-Linda.
The major result in Table 2 is the accuracy of the T2H timing forecasts in column 4. Even though the first ECEPS forecast from 00 UTC 3 August had a 48-h late timing error, those late timing errors decreased to zero for the 00 UTC 5 August forecast. For the remainder of the forecasts until Linda became a hurricane at 12 UTC 12 August, the T2H timing errors were early, and nearly all of the errors were less than 24 h. It is noteworthy that the relatively coarse grid resolution ECEPS-predicted WCM evolution could so accurately indicate the timing of the intensification of Linda to a hurricane, which is so important for warnings of maritime activities in that region. From a science perspective, such an accurate T2H forecast in an ensemble prediction system implies that the environment was a more dominant factor than internal processes (which require high spatial resolution models) in that rapid intensification.
The large 8.5 degree longitude T2H position errors for the first ECEPS forecast in column 5 of Table 2 are likely related to the 60 h late T2F(35) position error of 9.6 degrees (column 3). However, the T2H longitude errors are remarkably decreased for the next three forecasts (rows 2–4). It is amazing that both the T2H latitude and longitude errors for pre-Linda are less than 0.8 degrees for the 00 UTC 5 August through 00 UTC 7 August ECEPS forecasts because these forecasts are 5–7 days in advance of Linda actually becoming a hurricane. Although the T2H longitudinal errors then switch to the east of the verifying position and become much larger for the next seven forecasts, latitudinal and longitudinal T2H errors (column 5) less than 0.6 degrees occur for the 00 UTC 11 August–00 UTC 12 August ECEPS forecasts, which is the same magnitude as the position errors for the NHC advisories (Figure 1, table column 5).
Although these are pre-formation ECEPS forecasts for just one storm (albeit a long-lasting, potentially high-impact) storm, it is noteworthy that at least the ECEPS from 00 UTC 5 August onward would have provided accurate predictions of the T2F(35) and the T2H timing and positions. Thus, at least five days in advance of the verifying T2F(35) and seven days in advance of the verifying T2H, the ECEPS provided as accurate guidance as was available in the NHC Advisory 1 that was only 12 h in advance of T2F(35). Such early ECEPS guidance could be beneficial for the safely of maritime activities in the eastern North Pacific, while the ECEPS WMVM track forecasts of an offshore path would avoid unnecessary disaster management preparations at nearby coastal locations.
2.4. ECEPS Validation Summary for Ending-Storm Linda
The hypothesis in this study is that if the ECEPS-predicted weighted-mean WCM evolution can be utilized to accurately estimate the pre-formation T2F(35) and T2H timing and positions along the WMVM track forecast, then the same WCM thresholds can be applied to provide useful estimates of the ending-storm T2H and T2F(35) timings and positions at the end of the WMVM track forecast. Since these are 15-day ECEPS forecasts, and the lifecycle of many eastern North Pacific TCs is less than 15 days, these ECEPS forecasts have the potential to be lifecycle forecasts. It is emphasized that the pre-formation forecasts are perhaps more than five days before the circulation becomes a tropical storm. Furthermore, the up to 15-day WMVM track forecasts provide guidance as to what regions may be threatened by (or may escape) a hurricane.
The ECEPS forecasts for the ending stage of Hurricane Linda are presented in Table 3, with the verifying ending T2H of 10 UTC 19 August near 13.7 °N, 136.4 °W and ending T2F(35) of 12 UTC 20 August near 20.2 °N, 143.3 °W according to the NHC advisories. Because the pre-formation ECEPS forecasts from 00 UTC 3 August through 00 UTC 5 August had ending-T2H and ending-T2F(35) times equal to the end of the 15-day forecast period (not shown), these early forecasts of pre-Linda, which did not become a tropical storm until 18 UTC 10 August (Table 1), have been omitted in Table 3. While it is useful to the forecaster/analyst to know that the ECEPS is forecasting a hurricane will likely exist at Day 15 along the WMVM track, the forecaster should not be misled that this is really the ending-T2H timing. Similarly, the forecaster/analyst should not be misled by the ending-T2F(35) timing if the ECEPS is also forecasting that a tropical storm will likely exist at Day 15.
Table 3.
ECEPS Timing and Position Predictions of T2F(35) and T2H during ending-Linda.
Beginning with the 00 UTC 7 August forecast and continuing until 00 UTC 12 August, the ending-T2H timing begins to be consistently around 00 UTC 19 August (column 2, Table 3), which corresponds to timing errors of around one day. Of course, the forecasters in Hawaii would not know in real time that these were forecasts with small ending-T2H timing errors (column 2) and with quite large ending-T2H position errors to the east (column 3). Note that these forecasts also had an ending-T2F(35) timings (column 4) that were about 24 h later than the ending-T2H timings, which was effectively predicting a rapid decay of 30 kt/24 h, and thus there was little threat of even damaging winds.
However, the ECEPS forecast at 12 UTC 12 August abruptly predicted the ending-T2H time would be much later (18 UTC 21 August), which is a Late 56 h error, and similar late T2H times would persist until the last available ECEPS forecast at 12 UTC 17 August. Consistent with these later ending-T2H times, the ending-T2H longitudes indicated that Hurricane Linda would not only cross 140 °W, the 00 UTC 13 August forecast actually predicted Linda would still be a hurricane at 150.6 °W (column 3) at an ending-T2H time of 06 UTC 22 August (column 2). Thus, this was a nine day in advance prediction that Linda could still be a hurricane as it approached Hawaii. As noted in the introduction, an alert of such a hurricane threat nine days in advance would be such a benefit for starting disaster preparedness activities. Note again that the ECEPS-predicted ending-T2F(column 4) minus ending-T2H (column 2) time differences from the 00 UTC 13 August through the 12 UTC 17 August forecasts were all smaller than or equal to 24 h, which indicates a rapid decay. Nevertheless, the threat of high winds in Hawaii could still exist even if the ending-T2H timing was earlier, as actually occurred.
2.5. Summary Lifecycle Diagram for Hurricane Linda
While it is instructive to see the detailed validation Table 2 and Table 3 to see forecast-to-forecast consistency in the pre-formation and ending-stage T2F(35) and T2H timings and positions, for this study, a summary diagram of the tracks and timing errors has been provided for the lifecycle of Hurricane Linda (Figure 3). The ECEPS pre-formation tracks until the T2H along that WMVM track forecast are shown in Figure 3b.
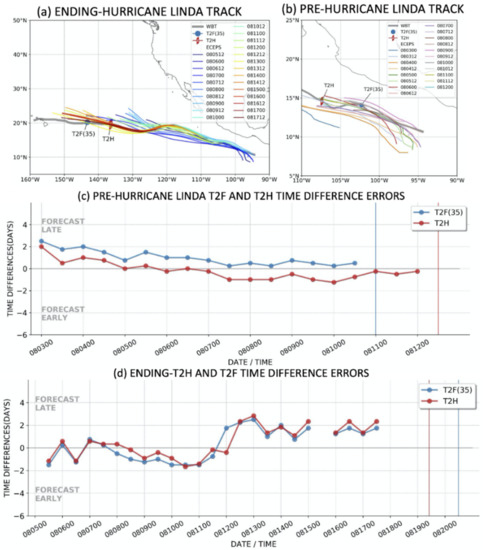
Figure 3.
Summary of the ECEPS pre-formation and ending-stage predictions of the Hurricane Linda (2021) lifecycle. Track forecast initial times (MMDDHH) are indicated in the insets for the (a) ending stage and (b) pre-formation stage, and the T2F(35) and T2H timing errors for the pre-formation and for the ending-stage are displayed in panels (c,d).
While the initial positions of these track forecasts have a considerable scatter, albeit initial positions that are for up to 8 days in advance of the T2F(35), that track spread decreases at the times of T2F(35) and T2H. The pre-formation forecast timing errors for the T2F(35) and the T2H are provided in Figure 3c. As was provided in columns 2 and 4 of Table 2, these pre-formation timing forecast errors start around two days late at 8 days in advance, but the T2F(35) timing forecast errors then become less than one day late, and the T2H timing errors become about one day early.
The ending stage of the Hurricane Linda lifecycle track forecasts are shown in Figure 3a. The earliest of these tracks that have predicted an ending T2H and ending T2F(35) begin around 6 August, which is two weeks in advance of that ending T2H. These earliest tracks predict well the first 10 days but miss the southward dip in the Linda track west of 120 °W, and thus, they propagate too far north over cold water and decay too early. The later forecasts correctly predict that southward track dip and have very accurate tracks until the ending T2F(35) near 150 °W. The ending-T2H and ending-T2F(35) timing forecast errors are provided in Figure 3d. The earlier forecasts tend to have ending-T2H and ending-T2F(35) timing errors that are 1–2 days early. As discussed earlier in Section 2.4, after 00 UTC 12 August, the later forecasts have ending-T2H and ending-T2F(35) timing errors that are 1–2 days late, and thus, they predicted that Hurricane Linda would have approached closer to Hawaii (Figure 3a) before decaying (i.e., a late timing error with a westward track would be too far west).
In conclusion, these ECEPS forecasts provide early and accurate guidance for not only the pre-Linda T2F(35) and T2H timings and positions, the ending-T2H and ending-T2F(35) timing and position guidance would have been beneficial. Essentially, these ECEPS pre-formation forecasts provide high wind-threat guidance throughout almost the entire lifecycle of Hurricane Linda.
3. ECEPS Products for Other Hurricanes
3.1. Validation of Pre-Hurricane Enrique (05E) Pre-Formation and Ending-Storm Guidance
As indicated in Table 1, Enrique was the first hurricane of the 2021 season in the eastern North Pacific following four Tropical Storms [7]. Actually, Enrique was already a tropical storm at the time of the first NHC Advisory at 09 UTC 25 June, so the time difference between the first advisory and the T2F(35) was 0 h (column 4, Table 1). Tropical Storm Enrique then rapidly intensified to a hurricane in 24 h (column 6, Table 1).
The Enrique track plot and intensity plots based on the NHC advisories are presented in Figure 4. Enrique was located near 14.9 °N, 101.2 °W at 06 UTC 25 June and had a typical track toward the west–northwest. The NHC forecast of the T2H in Advisory 1 was 00 UTC 27 June, which was late by 18 h (row 1, column 4, Figure 4). With such a late timing of a westward-moving storm, the T2H position error was 1.1 degree longitude to the west (column 5). However, the NHC forecasts of the T2H timing quickly improved with errors of only 6 h in Advisories 2 and 3 and an exact time in Advisory 4 (column 4). Consequently, the T2H position errors were very small (column 5) for Advisories 2–4. As noted for the pre-Hurricane Linda, the NHC forecasts in the advisories can be expected to be quite accurate when they waited until the initial Enrique intensity was already 35 kt in the first Advisory.
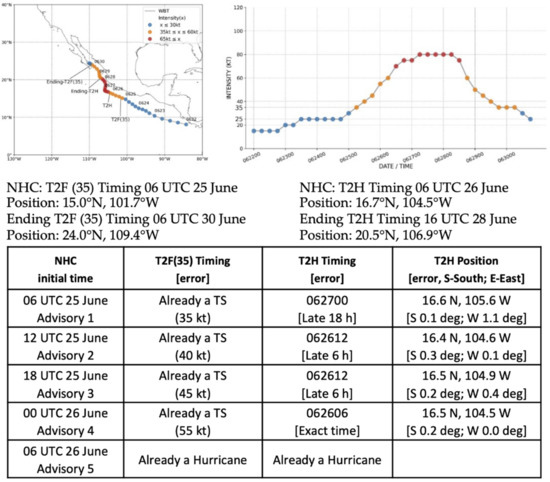
Figure 4.
Hurricane Linda track and intensity plots with a validation summary table similar to Figure 1 except for the ECEPS pre-Linda forecasts and here in the original format of Elsberry et al. [1] to illustrate the information that is objectively derived from each forecast to assist the forecaster in evaluating and summarizing in time the guidance.
A substantial challenge in the evaluation of the ECEPS forecasts for pre-Enrique was that there were always at least two long-lived track forecasts that might reasonably represent the actual pre-Enrique track. An example is the Storm 4 track forecast in Figure 5a from the 12 UTC 18 June ECEPS forecast. Note that the 18 UTC 22 June initial position (red dot) is on the west coast of Central America because the ensemble member tracks (gray lines) at the start of the WMVM track forecast within the small box have tracks that are along the coast or over land. About one half of the 16 ensemble member tracks that later make up the Storm 4 WMVM track forecast start outside the small box and have initial positions offshore with tracks parallel to the coast. Because this subset of ensemble member tracks is so far to the left of the WMVM track that was dominated by the early member tracks that started within the small box, that later track subset was given only a small weighting factor in the WMVM track calculation. However, the Storm 5 from that same 12 UTC 18 June ECEPS forecast (Figure 5b) has a WMVM track forecast that begins 00 UTC 23 June from four ensemble member tracks just outside the small box. Although Storm 5 has a track forecast that closely resembles that subset of ensemble member tracks in Storm 4 that also start outside the small box, that track subset had already joined the earlier Storm 4 and thus were not available to join Storm 5 and form a WMVM with perhaps eight more members. It was hypothesized that the earlier storms starting near the Central American coast, or even farther east, were related to pre-cursor tropical circulations that Elsberry et al. (2014) [8] had discovered originated over the southern Caribbean Sea. Because none of these circulations had developed into a tropical storm or hurricane in their Atlantic formation study, Elsberry et al. [8] labeled them Caribbean False Alarms (FAs). Further evidence that these Caribbean FA circulations crossing Central America become the pre-cursor circulations for eastern North Pacific Tropical Storms and Hurricanes is presented in Capalbo (2022) [9].
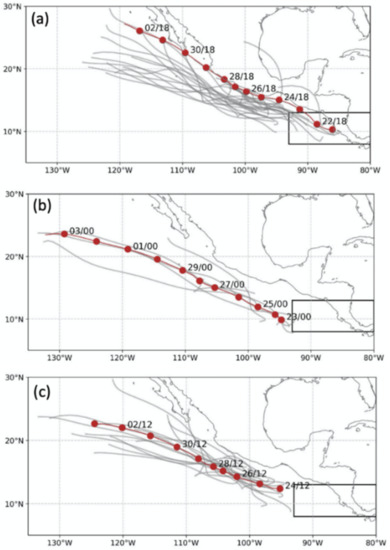
Figure 5.
ECEPS 12 UTC 18 June 2021 forecasts of ensemble member tracks (gray lines) and the Weighted Mean Vector Motion (WMVM) tracks (red lines with dots labeled DD/MM) at 48 h intervals) with old procedure (a) Storm 4 and (b) Storm 5, and with new procedure (c) Storm 17 in which all ensemble member tracks within the small box in the lower right have been excluded (see text).
For this study, the solution was to exclude any ensemble member tracks within the small box (8–13 °N; western boundary at 93 °W) in the lower right of each panel of Figure 5. With this Caribbean FA exclusion procedure (panel c), the Storm 12 WMVM track forecast starts later (12 UTC 24 June) and nearly 10 degrees longitude to the west of Storm 4 in panel a, and to the north of Storm 5 in panel b. Although the new Caribbean FA procedure results in fewer ensemble member tracks in panel c due to the omission of the member tracks that originate within the small box in panel a, the track spread in panel c is smaller and the WMVM track “goes down the middle” of that track spread. Thus, the new procedure is applied to greatly reduce the number of ensemble storm tracks in the eastern North Pacific that originate from Caribbean FA circulations.
Capalbo [9] provides a detailed discussion of the ECEPS pre-formation forecasts of Hurricane Enrique similar to the discussion of pre-Linda in Section 2.3 above. Capalbo [9] describes the first detection of the pre-Enrique Storm 13 at 12 UTC 24 June in the 12 UTC 16 June ECEPS forecast (i.e., a WMVM track could be started in Day 8 of the forecast). Based on the ECEPS-predicted WCM, the T2F(35) timing was forecast to be 12 UTC 25 June, which amazingly was valid within 6 h. By contrast, it was only in the first NHC advisory at 06 UTC 25 June that forecast Enrique would become a tropical storm (Figure 4, row 1). It is also amazing that the 12 UTC 16 June ECEPS forecast of the WCM evolution indicated a T2H of 12 UTC 26 June (i.e., Day 10.0 in the forecast), which was also validated within 6 h (Table 5 in Ref. [9]).
Capalbo [9] developed a Decision Flowchart to evaluate the pre-formation ECEPS forecasts that was based on the real-time forecast evaluations that were completed every 12 h during the 2021 eastern North Pacific hurricane season. Not only does this Decision Flowchart (Figure 8 in Ref. [9]) guide the forecaster through the selection of the ensemble storm that is most likely to become the next TS, it also guides the forecaster to identify ensemble storms that should be placed in a “to watch” category for re-evaluation in the next forecast. Finally, it guides the forecaster to identify ensemble storms that should be discarded (e.g., a likely Caribbean False Alarm storm such as Storm 4 in the 12 UTC 18 June ECEPS forecast in Figure 2). The objective of this application of the Decision Flowchart was to select all of the ECEPS forecast ensemble storms that were pre-Enrique and create a validation summary table for pre-Enrique that is similar to Table 2 for pre-Linda in Section 2.3. Then, an ending-Enrique validation summary table could be created similar to Table 3 for ending-Linda in Section 2.4.
Rather than presenting the pre-Enrique validation summary table from Capalbo [9] and the subsequent ending-Enrique validation summary table, a summary lifecycle diagram similar to the Hurricane Linda diagram in Figure 3 is presented in Figure 6. As described above, the first ECEPS detection of the pre-Enrique disturbance was in the 12 UTC 16 June forecast, and that Storm 13 starting 12 UTC 24 June is the first pre-Enrique forecast in Figure 6b. Note that all of these ECEPS ensemble storm track forecasts begin west of 93 °W, which is the western boundary of the Caribbean FA box in Figure 5. Recall from Figure 4 that the NHC Advisory 1 was issued at 06 UTC 25 June when Enrique was already a tropical storm, and that position is indicated as T2F(35) in Figure 6b.
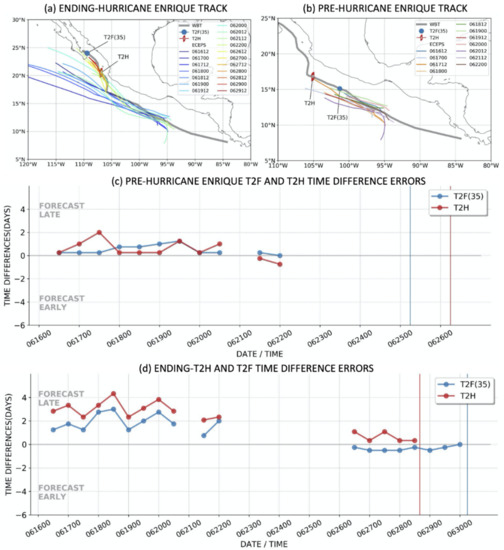
Figure 6.
Summary of the ECEPS pre-formation and ending-stage predictions as in Figure 3 except for the Hurricane Enrique lifecycle.
The ECEPS WMVM tracks for almost all of the 11 pre-formation forecasts in Figure 6b have consistent initial positions, and the track spread is relatively small. The T2F(35) timing errors (Figure 6c) are consistently within one day, and except for one pre-formation T2H forecast, the T2H timing errors are also within one day. For this research study, there are unfortunately periods of missing forecasts, but such missing forecasts would not exist if the technique was made operational.
What then is the explanation of the gray Working Best Track (WBT) line in Figure 6 that extends from just off the west coast of Central America to the T2F(35) position? Capalbo [9] notes that the NHC Five-day Tropical Weather Outlook (TWO) included a disturbance for the first time at 114 h before the Enrique T2F(35) with a <40% chance of formation; this chance was raised to 40–60% at 96 h prior and then to >70% at 78 h prior. A WBT can be continually readjusted as new fix positions become available. Since a disturbance in the NHC TWO is only indicated by an elliptical area oriented along the anticipated track with a cross that presumably indicates the fix position, that WBT in Figure 6 extending back from ~95 °W to the west coast of central America is considered to represent a time series of Caribbean FA disturbance “fixes”. If the NHC continuously issues five-day TWOs for disturbances with any non-zero chance of formation over such a long WBT from the west coast of Central America that then repeatedly fail to undergo TC formation, it is more likely the public will not respond when Enrique does form. The advantage of our technique is the ECEPS-predicted WCM evolution must exceed the TS threshold during each forecast, and then consistent T2F(35) forecasts as shown in Figure 6c would give the forecaster confidence as to when to alert the public.
The first pre-Enrique ECEPS forecast from 12 UTC 16 June also included the ending-T2H and the ending-T2F(35) timings and positions along the WMVM tracks (Figure 6a). As indicated in Figure 6d, the ending-T2H timing errors were 2–4 days late from 12 UTC 16 June through 00 UTC 22 June, which can be attributed to the WMVM track forecasts that continued along a northwestward path to decay over a cooler ocean north of 20 °N. It was only the ECEPS forecasts after 12 UTC 26 June that predicted the Enrique turn toward the west coast of Mexico (Figure 6a) that led to an ending T2H of 16 UTC 28 June, which was then accurately predicted (Figure 6d). These ending-T2H and ending-T2F(35) errors emphasize the importance of accurate track forecasts.
3.2. Validation of Pre-Hurricane Felicia (06E) Pre-Formation and Ending-Storm Guidance
As indicated in Table 1, Felicia was the second hurricane of the 2021 eastern North Pacific season. Felicia followed Enrique by almost 3 weeks, and it was also a tropical storm at the time of the first NHC advisory at 09 UTC 14 July (Cangialosi 2021) [10]. Tropical Storm Felicia rapidly intensified to a hurricane just 24 h after the first advisory (Table 1, column 6). Using the advisories at synoptic times (Figure 7) so that the NHC forecasts of T2F(35) and T2H can be evaluated, the T2F(35) timing error in the first advisory (row 1) was only 6 h late (column 2), but the T2F(35) longitudinal error was a surprisingly large 1.4 degrees to the west (column 3). In that first advisory, the NHC did not forecast a rapid intensification—rather, their T2H of 06 UTC 16 July was 24 h late (column 4). Consequently, their T2H longitude error was 3.4 days to the west (column 5). However, when the initial intensity had increased by 10 kt after only 6 h (column 2, row 2), the NHC forecasts of the T2H timing were within 6 h of the exact time for Advisories 2–4 (column 4). Consequently, the T2H position errors (column 5, row 2) were also smaller. Again, these T2F(35) and T2H forecasts can be so accurate when the NHC waits until pre-Felicia is already a TS in the first advisory (Table 1).
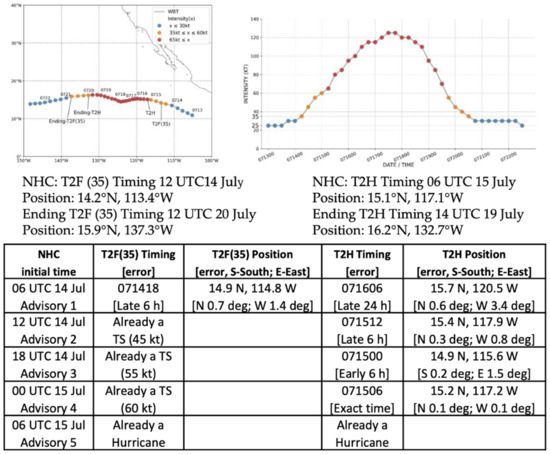
Figure 7.
National Hurricane Center (NHC) forecasts of the T2F(35) and the T2H timing and positions based on NHC advisories as in Figure 4 except during pre-Felicia.
As explained in Figure 5 for pre-Enrique, the ECEPS predicts multiple ensemble storms that might represent the next tropical storm. Chapter 3.1 in Ref. [9] gives a pre-Felicia example of the application of the Decision Flowchart for the three ECEPS track forecasts in Figure 8. Even after eliminating some Caribbean FA storms within the small box in the lower right, Storm 11 in Figure 8b originates from three member tracks that begin just to the west at the 95 °W boundary. Even though Storm 11 meets the criteria for a reasonable eastern North Pacific storm in July, and the ECEPS-predicted WCM evolution indicates the threshold for a likely strong hurricane, there is an increasingly large track spread about the WMVM track in Figure 8b due primarily to the spread in the initial positions of the ensemble member tracks. Consequently, Storm 11 fails two conditions (likely Caribbean FA, track spread) in the Decision Flowchart of Figure 8 in Ref. [9] and is discarded. Once Storm 9 in Figure 8a with a maximum of 14 member tracks with reasonable initial positions, consistent northwestward tracks and track spread, and also a likely hurricane is selected, the question for the forecaster is the likelihood of Storm 12 in Figure 8c. Proceeding through the Decision Flowchart, the forecaster would note that Storm 12 meets all the criteria for a possible second storm starting a day later (12 July versus 11 July) and 10 degrees longitude to the west, but with only six member tracks, it fails the requirement for at least 10 members of the 51 member ECEPS. However, the 00 UTC 13 July position of Storm 12 near 10 °N, 111 °W is almost identical to the Storm 9 position near 10 °N, 110 °W (Figure 8a), and both storm tracks are similar after that 00 UTC 13 July position. In retrospect, perhaps the 00 UTC 11 July eastward starting position for Storm 9 was influenced too much by the two member tracks with initial positions near 97 °W that may be Caribbean FA tracks.
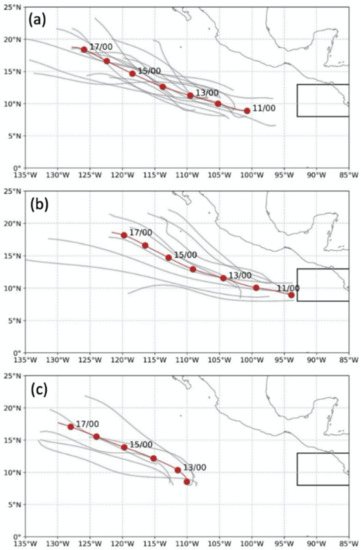
Figure 8.
ECEPS 12 UTC 02 July 2021 forecasts of ensemble member tracks (gray lines) and WMVM tracks (red lines) as in Figure 5c in which there are three options (a) Storm 9, (b) Storm 11, and (c) Storm 12 among which a forecaster would need to select the more likely real Tropical Storm Felicia with the potential to become a hurricane (see text).
The important conclusion from Figure 8 is that an experienced forecaster must be involved in evaluating which of the multiple ECEPS-predicted storms is the more likely real pre-Felicia disturbance when that disturbance is being first detected in a forecast more than 10 days in advance of Felicia becoming a tropical storm. The objective of the Capalbo [9] Decision Flowchart is to guide the forecaster in the selection of that most likely pre-Felicia disturbance and as to whether to put any remaining storms in a “To-watch” category or to discard it.
A summary lifecycle diagram similar to the Hurricane Linda diagram in Figure 3 is presented for Hurricane Felicia in Figure 9. As described above, the first ECEPS detection of the pre-Felicia disturbance was in the 12 UTC 2 July forecast, and that Storm 9 starting at 00 UTC 11 July near 8.9 °N, 100.7 °W is the first pre-Felicia forecast in Figure 9b. Although all of these ECEPS pre-Felicia WMVM track forecasts have initial positions west of the 93 °W boundary of the Caribbean FA box in Figure 8, there are a number of these pre-Felicia forecasts that begin as far east as 97 °W similar to the two member tracks in Figure 8a, which contributes to the relatively large scatter in the initial positions. However, these pre-Felicia track forecast directions are quite consistently toward the west–northwest. The pre-Felicia T2F(35) timing errors (Figure 9c, blue dots) are consistently very small even from the first ECEPS forecast 12 days in advance of the verifying T2F(35) of 12 UTC 14 July. For the first seven days of these ECEPS forecasts, the pre-Felicia T2H timing errors are also very small, which indicates that the ECEPS-predicted WCM evolutions are highly accurate for this time period. However, there are some larger pre-Felicia T2H timing errors at 12 UTC 10 July (suspiciously after a missing forecast at 00 UTC 10 July) and at 00 UTC 14 July, which is because this is only 12 h before the verifying T2F(35) may be attributed to the lack of a bogus vortex initialization for the ECEPS. The pre-formation T2F(35) timing errors for pre-Linda and pre-Enrique also tended to become larger within 36–48 h prior to verifying T2F(35) (not shown). Because of this deficiency in the ECEPS initial conditions, the forecaster should rely more on other numerical weather prediction center (NWP) deterministic models for this short time range.
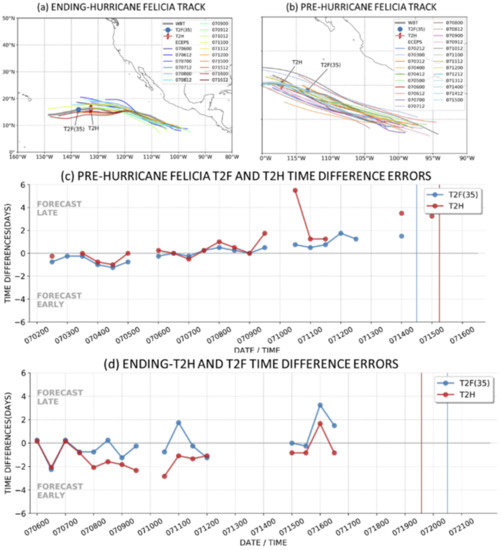
Figure 9.
Summary of the ECEPS pre-formation and ending-storm predictions as in Figure 3 except here for the Hurricane Felicia lifecycle.
The ECEPS track forecasts that included the ending T2H and the ending T2F(35) are displayed in Figure 9a. The earliest of these ECEPS ending-Felicia forecasts is from 00 UTC 6 July and the ending T2H was 18 UTC 13 July, which was verified as only four hours late (Figure 9d), and the predicted ending-T2H position of 18.0 °N, 133.4 °W was 1.8 degrees to the north and 0.7 degrees to the west of the verifying position (not shown). Such remarkably small ending-T2H forecast errors require both an accurately predicted WCM evolution and an accurate WMVM track forecast. Almost all of the later ending-Felicia track forecasts in Figure 9a are highly consistent, and the ending-T2H times tend to be early by about two days (Figure 9d, red dots) while the ending-T2F(35) times (black dots) tend to oscillate around zero or be late. Forecasts during 00 UTC 12 July through 12 UTC 14 July are omitted, as the initial conditions for the ECEPS were clearly degrading the solution for the pre-Felicia circulation prior to the T2F(35) at 12 UTC 14 July. Three of these forecasts did not predict that a hurricane would even exist in the solution, so an ending T2H was not predicted. Although the ECEPS forecast from 00 UTC 15 July to 12 UTC 16 July again predicted ending-T2H times in Figure 9d that were reasonable, the ending-T2H positions were highly erratic, which we attribute to Felicia being a hurricane during this period, and the ECEPS initialization technique does not include a bogus vortex that would re-position the Felicia vortex at the fix position. Again, the forecaster should rely more on other NWP deterministic models during periods when the ECEPS initialization should have a bogus vortex technique to accurately specify the TC intensity and position.
In conclusion, both the pre-formation and the ending-stage ECEPS forecasts for Hurricane Felicia were highly accurate except when the TC initial conditions regarding the T2F(35) timing and position were clearly deficient. The objective of this study to provide earlier guidance regarding the Felicia lifecycle has been achieved with ECEPS forecasts as early as 12 days in advance of the T2F(35) and almost 13 days in advance of the T2H.
3.3. Validation of Pre-Hurricane Hilda (08E) Pre-Formation and Ending-Storm Guidance
As indicated in Table 1, Hilda was the third hurricane of the 2021 eastern North Pacific season. Hilda followed Felicia by about 2 weeks, and it actually had an intensity of 40 kt at the time of the first NHC advisory at 21 UTC 30 July (Table 1, row 3). While Hilda became a hurricane at 00 UTC 1 August, this was only an intensification of 25 kt in 27 h, which does not qualify as an RI event following formation. Using the advisories at synoptic times (Figure 10) so that the NHC forecasts of T2H can be evaluated, the T2H timing errors (column 4) are within 3 h for three of the five advisories, and they are within only 9 h for the other two advisories. With these small T2H timing errors, the T2H position errors are also small with only the two advisories 9 h late T2Hs having longitude errors to the west by 1.9 degrees and 1.7 degrees (column 5). As was the case for Hurricanes Linda, Enrique, and Felicia, these small NHC T2H errors are in part due to the NHC waiting to begin these forecasts until the TC is almost a tropical storm or in the case of Hilda until it was already a 40 kt storm.
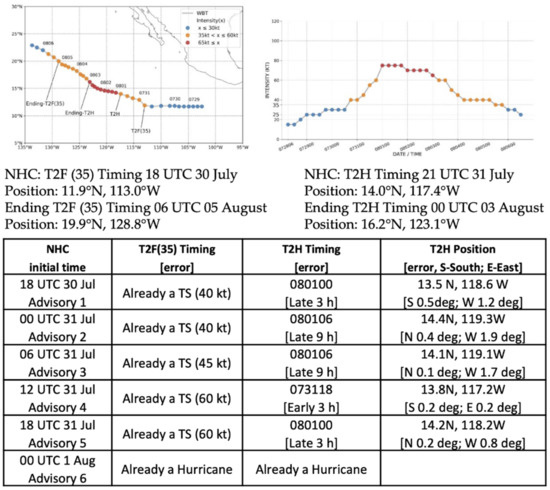
Figure 10.
National Hurricane Center (NHC) forecasts of the T2F(35) and the T2H timing and positions based on NHC advisories as in Figure 4 except here during pre-Hilda.
Rather than presenting the ECEPS pre-Hilda and ending-Hilda validation summary tables, a summary lifecycle diagram similar to the Hurricane Linda diagram in Figure 3 is presented for Hurricane Hilda in Figure 11. The first ECEPS detection of the pre-Hilda disturbance was Storm 10 in the 12 UTC 22 July forecast, which is 8.25 days in advance of the Hilda T2F(35) at 18 UTC 30 July, and that Storm 10 WMVM track forecast is the first track in Figure 11b. The ECEPS-predicted WMVM track forecasts detecting pre-Hilda started about 15 degrees longitude to the east of where Hilda became a TS near 11.3 °N, 113.0 °W. Whereas the WBT from the NHC had pre-formation Hilda moving westward, the ECEPS pre-formation tracks are all toward the west–northwest and thus pass well to the north of the NHC T2F(35) position. The early ECEPS tracks also have a large northward bias relative to the T2H position near 14.0 °N, 117.4 °W, but the later forecasts have very small (<1 day) latitudinal errors (Figure 11b).
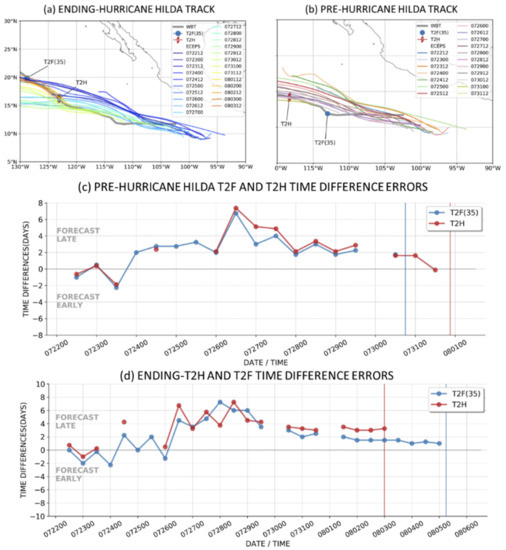
Figure 11.
Summary of the ECEPS pre-formation and ending-stage predictions as in Figure 3 except here for the Hurricane Hilda lifecycle.
Although the first two ECEPS forecasts that detected the pre-Hilda disturbance had incredibly small T2F(35) and T2H timing errors (Figure 11a), these timing errors then became 2–4 days late for almost all of the forecasts from 00 UTC 24 July through 12 UTC 29 July. Clearly, these late T2F(35) and T2H timing errors are related to the large westward T2F(35) and T2H longitudinal errors, but it is uncertain as to which is the cause and which is the effect. The pre-Hilda disturbance was translating quite fast, which may have inhibited the formation, perhaps in association with environmental vertical wind shear. Note that during 00 UTC 24 July through 12 UTC 25 July, three out of these four ECEPS forecasts did not have WCM evolutions that would indicate a Likely Storm Category (LSC) of a hurricane (absence of a red dot at these times in Figure 11c).
Except for these three ECEPS forecasts that did not predict a likely hurricane, there were 23 forecasts starting from 12 UTC 22 July that did predict an ending Hurricane Hilda (Figure 11a, inset). These WMVM track forecasts are relatively compact, and all have a northward bias passing by the position where Hilda became a TS (as seen in Figure 11b). There is then a track forecast bifurcation with the majority of the WMVM track forecasts turning westward beyond 115 °W and a minority of track forecasts continuing west–northwestward. Since Hurricane Hilda had also turned westward beyond 115 °W, the track majority have accurate forecasts of the latitude at which Hilda will end as a hurricane (but still with large late timing forecast errors). Because TS Hilda then turned to the northwest to the ending-T2F(35) position of 19.9 °N, 128.8 W, the track forecast minority coincidently had highly accurate forecasts of the latitude at which Hilda would end as a TS. These ending-T2H and ending-T2F(35) timing errors are provided in Figure 11d. The ending-T2F(35) timing errors were comparatively small during the 2-day period described above in which the ECEPS was not forecasting that TS Hilda would become a hurricane. However, starting from the same 12 UTC 26 July forecast in which the pre-formation T2F(35) and T2H timing errors became 7 days late (Figure 11c), the ending-T2H and ending-T2F timing errors also became very late. It was not until 12 UTC 30 July that these ending-Hilda timing errors reduced to 2–3 days late.
Considering that these pre-formation and ending-stage ECEPS forecasts for Hurricane Hilda started 8 days in advance of the T2F(35) and 9 days in advance of the T2H, the latitudinal position errors were quite acceptable. Future research is needed as to why the timing, and thus the longitudinal position, errors were so large.
3.4. Validation of Pre-Hurricane Olaf (18E) Pre-Formation and Ending-Storm Guidance
While Hurricane Nora (14E) would normally have been the next hurricane to be discussed after Hurricane Hilda, there was a 10-day period during late August 2021 in which the ECEPS forecasts were not available for analysis. Thus, Hurricane Olaf is the next hurricane to be examined. Note in the intensity plot in Figure 12 that Olaf had a long pre-formation period. The first NHC advisory for the pre-Olaf disturbance was at 21 UTC 7 September when the intensity was already 30 kt (Table 1, row 6), and the T2F(35) was 15 UTC 8 September so that the first advisory was only 18 h in advance of the Olaf formation. Olaf was another EPAC hurricane that underwent RI following formation, since the T2H was only 24 h after the T2F(35). Using the advisories at synoptic tines (Figure 12) so that the NHC forecasts of the T2F(35) and the T2H can be evaluated, the T2F(35) timing errors (column 2, rows 1–3) were within six hours. Surprisingly, the T2F(35) longitudinal errors (column 3) were all greater than 6 degrees, which may be because NHC had been following a Caribbean FA precursor circulation that had a track closer to the coast as shown in Figure 5a. The first three NHC forecasts of the T2H timing (column 4) were late by 6 h to 18 h, respectively, but then in Advisories 4–6, the NHC did not forecast that TS Olaf would become a hurricane.
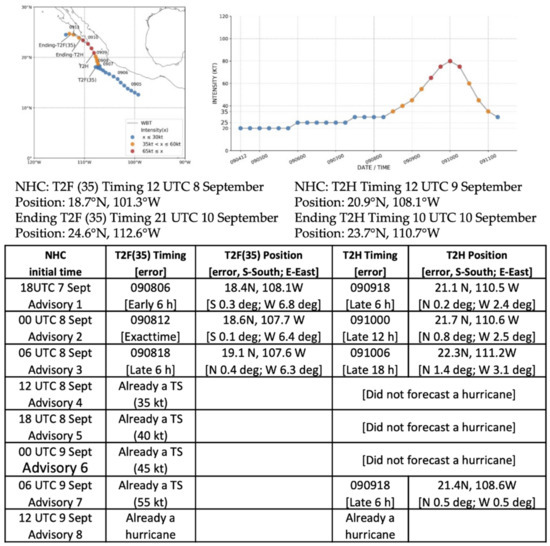
Figure 12.
National Hurricane Center (NHC) forecasts of the T2F(35) and the T2H timing and positions based on NHC advisories as in Figure 4 except during pre-Olaf.
As for the Hilda case, a summary lifecycle diagram (Figure 13) will be given in place of the pre-Olaf and the ending-Olaf validation summary tables. The first ECEPS detection of the per-Olaf disturbances was Storm 14 in the 00 UTC 27 August forecast, which is 12.5 days in advance of the Olaf T2F(35) at 12 UTC 8 September. The early ECEPS pre-formation WMVM track forecasts (Figure 13b) were quite consistent with the NHC WBT track (gray line). However, there were four WMVM track forecasts that started later with initial positions between 105 °W and 108 °W. Almost all of the WMVM track forecasts missed the Olaf turn from northwestward tracks before the T2F(35) to northward tracks after the T2F(35). After the first three pre-formation forecasts with early T2F(35) and T2H timing errors of 2–3 days (Figure 13c), there were three missing forecasts and one “Not a Tropical Storm” forecast that make the evaluation of the T2F(35) timing errors difficult until 12 UTC 1 September. Then, those T2F(35) timing errors become consistently one day or less, but then from 12 UTC 4 September to 00 UTC 7 September, four of the possible six forecasts are again missing. Not counting the missing forecasts, there were seven forecasts of “Not a Hurricane” and 10 forecasts of “Hurricane”, and almost all of those forecasts had small (<1 day) timing errors. Given the long pre-formation period, and that Olaf was a short-lived, and weak hurricane, the ECEPS-predicted WCM evolutions utilized to estimate the LSC of “Hurricane” can be concluded to be accurate.
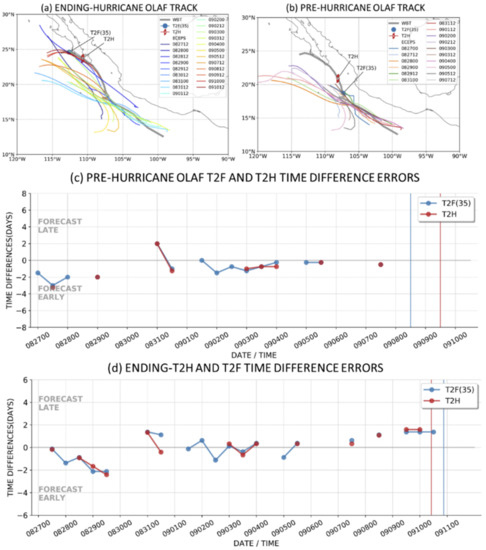
Figure 13.
Summary of the ECEPS pre-formation and ending-storm predictions as in Figure 3 except here for the Hurricane Olaf lifecycle.
The first ECEPS forecast to also predict the ending T2H was from 12 UTC 27 August, which is 14 days in advance of the ending-Hurricane Olaf time of 10 UTC 10 September when Olaf was just off the west coast of Baja California (Figure 13a). There was a very large spread in the ending-Olaf track forecasts, with only about one-third of these track forecasts correctly predicting the Olaf turn to the north to parallel the coast of Baja California. Thus, it is somewhat surprising that the ending-T2H timing forecasts (Figure 13d, red dots) are so accurate. The likely reason is that the majority of tracks that did not correctly predict the Olaf turn toward the coast decayed due to passing over a colder ocean north of ≈22 °N at about the same time as Olaf interacted with land.
In conclusion, these ECEPS pre-formation and ending-storm stage forecasts beginning 12.5 days and 14 days, respectively, in advance certainly achieved the objective of providing early guidance of the Hurricane Olaf lifecycle. The large number of missing forecasts would have been frustrating for the forecasters, but such missing forecasts would not exist if the technique was operational.
3.5. Validation of Pre-Hurricane Pamela (16E) Pre-Formation and Ending-Storm Guidance
There was about a four-week gap between the formation of Hurricane Olaf and the formation of Hurricane Pamela at 15 UTC 10 October (Table 1, row 7), which was only 9 h after NHC issued the first advisory for pre-Pamela. As indicated in the WBT track plot in Figure 14, the pre-Pamela disturbance track according to the NHC started on the west coast of Central America similar to Storm 4 in the 12 UTC 18 June ECEPS forecast (Figure 5a), and thus, it is suspected that the early WBT is actually following a Caribbean FA circulation. Note in the pre-Pamela intensity plot in Figure 14 that the early intensities were only 15 kt, the intensity was 25 kt for 30 h, and then there was a slow intensification to 35 kt in 12 h and to a peak intensity of 70 kt in 48 h after the T2F(35). About 24 h after that peak intensity, Hurricane Pamela made landfall and rapidly decayed.
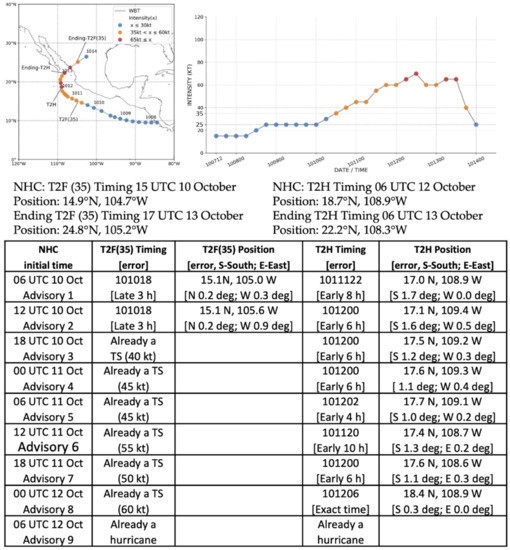
Figure 14.
National Hurricane Center (NHC) forecasts of the T2F(35) and the T2H timing and positions based on NHC Advisories as in Figure 4, except during pre-Pamela.
The summary lifecycle diagram for Hurricane Pamela is presented in Figure 15. Note again the NHC WBT (panel b, gray line) that starts at the west coast of Central America. However, only one ECEPS forecast from 12 UTC 6 October (orange line) starts east of the 93 °W boundary of the Caribbean FA box (Figure 15b). The rest of the ECEPS pre-Pamela WMVM track forecasts begin within a circle of radius 3 degrees latitude of 10 °N, 97.5 °W and have northwestward tracks with relatively small spread. The pre-Pamela ECEPS predictions of the WCM evolutions along the WMVM track forecasts, which are utilized to estimate the pre-formation T2F(35) and T2H timings, are demonstrated in Figure 15c to be highly accurate, because those timing errors are nearly all less than one day. Whereas the first ECEPS forecast is 5.75 days (7.25 days) in advance of the T2F(35) (T2H), the NHC forecast of the T2F(35) in the first advisory (Figure 15, row 1) was only 9 h in advance.
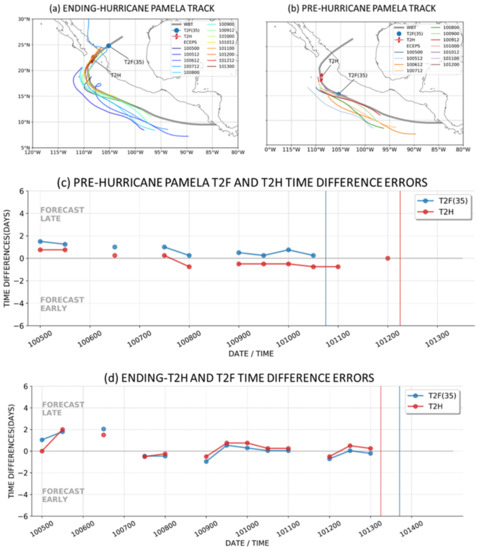
Figure 15.
Summary of the ECEPS pre-formation and ending-storm predictions as in Figure 3 except here for the Hurricane Pamela lifecycle.
The ECEPS forecasts that also predicted the ending T2H in association with the landfall of Hurricane Pamela are shown in Figure 15a. Note that the starting positions for these ending-T2H forecasts are identical to the starting positions for the pre-formation T2H forecasts in Figure 15b, because the ending-T2H time of 17 UTC 13 October is only 35 h after the pre-formation T2H time. The key to an accurate ending-T2H time for Hurricane Pamela is a highly accurate track forecast in Figure 15a that correctly turns Hurricane Pamela toward the coast around 18 °N, 110 °W and predicts well the landfall position. It is noteworthy how small the track spread among these ECEPS members is following the turn toward the coast, and that this turn on 12 October is being predicted by the ECEPS as early as 7 days in advance. The most important result in Figure 15 is the incredibly small ending-T2H and ending-T2F(35) timing errors in panel d. From the 12 UTC 7 October through the 00 UTC 13 October ECEPS forecasts, the ending-T2H timing errors are <12 h, which demonstrates the exceptional accuracy of both the WMVM track forecasts and the predicted WCM evolutions along those track forecasts. These pre-formation and ending-storm forecasts of the Hurricane Pamela lifecycle from a disturbance 6 days in advance of TS formation through landfall 9 days later on the west coast of Mexico are one of the best examples of this opportunity for improved warnings from the ECEPS forecasts.
3.6. Validation of Pre-Hurricane Rick (17E) Pre-Formation and Ending-Storm Guidance
Hurricane Rick occurred about 12 days after Hurricane Pamela (Table 1, row 8). As was the case with the four other hurricanes during the 2021 season, the first NHC advisory at 15 UTC 22 October for the pre-Rick disturbance was at 30 kt, and then, the T2F(35) was in the next advisory only six hours later. The 18 h between the Rick T2H and the T2F(35) was the fastest RI following the formation of any of the 2021 season hurricanes (Table 1, row 8, column 6). Note in the Rick intensity plot in Figure 16 that the intensity was 25 kt from 12 UTC 20 October to 06 UTC 22 October before that RI. Furthermore, the intensity was again constant at 75 kt from 12 UTC 23 October to 12 UTC 24 October. Following a brief intensification to 85 kt, Rick then rapidly decayed as it made landfall.
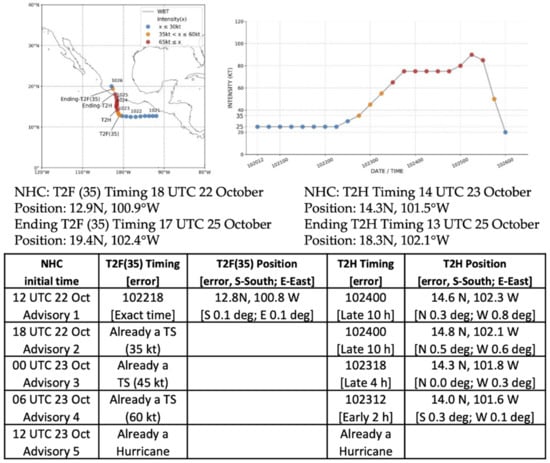
Figure 16.
National Hurricane Center (NHC) forecasts of the T2F(35) and the T2H timing and positions based on NHC advisories as in Figure 4 except during pre-Rick.
The summary lifecycle of Hurricane Rick is given in Figure 17. Note the large scatter in the initial positions at pre-Rick in these ECEPS forecasts, which includes a “Late-joiner” that begins near 11 °N, 103 °W (Figure 17b). While the other early ECEPS WMVM track forecasts tend to agree with the westward track of the WBT prior to the T2F(35) at 18 UTC 22 October, all of these ECEPS forecasts continue toward the northwest and miss the turn of Rick to the north. However, the T2F(35) timing errors (Figure 17c) are consistently late by 12 h to a maximum of 1.75 days at 00 UTC 19 October, which would be good guidance during that early westward track prior to the T2F(35) and the T2H for Hurricane Rick. The ECEPS does have three pre-formation forecasts (00 UTC 17 October, 12 UTC 19 October, and 12 UTC 20 October) in which the T2H timing errors are just a few hours later than the T2F(35) timing errors, which would imply an RI event immediately following formation. However, these T2H forecasts are not consistent in time, and two of these three forecasts have T2H timing errors of 3–4 days either preceding or following within 12 h (Figure 17c).
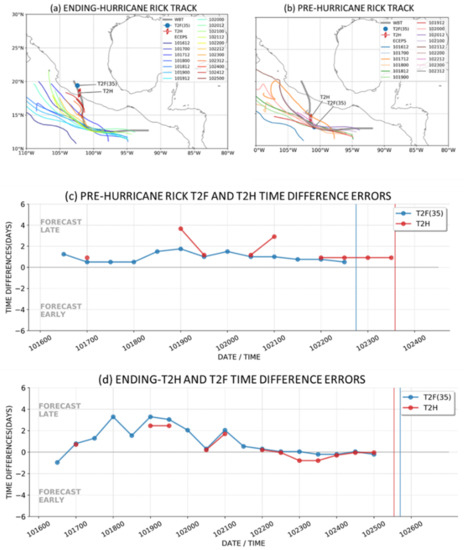
Figure 17.
Summary of the ECEPS pre-formation and ending-storm predictions as in Figure 3, except here for the Hurricane Rick lifecycle.
The importance of an accurate track forecast in landfall scenarios is emphasized in a negative manner with most of the ending-storm T2H track forecasts for Hurricane Rick (Figure 17a). That is, while the cluster of early track forecasts depicted well the westward path of the pre-Rick disturbance, all of these early track forecasts continued past the point where Rick became a TS and then rapidly intensified to become a hurricane. There was a large spread among these tracks beyond where Rick became a TS, with the earliest forecasts later having the largest (10–12 degrees latitude) ending-T2H errors. It was not until the 00 UTC 23 October ECEPS forecast that the northward turn of Hurricane Rick was predicted, and the ending-T2H longitudinal errors were reduced to less than 1.0 days from earlier forecasts that had ending-T2H timing errors greater than 2.0 days (Figure 17d). Similarly, the ending-T2F(35) timing errors became small when an accurate landfall track forecast became available.
3.7. Validation of the ECEPS Pre-Formation and Ending-Storm Guidance for Almost-Hurricane Guillermo
Tropical Storm Guillermo is an interesting example, as the NHC first advisory at 12 UTC 17 July indicated that pre-Guillermo would become a TS in just six hours (Figure 18, row 1, column 2) and intensify to 55 kt in just 48 h (row 1, column 4). Except for Advisory 3, the other advisories through Advisory 6 continued to forecast a peak intensity of 55 kt. Note in Figure 18 that the track of TS Guillermo is similar to climatological tracks in the eastern North Pacific during the month of July, and pre-Guillermo became a TS just three days after pre-Felicia became a TS at 12 UTC 14 July near 14.2 °N, 113.4 °W and then rapidly intensified to a hurricane at 06 UTC 15 July near 15.1 °N, 117.1 °W (Figure 7). Given the pre-Guillermo initial position and track, and presumably a favorable environment for rapid intensification based on Hurricane Felicia a few days earlier, the forecaster reasonably might have expected that it would soon become a hurricane. Thus, TS Guillermo is here designated as “Almost-Hurricane Guillermo”.
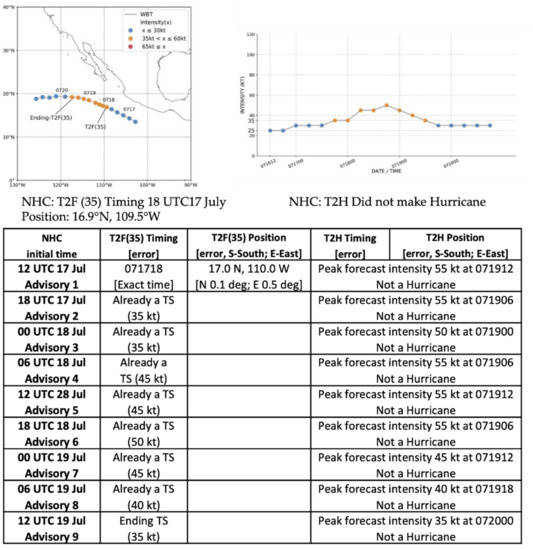
Figure 18.
National Hurricane Center (NHC) forecasts of the T2F(35) and the forecast peak intensity timing and positions based on NHC advisories as in Figure 4 except for pre-Guillermo.
It will be documented later in Figure 19 that the ECEPS accurately predicted the pre-formation track and the T2F(35) timing. However, the pre-formation ECEPS forecasts also predicted a long track for Hawaii and more importantly that pre-Guillermo would become a hurricane along that track. Given this consistent guidance from 15 pre-formation ECEPS forecasts (Figure 19b), as to a potential threat to Hawaii, the key question as in the Hurricane Linda example (Table 3) is, will “Almost-Hurricane Guillermo” still be a hurricane beyond 140 °W such that disaster prevention activities should begin? Since there was no true Ending-T2H time and position with which to validate these ECEPS forecasts, the last time at which the NHC forecast a 55 kt peak intensity is selected as a prototype Ending-T2H time. Even from the pre-formation 00 UTC 9 July ECEPS forecast that had both Ending-T2H and Ending-T2F(35) times (Table 4, column 3), the 12 UTC 13 July through 12 UTC 14 July forecasts still had the Ending-T2H longitudes at or just east of 140 °W. However, five of the six ECEPS forecasts between 00 UTC 16 July and 00 UTC 18 July had peak WCM values less than the hurricane threshold value of 37, and thus, they were not forecasting an Almost-Hurricane Guillermo. Indeed, these forecasts of Ending-T2H timing and positions were more representative of the actual Ending T2F(35) (Table 4, upper-right).
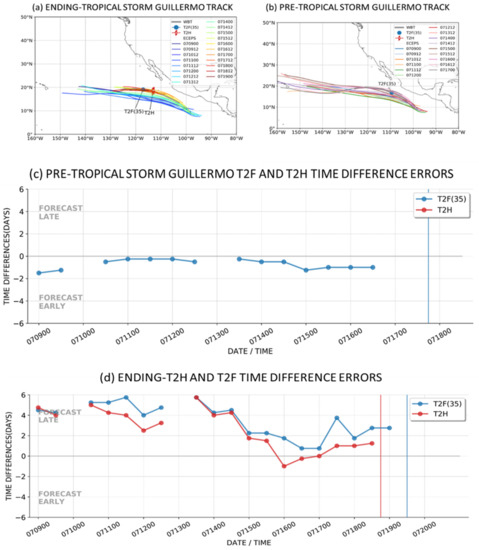
Figure 19.
Summary of the ECEPS pre-formation and ending-storm predictions as in Figure 4 except here for the Almost-Hurricane Guillermo lifecycle.
Table 4.
ECEPS Timing and Position Predictions of T2F(35) and T2H during ending-Guillermo stage.
The summary lifecycle diagram for Almost-Hurricane Guillermo in Figure 19 utilizes the prototype Ending-T2H timing and position as described above. The ECEPS track forecasts in Figure 19a continue far beyond the verifying T2F(35) position of 19.0 °N, 117 °W because of the over-intensification of Almost-Hurricane Guillermo. As mentioned above, the pre-formation ECEPS T2F(35) timing errors (Figure 19c) are quite small. However, the very late Ending-T2H and Ending-T2F(35) times are displayed in Figure 19d. Although the forecasts within five days of the verifying Ending T2F(35) indicated by the vertical blue line tend to be about 2 days late, this still could be useful guidance for a storm far from the coast.
4. Summary and Conclusions
The first objective of this study has been to document the capability of the 15-day ECEPS forecasts to provide much earlier guidance than the NHC advisories as to the T2F(35) and T2H timing and positions along the WMVM tracks. Comparisons of the first detection timing of the pre-formation disturbance in the ECEPS versus the timing in the first NHC advisory from Table 1 is given in Table 5. Because the NHC waited to issue the first advisory until the pre-formation disturbances that became hurricanes during the 2021 eastern North Pacific were at 30 kt or had already become a TS, the longest advance warning of an eminent TS was 18 h for pre-Hurricanes Nora and Olaf (Table 5, column 2, rows 5 and 6). Granted, the NHC issues five-day Tropical Weather Outlooks (TWO) with low (<40%), medium (40–60%), and high (≥60%) chance of a TC formation within an elliptical region oriented along a likely track direction, but this TWO does not provide a specific time and position that the disturbance starts or becomes a TS.
Table 5.
Comparison of the first detection times in advance of the T2F(35) and the T2H of the pre-Hurricane disturbances from the first NHC advisories versus from the ECEPS pre-formation forecasts.
The NHC advisories do provide a 5-day track forecast with associated intensity forecasts that do indicate a T2H, since these initial intensities were always 30 kt or higher (Table 1, column 2) for these eight hurricanes, whereas half of these hurricanes underwent RI following formation Table 5. Comparisons of the first detection times in advance of the T2F(35) and the T2H of the pre-hurricane disturbances from the first NHC advisories versus from the ECEPS pre-formation forecasts.
The incredible capability of the ECEPS to provide much earlier guidance than the NHC advisories as to the first detection of these pre-hurricane disturbances is documented in Table 5, columns 3 and 5. For the first six hurricanes that were generally long-lasting, the first detections were from 8 days to 12 days in advance of the T2F(35) times and from 9 days to 13 days in advance of the T2H times. For the Pamela and Rick cases in the far eastern North Pacific that made landfall within a few days after becoming a hurricane (see Figure 14 and Figure 16, respectively), the first detections were about 6 days in advance of the T2F(35) times and about 7 days in advance of the T2H times (Table 5, rows 7 and 8). While the forecaster may not want to issue an alert 12 days in advance (unless it is a hurricane threatening Hawaii in 12 days), good situational awareness practice should determine when alerts or warnings are issued to Department of Defense and other maritime interests, reservoir management agencies, disaster preparedness groups in advance of landfall, or to the general public. This is because the up-to-15 day WMVM track forecasts and the ECEPS-predicted WCM evolutions of the first detections provide very early guidance as to who will (or will not) be under threat and the magnitude of that hurricane or tropical storm threat.
Whereas Table 5 documents the much earlier ECEPS pre-formation forecast first detection times of the 2021 eastern North Pacific season hurricanes compared to the NHC advisories, these early ECEPS pre-formation forecasts may have substantial uncertainty in the initial positions, track directions and speeds, and in the ECEPS-predicted WCM evolutions that determine both the pre-formation and ending-storm T2F(35) and T2H timings. The forecaster may then want to evaluate two or three more 12-hourly ECEPS forecasts to gain more confidence in the WMVM tracks and in both the pre-formation and ending-storm T2F(35) and T2H timings along those WMVM tracks. Therefore, Table 6 will provide characterizations of the ECEPS track and timing forecast performance from the seven validation summary lifecycle diagrams provided in Section 2 and Section 3 above.
Table 6.
Characterizations of ECEPS track and timing performance for pre-T2H and ending-T2H lifecycle periods.
Hurricane Linda (Table 6, first row) is the showcase example in this study because of its early first detection and its long WMVM track forecast indicating a threat to Hawaii (Figure 3). While the pre-formation tracks (Table 6, column 2) had a relatively large spread due to a large initial position spread, those track forecasts documenting the ending-Linda stage (Table 6, column 3) had excellent initial positions and small track spread that would give confidence to the forecaster. Even starting 7.75 days in advance of the T2F(35), the pre-formation forecast timings of the T2F(35) and the T2H were excellent (Table 6, column 2). As described in Section 2.4 and Figure 3d, the timing of the Linda threat to Hawaii was first too early but then was forecast to be later than actually occurred (column 3).
Hurricane Enrique (Table 6, row 2), after discarding all the forecasts involving a Caribbean FA precursor disturbance as described in Section 3.2, is another showcase example. The pre-Enrique track forecasts had small spread with excellent timings of the T2F(35) even starting almost 9 days in advance (Table 6, row 2, column 2). Similarly, the ending-Enrique track forecasts were generally excellent with a good landfall position and timing even starting from Day-12 (column 3). The ECEPS performance for pre-Hurricane Felicia (Table 6, row 3, column 2) was identical to that for pre-Hurricane Linda, even though the pre-Felicia forecasts started 12 days in advance of the T2F(35). While the ending-Felicia track forecasts were also excellent, the ending-Hurricane Felicia timing tended to be 2 days late and only improved at Day-3 in advance of the T2H.
Hurricane Hilda (Table 6, row 4) is an example of a less successful ECEPS performance. The pre-Hilda track forecasts had larger spread, which may have contributed to the tendency for the T2F(35) forecasts to mostly be 2–3 days late. Even though those ECEPS forecasts that had included the ending-Hurricane Hilda period were excellent (including a late track bifurcation), some of the ending-Hilda timing errors were as large as 4–7 days late and then only improved to 3 days late approaching the T2H time. Hurricane Olaf (Table 6, row 5) is another example of a less successful ECEPS performance. In contrast to the Hilda performance timing deficiency, the Olaf performance deficiency was in the track forecasts with large initial position spreads, and then, there was a failure to predict the turn toward the coast that led to a landfall. Nevertheless, starting from 12.5 days in advance of the T2F(35), the ECEPS forecasts of the T2F(35) timing were very accurate (Table 6, row 5, column 2). This ECEPS forecast accuracy continued for the ending-Olaf timing even though the landfall was not correctly forecast, because the non-landfall forecasts had Hurricane Olaf passing over a cooler ocean region, and thus, decay coincidentally occurred at the same time as the actual landfall decay.
Both Hurricane Pamela (Table 6, row 6) and Hurricane Rick (row 7) also involved a landfall. Pamela was another showcase for ECEPS forecasts with excellent pre-Pamela track forecasts and very small T2H timing errors. This excellent performance continued with the ending-Pamela track forecasts from Day 8 in advance of T2H with very small timing errors (Table 6, row 6, column 3). The pre-Hurricane Rick (Table 6, row 7) track forecasts were also excellent and starting 6.25 days in advance of the T2H the timing errors were mostly small. Similar to the ending-Olaf forecasts, the early ECEPS track forecasts were degraded after Rick became a hurricane and then turned toward the coast and made landfall. Just as in the ending-Olaf case, the degraded track forecasts had Rick moving poleward over a cooler ocean region and coincidently decaying at almost the same time as Rick actually made landfall and decayed.
In conclusion, the continuing sequences of ECEPS pre-formation and ending-storm track and timing forecasts after the initial detection forecasts in Table 5 mostly had consistent excellent performance throughout the lifecycles of these 2021 season hurricanes. The exceptions were primarily attributed to the WMVM track forecast and did not predict a turn toward the coast. The cause of an excessive delay in some pre-Hilda T2F(35) forecasts that then degraded the ending-Hilda T2H forecasts needs to be explored.
Author Contributions
Conceptualization, R.L.E. and H.-C.T. have together published journal articles since 2014 on the ensemble storm Weighted-Mean Vector Motion (WMVM) track forecasts. T.P.M. conceived and developed the tropical cyclone vortex tracker. C.C. participated in the evaluations of the ECEPS forecasts during the 2021 season. Methodology, H.-C.T. and R.L.E. have jointly conceived the methodology of the Warm Core Magnitude (WCM) with the assistance of T.P.M.; Software coding for the WCM has been completed by H.-C.T. and W.-C.C. and T.P.M. has continued to upgrade the vortex tracker code; Validation, R.L.E. and H.-C.T. have jointly conceived the validation technique. C.C. participated in the forecast evaluations; Writing, R.L.E. has been responsible for the text, and H.-C.T., W.-C.C. and C.C. have been responsible for creating the figures and tables. All authors have read and agreed to the published version of the manuscript.
Funding
R.L.E. and H.-C.T. had a two-year Joint Hurricane Testbed grant from the NOAA OAR Office of Weather and Air Quality (OWAQ); R.L.E. is also funded by the Office of Naval Research Grant N00014–19-1-2465. H.C.T and W.-C.C. are supported by the Taiwan Ministry of Science and Technology (MOST 108-2111-M-032-002-MY3) and Central Weather Bureau (1102053C). T.P.M.’s participation was internally funded at the Geophysical Fluid Dynamics Laboratory.
Conflicts of Interest
The authors declare no conflict of interest. The funders had no role in the design of the study, the analyses or interpretation of the data, in the writing of the manuscript, or in the decision to publish the results.
References
- Elsberry, R.L.; Tsai, H.-C.; Chin, W.-C.; Marchok, T.P. Advanced Global Model Ensemble Forecasts of Tropical Cyclone Formation, and Intensity Predictions along Medium-Range Tracks. Atmosphere 2020, 11, 1002. [Google Scholar] [CrossRef]
- Marchok, T. How the NCEP tropical cyclone tracker works. In Proceedings of the 25th Conference on Hurricanes and Tropical Meteorology, San Diego, CA, USA, 29 April–3 May 2002; pp. 21–22. [Google Scholar]
- Marchok, T. Important Factors in the Tracking of Tropical Cyclones in Operational Models. J. Appl. Meteorol. Climatol. 2021, 60, 1265–1284. [Google Scholar] [CrossRef]
- Hart, R.E. A cyclone phase space derived from thermal wind and thermal asymmetry. Mon. Weather Rev. 2003, 131, 585–589. [Google Scholar] [CrossRef]
- Tsai, H.-C.; Elsberry, R.L.; Chin, W.-C.; Marchok, T.P. Opportunity for Early Warnings of Typhoon Lekima from Two Global Ensemble Model Forecasts of Formation with 7-Day Intensities along Medium-Range Tracks. Atmosphere 2020, 11, 1162. [Google Scholar] [CrossRef]
- Elsberry, R.L.; Tsai, H.-C.; Chin, W.-C.; Marchok, T.P. Predicting Rapid Intensification Events Following Tropical Cyclone Formation in the Western North Pacific Based on ECMWF Ensemble Warm Core Evolutions. Atmosphere 2021, 12, 847. [Google Scholar] [CrossRef]
- Latto, A. Hurricane Enrique. National Hurricane Center. 2021. Available online: https://www.nhc.noaa.gov/data/tcr/EP052021_Enrique.pdf (accessed on 26 April 2022).
- Elsberry, R.L.; Tsai, H.C.; Jordan, M.S. Extended-range forecasts of Atlantic tropical cyclone events during 2012 using the ECMWF 32-day ensemble predictions. Weather Forecast. 2014, 29, 271–288. [Google Scholar] [CrossRef]
- Capalbo, C.A. Application of Tropical Cyclone Lifecycle Predictions from Pre-Formation Stage: Eastern North Pacific 2021 Season. Master’s Thesis, Naval Postgraduate School, Monterey, CA, USA, 2022. [Google Scholar]
- Cangialosi, J. Hurricane Felicia. National Hurricane Center. 2021. Available online: https://www.nhc.noaa.gov/data/tcr/EP062021_Felicia.pdf (accessed on 26 April 2022).
Publisher’s Note: MDPI stays neutral with regard to jurisdictional claims in published maps and institutional affiliations. |
© 2022 by the authors. Licensee MDPI, Basel, Switzerland. This article is an open access article distributed under the terms and conditions of the Creative Commons Attribution (CC BY) license (https://creativecommons.org/licenses/by/4.0/).