Abstract
Biomass chemical looping gasification (BCLG) is a complex process for the conversion of biomass using an oxygen carrier, which is influenced by various operating parameters. For a better understanding of this process, biomass steam gasification using ilmenite as an oxygen carrier is numerically investigated in this work using the multiphase particle-in-cell (MP-PIC) method, which is a modified Euler–Lagrange approach. As a first step, a reduced reaction network for biomass gasification is investigated in a spouted bed. As a second step, the reaction network is coupled with oxygen carrier kinetics of ilmenite for the simulation of BCLG in a lab-scale fluidized bed. For both steps, the influence of the main operating parameters, such as reactor temperature, steam-to-biomass ratio, and oxidation degree of the oxygen carrier, are investigated and compared with experimental data from the literature. In general, the simulations show satisfying results and the predicted syngas compositions with varied operating parameters are in good agreement with the experimental data. Furthermore, the main trends for the syngas composition are predicted correctly and the oxidation degree of the oxygen carrier has a significant influence on the resulting syngas composition confirming the experimental results.
1. Introduction
The interest in renewable energies is increasing more and more due to the limited availability of conventional fossil fuels and to mitigate climate change by the reduction of CO2 in the atmosphere. A promising technology for the conversion of biomass is the fluidized bed gasification. This is due to the high heat and mass transfer and good mixing properties as well as the suitability for scaling up. The resulting syngas (which is mainly composed of H2, CO, CO2 und CH4) from biomass gasification is versatile and can be used for the production of synthetic fuels or the generation of heat as well as electricity, for instance [1,2,3,4]. By applying the principle of chemical looping, the emissions and costs can be further reduced compared to other gasification processes [5]. The biomass chemical looping gasification (BCLG) is based on the circulation of an oxygen carrier (OC) between two interconnected reactors. Thereby, lattice oxygen for the oxidation of biomass and the heat for reactions is provided. In this process, the oxygen carrier is oxidized in the air reactor (AR) and reduced by the reaction with the biomass in the fuel reactor (FR). The two reactors are separated using loop-seals, which prevents the dilution of the syngas produced in the fuel reactor with flue gas from the air reactor and, thus, a high quality syngas is obtained. Furthermore, a low tar content in the syngas is obtained due to the presence of oxygen carriers underlining the advantage of BCLG compared to other processes for syngas production [5,6,7,8].
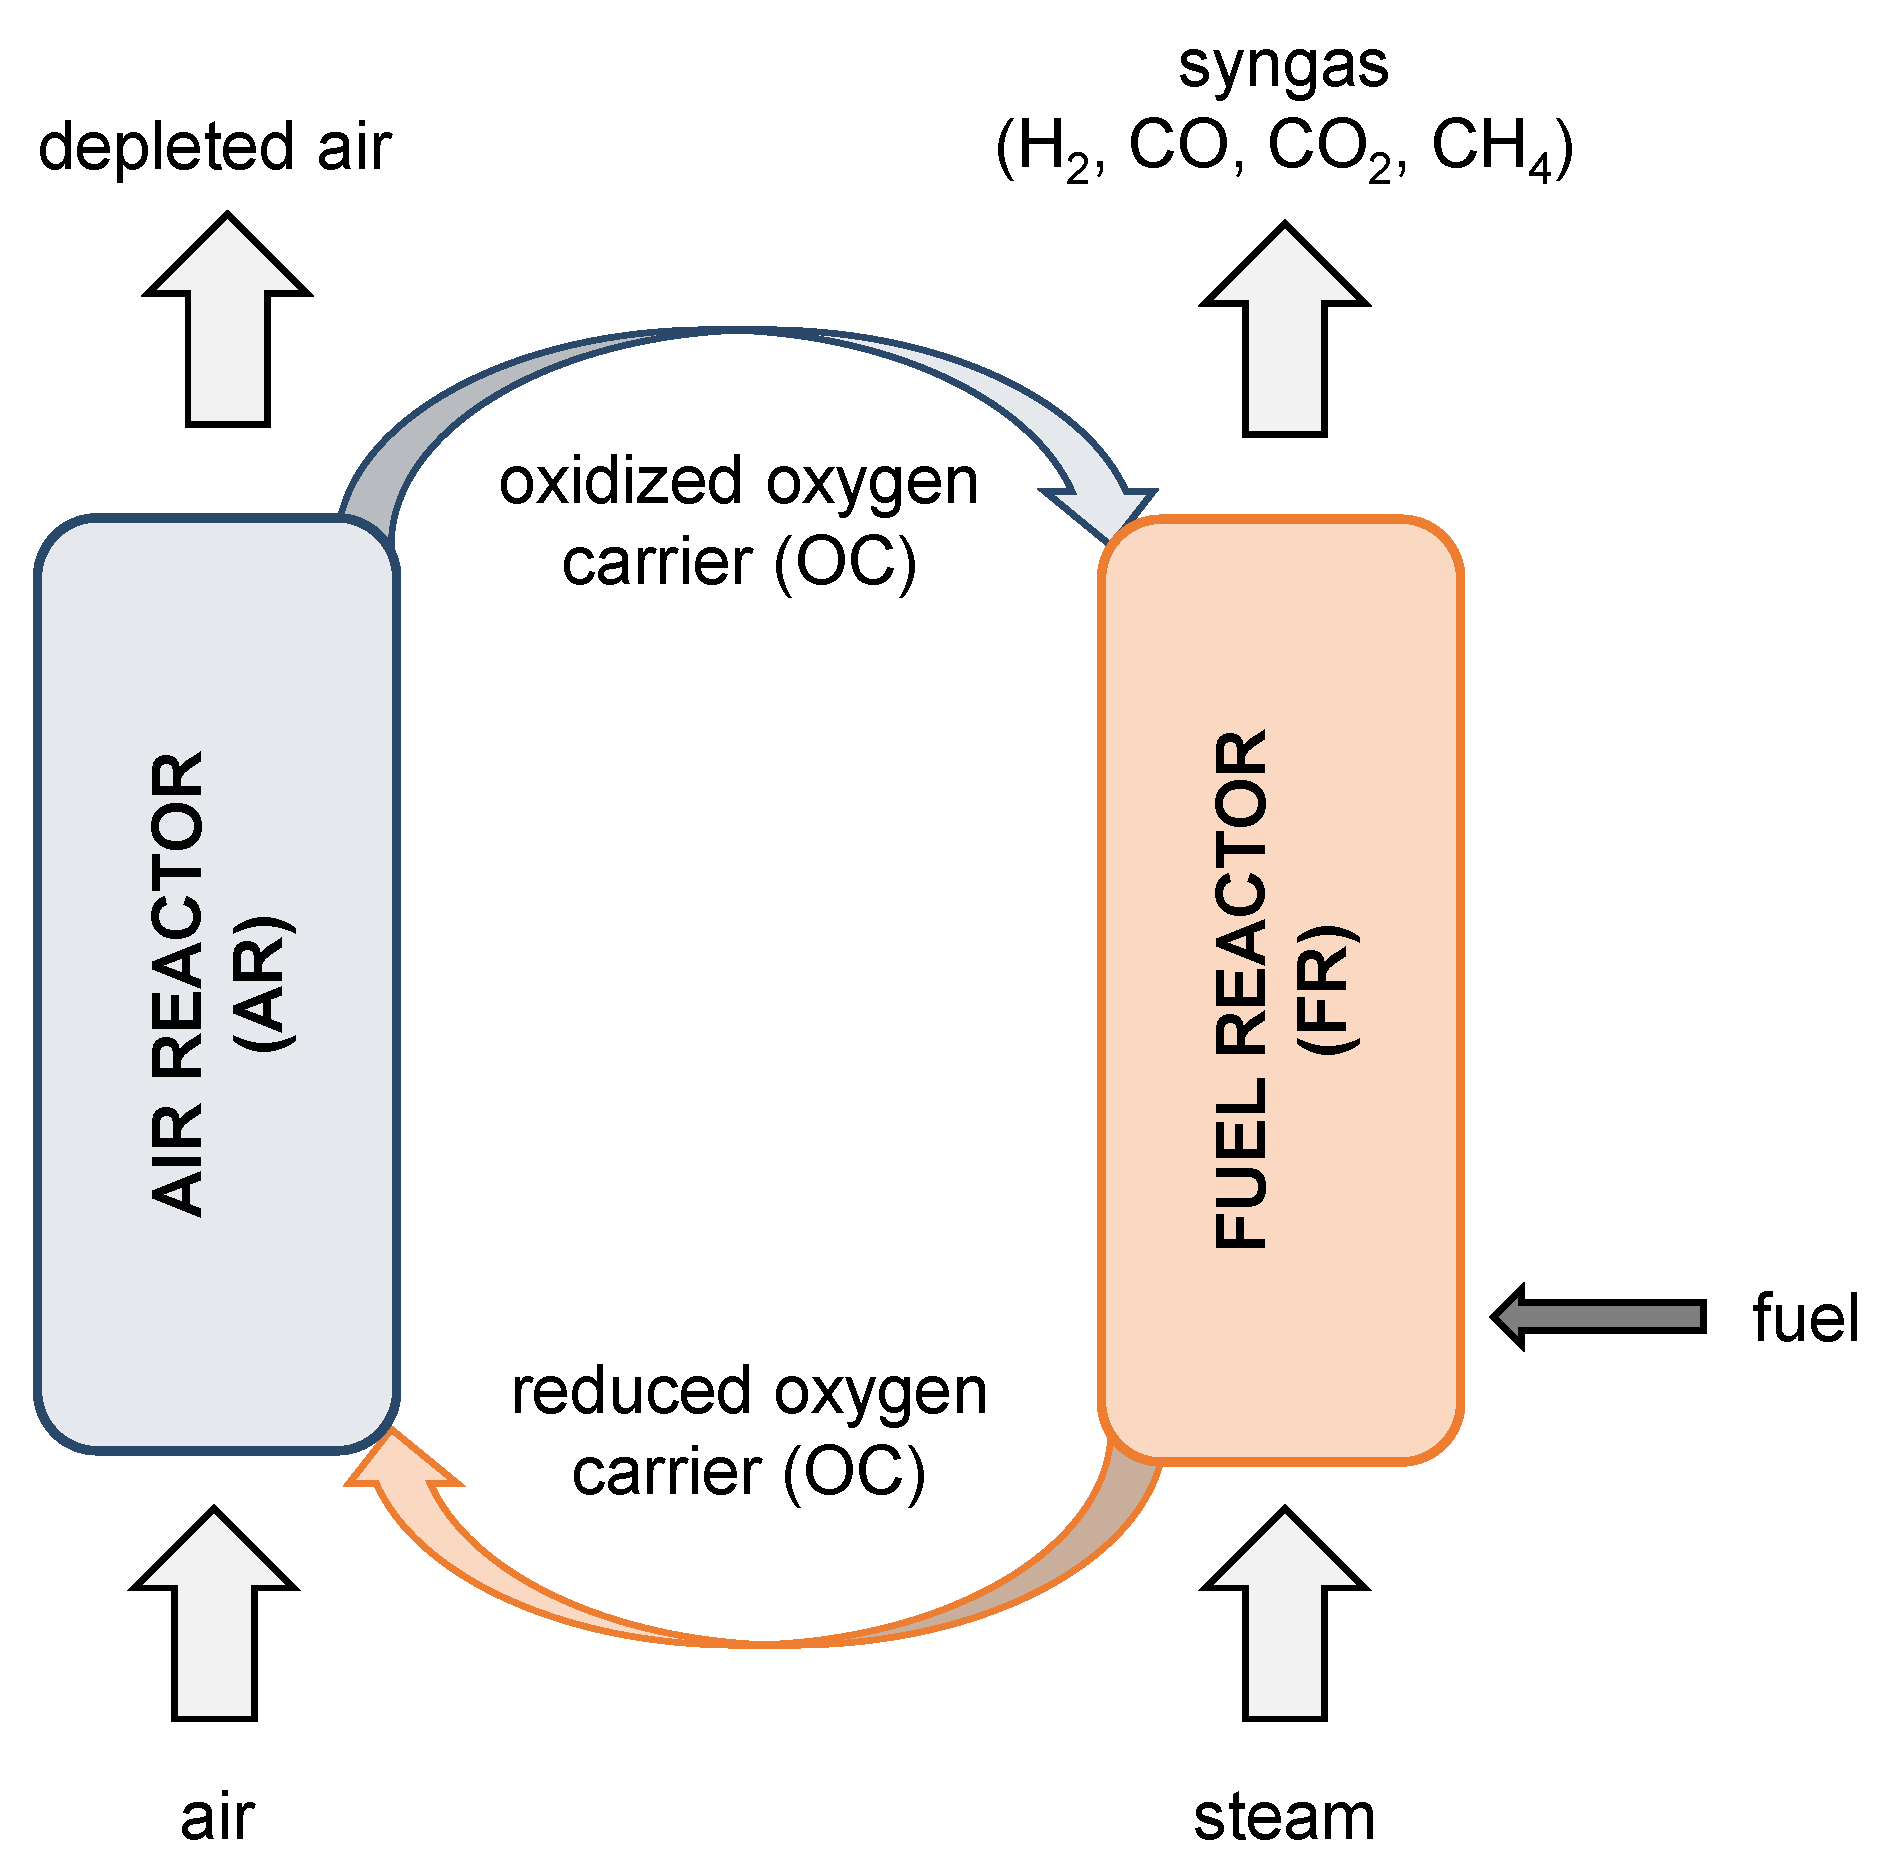
A similar carbon capture technology, namely the chemical looping combustion (CLC), can be applied to combust fuels such as biomass or coal to generate power. A product gas mainly composed of CO2 and steam is obtained [9,10] in contrast to BCLG, where the produced syngas can be used for a wide range of applications. A schematic representation of the chemical looping gasification (CLG) principle is shown in Figure 1 and a detailed description of the CLG process is given in the work of Ge et al. [11].

Figure 1.
Schematic illustration of a CLG process.
Several experimental studies regarding BCLG have been performed [5,11,12,13,14,15], but there is no consensus in the literature regarding the influence of the main operating parameters on syngas composition [5]. Furthermore, the harsh conditions in CLG reactors only allow the measurement of mascroscopic quantities [16]. For this matter and due to the increase in processing power, computational fluid dynamics (CFD) became an attractive tool for the optimization, operation, and design of fluidized beds. However, a compromise between accuracy of the model and computational effort has to be made for the simulation of industrial-size plants [17,18].
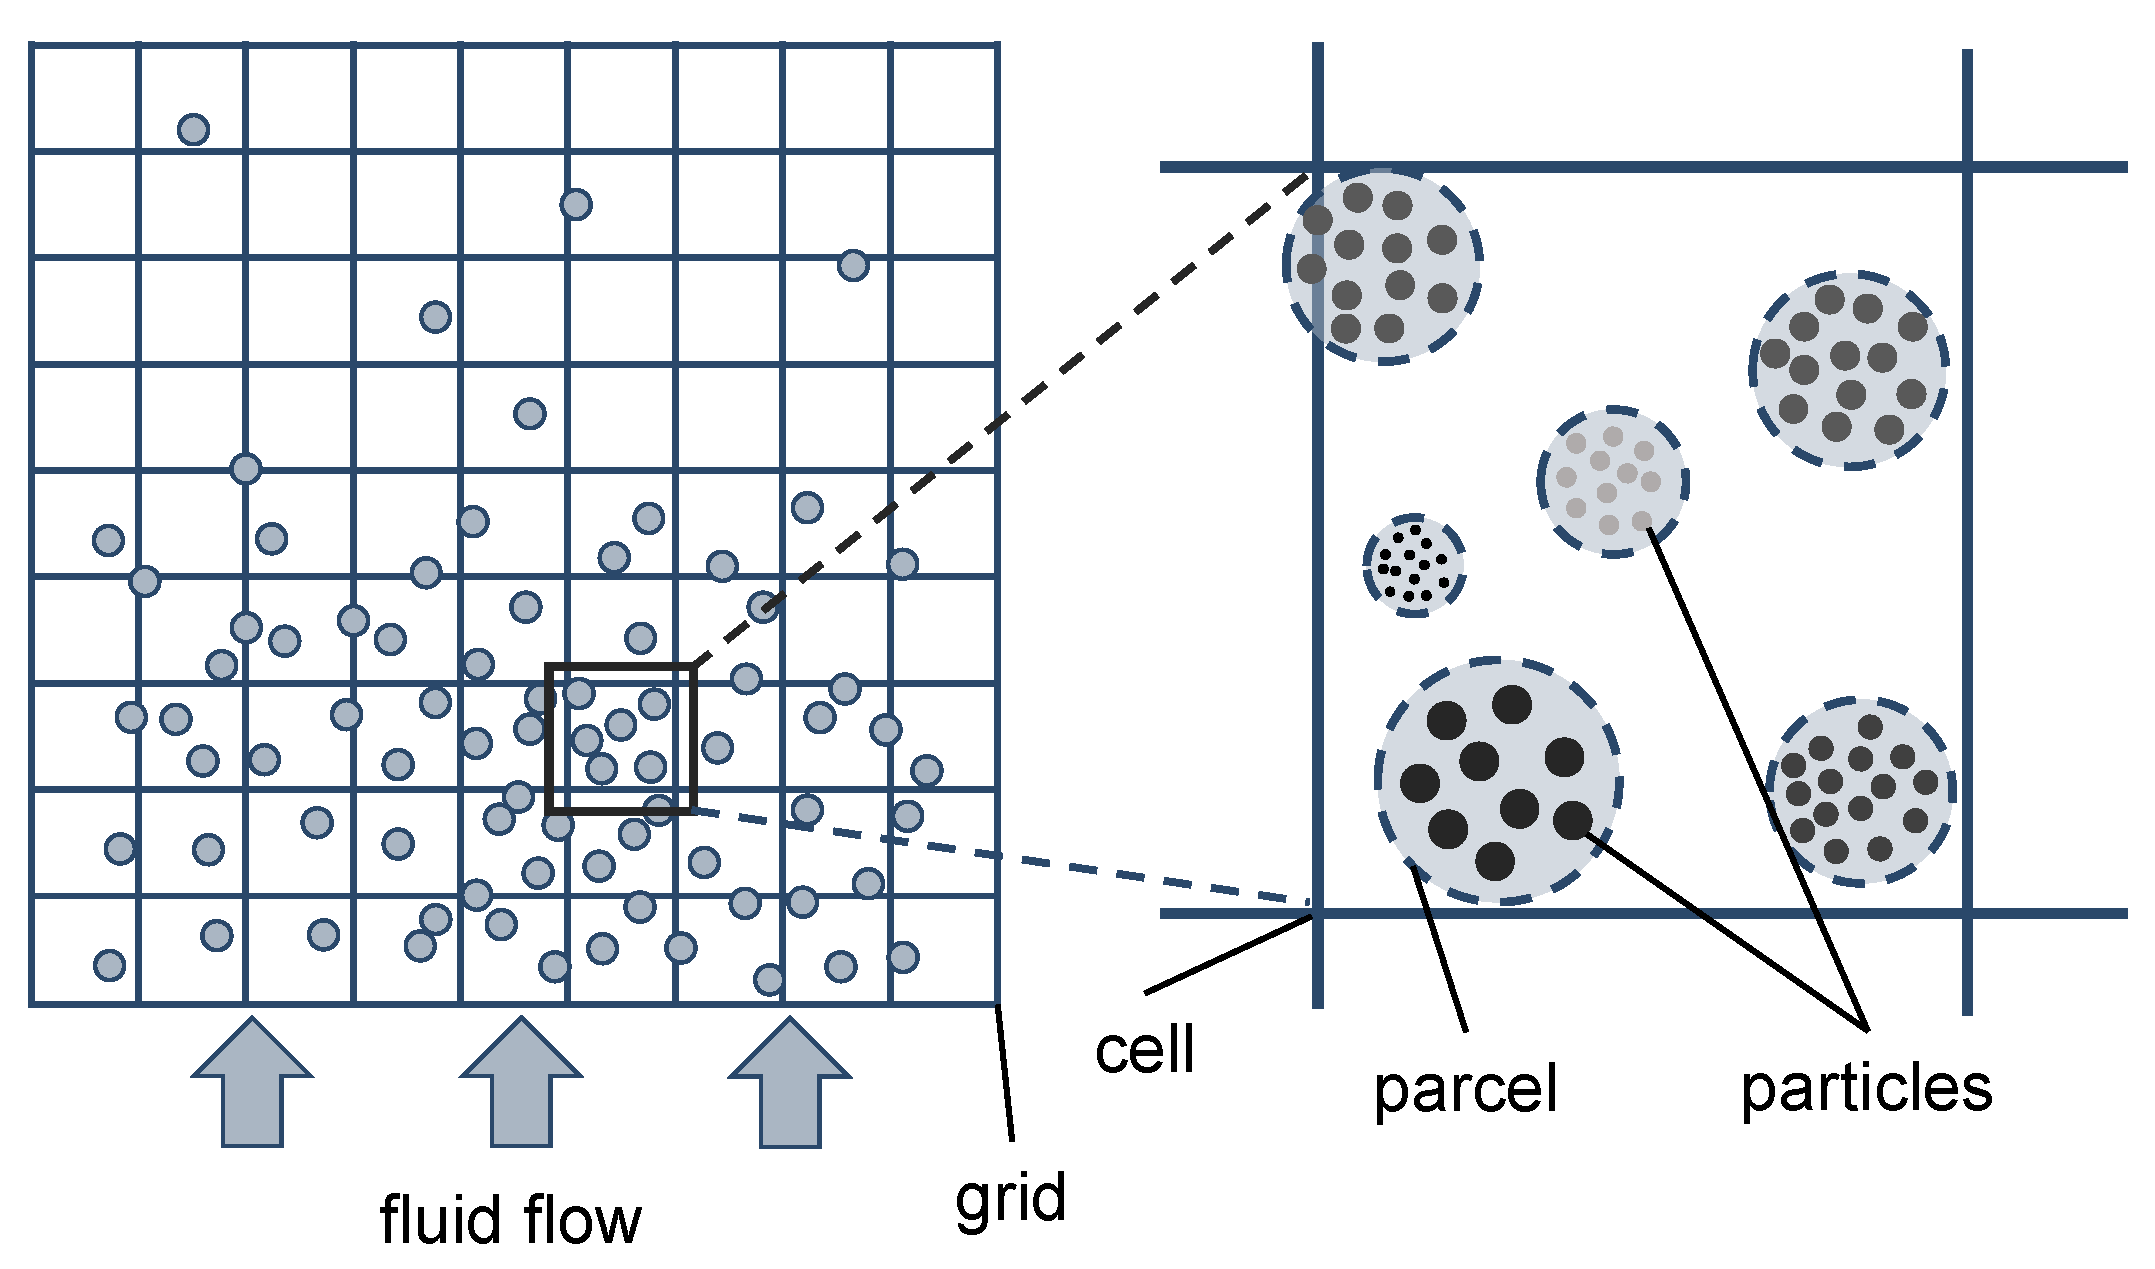
For the simulation of fluidized bed reactors, Euler–Euler and Euler–Lagrange approaches are typically used [19]. Euler–Euler approaches (e.g., TFM or two-fluid model) are mainly used for industrial-sized applications because of the high computational speed, but many closure equations are necessary, limiting the accuracy. This is due to the fact that in this approach both phases are considered as continua by treating the solid phase as a pseudo-fluid. Therefore, a new pseudo-phase has to be defined for every particle size for the implementation of particle size distributions, for instance, [20,21,22]. Euler–Lagrange approaches (e.g., CFD–DEM or computational fluid dynamics–discrete element method) solve the Newtonian equations of motion for the solid phase in contrast to the TFM, while the gas phase is modeled as a continuum. Due to the tracking of individual particles and resolving particle–particle interactions, the computational effort is significantly higher compared to the TFM, resulting in a limitation of the number of particles. Therefore, mainly lab-scale fluidized beds are investigated using CFD–DEM [23]. The multiphase particle-in-cell (MP-PIC) method is based on the work of Andrews and O’Rourke [24], which results from a modification of the Euler–Lagrange approach. In this approach, computational parcels are used to represent a defined number of particles with identical properties such as size, velocity, and location. Instead of resolving particle–particle collisions, the so-called particle stress model is used to model the particle–particle interactions, resulting in a significant reduction of the computational effort compared to CFD–DEM. With this approach, simulations of industrial-sized circulating fluidized beds are feasible, as performed in literature [4,25]. A schematic representation of the MP-PIC method is shown in Figure 2.
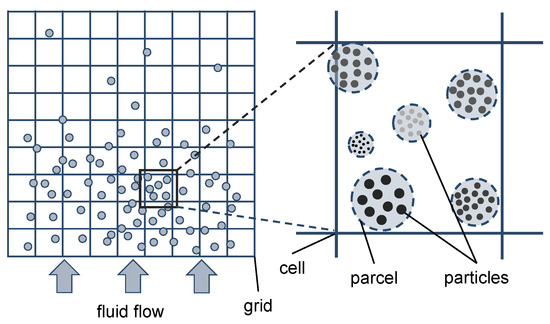
Figure 2.
Schematic representation of the MP-PIC method adapted from Solnordal et al. [26].
Biomass gasification has been numerically investigated by several authors and only a small selection will be named in this work. A detailed list of literature on CFD simulation of biomass gasification is given in the work of Ostermeier et al. [27]. A CFD–DEM model was developed by Ku et al. [28] in OpenFOAM® to investigate the influence of the reactor temperature and steam-to-biomass ratio on the syngas composition. Their results show good agreement with literature data. A similar study was performed by Qi et al. [29] using a coarse-grain CFD–DEM model in STAR-CCM®. They obtained good results as well with reduced computational time. A CFD-DEM study was also performed by Wang and Shen [16]. They found that the particle diameter of the biomass has an insignificant influence regarding the hydrogen concentration, while the biomass feeding position influences the syngas composition. Ostermeier et al. [27] used a coarse-grain CFD–DEM model in ANSYS® Fluent ® for the investigation of wood pellet evolution with a satisfying prediction of the gasifier behavior.
Furthermore, there are various studies incorporating reactions of solid fuel with oxygen carriers, mostly for the investigation of chemical looping combustion systems [30,31,32,33,34]. However, few studies are available in the literature regarding the simulation of the biomass chemical looping gasification processes. Li et al. [35] used a Euler–Euler approach for the simulation of BCLG with an Fe-based oxygen carrier and yielded good results in terms of the syngas composition. Whereas Wang et al. [36] investigated the influence of the main operating parameters for the gasification of coal in a multi-fluid model and found that a smaller size of the oxygen carrier particles reduces the syngas production.
Controlling the availability of oxygen in the gasification process is crucial for adjusting the syngas composition. BCLG is hence expected to work with an oxygen carrier at lower oxidation degrees. Therefore, Condori et al. [5] developed a novel method for controlling the oxidation of the OC ilmenite in the air reactor. Their results also showed the effectiveness of ilemnite.
However, limited numerical studies on biomass steam gasification using oxygen carriers are available. Furthermore, no study was found in the literature that numerically investigated the influence of the oxidation degree of the oxygen carrier on the syngas composition. Therefore, in this work, biomass steam gasification using ilmenite as an oxygen carrier is modeled using Barracuda VR® 21.0 as framework of the MP-PIC method. This is performed in two separate steps. At first, biomass gasification in a spouted bed is simulated using a reduced reaction network. The influence of the reactor temperature and steam-to-biomass ratio is investigated and compared with experimental data given by Song et al. [6]. Second, the gasification of biomass is coupled with the reaction kinetics of ilmenite as an oxygen carrier proposed by Abad et al. [37], and the influence of the reactor temperature and the oxidation degree is investigated and compared with experimental data obtained by Condori et al. [5] in a lab-scale fluidized bed. The separation in two steps is performed to distinguish the deviations of the simulations compared to the experiments resulting from the two different reduced reaction networks.
2. Simulation Methods
2.1. Governing Equations
In this section, the governing equations of the MP-PIC method are summarized. Barracuda VR® 21.0 was chosen as the framework for the MP-PIC method, which is based on the work of Andrews and O’Rourke [24] and Snider [38]. A detailed documentation and derivation of this method is given in their works.
For the gas phase, the continuity equation and the momentum transfer equation are given in Equations (1) and (2), with the gas volume fraction , the gas density , the gas velocity , the time t, the pressure p, the gravitational acceleration , the fluid stress tensor , the interphase momentum exchange rate , and the source term .
To describe the solid phase, the Liouville equation for the particle probability distribution function , given in Equation (3), is solved, where represents the divergence operator with respect to the particle velocity and the particle acceleration.
The source term used in the continuity equation is given in Equation (4), where represents the particle mass, the particle velocity, and the particle temperature.
The interphase momentum exchange rate and the particle volume fraction are related to the particle probability distribution function and given Equations (5) and (6), where is the particle density and the inter-phase drag function.
The particle–particle collisions are modeled using the particle stress model based on the work of Harris and Crighton [39], which is implemented in Barracuda VR®. The inter-particle stress is given in Equation (7), with the modeling constants , , , and the particle volume fraction at close-pack . The solid stress model in Barracuda VR® is multiplied by a factor of 10 compared to the original model.
The inter-phase drag function used in the interphase momentum exchange rate is given in Equation (8) with the particle radius and the drag coefficient .
The drag model used in this work is the blended drag model of Wen and Yu [40] () and Ergun [41] (), which is implemented in Barracuda VR® 21.0 and commonly used in the literature. The blending function is given in Equation (9) [42].
Furthermore, the blended acceleration model (BAM) [43] implemented in Barracuda VR® is used in this work to improve the mixing behavior with respect to the different particle sizes and densities. This is important because the particle–particle collisions are not directly resolved, but play a significant role for the relative motions between particles in fluidized beds.
2.2. Reaction Kinetics
In contrast to sand, which is used as inert heat carrier in Section 3, the biomass and oxygen carrier undergo several processes. In a fluidized bed reactor, the gasification of biomass can be divided in three dominant steps: Drying and pyrolysis of biomass, as well as gasification of char. These steps do not occur successively but simultaneously. However, the drying starts at lower temperatures releasing the moisture content of the biomass. The volatiles are released during the pyrolysis, and char is produced. The released gas is mainly composed of CO, CO2, CH4 and H2, while further lower and higher hydrocarbons (called tars) are also present. At higher temperatures, the tar and char partly react with steam, resulting in a decomposition of the tar and a conversion of the char [1,6,44].
In this section, the implementation of drying and pyrolysis, the biomass gasification reactions, and the reactions with the oxygen carrier, are given.
2.2.1. Pyrolysis
For the drying and devolatilization of the biomass, the Volatile Manager of Barracuda VR® 21.0 is used which, is based on a single step first-order Arrhenius equation, as commonly applied in the literature [1,45,46]. The mechanism is given in Equation (10), where T represents the temperature, the mass, the pre-exponential factor, and the activation energy of the release of volatiles and the moisture, respectively.
The devolatilization kinetics were obtained from Bonnefoy et al. [46] with s−1 and = 14,433 K, and the drying kinetics were obtained from Chan et al. [45] with s−1 and = 10,585 K.
Analogous to the literature [28,47,48], methane is the only hydrocarbon species considered and it is assumed that tars are unstable and converted to CO, CO2, CH4, and H2. Furthermore, the heat of the devolatilization is assumed to be negligible compared to the heat of reactions [49]. It has to be noted that the drying and devolatilization only affect the particle density due to the functionality of the Volatile Manager. This means that particle shrinkage is not considered in this work.
Without the consideration of tar formation, the following global reaction for the pyrolysis and drying of biomass is obtained with :
In this work, the volatile composition is based on experimental data of wood pyrolysis performed by Wang et al. [50], which is given in Table 1. The pyrolysis experiment was performed at 900 °C in a lab-scale fluidized bed. Details regarding the experimental set-up and procedure can be found in the work of Wang et al. [50]. The composition could be predicted using models, but predicted compositions are not accurate according to Kraft et al. [4].

Table 1.
Volatile composition of wood biomass.
2.2.2. Gasification Reactions
A reduced reaction network has to be applied due to hundreds of gas phase reactions taking place in a gasification reactor. Modeling every reaction would make an industrial-size simulation unfeasible. The reaction network given by Song et al. [6] composing four global reactions (R2–R5) is applied in this work as already performed in the literature [16,28,29,47]. The homogeneous water-gas shift reaction and methane reforming reaction are given in Reaction (R2) and (R3).
The reactions kinetics for the homogeneous gas phase reactions are given in Table 2, where the reaction rate is given in kmol m−3 s−1 and the gas concentration is depicted in brackets with the unit of kmol m−3.
Table 2.
Reactions kinetics of the homogeneous reactions.
The heterogeneous Boudouard reaction and water gas reaction with fixed carbon are given in Reaction (R4) and (R5).
The reaction kinetics for the heterogeneous reactions are given in Table 3, where the reaction rate is given in mol m−3 s−1 and the gas concentration depicted in brackets is given in mol m−3.
Table 3.
Reaction kinetics of the homogeneous reactions.
2.2.3. Oxygen Carrier Reactions
The reaction kinetics of ilmenite applied in Section 4 are given by Abad et al. [37] using a particle reaction model. The so-called grain model with uniform reactions in the particle, including a changing grain size model in the grains is described by Equations (11) and (12). The conversion of the solid species is related to the time of complete conversion with the molar density , the grain radius , the average stoichiometric coefficient , the chemical kinetic constant , the gas concentration , and the reaction order n. A detailed derivation of this model is given in the work of Abad et al. [37].
A reduced set of reactions is given by Abad et al. [37] due to the complex reaction network involving metastable intermediate compounds for instance. The reduction and oxidation reactions for Fe2O3 and FeO are given in Reactions (R6–R9). For a detailed description of the reaction mechanism and derivation of the reaction network, the authors refer to the work of Abad et al. [37].
The implicit reaction rates given by Abad et al. [37] for the grain model have to be adapted for the explicit implementation in Barracuda VR® 21.0 as performed by Parker [30]. The adapted reaction rates are given in Table 4 with the gas concentration in mol m−3 and the particle mass in kg.
Table 4.
Reaction kinetics of the oxygen carrier reactions.
The heterogeneous reactions with the oxygen carrier are modeled using discrete particle reactions in Barracuda VR® 21.0, which means that the reaction rates for each parcel are calculated as a function of the particle properties.
3. Biomass Steam Gasification
In this section, simulation results of the fluidized bed experimentally investigated by Song et al. [6] are shown for the validation of the biomass gasification reactions given in Section 2.2.2. The influence of different operating parameters such as reactor temperature, bed mass, and steam-to-biomass ratio (S/B) will be investigated and discussed. Afterward, this model will be coupled with the oxygen carrier kinetics in Section 4 for the investigation of biomass gasification with ilmenite in a lab-scale reactor.
3.1. Experimental and Simulation Setup
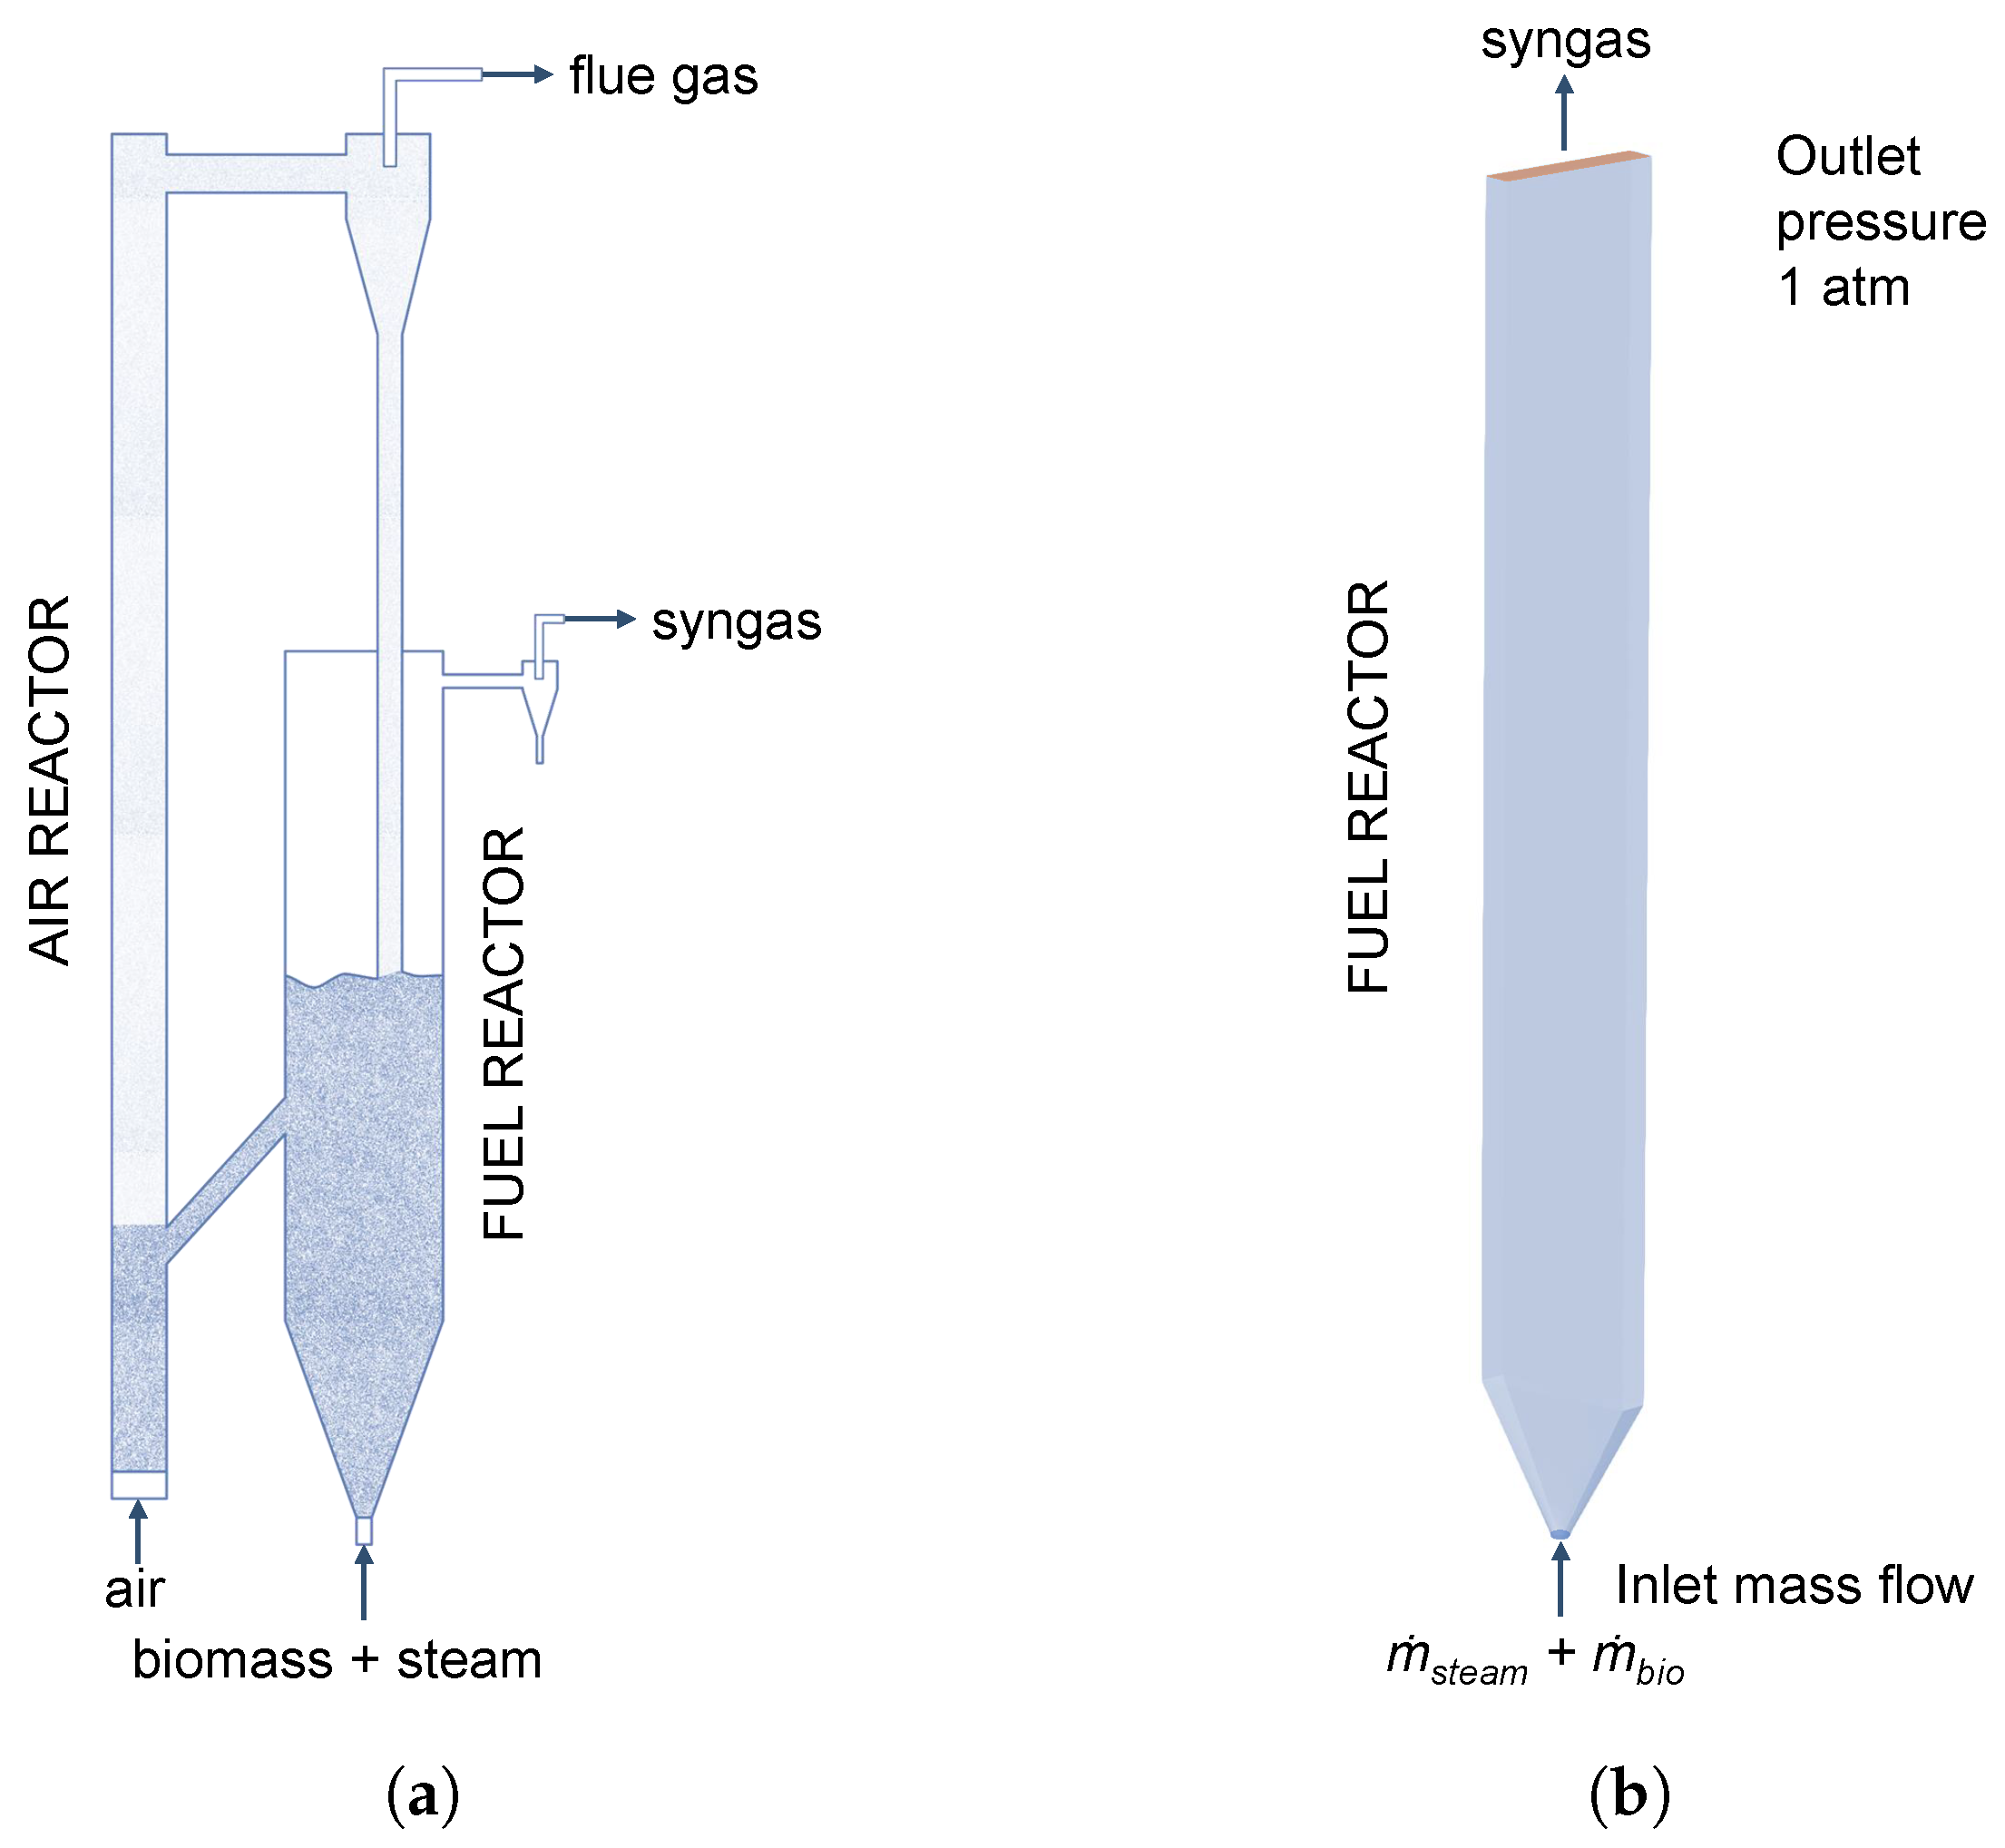
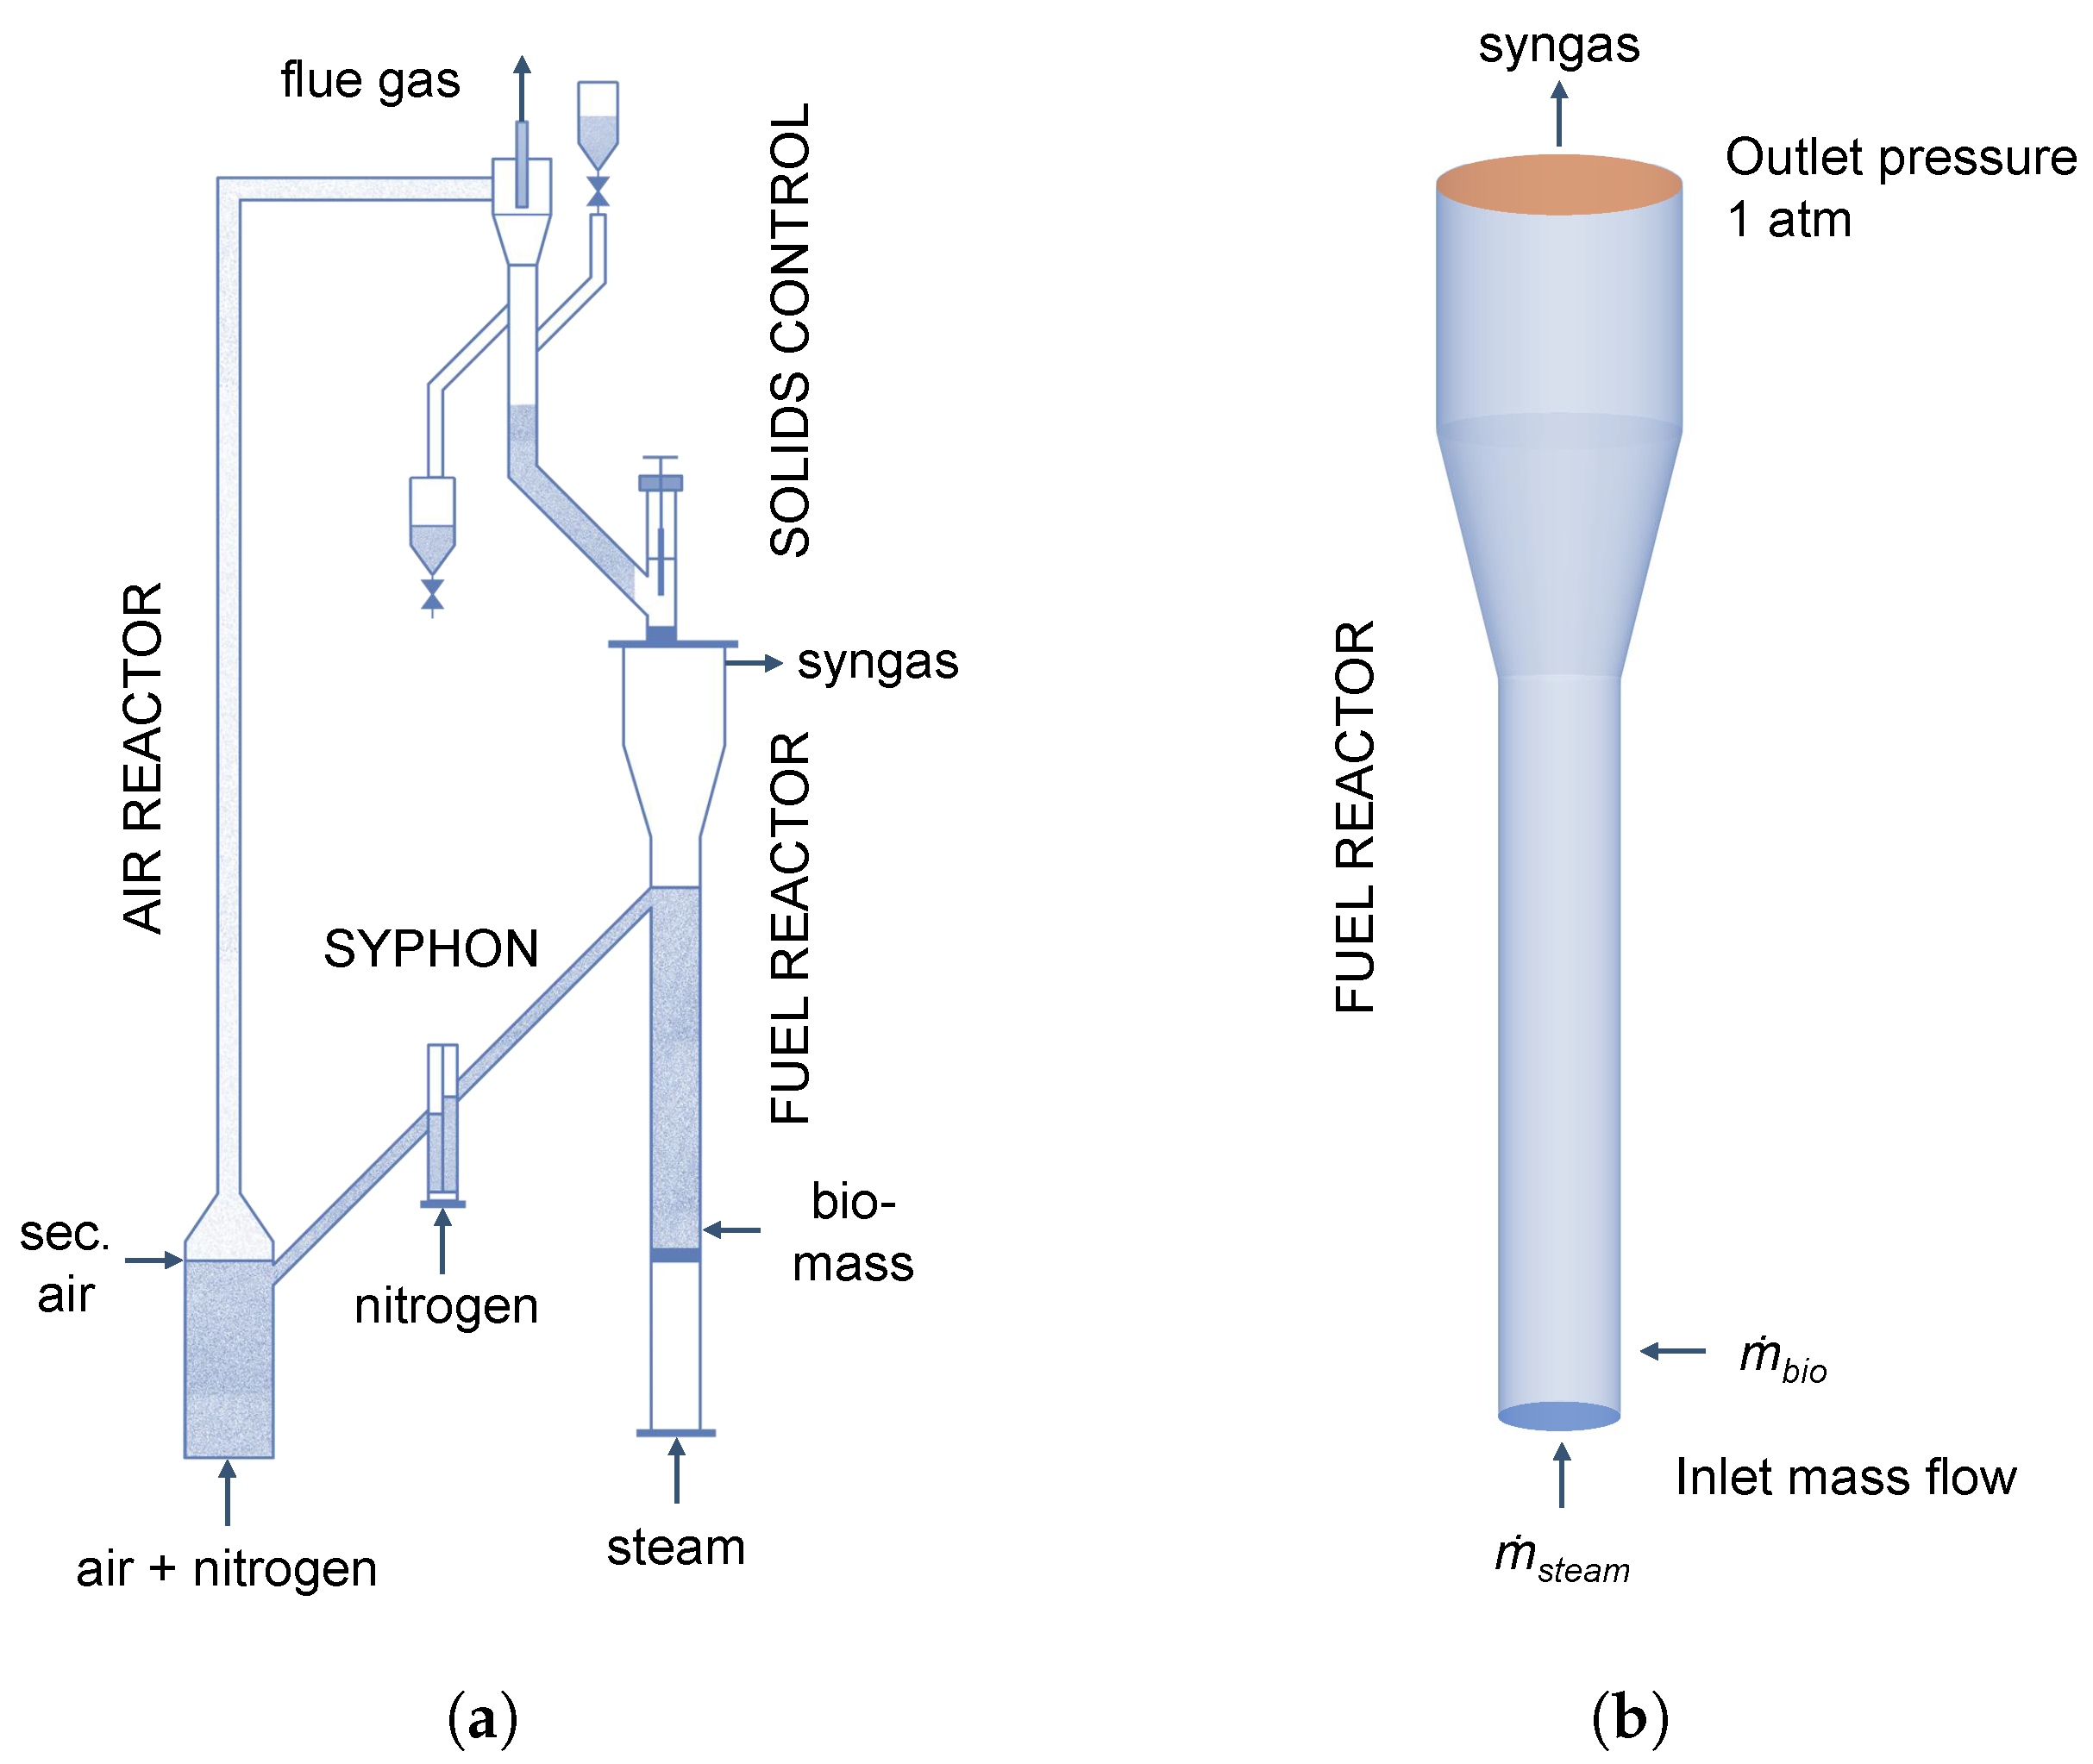
The syngas production from biomass is realized in a plant comprising two interconnected fluidized beds. A schematical representation is shown in Figure 3a. The two fluidized beds are separated using loop-seals to prevent a dilution of the produced syngas in the fuel reactor with flue gas from the air reactor. The heat for the gasification is provided by the circulation of quartz sand as bed material. The air reactor is fluidized with air to burn residual char, while the fuel reactor is fluidized with steam for the gasification of biomass. The biomass is introduced using a screw feeder at the bottom of the fuel reactor, which is constructed as a rectangular spouted bed with a height of 1500 mm, width of 230 mm, and depth of 40 mm. At the bottom, a 60° conical distributor is connected to a 20 mm tube, where steam and biomass are introduced. A detailed description of the experimental plant is given in the work of Song et al. [6].
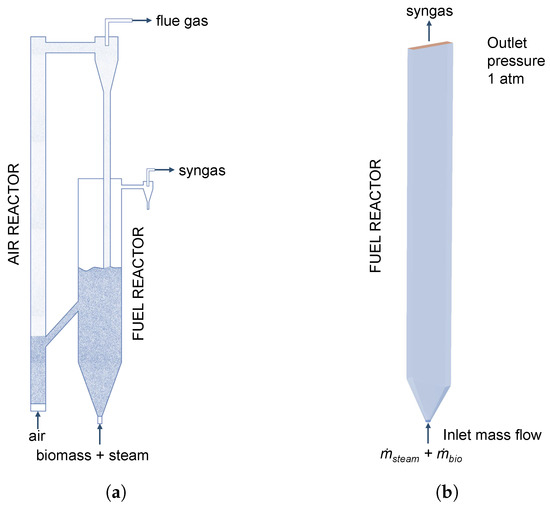
Figure 3.
(a) Schematic representation of the experimental plant adopted from Song et al. [6]. (b) Simulation geometry of the fuel reactor.
It has to be noted that only the fuel reactor is simulated analogously to similar studies in the literature [16,28,29,47]. The 3D simulation geometry is shown in Figure 3b and the built-in mesh generator in Barracuda VR® 21.0 for structured grids using hexahedral elements was used to generate the grid.
All operating parameters such as the reactor temperature, mass flow rates, and the steam-to-biomass ratio are specified according to the experimental data given by Song et al. [6]. Furthermore, the wall temperature and initial temperature for quartz sand as bed material is set to the operating temperature of the reactor. Steam is introduced at the reactor temperature as well, while the biomass is fed at 300 K. The mass flow rate of biomass is constant at 3.0 kg h−1, while the steam flow rate is varied between 2.4 and 3.6 kg h−1 resulting in a steam-to-biomass ratio between 0.8 and 1.2, depending on the case.
Quartz sand was used as bed material enabling the heat transfer between the air and fuel reactor. The sand has a sauter mean diameter of 350 μm, solid density of 2600 kg m−3, and a total weight of 11 kg was used. Pine wood was used as biomass with a sauter mean diameter of 1.5 mm and density of 470 kg m−3 [6]. The proximate analysis of the biomass is given in Table 5.
Table 5.
Proximate analysis for pine wood given by Song et al. [6].
The input parameters for Barracuda VR® 21.0 are given in Table 6. The particle-to-wall coefficients are adopted from Chen et al. [17] and Kraft et al. [4], while the close-pack fraction for quartz sand is taken from Wytrwat et al. [54]. The simulation of the spouted bed was performed for 40 s and the average of the syngas composition was calculated from the last 20 s with an output frequency of 0.001 Hz. In the experiments, an offline analysis of the syngas species was performed and steam was condensed and removed before the analysis. This means that the dry syngas in the experiments is composed of H2, O2, Ar (as tracer gas), CO, CO2, CH4, and CxHy, while the dry syngas in the simulations is only composed of the main gas species H2, CO, CO2, and CH4, due to the assumption that methane is the only hydrocarbon species, as described in Section 2.2.1.
Table 6.
Parameters for the simulation of the spouted bed.
3.2. Results and Discussion
3.2.1. Grid Study
At first, a grid study was performed to find a suitable grid resolution. The cell number and typical cell dimensions of the investigated grids are given in Table 7. For the grid study, the bed mass of the quartz sand had to be approximated. This approximation is necessary due to the fact that only the total bed mass of 11 kg for both the AR and FR is known [6]. The bed mass in the FR was approximated to be 8 kg. Therefore, the influence of the bed mass is investigated and discussed in Section 3.2.2. The grid study was performed at a reactor temperature of 820 °C and a steam-to-biomass ratio of 1.2.
Table 7.
Cell number and typical cell dimensions of the investigated grids for the simulation of the spouted bed.
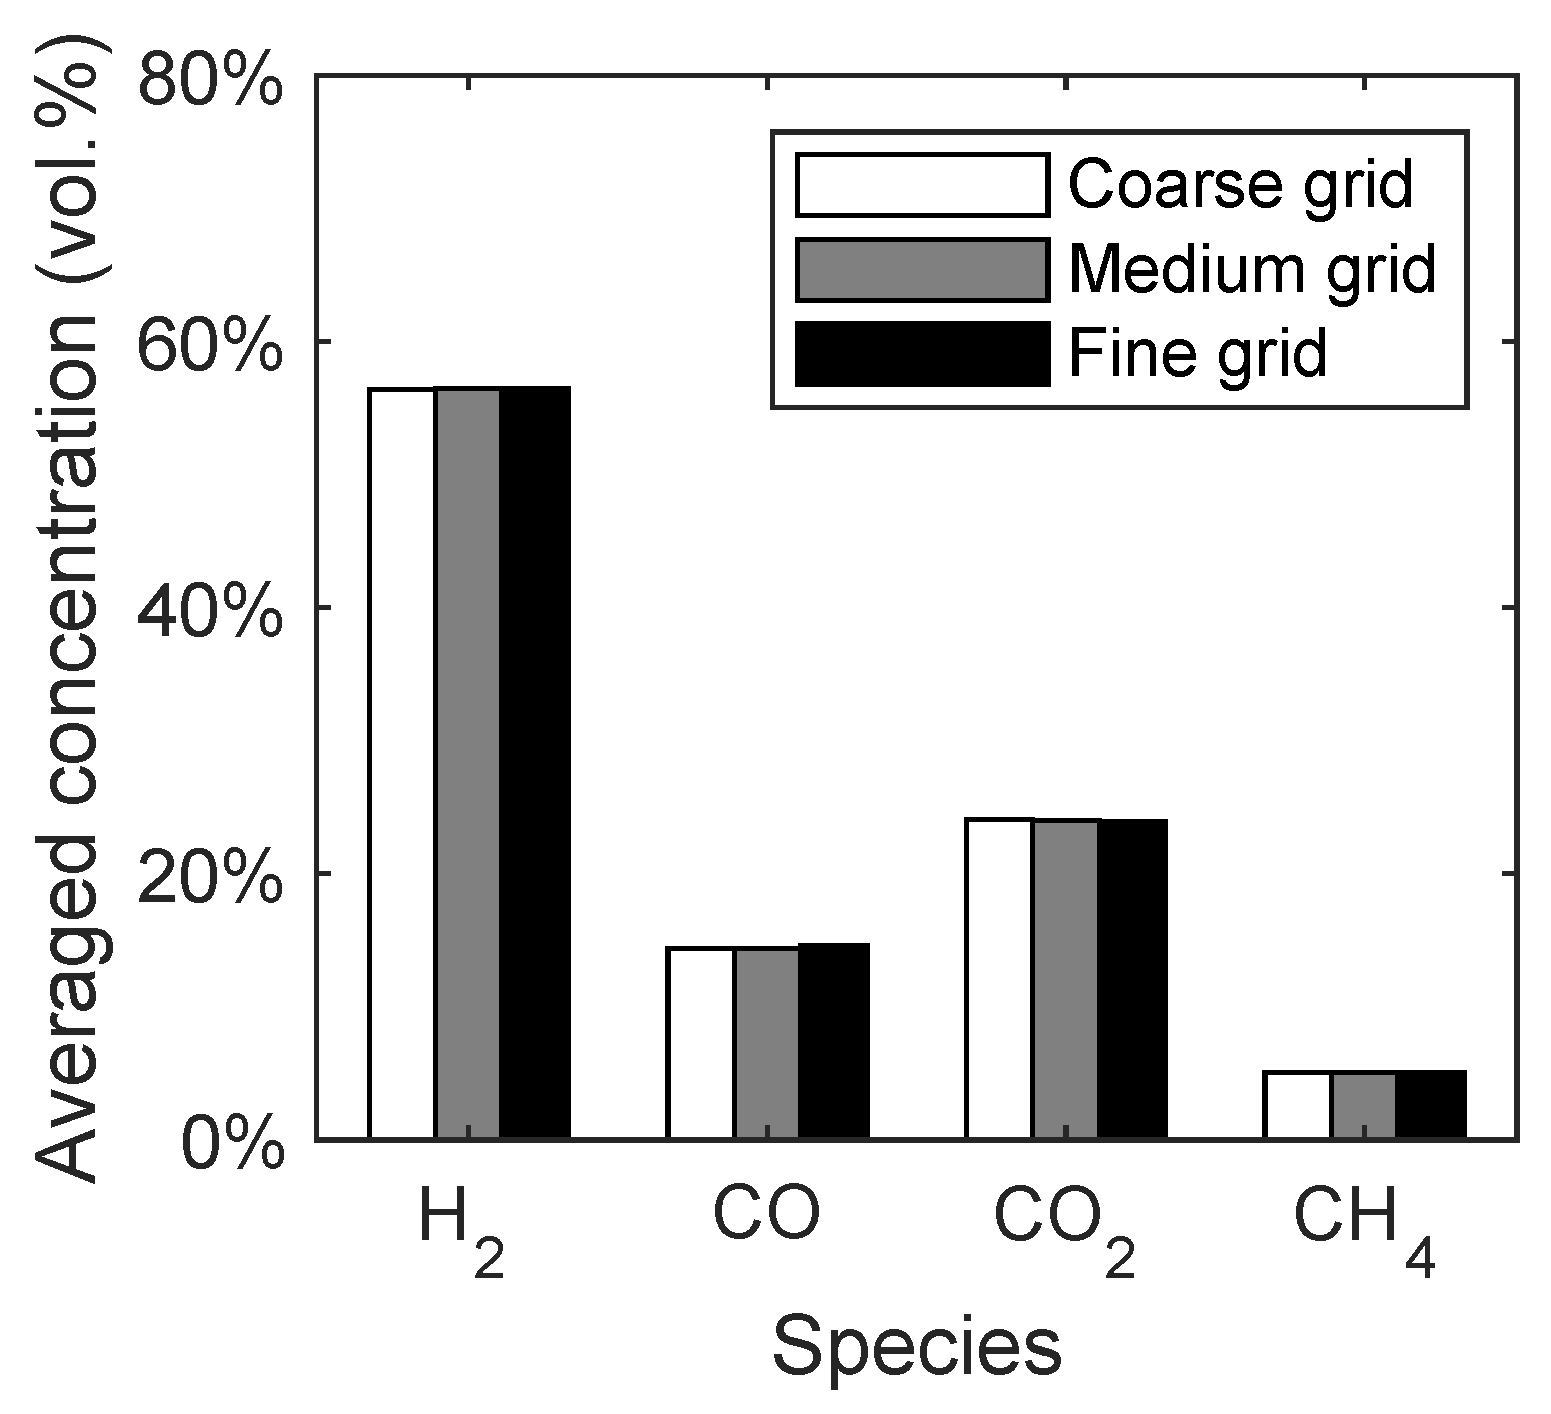
The syngas composition was chosen as a macroscopic quantity to investigate the influence of the grid resolution. In Figure 4, the averaged concentrations of the main syngas species are given with respect to the different grid resolutions. It can be seen that the changes in the syngas composition depending on the grid resolution are negligible. This means that already the coarse grid would have been sufficient for the simulation of the reaction kinetics. However, the medium grid was chosen for the further investigations due to a better representation of the conical distributor.

Figure 4.
Syngas composition of the spouted bed depending on the grid resolution.
3.2.2. Influence of Bed Mass
As already stated in Section 3.2.1, the bed mass in the fuel reactor had to be approximated because only the total bed mass of 11 kg is known. Therefore, the bed mass is varied in the range of 5 kg to 11 kg and the averaged gas species concentrations depending on the bed mass are given in Figure 5. It should be noted that the influence of the bed mass was not discussed in similar studies [28,29,50].
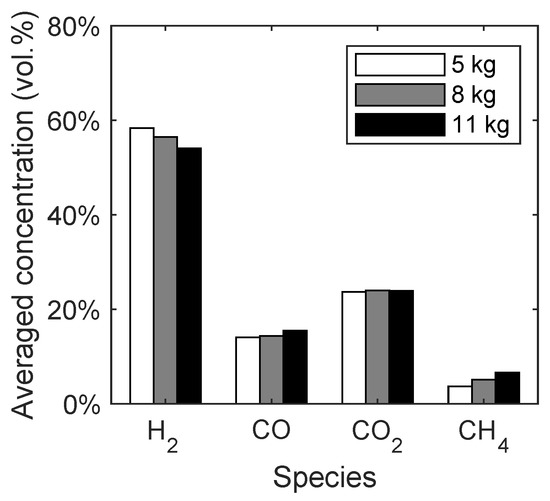
Figure 5.
Syngas composition depending on the bed mass of quartz sand in the spouted bed.
With increasing bed mass, the concentration of hydrogen decreases, while the methane and carbon monoxide concentrations increase. The concentration of carbon dioxide stays constant. This trend is mainly caused by the lower residence time of the released methane from the biomass, resulting in a lower conversion of methane to hydrogen from the methane reforming reaction (R3). Since the total bed mass of quartz sand is 11 kg, the following studies will be performed with a bed mass of 8 kg, because it is expected that more particles are present in the fuel reactor compared to the air reactor. It should be noted that the biomass particles accumulate at the bed surface, which can be seen in Figure 6c. Therefore, the volatiles have a lower residence time in the reactor due to the elevated height, where most of the devolatilization takes place.
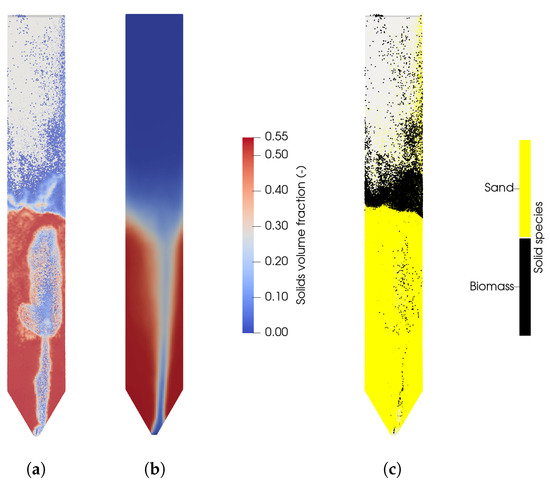
Figure 6.
(a) Instantaneous solid volume fraction in the fuel reactor at t = 40 s. (b) Averaged solids concentration. (c) Instantaneous distribution of biomass and sand in the fuel reactor at t = 40 s.
In Figure 6a the instantaneous, and in Figure 6b the average, solids volume fraction is shown with a bed mass of 8 kg. It can be seen that the particle distribution is not symmetrical, which is presumably due to the grid resolution of the conical distributor. It is expected that a higher grid resolution would result in a more symmetrical distribution of the solids, but a higher grid resolution is not necessary with respect to the gasification reactions as observed in the previous section. This is also in line with the expectation of a high solids mixing. The introduction of steam causes larges bubbles coalescing with increasing bed height. The eruption of the bubbles at the bed surface leads to a high acceleration of the particles, which are falling down at the reactor walls. The existence of slugs and big bubbles with oval shapes was also observed by Ku et al. [28].
3.2.3. Influence of Reactor Temperature
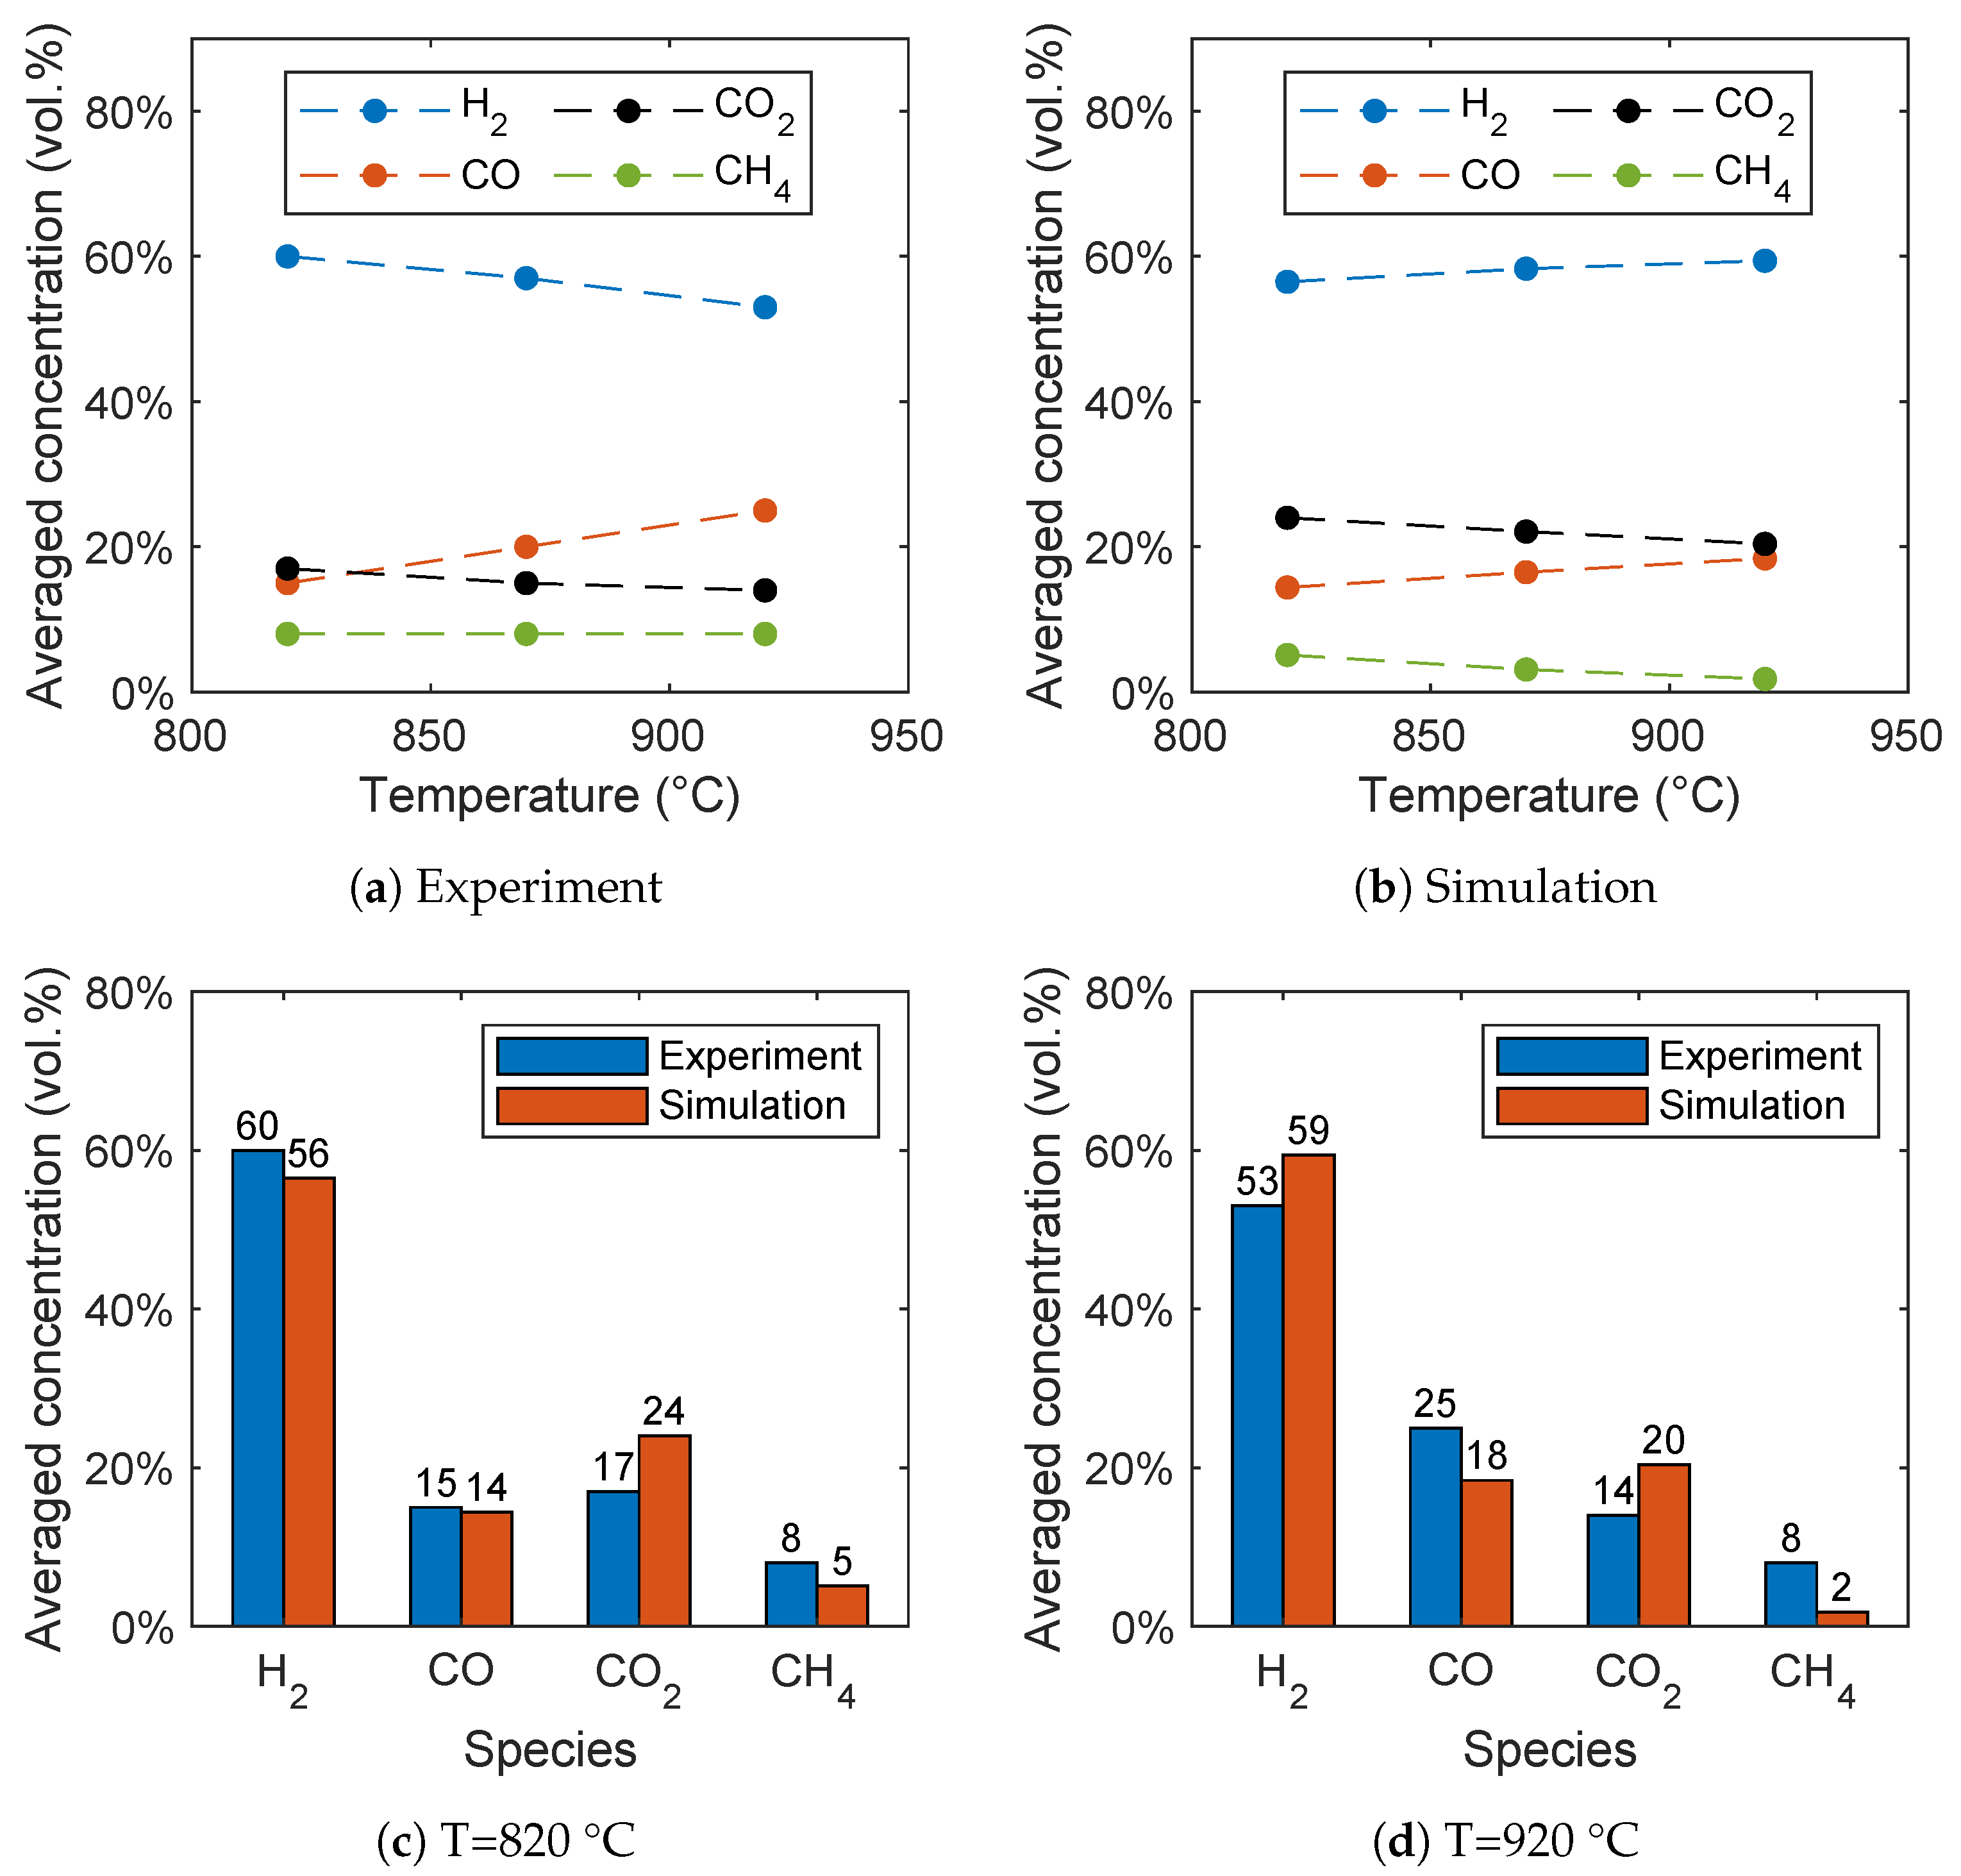
The biomass gasification is significantly influenced by the reactor temperature as shown by Song et al. [6] in the range between 820 °C and 920 °C. In general, the results of the simulations are in good agreement with the experimental data as shown in Figure 7b and Figure 7a, respectively. Hydrogen is the dominant species with a concentration between 53 and 60 vol.%. The concentration of carbon monoxide and carbon dioxide are comparable and in the range between 14 and 25 vol.%, while methane has the lowest concentration.
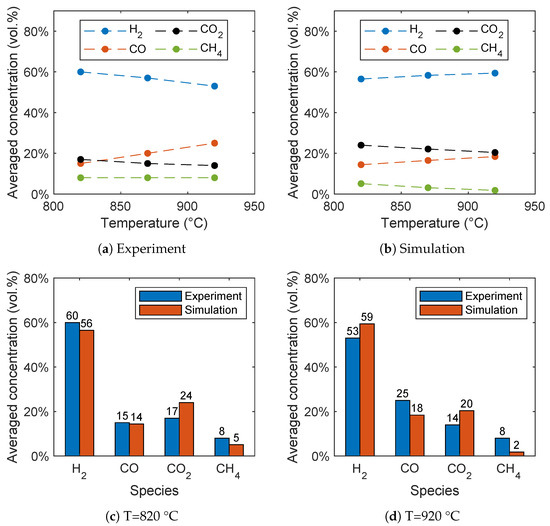
Figure 7.
Influence of the reactor temperature on the syngas composition for (a) the experimental data given by Song et al. [6] and (b) the simulation results. Comparison of the syngas composition for (c) 820 °C and (d) 920 °C.
With increasing temperature the CO concentration increases, while the CO2 concentration decreases. Contrary to the experiments, the H2 concentration increases in the simulations with increasing temperature. This is presumably due to the methane reforming reaction (R3), because an overprediction of the methane conversion results in an overprediction of the hydrogen concentration with increasing temperature. The overprediction of the hydrogen concentration with increasing temperature was also observed in similar studies [28,29], as well as the underprediction of the methane concentration [28].
A direct comparison of the simulation results with the experimental data is given in Figure 7c for 820 °C and Figure 7d for 920 °C. The comparison shows a good agreement despite the fact that not all trends are predicted correctly. The deviations from the experiments are due to the simplifications, such as the reduced reaction network, the neglection of tars, and the simplified pyrolysis mechanism. It has to be noted that no fitting of the reaction kinetics from the literature have been performed. Furthermore, no measurement errors of the experimental are available due to the time-intensive experiments. More accurate results could be achieved by a fitting of the reaction rates, but this is beyond the scope of the work. Finally, no unified set of equations for the gasification of biomass is available in the literature and thus errors cannot be avoided.
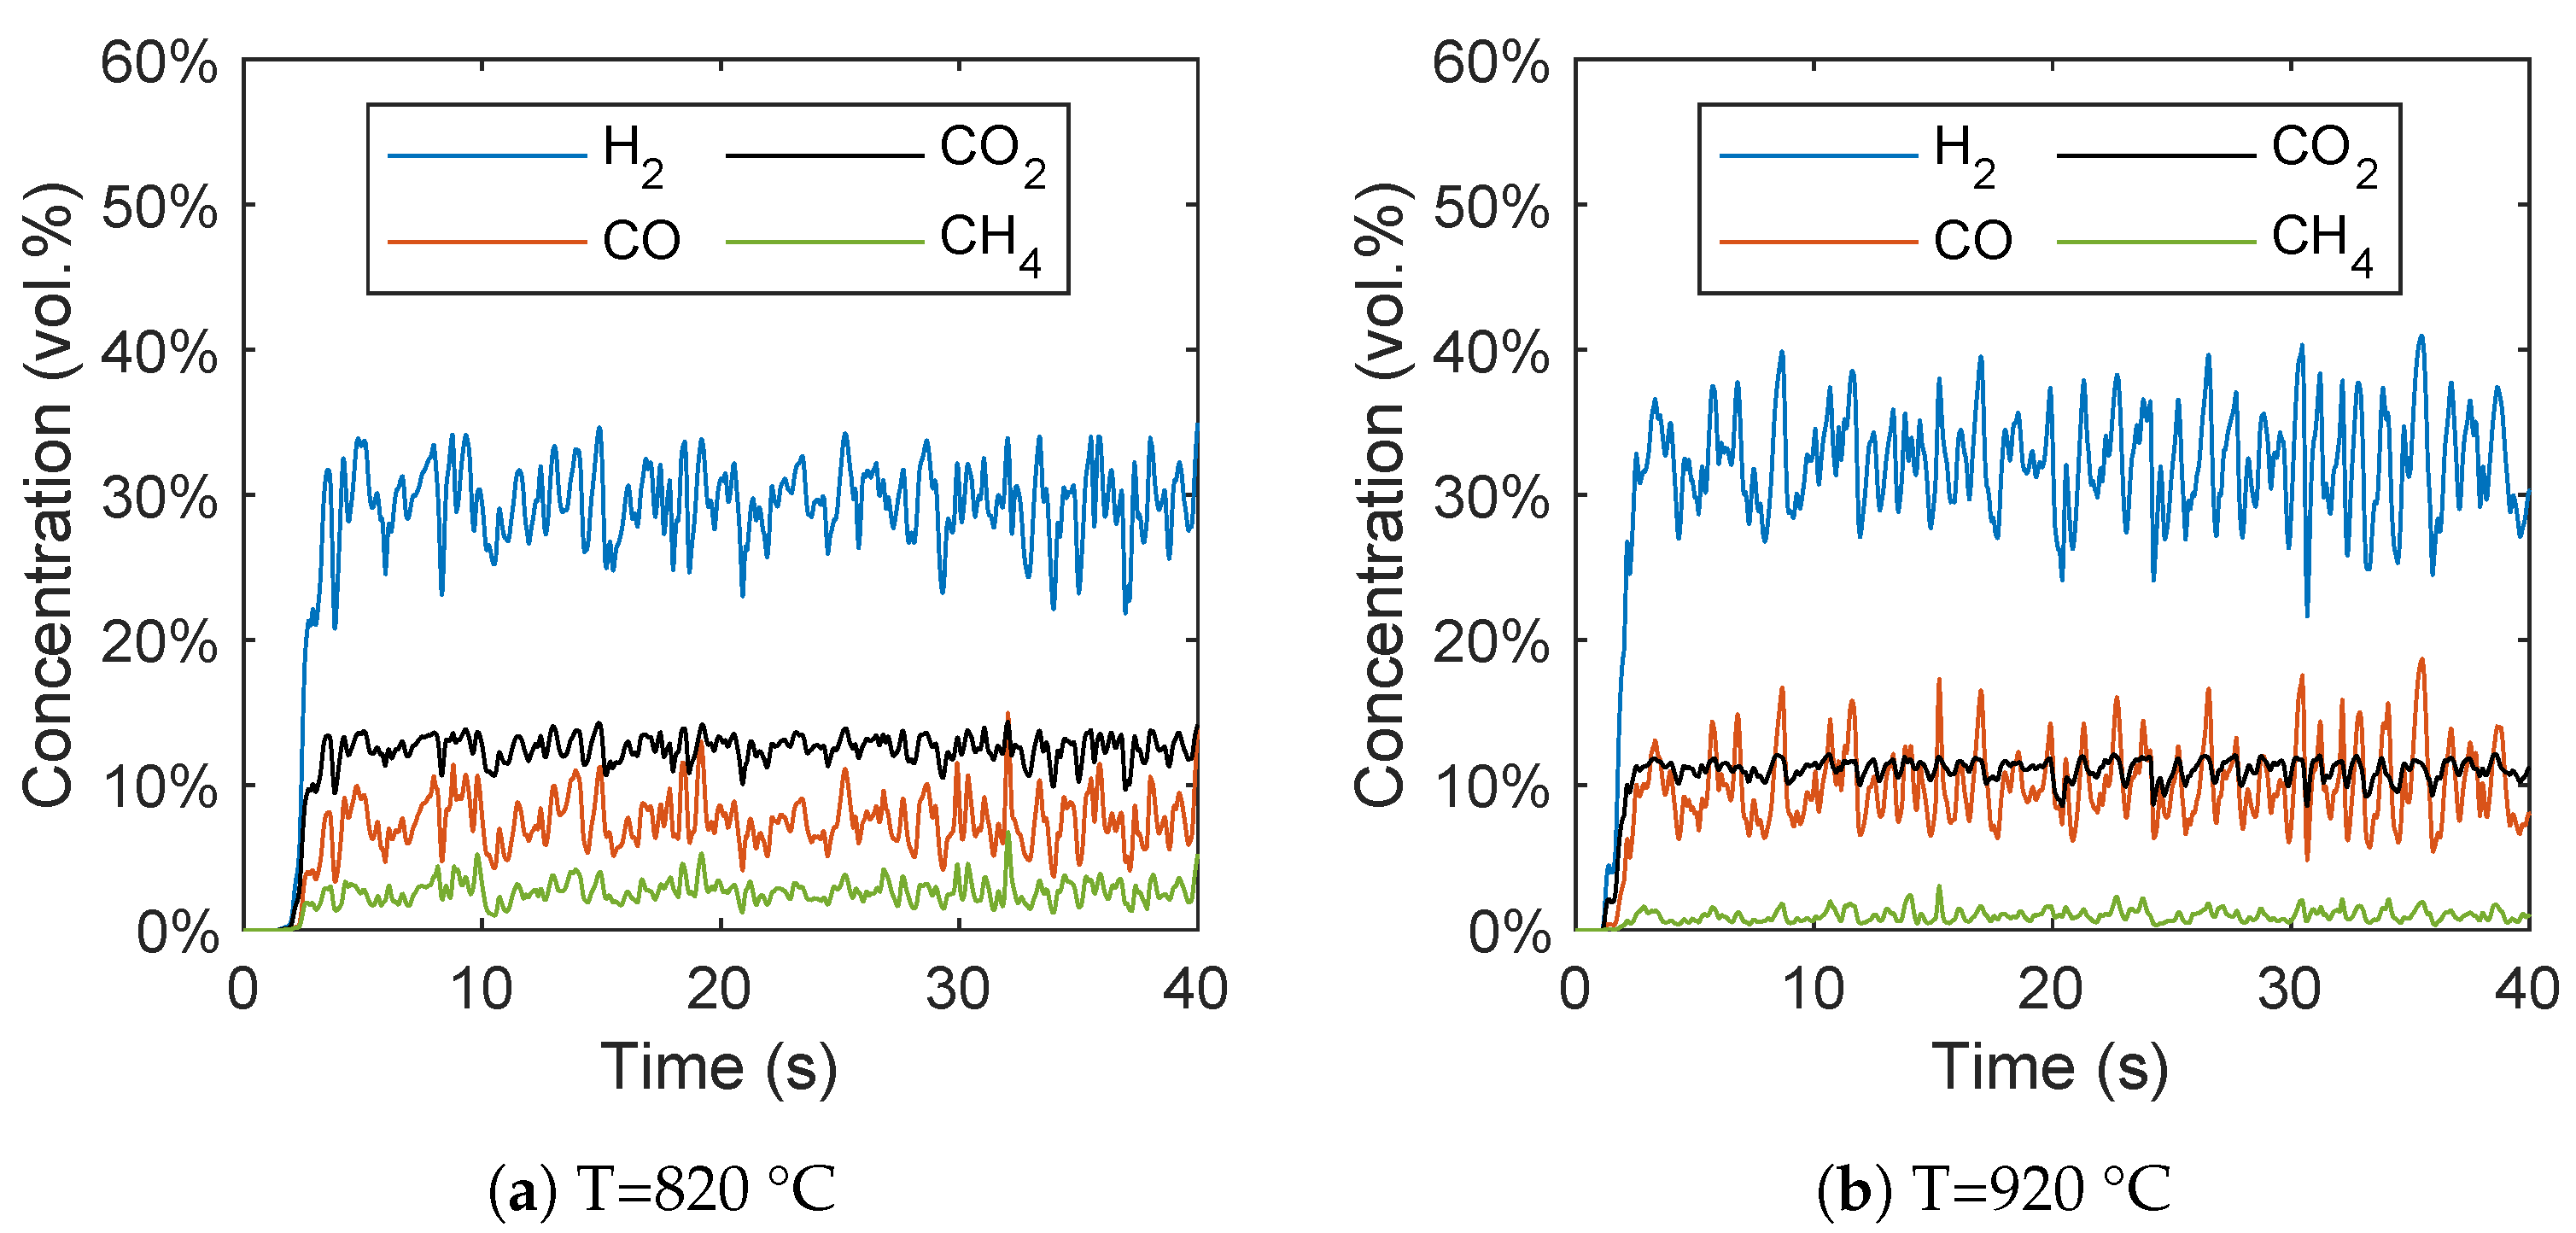
In Figure 8, the concentrations of the gas species are plotted over time. It can be seen that after a short start-up time of around 5 s, a quasi-stationary state can be observed. The short start-up time is in line with the expectations due to the strong mixing of biomass and the bed material, which results in a fast increase in the biomass temperature that was already observed by Ku et al. [28]. It should be noted that in contrast to the averaged concentrations, these concentrations are not based on a dry syngas.
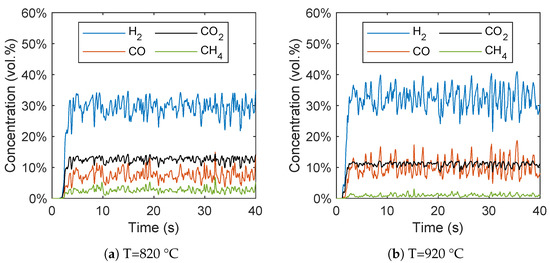
Figure 8.
Gas species concentration plotted over time at reactor temperatures of (a) 820 °C and (b) 920 °C.
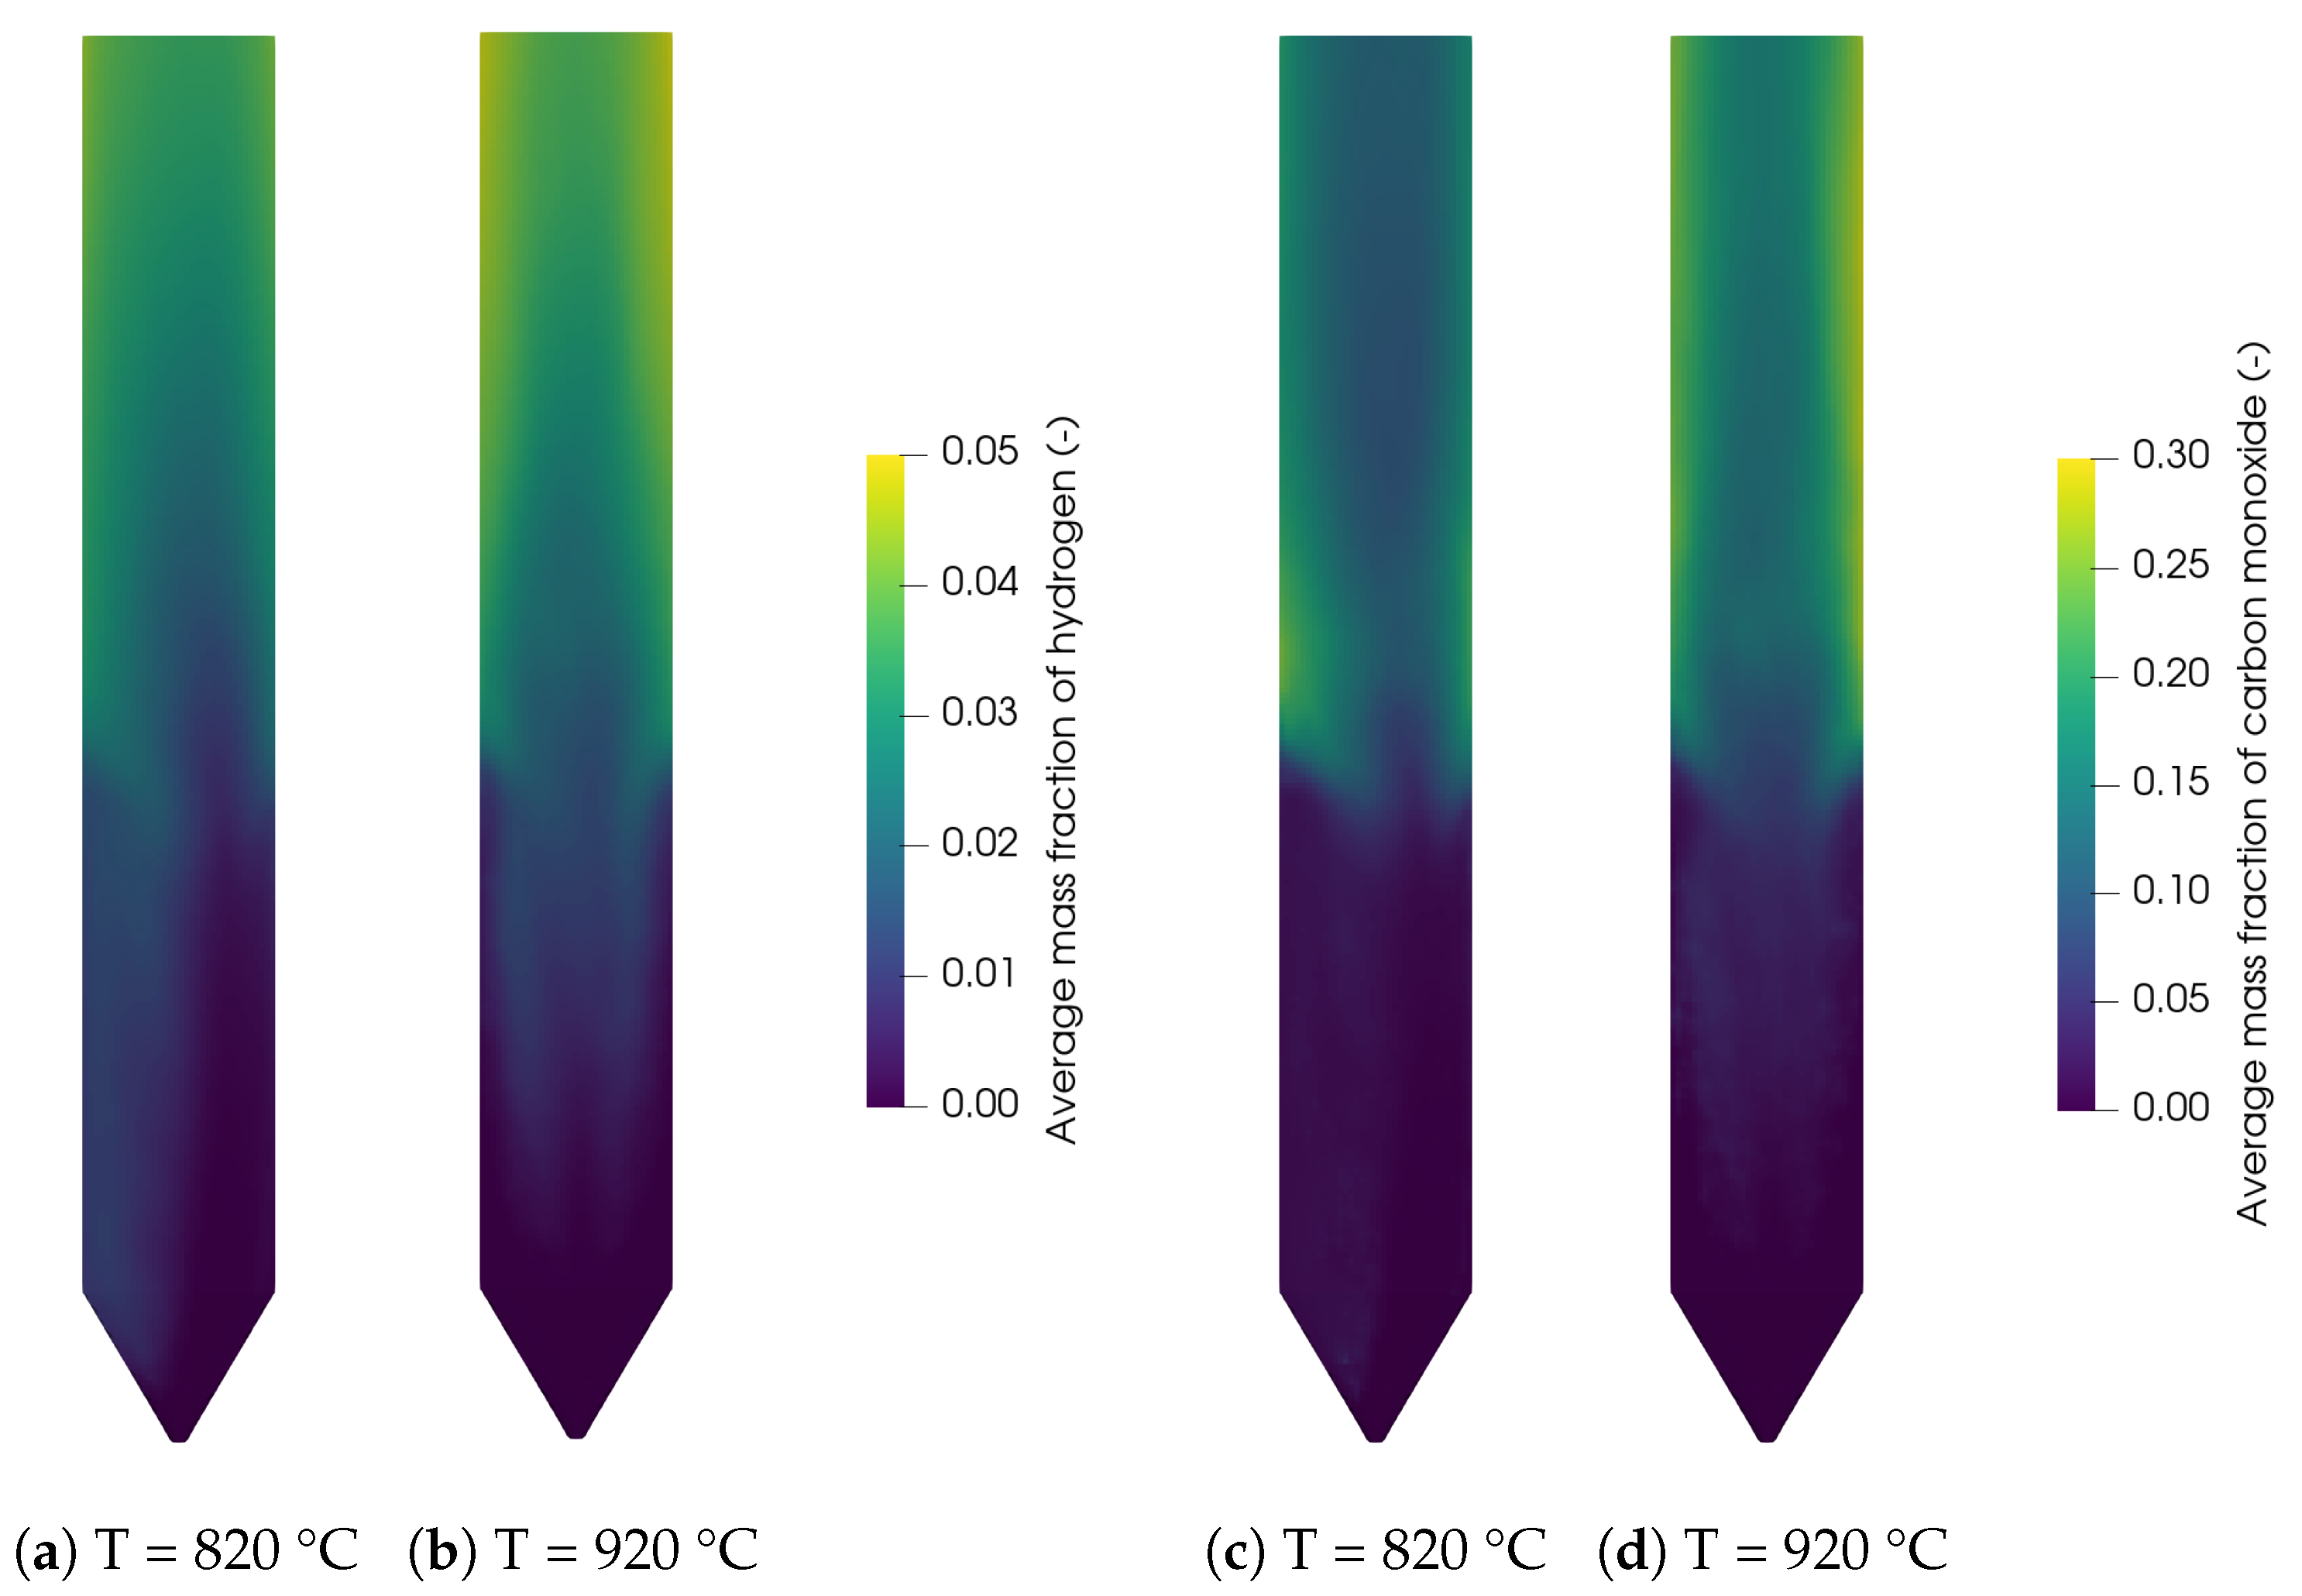
The contour plots for the main syngas species H2 and CO are shown in Figure 9 for 820 °C and 920 °C. It can be seen that the concentrations are low in the reactor bottom, where the biomass is injected. The temperature of the biomass inside the bed is around 600–800 K but the density of the biomass is still close to the initial density, meaning that the devolatilization in this region is not far progressed. The concentrations of H2 and CO increase with increasing bed height and at the reactor walls. This is due to the accumulation and thus the longer residence time of the particles at the bed surface and walls as shown in Figure 6c. Additionally, methane and carbon monoxide react with steam in the freeboard region through the methane reforming reaction (R3) and the water-gas shift reaction (R2) to hydrogen and carbon dioxide. Furthermore, the increasing concentration due to the increasing reactor temperature can be observed. All of these finding are in agreement with the results of Qi et al. [29].

Figure 9.
Contour plots of hydrogen at (a) 820 °C and (b) 920 °C, and carbon monoxide at (c) 820 °C and (d) 920 °C.
3.2.4. Influence of Steam-to-Biomass Ratio
The influence of the steam-to-biomass ratio on the syngas composition is given in Figure 10. It can be seen that the trends for the gas species are in good agreement with the experimental data. The hydrogen and carbon dioxide concentrations increase with increasing steam-to-biomass ratio, while the carbon monoxide concentrations decrease. This is presumably due to the water-gas shift reaction (R2) because a higher steam-to-biomass ratio favors the reaction products, namely hydrogen and carbon dioxide. In contrast to the experiments, the methane concentration is not influenced by the steam-to-biomass ratio.
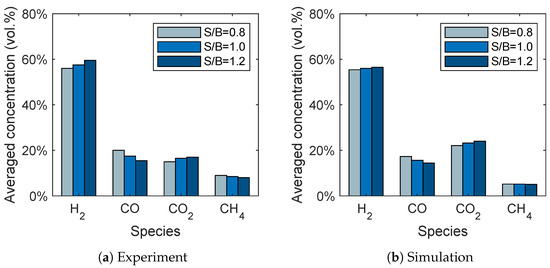
Figure 10.
Influence of the steam-to-biomass ratio on the syngas composition for (a) the experimental data given by Song et al. [6] and (b) the simulation results.
4. Biomass Gasification with Oxygen Carrier
In the previous section biomass steam gasification in a fluidized bed was successfully modeled using a reduced reaction network proposed by Song et al. [6]. Therefore, in this section, the gasification reactions will be coupled with the oxygen carrier kinetics for ilmenite given in Section 2.2.3 and validated against experimental data for biomass chemical looping gasification given by Condori et al. [5]. The influence of the reactor temperature and oxidation degree of the oxygen carrier on the syngas composition and syngas yield will be investigated and discussed.
4.1. Experimental and Simulation Setup
The biomass chemical looping gasification is realized in a lab-scale system of two interconnected fluidized beds, namely the air reactor and the fuel reactor. Analogously to the plant described in Section 3, loop-seals are used to prevent a dilution of the syngas with flue gas. In contrast to the previous section, ilmenite is used as bed material. This oxygen carrier provides the heat and lattice oxygen for the biomass gasification. In this system, a riser acts as an air reactor for the transport of solids to the fuel reactor and the oxidation of the oxygen carrier, while a solids valve is used to measure and control the external circulation rate from the air to the fuel reactor. The fuel reactor with a height of 500 mm and an inner diameter of 50 mm is operated as bubbling fluidized bed. Biomass is fed above the distributor plate using a screw feeder to increase the contact time of biomass and volatiles with the oxygen carrier. Details regarding the experimental set-up can be found in the works of Cuadrat et al. [55] and Condori et al. [5]. A schematic representation of the experimental set-up is shown in Figure 11a. The 3D simulation geometry is given in Figure 11b and, analogously to Section 3, the built-in mesh generator in Barracuda VR® 21.0 for structured grids using hexahedral elements was used to generate the grid.
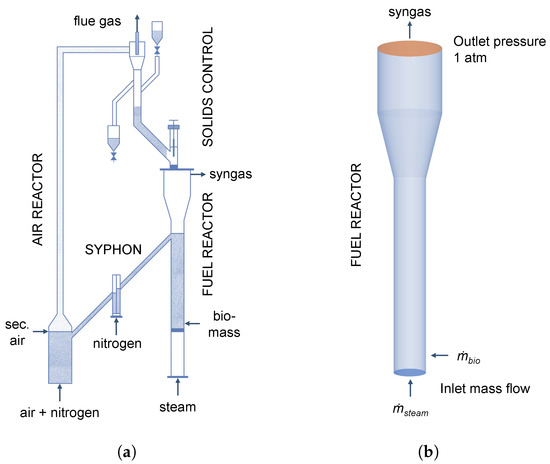
Figure 11.
Schematic representation of the (a) experimental set-up adapted from Condori et al. [5] and (b) simulation geometry for the investigation of biomass gasification using ilmenite as oxygen carrier.
It has to be noted that only the fuel reactor is simulated analogously to Section 3. Due to the lack of experimental data regarding specific operation parameters, such as the external solid circulation rate, no fresh oxygen carrier particles are fed to the reactor in the simulation in contrast to the experiment, where the oxygen carrier circulates between the two reactors. However, biomass and steam are fed continuously into the reactor analogously to the experiment. It is assumed that the influence of the consumption of Fe2O3 of the oxygen carrier is small due to the short simulation period. This will also be discussed in Section 4.2.2.
The initial conditions are set close to the experimental conditions in the quasi-steady state. Analogously to Section 3, the initial temperature for the walls and ilmenite are set to the reactor temperature, which is varied between 820 °C and 940 °C. A steam-to-biomass ratio of 0.6 is chosen analogously to the experiments [5] with a biomass flow rate of = 0.31 kg h−1 and a steam flow rate of = 0.19 kg h−1. Milled pine wood pellets are used as biomass with a particle size between 0.5–2 mm. Ilmenite particles with a particle size between 100–300 μm are used as bed material with a bed mass in the fuel reactor of about 0.8 kg, which corresponds to a bed height of 0.2 m [55]. The experimentally determined composition of ilmenite is given in Table 8. It should be noted that Fe2TiO5 and Fe2O3 can react with the gas species released due to the biomass pyrolysis [5]. Therefore, the ilmenite particles are modeled using the three components Fe2O3, FeO, and an ilmenite base, as performed by Parker [30].
Table 8.
Composition of the ilmenite oxygen carrier given by Condori et al. [5].
The input parameters for Barracuda VR® 21.0 are given in Table 9 analogously to Section 3. The simulation of the fluidized bed was performed for 20 s and the average of the syngas species was calculated from the last 5 s with an output frequency of 0.001 Hz.
Table 9.
Parameters for the simulation of biomass gasification using ilmenite as oxygen carrier.
4.2. Results and Discussion
4.2.1. Grid Study
Analogous to Section 3, a grid study was performed to find a suitable grid resolution. The cell number and typical cell dimensions of the investigated grids are given in Table 10. The dimensions are similar compared to the investigated grids of the spouted bed in Section 3.2.1. The grid study was performed at a reactor temperature of 880 °C and a steam-to-biomass ratio of 0.6.
Table 10.
Cell number and typical cell dimensions of the investigated grids for the simulation of biomass gasification using ilmenite as an oxygen carrier.
Again, the syngas composition was chosen as a macroscopic quantity to investigate the influence of the grid resolution. In Figure 12, the averaged concentration of the main syngas species are given depending on the grid resolution. It can be seen that the changes in the syngas composition are small and only observable from the coarse to medium grid. Therefore, the medium grid was chosen for the following simulations.
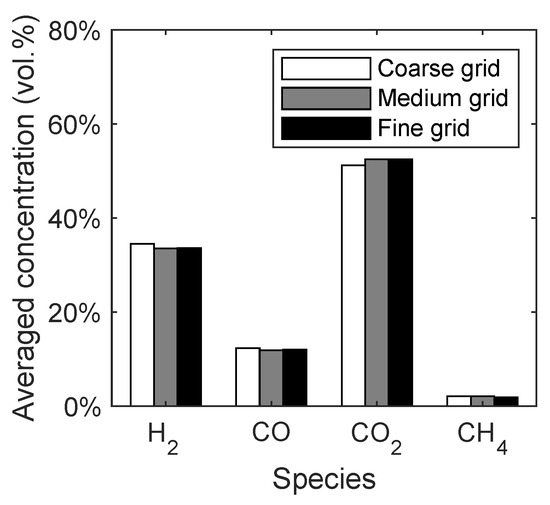
Figure 12.
Syngas composition of the lab-scale fluidized bed depending on the grid resolution.
4.2.2. Influence of Oxidation Degree
A new method for controlling the oxygen feed into the air reactor for BCLG was proposed by Condori et al. [5], which allows the investigation of the influence of the oxygen carrier’s oxidation degree. As already stated in Section 1, the oxygen carrier is operated in a reduced state for BCLG in contrast to CLC processes. Therefore, the oxygen-to-fuel ratio was varied by Condori et al. [5] resulting in different oxidation degrees of the oxygen carrier. The samples extracted from the fuel reactor showed an oxidation degree between 2.5% and 15%. The upper limit of the oxidation degree is defined by the full oxidation of the reacting components Fe2TiO5 and Fe2O3. The lower limit corresponds to the complete reduction of the reacting components to FeTiO3 and Fe3O4. In the simulations, Fe2O3 is assumed to be the only reacting component as stated in Section 4.1. Therefore, in the simulation, the initial mass fraction of the reacting component Fe2O3 is varied between 1.5 wt.% and 10 wt.%.
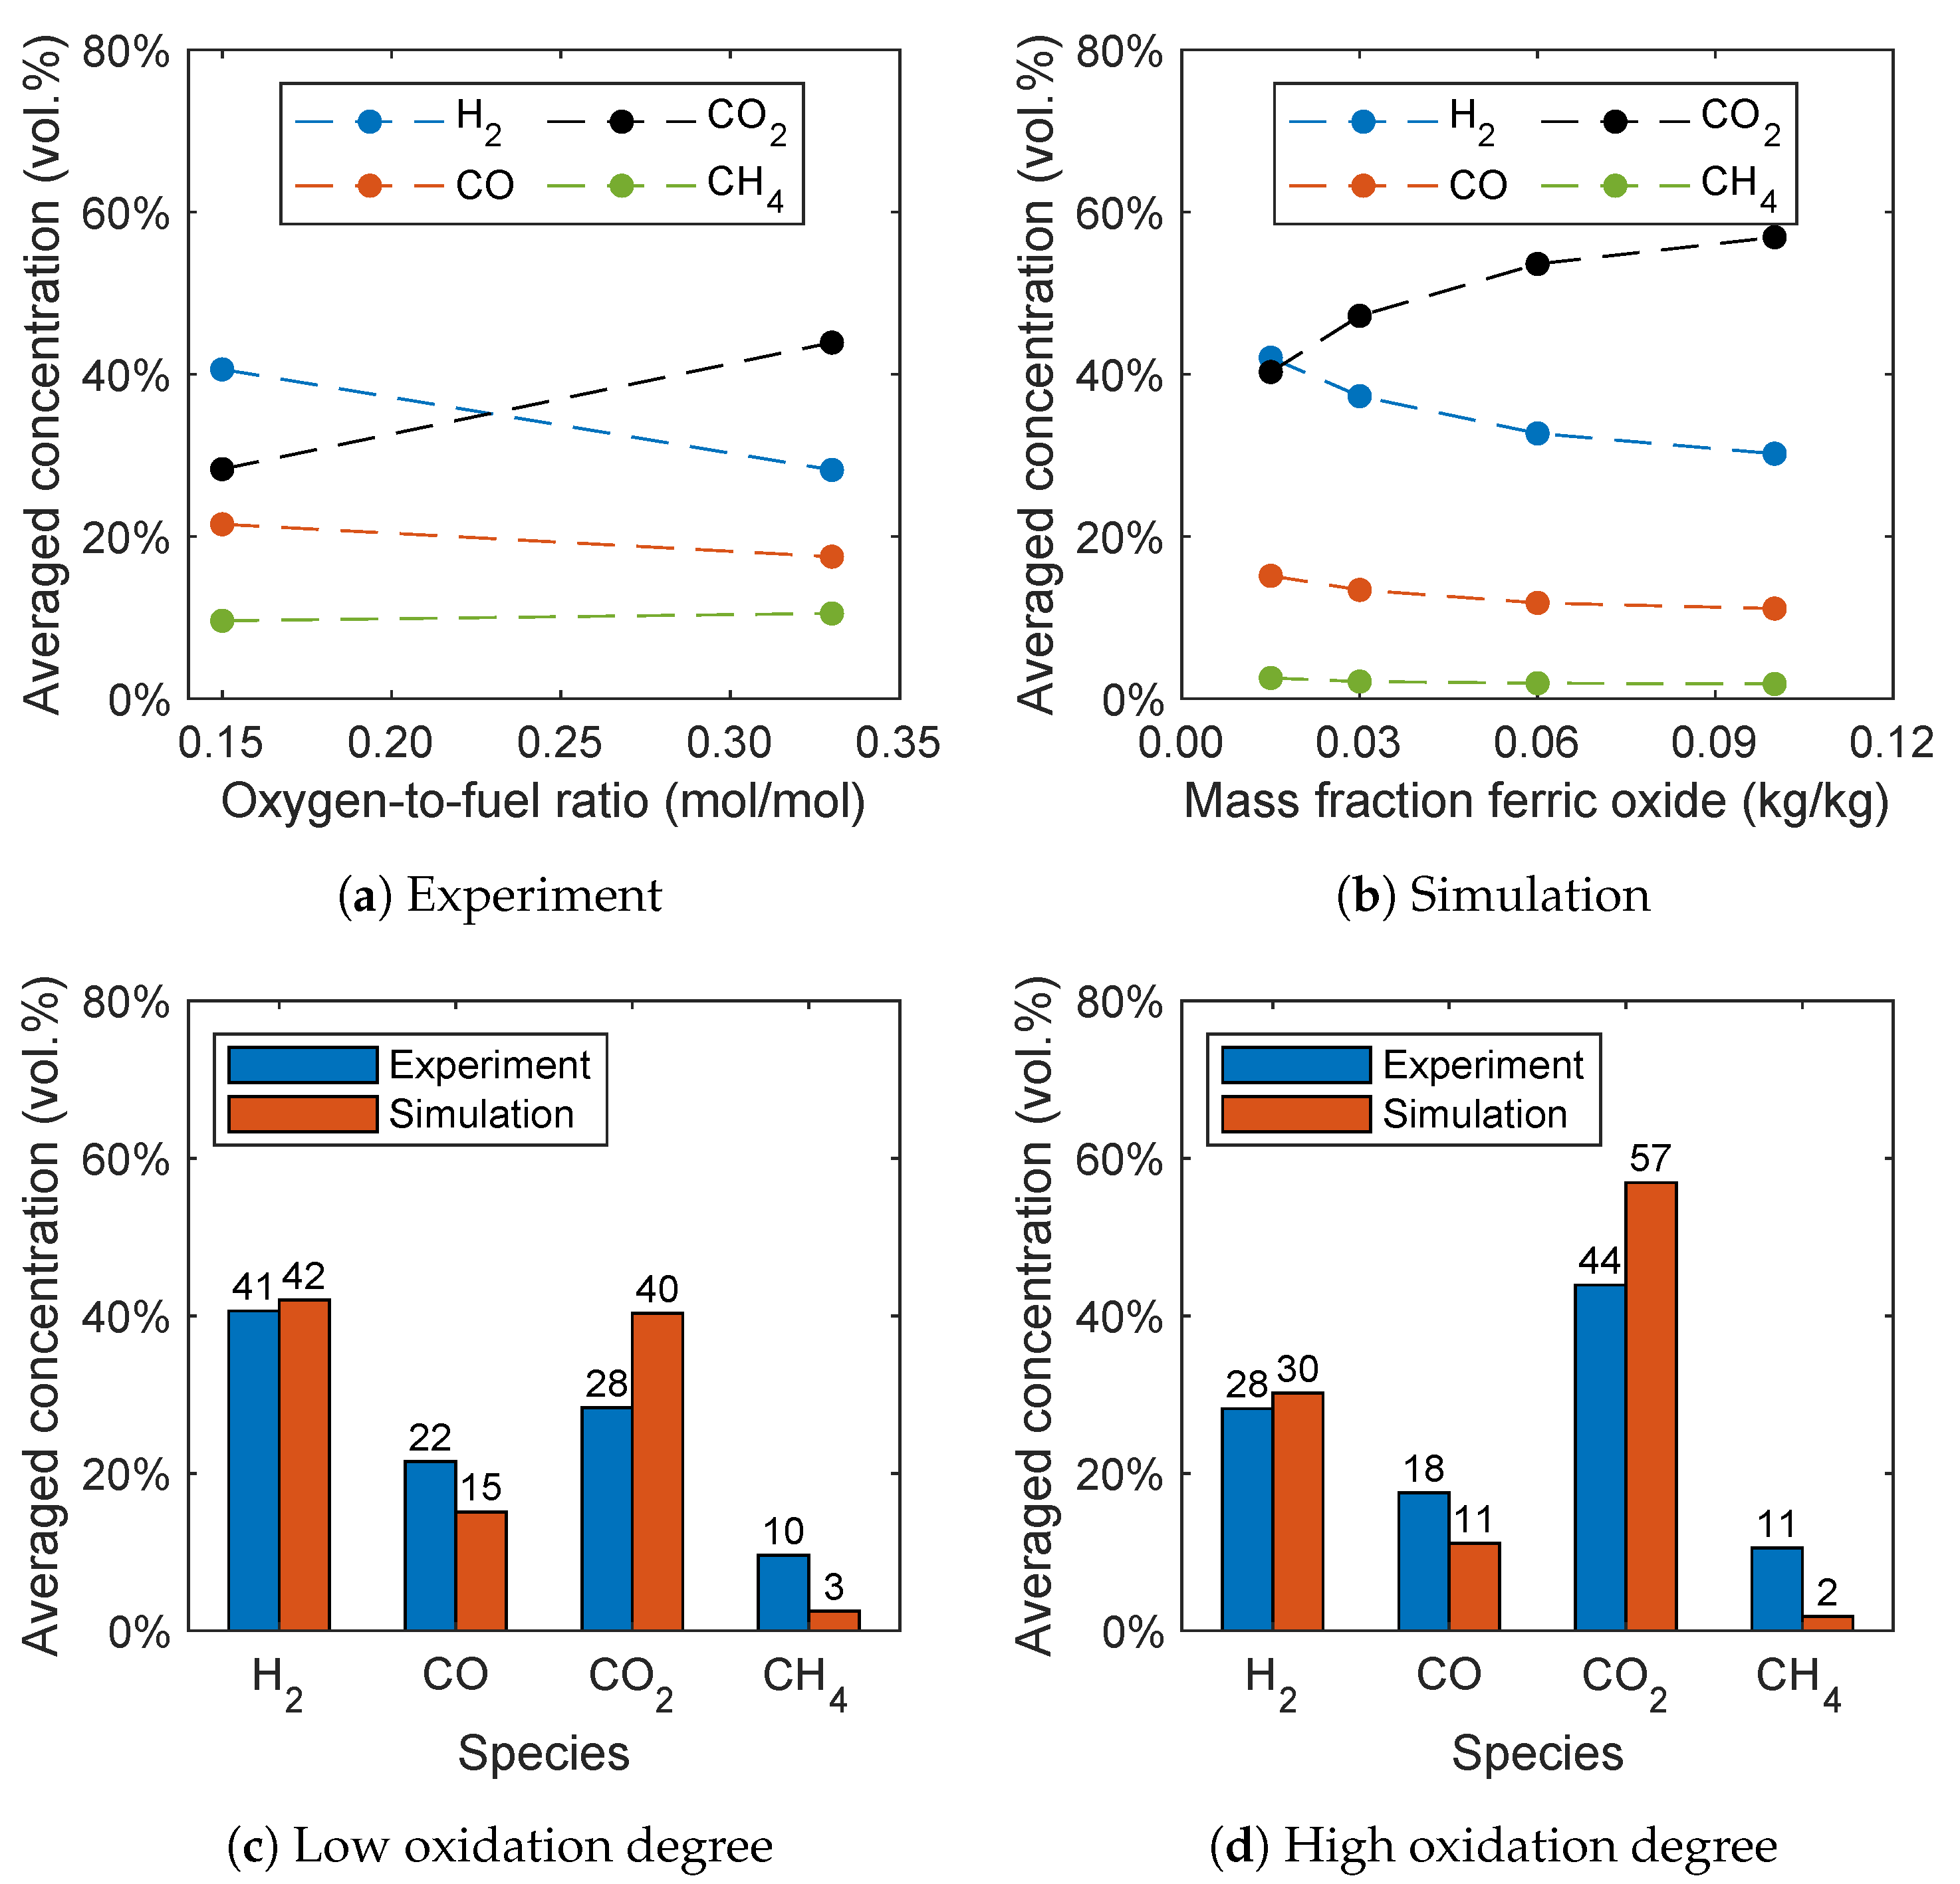
In Figure 13a,b, the influence of the oxidation degree on the syngas composition for the experiment and simulation is given. The simulation was performed at 940 °C with a steam-to-biomass ratio of 0.6, analogously to the experiments. It can be seen that the oxidation degree has a significant influence on the syngas composition. At a lower oxidation degree, hydrogen is the dominant species. With increasing oxidation degree, the hydrogen concentration decreases, while the carbon dioxide concentration significantly increases. This trend is also captured by the simulations, which is presumably due to the oxidation reactions (R6)–(R8). This leads to the conclusion that a higher quality syngas is obtained with a lower oxidation degree of the oxygen carrier confirming the experimental results. Furthermore, a slight decrease of the carbon monoxide concentration can be observed and the methane concentration stays almost constant with increasing oxidation degree. A decreasing hydrogen, carbon monoxide, and methane concentration, as well as an increasing carbon dioxide concentration, was also found by Ge et al. [11] with increasing oxygen carrier mass percentage in the fluidized bed using hematite as the oxygen carrier.
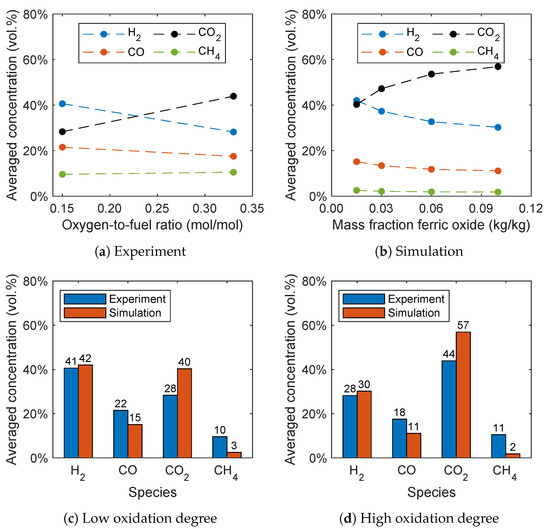
Figure 13.
Influence of the oxidation degree on the syngas composition for (a) the experimental data given by Condori et al. [5] and (b) the simulation results. Comparison of the syngas composition for a (c) low and (d) high oxidation degree.
Analogous to Section 3, the methane concentration is underpredicted. This is presumable due to the overprediction of the methane reforming reaction (R3) and the reaction of the oxygen carrier with methane. An overprediction of the methane conversion was also observed by Breault and Monazam [56] in Barracuda VR® using hematite as the oxygen carrier and applying the reaction kinetics given by Mendiara et al. [57]. Therefore, Breault and Monazam [56] fitted the reaction rates to yield better results, which is beyond the scope of this work. It should be noted that no fitting of the reaction kinetics was performed in this work.
A direct comparison of the simulation results with the experimental data is given in Figure 13c,d for a low and high oxidation degree. The methane and carbon monoxide concentrations are underpredicted, while the carbon dioxide concentration is overpredicted. Nevertheless, the results are in good agreement considering the simplifications already discussed in Section 3.2.3 and without fitting of the reaction kinetics given in the literature.
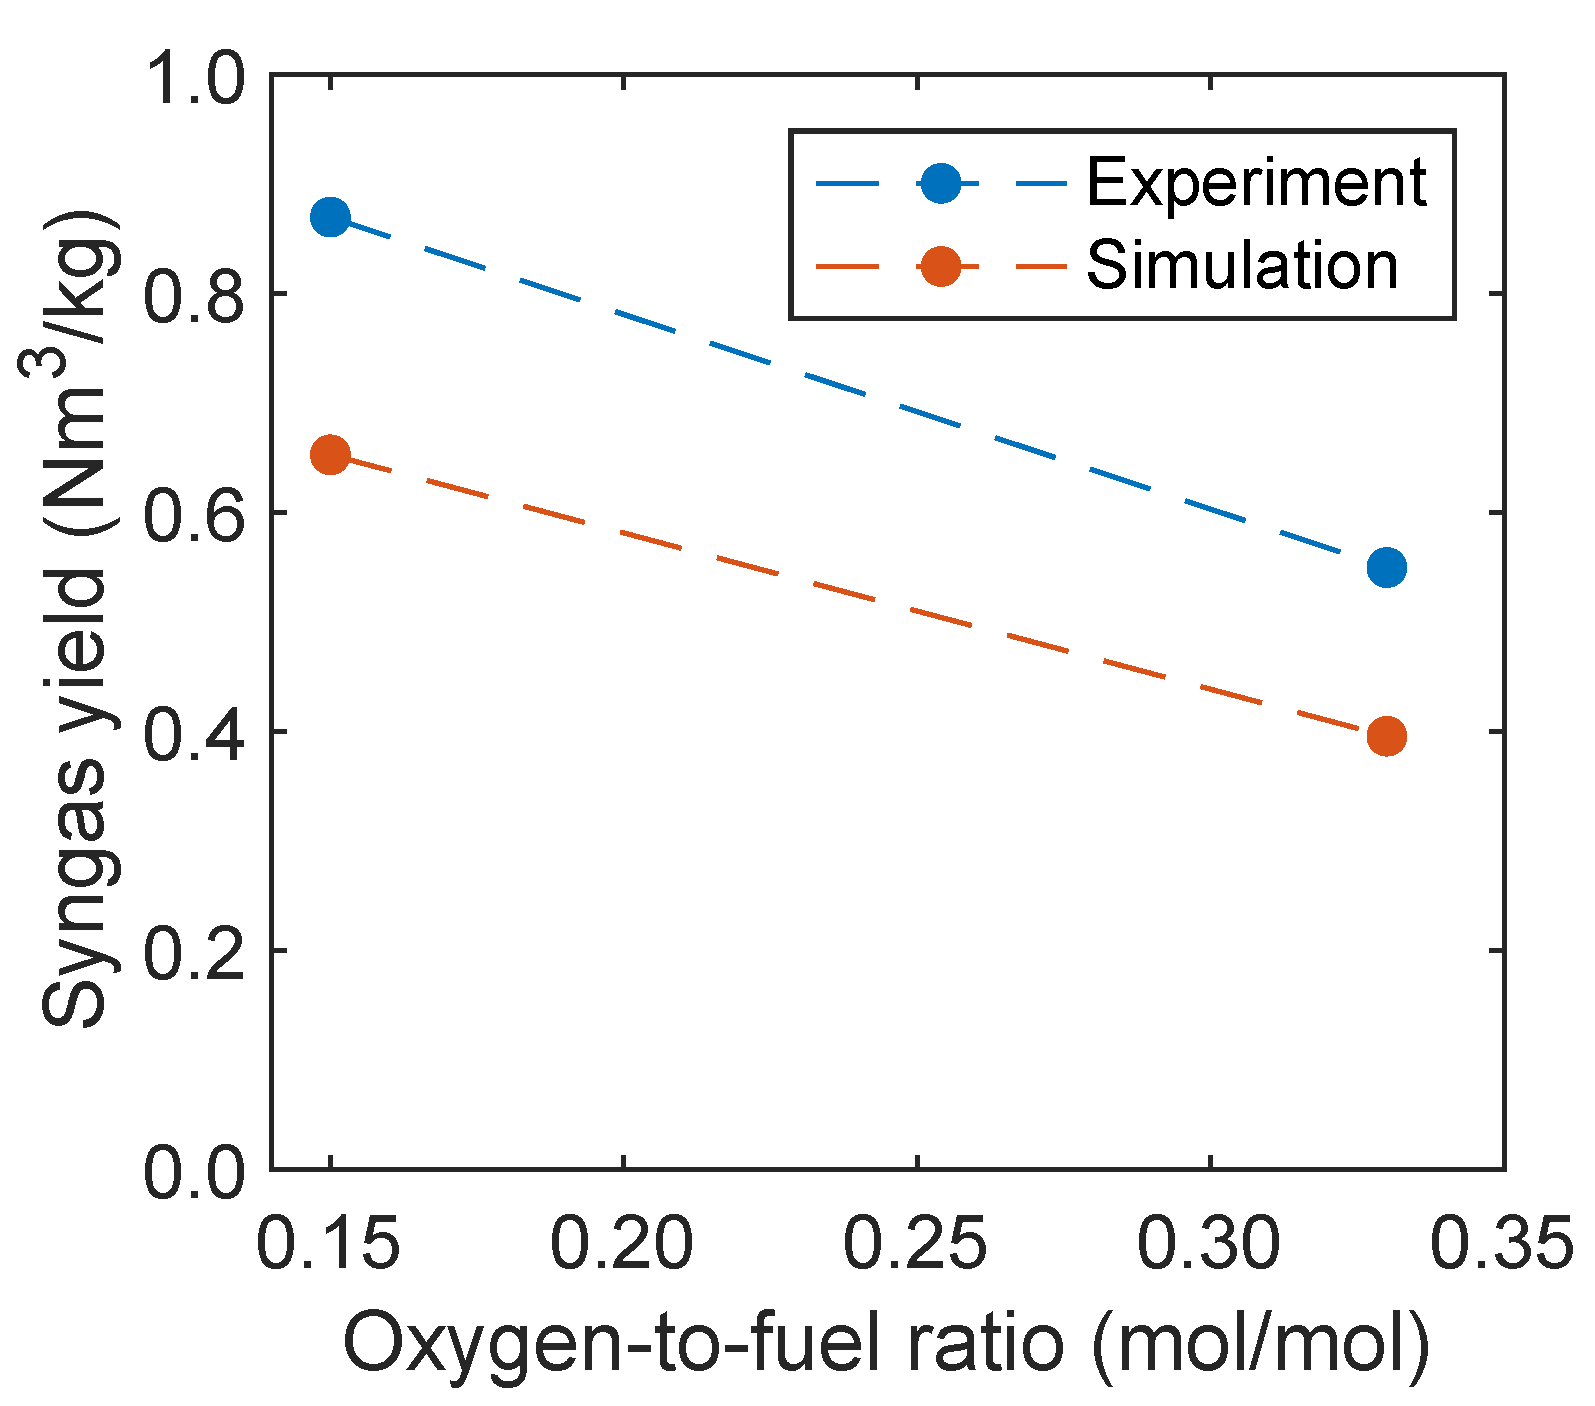
The syngas yield is an important process parameter that gives information regarding the amount of syngas, which is produced from the biomass fed into the reactor. Therefore, this parameter will be compared with experimental data and calculated, as proposed by Condori et al. [5], given in Equation (13). The syngas yield Y is related to the gas flow rate of hydrogen and carbon monoxide as well as the dry biomass fed into the fuel reactor .
In Figure 14, the syngas yield of the experiment and simulation is plotted depending on the oxidation degree. The yield decreases with increasing temperature, which is also captured by the simulations. The decreasing syngas yield was also observed by Ge et al. [11] with increasing oxygen carrier mass percentage in a fluidized bed using a mixture of quartz sand and hematite as oxygen carrier. However, the yield is underpredicted in the simulations. This is presumably due to an overprediction of the reaction kinetics of the oxygen carrier regarding the oxidation of hydrogen, carbon monoxide, and methane.
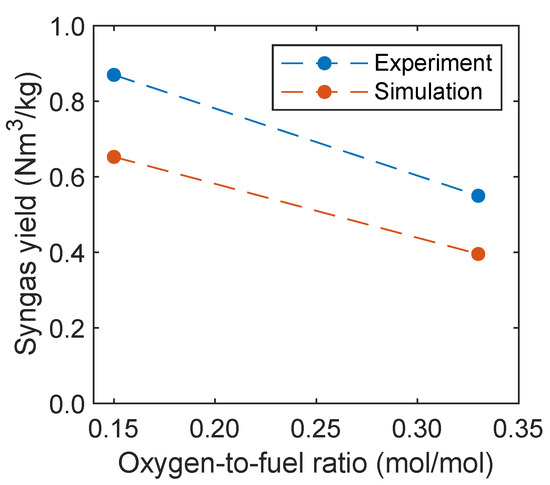
Figure 14.
Syngas yield as a function of the oxidation degree in comparison with experimental data given by Condori et al. [5].
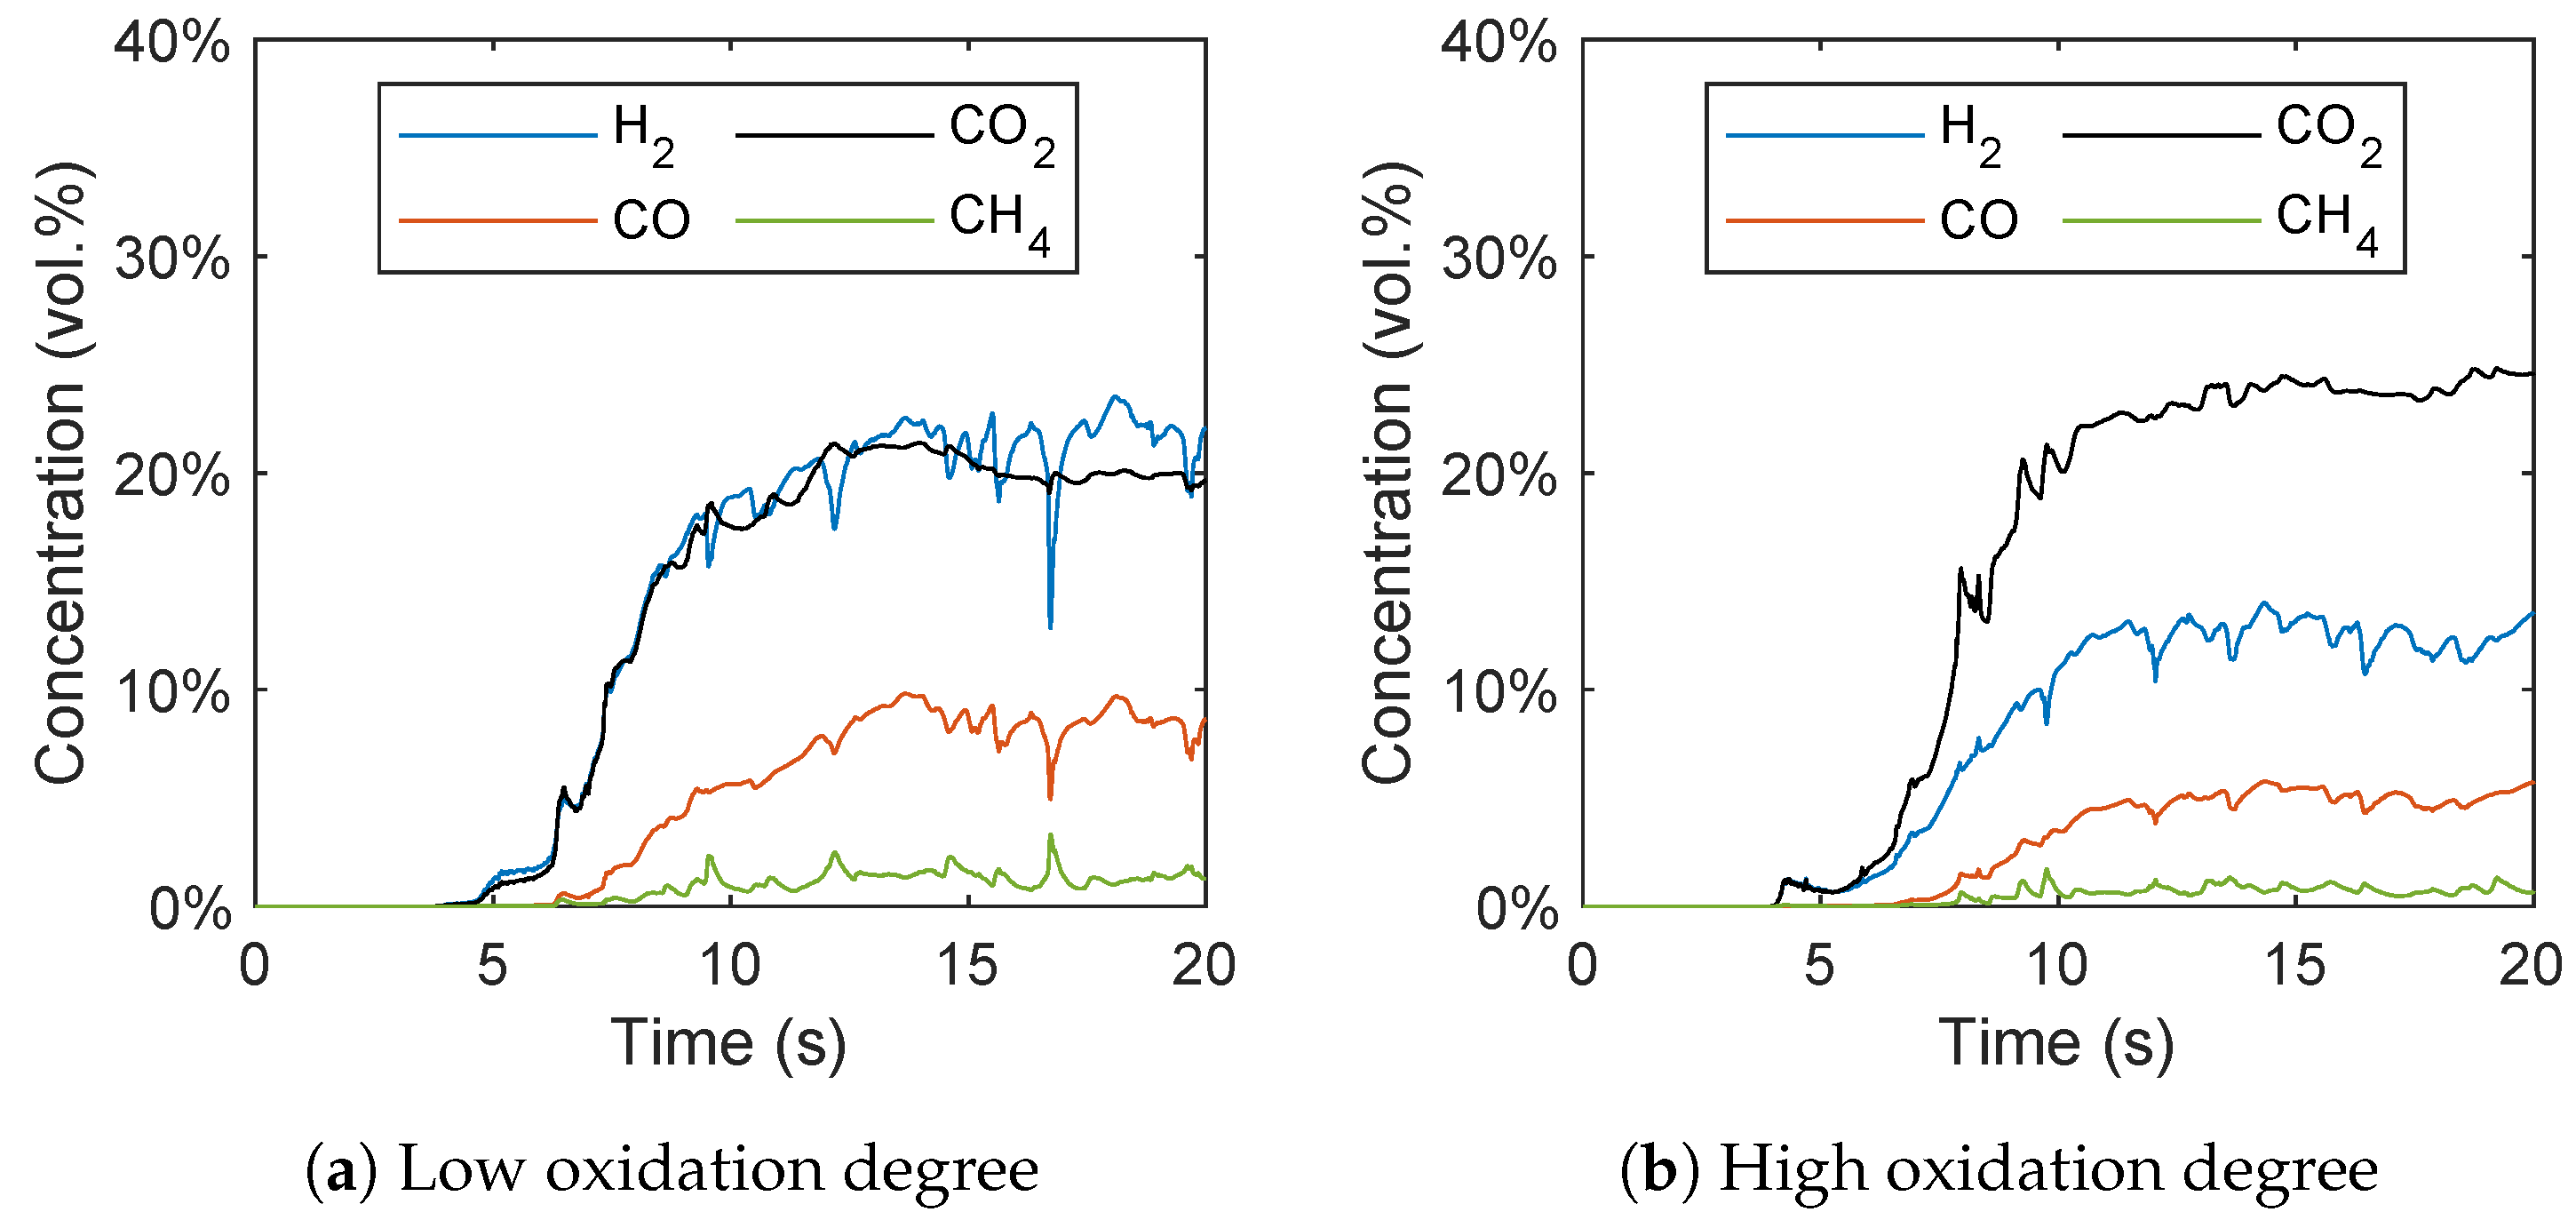
As already stated, no fresh oxygen carrier particles are fed into the fuel reactor in the simulations contrary to the experiments, where the oxygen carrier circulates between the air and the fuel reactor. To validate this approach, the gas concentrations are plotted over time in Figure 15. After a start-up time of around 10–15 s, a quasi-stationary state can be observed, even though the concentration of Fe2O3 of the oxygen carrier particles decreases over time. The average mass fraction of Fe2O3 decreased from 1.5 wt.% to 1.14 wt.% for the low oxidation degree and from 10 wt.% to 9.45 wt.% for the high oxidation degree during the simulation time of 20 s. This indicates a low influence of the Fe2O3 consumption on the syngas composition. With a longer simulation period, and thus an increasing consumption of Fe2O3, the hydrogen concentration would increase and the carbon dioxide concentration would decrease. However, the almost constant gas species concentrations from 15–20 s lead to the conclusion that influence of the consumption of Fe2O3 in this short simulation period is small and the simulation data can be compared with the experimental results.
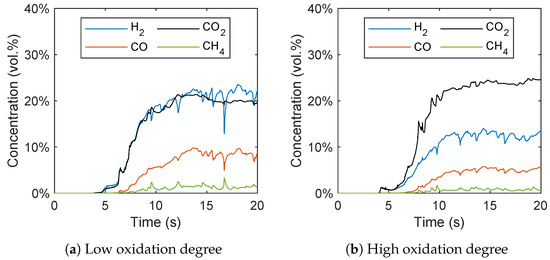
Figure 15.
Gas species concentration plotted over time with a (a) low and (b) high oxidation degree of the oxygen carrier.
The work of Condori et al. [5] showed a significant influence of the oxidation degree on the cold gas efficiency that decreases with increasing oxidation degree analogously to the syngas yield. Furthermore, a small increase of the biomass conversion was found with increasing oxidation degree, while the influence on the carbon conversion is not significant. However, no data is presented regarding the influence of the oxidation degree on the resulting tar content, which is mainly influenced by the steam-to-biomass ratio and the reactor temperature.
4.2.3. Influence of Reactor Temperature
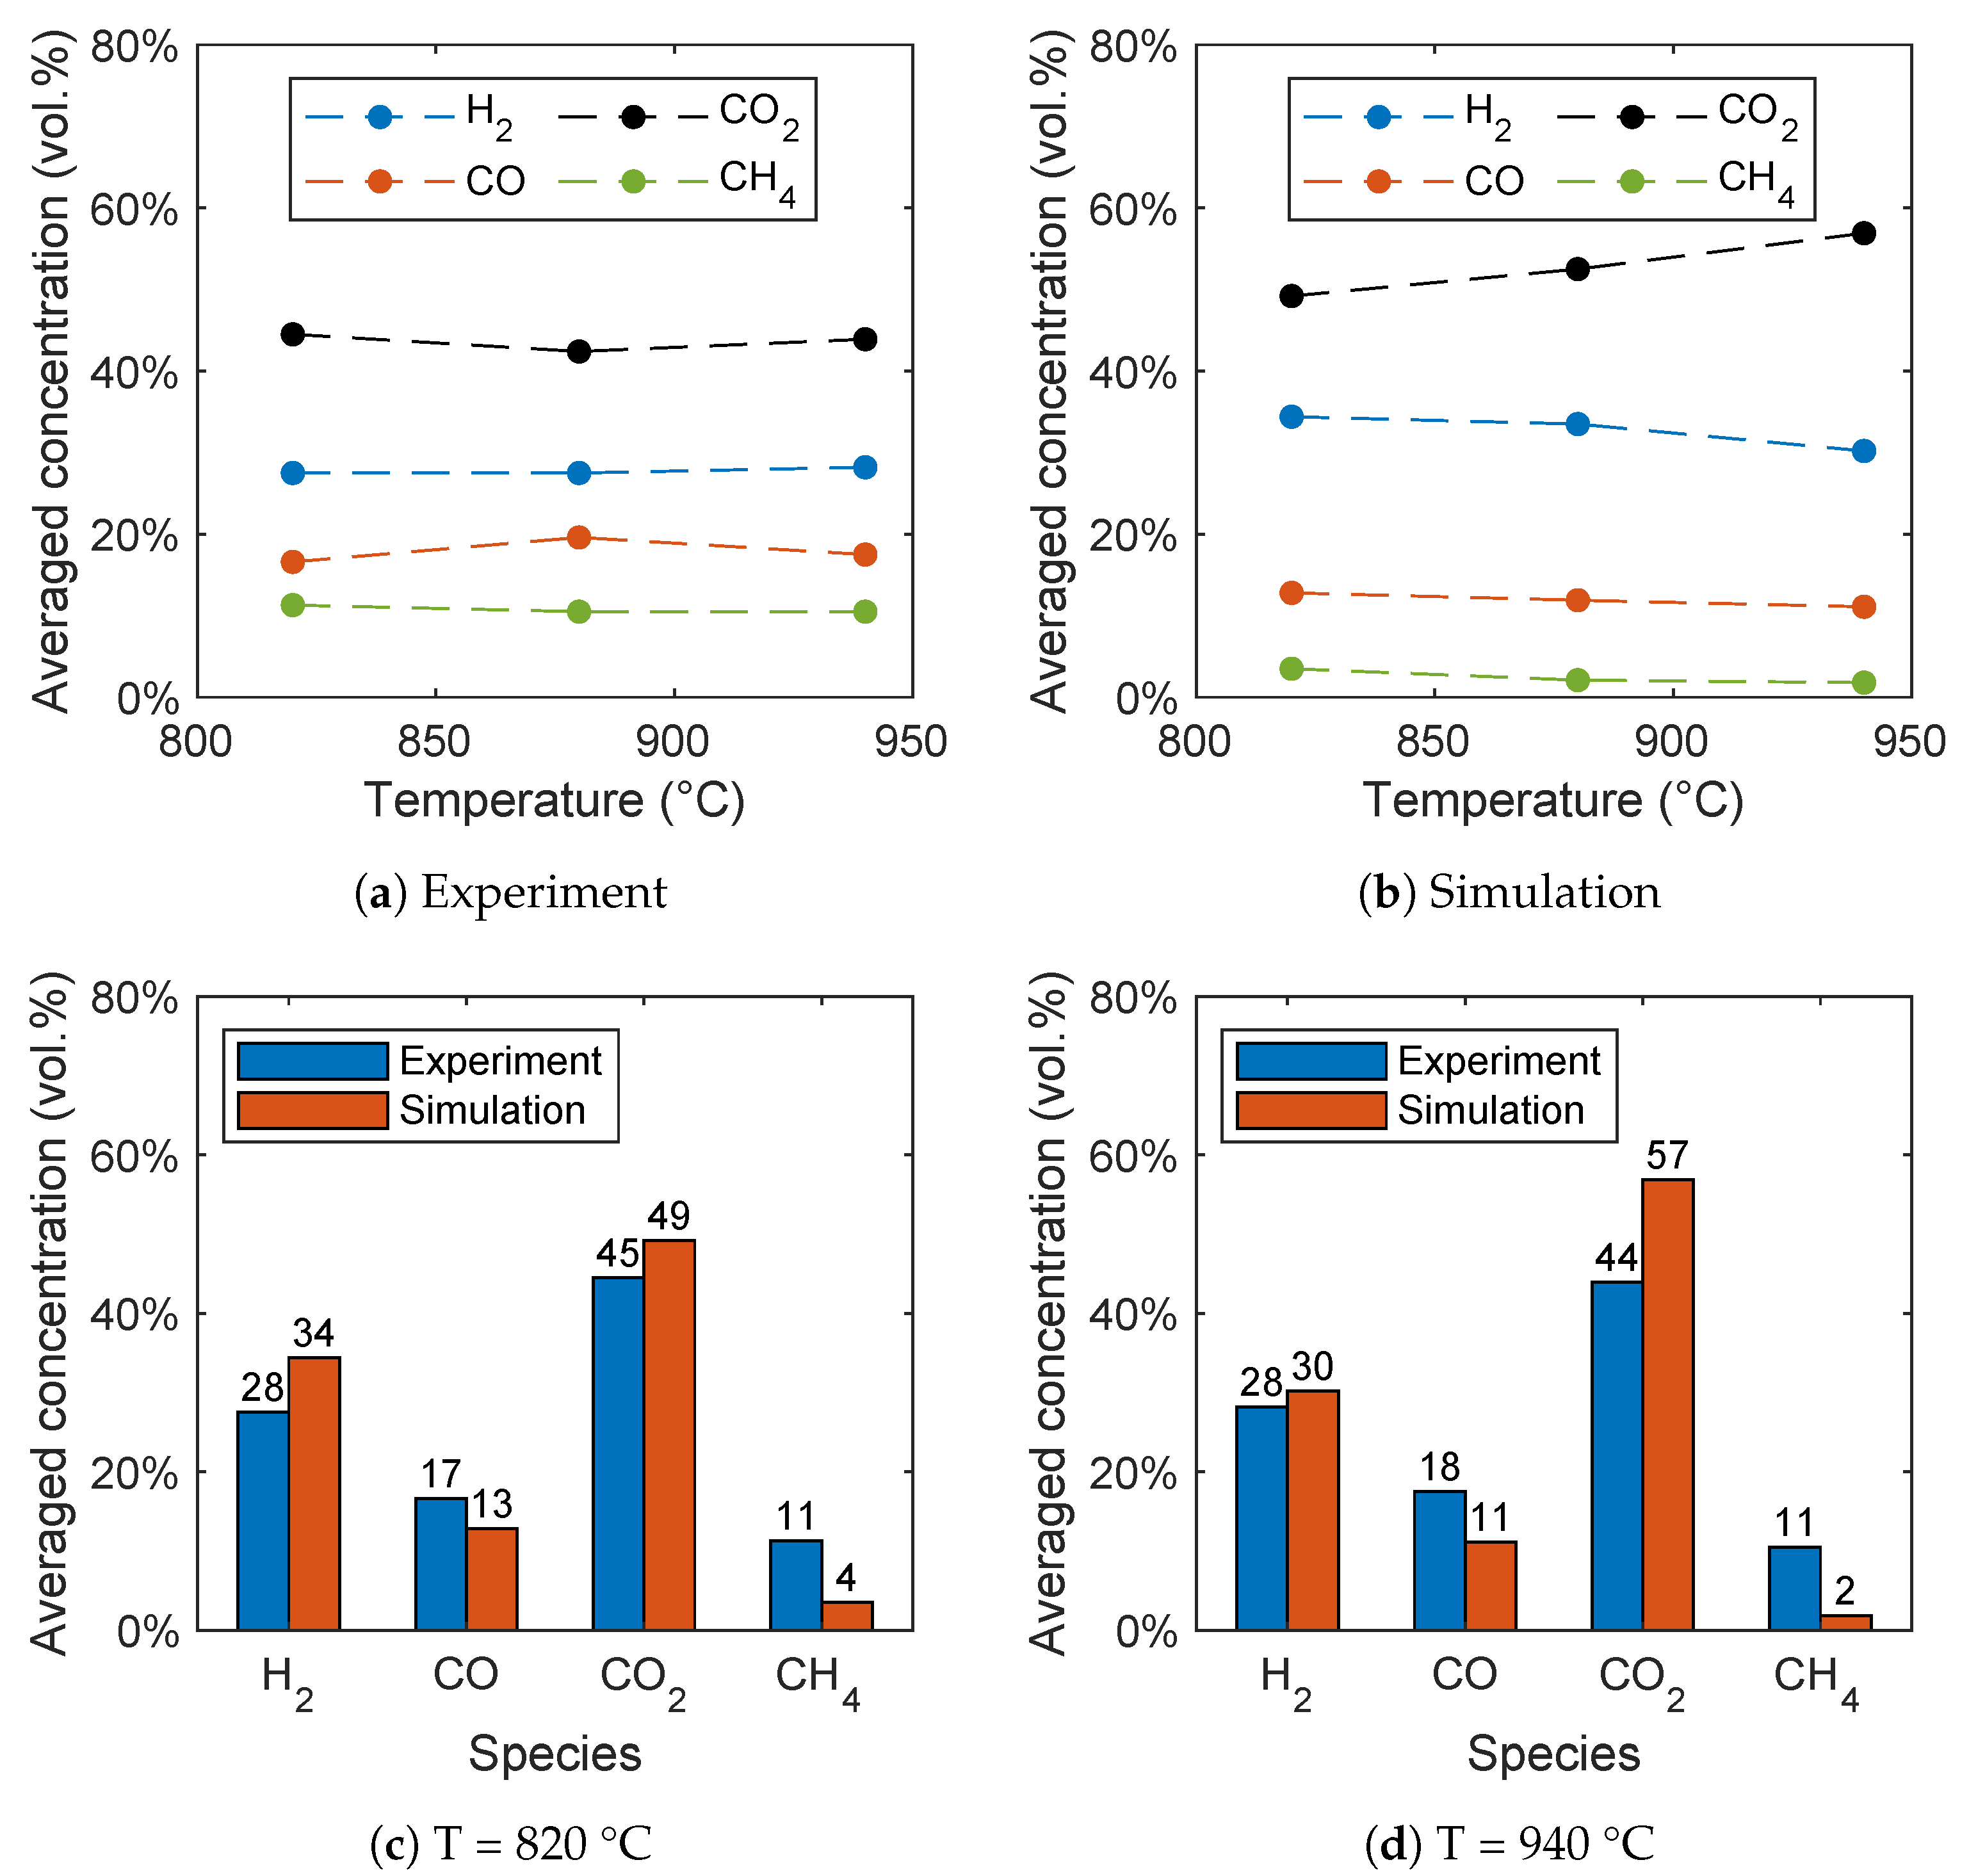
In contrast to the gasification of biomass without oxygen carriers, there is no consensus in the literature regarding the influence of the reactor temperature on the syngas composition for BCLG [5]. For instance, Wei et al. [15] found variations for the syngas composition, while Ge et al. [11] observed an optimum at 860 °C and Huijun et al. [58] at 750 °C. In Figure 16a,b, the influence of the reactor temperature on the syngas composition is given for the experiment and simulation. It can be seen that the influence of the temperature is very low in the experiments. However, in the simulations, the carbon dioxide concentration increases significantly with increasing temperature, while the hydrogen concentration decreases. This is due to a higher conversion rate of H2, CO, and CH4 with increasing temperature resulting from the temperature-dependent expression of the reaction rates given in Table 4. The significant increase of the CO2 concentration, as well as the decrease of the CO concentration with increasing reactor temperature was also found by Ge et al. [11] using hematite and Huijun et al. [58] using a nickel-based oxygen carrier. In contrast, Wei et al. [15] observed an increasing H2 and CO concentration, as well as a decreasing CO2 concentration using a Fe2O3/Al2O3 oxygen carrier.
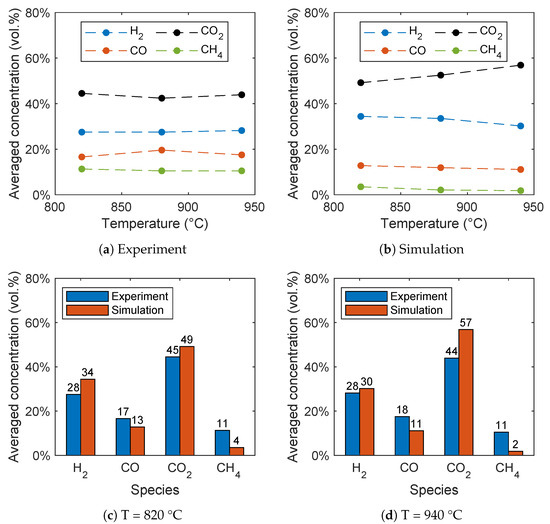
Figure 16.
Influence of the temperature on the syngas composition for (a) the experimental data given by Condori et al. [5] and (b) the simulation results. Comparison of the syngas composition for (c) 820 °C and (d) 940 °C.
A direct comparison of the syngas concentrations in Figure 16c for 820 °C and Figure 16d for 940 °C shows that the higher temperature leads to a higher deviation of experimental and simulation data for the carbon dioxide concentration. In contrast, the influence of the temperature on the hydrogen and carbon monoxide concentration is lower compared to the carbon dioxide concentration. All in all, a good agreement of the simulation results with the experiment data was obtained, despite the fact that only a small influence of the reactor temperature on the syngas composition was observed in the experiments.
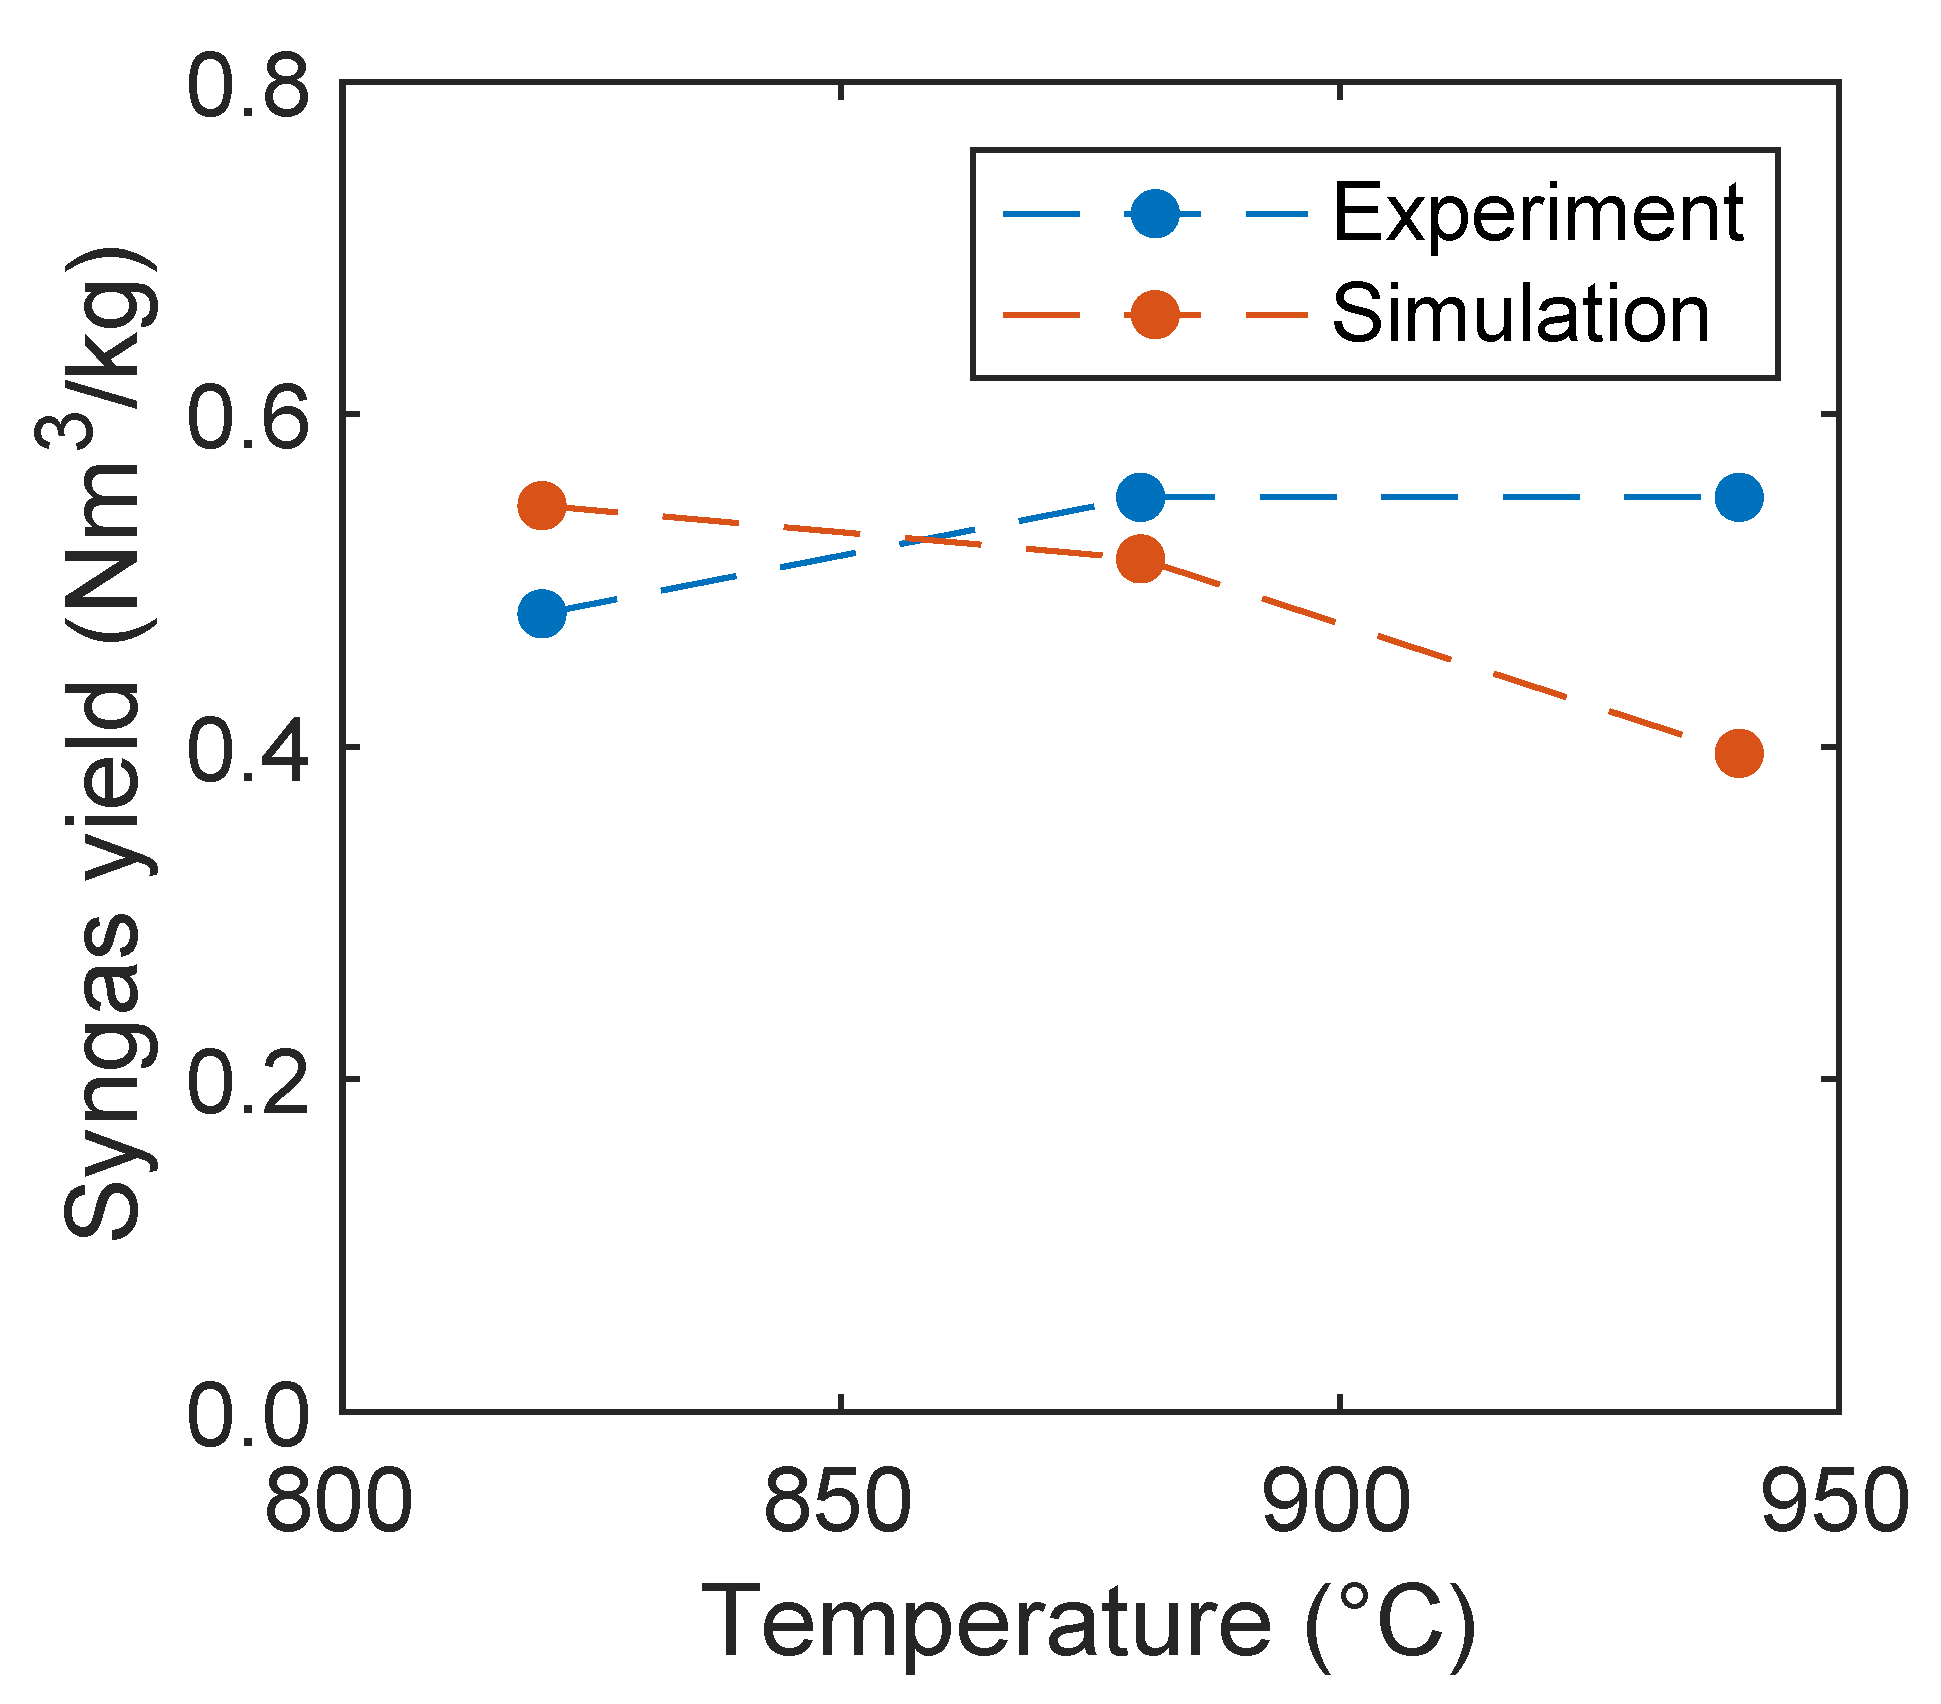
In Figure 17, the syngas yield is plotted depending on the reactor temperature. Condori et al. [5] found that with increasing temperature the syngas yield increases. The opposite influence was observed in the simulations. This is presumably due to an overprediction of the oxygen carrier kinetics as already stated before, or, due to the fact, that the volatile composition is independent from temperature. In contrast to the observations of Condori et al. [5], an optimum of the syngas yield was found by Ge et al. [11], using hematite as an oxygen carrier at 860 °C and a decrease of the yield with increasing temperature. Analogously, an optimum of the syngas yield at 750 °C and decreasing yield with increasing temperature was observed by Huijun et al. [58] with a nickel-based oxygen carrier. However, the syngas yield predicted by the simulations is in a reasonable order of magnitude close to the experiments of Condori et al. [5].
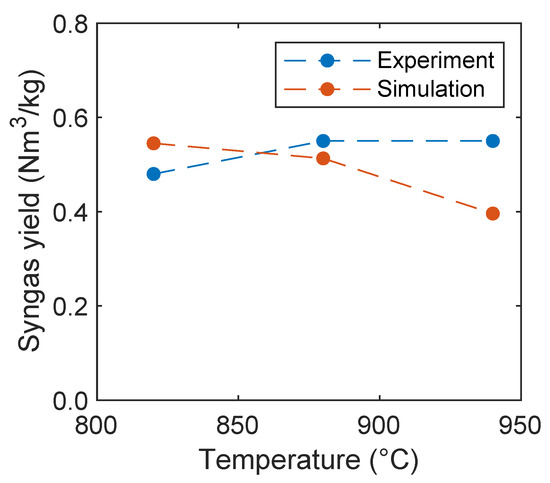
Figure 17.
Syngas yield as a function of the reactor temperature in comparison with experimental data given by Condori et al. [5].
In Figure 18, the contour plots of hydrogen, carbon monoxide, and methane are shown for a reactor temperature of 820 °C. It can be seen that the hydrogen concentration is low at the bottom where biomass is fed into the reactor analogously to Section 3.2.3 and the concentration increases in the freeboard region above the particle bed, which is due to the water-gas shift reaction (R2). In contrast, the carbon monoxide and methane concentration show a maximum at the top of the particle bed, where the biomass particles accumulate. It is concluded that most of the devolatilization takes place at the top of the particle bed. Similar profiles were also observed by Qi et al. [29] for biomass gasification without an oxygen carrier. In the particle bed, the concentrations of carbon monoxide and methane are low, which is presumable due to a higher conversion related to the high contact of the biomass and oxygen carrier.
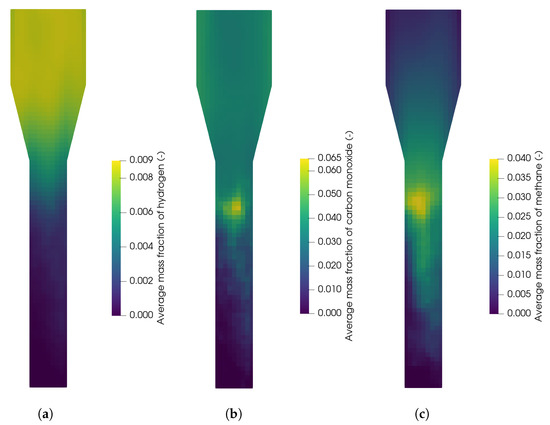
Figure 18.
Average mass fraction of (a) hydrogen, (b) carbon monoxide, and (c) methane in the the fuel reactor at 820 °C.
5. Conclusions
In this work, a model for the simulation of biomass steam gasification using ilmenite as an oxygen carrier was developed using the MP-PIC method in the framework of Barracuda VR® 21.0. This was performed in two separate steps.
Firstly, a reduced reaction network for the gasification of biomass in a spouted bed was investigated and the results were compared with experimental data. The results show a good agreement despite the necessary simplifications. The influence of the steam-to-biomass ratio was successfully reproduced by simulations. For the influence of the temperature on the syngas composition, the trends for carbon monoxide and carbon dioxide were predicted correctly. The observed increase of the hydrogen concentration with increasing temperature is presumable due to an overprediction of the methane conversion by the methane reforming reaction. These findings are also in line with observations of similar studies in the literature [16,28,29]. Furthermore, the influence of the bed mass was investigated showing that the hydrogen concentration decreases and methane concentration increases with increasing bed mass in the syngas due to a lower residence time of the syngas in the reactor.
Secondly, the reduced reaction network was coupled with the reaction kinetics of ilmenite as an oxygen carrier for the simulation of BCLG in a lab-scale fluidized bed and compared with experimental data as well. In contrast to CLC processes, the oxygen carrier is present in a reduced state for BCLG and it was found that the oxidation degree of ilmenite has a significant influence on the syngas composition, which was also successfully captured by the simulations. However, the concentration of carbon dioxide was overpredicted, while the syngas yield was underpredicted. Furthermore, the simulations showed a significant increase of the carbon dioxide concentration with increasing temperature that was not observed in the experiments. This is presumable due to an overprediction of the oxidation reactions resulting from the reaction kinetics of the oxygen carrier that were measured in a fully oxidized state. However, there is no consensus in the literature regarding the influence of the reactor temperature on the syngas composition in BCLG.
In general, the simulation results are in good agreement with the experimental data. Thus, the model can be a useful tool for a better understanding of the complex biomass chemical looping gasification process and the influence of various operation parameters. The model can be used to predict the syngas composition of biomass gasification in fluidized beds influenced by operating parameters such as the reactor temperature and oxidation degree of the oxygen carrier for optimizing the plant design.
Author Contributions
Conceptualization, T.D. and K.J.; formal analysis, T.D.; funding acquisition, T.S., L.S., M.D. and S.H.; investigation, S.W.; methodology, T.D. and K.J.; project administration, M.D. and S.H.; supervision, M.D. and S.H.; visualization, T.D.; writing—original draft, T.D.; writing—review and editing, K.J., S.W. and S.H. All authors have read and agreed to the published version of the manuscript.
Funding
This research was funded by the German Research Foundation (DFG), project number HE 4526/21-1 and DO 2026/5-1, and the National Natural Science Foundation of China (grant number 51761135119).
Institutional Review Board Statement
Not applicable.
Informed Consent Statement
Not applicable.
Data Availability Statement
Not applicable.
Acknowledgments
Publishing fees funded by the Deutsche Forschungsgemeinschaft (DFG, German Research Foundation)—Projektnummer 491268466 and the Hamburg University of Technology (TUHH) in the funding programme Open Access Publishing.
Conflicts of Interest
The authors declare no conflict of interest.
Abbreviations
The following abbreviations are used in this manuscript:
| AR | Air reactor | |
| BAM | Blended acceleration model | |
| BCLG | Biomass chemical looping gasification | |
| CFD | Computational fluid dynamics | |
| CLC | Chemical looping combustion | |
| CLG | Chemical looping gasification | |
| DEM | Discrete element method | |
| FR | Fuel reactor | |
| MP-PIC | Multiphase particle-in-cell method | |
| OC | Oxygen carrier | |
| S/B | Steam-to-biomass ratio | |
| TFM | Two-fluid model | |
| WY | Wen-Yu | |
| WYE | Wen-Yu-Ergun | |
| Latin symbols | ||
| Particle acceleration | m s−2 | |
| Pre-exponential factor in Equation (10) | s−1 | |
| Drag coefficient | - | |
| Gas concentration | mol m−3 | |
| Inter-phase drag function | s−1 | |
| Activation energy in Equation (10) | K | |
| Normal retention coefficient | - | |
| Tangential retention coefficient | - | |
| Particle probability density function | - | |
| F | Interphase momentum exchange rate | kg m−2 s−2 |
| Dry biomass fed into the system | kg h−1 | |
| g | Gravitational acceleration | m s−2 |
| Gas flow rate of species i | Nm3 h−1 | |
| Kinetic constant in Equation (12) | mol1−n m3n−2 s−1 | |
| Mass | kg | |
| n | Reaction order | - |
| p | Pressure | Pa |
| Modeling constant in Equation (7) | Pa | |
| Grain radius in Equation (12) | m | |
| Particle radius | m | |
| t | Time | s |
| T | Temperature | K |
| Particle temperature | K | |
| Velocity | m s−1 | |
| Stoichiometric factor | - | |
| Volume of solid phase | m3 | |
| Y | Syngas yield | Nm3 kg−1 |
| Greek symbols | ||
| Modeling constant in Equation (7) | - | |
| Modeling constant in Equation (7) | - | |
| Particle volume fraction at close-pack | - | |
| Gas volume fraction | - | |
| Particle volume fraction | - | |
| Density | kg m−3 | |
| Molar density in Equation (12) | mol m−3 | |
| Inter-particle stress in Equation (7) | Pa | |
| Time for complete conversion in Equation (12) | s | |
| Fluid stress tensor | Pa |
References
- Gómez-Barea, A.; Leckner, B. Modeling of biomass gasification in fluidized bed. Prog. Energy Combust. Sci. 2010, 36, 444–509. [Google Scholar] [CrossRef]
- Sikarwar, V.S.; Zhao, M.; Clough, P.; Yao, J.; Zhong, X.; Memon, M.Z.; Shah, N.; Anthony, E.J.; Fennell, P.S. An overview of advances in biomass gasification. Energy Environ. Sci. 2016, 9, 2939–2977. [Google Scholar] [CrossRef] [Green Version]
- Sikarwar, V.S.; Zhao, M.; Fennell, P.S.; Shah, N.; Anthony, E.J. Progress in biofuel production from gasification. Prog. Energy Combust. Sci. 2017, 61, 189–248. [Google Scholar] [CrossRef]
- Kraft, S.; Kirnbauer, F.; Hofbauer, H. CPFD simulations of an industrial-sized dual fluidized bed steam gasification system of biomass with 8 MW fuel input. Appl. Energy 2017, 190, 408–420. [Google Scholar] [CrossRef]
- Condori, O.; de Diego, L.F.; Garcia-Labiano, F.; Izquierdo, M.T.; Abad, A.; Adánez, J. Syngas Production in a 1.5 kWth Biomass Chemical Looping Gasification Unit Using Fe and Mn Ores as the Oxygen Carrier. Energy Fuels Am. Chem. Soc. J. 2021, 35, 17182–17196. [Google Scholar] [CrossRef]
- Song, T.; Wu, J.; Shen, L.; Xiao, J. Experimental investigation on hydrogen production from biomass gasification in interconnected fluidized beds. Biomass Bioenergy 2012, 36, 258–267. [Google Scholar] [CrossRef]
- Zhao, X.; Zhou, H.; Sikarwar, V.S.; Zhao, M.; Park, A.H.A.; Fennell, P.S.; Shen, L.; Fan, L.S. Biomass-based chemical looping technologies: The good, the bad and the future. Energy Environ. Sci. 2017, 10, 1885–1910. [Google Scholar] [CrossRef] [Green Version]
- Mendiara, T.; García-Labiano, F.; Abad, A.; Gayán, P.; de Diego, L.F.; Izquierdo, M.T.; Adánez, J. Negative CO2 emissions through the use of biofuels in chemical looping technology: A review. Appl. Energy 2018, 232, 657–684. [Google Scholar] [CrossRef]
- Adanez, J.; Abad, A.; Garcia-Labiano, F.; Gayan, P.; de Diego, L.F. Progress in Chemical-Looping Combustion and Reforming technologies. Prog. Energy Combust. Sci. 2012, 38, 215–282. [Google Scholar] [CrossRef] [Green Version]
- Lindmüller, L.; Haus, J.; Ramesh Kumar Nair, A.; Heinrich, S. Minimizing gas leakages in a system of coupled fluidized bed reactors for chemical looping combustion. Chem. Eng. Sci. 2022, 250, 117366. [Google Scholar] [CrossRef]
- Ge, H.; Guo, W.; Shen, L.; Song, T.; Xiao, J. Biomass gasification using chemical looping in a 25 kW th reactor with natural hematite as oxygen carrier. Chem. Eng. J. 2016, 286, 174–183. [Google Scholar] [CrossRef]
- HUSEYIN, S.; WEI, G.q.; LI, H.b.; He, F.; Huang, Z. Chemical-looping gasification of biomass in a 10 kWth interconnected fluidized bed reactor using Fe2O3/Al2O3 oxygen carrier. J. Fuel Chem. Technol. 2014, 42, 922–931. [Google Scholar] [CrossRef]
- Lin, Y.; Wang, H.; Huang, Z.; Liu, M.; Wei, G.; Zhao, Z.; Li, H.; Fang, Y. Chemical looping gasification coupled with steam reforming of biomass using NiFe2O4: Kinetic analysis of DAEM-TI, thermodynamic simulation of OC redox, and a loop test. Chem. Eng. J. 2020, 395, 125046. [Google Scholar] [CrossRef]
- Shen, T.; Wu, J.; Shen, L.; Yan, J.; Jiang, S. Chemical Looping Gasification of Coal in a 5 kW th Interconnected Fluidized Bed with a Two-Stage Fuel Reactor. Energy Fuels Am. Chem. Soc. J. 2018, 32, 4291–4299. [Google Scholar] [CrossRef]
- Wei, G.; He, F.; Huang, Z.; Zheng, A.; Zhao, K.; Li, H. Continuous Operation of a 10 kW th Chemical Looping Integrated Fluidized Bed Reactor for Gasifying Biomass Using an Iron-Based Oxygen Carrier. Energy Fuels Am. Chem. Soc. J. 2015, 29, 233–241. [Google Scholar] [CrossRef]
- Wang, S.; Shen, Y. CFD-DEM study of biomass gasification in a fluidized bed reactor: Effects of key operating parameters. Renew. Energy 2020, 159, 1146–1164. [Google Scholar] [CrossRef]
- Chen, C.; Werther, J.; Heinrich, S.; Qi, H.Y.; Hartge, E.U. CPFD simulation of circulating fluidized bed risers. Powder Technol. 2013, 235, 238–247. [Google Scholar] [CrossRef]
- Tu, Q.; Wang, H. CPFD study of a full-loop three-dimensional pilot-scale circulating fluidized bed based on EMMS drag model. Powder Technol. 2018, 323, 534–547. [Google Scholar] [CrossRef]
- Loha, C.; Gu, S.; de Wilde, J.; Mahanta, P.; Chatterjee, P.K. Advances in mathematical modeling of fluidized bed gasification. Renew. Sustain. Energy Rev. 2014, 40, 688–715. [Google Scholar] [CrossRef]
- Grace, J.R.; Sun, G. Influence of particle size distribution on the performance of fluidized bed reactors. Can. J. Chem. Eng. 1991, 69, 1126–1134. [Google Scholar] [CrossRef]
- Rizk, M.A. Mathematical modeling of densely loaded, particle-laden turbulent flows. At. Sprays 1993, 3, 1–27. [Google Scholar] [CrossRef]
- Gidaspow, D. Multiphase Flow and Fluidization: Continuum and Kinetic Theory Descriptions; Elsevier Science: San Diego, CA, USA, 1994. [Google Scholar]
- Snider, D.M.; Clark, S.M.; O’Rourke, P.J. Eulerian–Lagrangian method for three-dimensional thermal reacting flow with application to coal gasifiers. Chem. Eng. Sci. 2011, 66, 1285–1295. [Google Scholar] [CrossRef]
- Andrews, M.J.; O’Rourke, P.J. The multiphase particle-in-cell (MP-PIC) method for dense particulate flows. Int. J. Multiph. Flow 1996, 22, 379–402. [Google Scholar] [CrossRef]
- Blaser, P.J.; Corina, G. Validation and Application of Computational Modeling to Reduce Erosion in a Circulating Fluidized Bed Boiler. Int. J. Chem. React. Eng. 2012, 10. [Google Scholar] [CrossRef]
- Solnordal, C.B.; Kenche, V.; Hadley, T.D.; Feng, Y.; Witt, P.J.; Lim, K.S. Simulation of an internally circulating fluidized bed using a multiphase particle-in-cell method. Powder Technol. 2015, 274, 123–134. [Google Scholar] [CrossRef]
- Ostermeier, P.; Fischer, F.; Fendt, S.; DeYoung, S.; Spliethoff, H. Coarse-grained CFD-DEM simulation of biomass gasification in a fluidized bed reactor. Fuel 2019, 255, 115790. [Google Scholar] [CrossRef]
- Ku, X.; Li, T.; Løvås, T. CFD–DEM simulation of biomass gasification with steam in a fluidized bed reactor. Chem. Eng. Sci. 2015, 122, 270–283. [Google Scholar] [CrossRef] [Green Version]
- Qi, T.; Lei, T.; Yan, B.; Chen, G.; Li, Z.; Fatehi, H.; Wang, Z.; Bai, X.S. Biomass steam gasification in bubbling fluidized bed for higher-H2 syngas: CFD simulation with coarse grain model. Int. J. Hydrog. Energy 2019, 44, 6448–6460. [Google Scholar] [CrossRef]
- Parker, J.M. CFD model for the simulation of chemical looping combustion. Powder Technol. 2014, 265, 47–53. [Google Scholar] [CrossRef]
- Alobaid, F.; Ohlemüller, P.; Ströhle, J.; Epple, B. Extended Euler–Euler model for the simulation of a 1 MWth chemical–looping pilot plant. Energy 2015, 93, 2395–2405. [Google Scholar] [CrossRef]
- Haus, J.; Hartge, E.U.; Heinrich, S.; Werther, J. Dynamic flowsheet simulation for chemical looping combustion of methane. Int. J. Greenh. Gas Control 2018, 72, 26–37. [Google Scholar] [CrossRef]
- May, J.; Alobaid, F.; Ohlemüller, P.; Stroh, A.; Ströhle, J.; Epple, B. Reactive two–fluid model for chemical–looping combustion—Simulation of fuel and air reactors. Int. J. Greenh. Gas Control 2018, 76, 175–192. [Google Scholar] [CrossRef]
- Reinking, Z.; Shim, H.S.; Whitty, K.J.; Lighty, J.S. Computational simulation of a 100 kW dual circulating fluidized bed reactor processing coal by chemical looping with oxygen uncoupling. Int. J. Greenh. Gas Control 2019, 90, 102795. [Google Scholar] [CrossRef]
- Li, Z.; Xu, H.; Yang, W.; Zhou, A.; Xu, M. CFD simulation of a fluidized bed reactor for biomass chemical looping gasification with continuous feedstock. Energy Convers. Manag. 2019, 201, 112143. [Google Scholar] [CrossRef]
- Wang, S.; Yin, W.; Li, Z.; Yang, X.; Zhang, K. Numerical investigation of chemical looping gasification process using solid fuels for syngas production. Energy Convers. Manag. 2018, 173, 296–302. [Google Scholar] [CrossRef]
- Abad, A.; Adánez, J.; Cuadrat, A.; García-Labiano, F.; Gayán, P.; de Diego, L.F. Kinetics of redox reactions of ilmenite for chemical-looping combustion. Chem. Eng. Sci. 2011, 66, 689–702. [Google Scholar] [CrossRef] [Green Version]
- Snider, D.M. An Incompressible Three-Dimensional Multiphase Particle-in-Cell Model for Dense Particle Flows. J. Comput. Phys. 2001, 170, 523–549. [Google Scholar] [CrossRef]
- Harris, S.E.; Crighton, D.G. Solitons, solitary waves, and voidage disturbances in gas-fluidized beds. J. Fluid Mech. 1994, 266, 243–276. [Google Scholar] [CrossRef]
- Wen, C.Y.; Yu, Y.H. Mechanics of fluidization. Chem. Eng. Prog. Symp. Ser. 1966, 62, 100–111. [Google Scholar]
- Ergun, S. Fluid flow through packed columns. Chem. Eng. Process. 1952, 48, 89–94. [Google Scholar]
- CPFD Software LLC. Barracuda Virtual Reactor User Manual; CPFD Software LLC: Houston, TX, USA, 2018. [Google Scholar]
- O’Rourke, P.J.; Snider, D.M. A new blended acceleration model for the particle contact forces induced by an interstitial fluid in dense particle/fluid flows. Powder Technol. 2014, 256, 39–51. [Google Scholar] [CrossRef]
- Kraft, S.; Kuba, M.; Kirnbauer, F.; Bosch, K.; Hofbauer, H. Optimization of a 50 MW bubbling fluidized bed biomass combustion chamber by means of computational particle fluid dynamics. Biomass Bioenergy 2016, 89, 31–39. [Google Scholar] [CrossRef]
- Chan, W.C.R.; Kelbon, M.; Krieger, B.B. Modelling and experimental verification of physical and chemical processes during pyrolysis of a large biomass particle. Fuel 1985, 64, 1505–1513. [Google Scholar] [CrossRef]
- Bonnefoy, F.; Gilot, P.; Prado, G. A three-dimensional model for the determination of kinetic data from the pyrolysis of beech wood. J. Anal. Appl. Pyrolysis 1993, 25, 387–394. [Google Scholar] [CrossRef]
- Yan, L.; Lim, C.J.; Yue, G.; He, B.; Grace, J.R. Simulation of biomass-steam gasification in fluidized bed reactors: Model setup, comparisons and preliminary predictions. Bioresour. Technol. 2016, 221, 625–635. [Google Scholar] [CrossRef] [PubMed]
- Liu, H.; Cattolica, R.J.; Seiser, R. CFD studies on biomass gasification in a pilot-scale dual fluidized-bed system. Int. J. Hydrog. Energy 2016, 41, 11974–11989. [Google Scholar] [CrossRef]
- Abani, N.; Ghoniem, A.F. Large eddy simulations of coal gasification in an entrained flow gasifier. Fuel 2013, 104, 664–680. [Google Scholar] [CrossRef]
- Wang, S.; Song, T.; Yin, S.; Hartge, E.U.; Dymala, T.; Shen, L.; Heinrich, S.; Werther, J. Syngas, tar and char behavior in chemical looping gasification of sawdust pellet in fluidized bed. Fuel 2020, 270, 117464. [Google Scholar] [CrossRef]
- Macak, J.; Malecha, J. Mathematical Model for the Gasification of Coal under Pressure. Ind. Eng. Chem. Process. Des. Dev. 1978, 17, 92–98. [Google Scholar] [CrossRef]
- Jones, W.P.; Lindstedt, R.P. Global reaction schemes for hydrocarbon combustion. Combust. Flame 1988, 73, 233–249. [Google Scholar] [CrossRef]
- Syamlal, M.; Bissett, L.A. METC Gasifier Advanced Simulation (MGAS) Model; USDOE Morgantown Energy Technology Center: Morgantown, WV, USA, 1992. [CrossRef] [Green Version]
- Wytrwat, T.; Hartge, E.U.; Yazdanpanah, M.; Heinrich, S. Influences on the transition from bubbling to turbulent fluidization for Geldart’s group B particles. Powder Technol. 2020, 375, 81–88. [Google Scholar] [CrossRef]
- Cuadrat, A.; Abad, A.; García-Labiano, F.; Gayán, P.; de Diego, L.F.; Adánez, J. Relevance of the coal rank on the performance of the in situ gasification chemical-looping combustion. Chem. Eng. J. 2012, 195-196, 91–102. [Google Scholar] [CrossRef] [Green Version]
- Breault, R.W.; Monazam, E.R. Modeling of the Reduction of Hematite in the Chemical Looping Combustion of Methane using Barracuda. Energy Technol. 2016, 4, 1221–1229. [Google Scholar] [CrossRef]
- Mendiara, T.; Abad, A.; de Diego, L.F.; García-Labiano, F.; Gayán, P.; Adánez, J. Reduction and oxidation kinetics of Tierga iron ore for Chemical Looping Combustion with diverse fuels. Chem. Eng. J. 2019, 359, 37–46. [Google Scholar] [CrossRef]
- Huijun, G.; Laihong, S.; Fei, F.; Shouxi, J. Experiments on biomass gasification using chemical looping with nickel-based oxygen carrier in a 25 kWth reactor. Appl. Therm. Eng. 2015, 85, 52–60. [Google Scholar] [CrossRef]


Publisher’s Note: MDPI stays neutral with regard to jurisdictional claims in published maps and institutional affiliations. |
© 2022 by the authors. Licensee MDPI, Basel, Switzerland. This article is an open access article distributed under the terms and conditions of the Creative Commons Attribution (CC BY) license (https://creativecommons.org/licenses/by/4.0/).