Abstract
Changes in flood loads and reservoir levels, produced by climate change (CC), represent an increasing concern for dam safety managers and downstream populations, highlighting the need to define adaptation strategies based on the dam failure risk management framework. Currently, thousands of dams worldwide, varying in use, age, and maintenance, may represent a threat to downstream cities in the case of structural failure. Several studies relate the failure of dams to several issues in the spillway, which may be even more vulnerable in CC conditions. This study provides a review of dam safety threats due to CC and approaches for the design/redesign of the spillway to cope with CC. A general four-stage methodology is proposed: data gathering and hydro-climatic, hydrological, and hydraulic analyses. Afterward, this methodology is applied to the spillway design for the Sube y Baja dam in Ecuador. The Probable Maximum Precipitation (PMP) increases around 20% considering CC under the Representative Concentration Pathway 8.5. Such an increment derived a 25% increase in the spillway maximum flow. These results show that the non-stationary hydrological regimes related to CC require a revision of engineering design criteria for hydraulic structures in general, and call for a consensus on design variables under CC.
1. Introduction
Humans have been building water management infrastructures for centuries to secure surface water availability to cover all human needs. For instance, dams have been built for irrigation, hydropower generation, transportation, and water consumption. Large dams located upstream of population centers are usually designed for downstream flood-control purposes; consequently, they are known as critical or high-hazard dams [1]. From 1950 to 2000, the number of large dams increased from 5000 to over 45,000 dams spread all around the world in more than 140 countries, the equivalent of two dams built per day [2]. By 2020, the number of dams worldwide already exceeded 55,000 [3]. The issue with the increasing number of large dams is that they are vulnerable to natural and operational events that may cause their failure. According to a US Army Corps of Engineers survey, almost 36% of existing dams are unsafe due to various reasons, with the insufficient spillway capacity being the main one [4].
Figure 1 shows the distribution of dams worldwide by 2016 from the Global Reservoir and Dam Database (GRanD). As can be seen, developed countries such as the US and China have an important number of dams constructed before 2000 (red dots), but the construction trend keeps increasing, especially in China (yellow dots). On the other hand, developing countries do not have a big number of dams constructed before 2000, but there is a trend toward an increase in the construction of these infrastructure projects [5]. In fact, in 2018, an estimated 3700 hydroelectric dams were either planned or under construction primarily in developing countries [6], with Ecuador being an example of this trend. In 2006, hydropower accounted for about 44% of the country’s electricity generation, and by 2020, it increased to 79% [7,8].
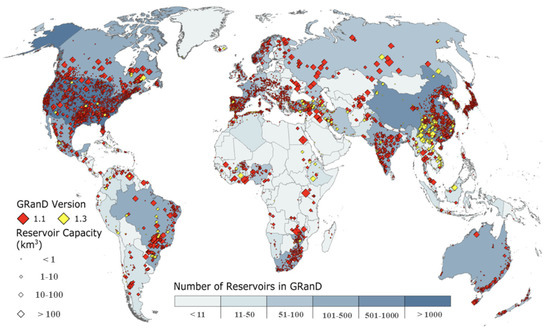
Figure 1.
Number of dams constructed worldwide before 2000 (red dots) and between 2000 and 2016 (yellow dots). Source: [5].
When planning and operating water resource management projects, there are many factors that might affect their performance [9,10]. Each component of a dam depends on future meteorological, demographic, social, technical, and political conditions, all of which may affect future benefits, costs, environmental impacts, and social acceptance [10]. With the growing need of water for societies, industries, and agriculture expansion, the number of dams will continue to rise, exacerbating the need for strong safety measures [3]. The overall safety of critical dams throughout their life cycle is highly determined by how the structure can safely handle extreme climate events [1]. Long-term concerns about improving dam safety focus primarily on the consideration of future climate change impacts on dams, especially due to the change in regular weather patterns and the increase in extreme rainfall events [3].
Climate change (CC) can be evidenced by accelerated changes in the long-term trends of precipitation and temperature, which can be attributed to rapid industrial development and high greenhouse gas (GHG) emissions related to anthropogenic activities [11,12]. Indeed, global warming and CC are responsible for an increase in floods and environmental risks, causing negative impacts on humans and nature. Climate variations with negative impacts, such as extreme droughts and heavy rains, cause significant effects on urban and rural infrastructure [13,14]. Furthermore, CC constitutes a potential risk, mainly in areas with lower socioeconomic development and high poverty rates which seem to overlook safety threats related to CC. This includes the most vulnerable rural areas, where the infrastructure is deteriorated or has not been built with the highest safety standards [6,15,16,17]. The lack of unifying criteria to conceive CC in the dam’s design on top of the limitations of monitoring and control in developing countries may amplify the risks to downstream populations, leaving major consequences [18,19].
Potential risks associated with dam failure are considerable and potentially result in significant damage, including loss of life, massive property destruction, and severe long-term consequences [20]. For instance, in southeast Asia, the Xepian-Xe Nam Noy hydropower dam in Laos collapsed in July 2018 after a heavy rainfall event that released over 5 billion cubic meters of water, affecting around 11,000 people [21]. More recently, in the United States, a dam located in Central Michigan failed in May 2020 after two days of rain, displacing about 10,000 people from downstream areas [22]. A large part of these impacts can be mitigated and avoided if traditional design parameters consider climate trends in future risk assessments [23]. Unless dams are constructed considering future CC scenarios, they may present risks to society by fostering a sense of security that ignores lessons from experience [19]. As described, dam safety considering the influence of CC is an issue that needs urgent attention. A holistic analysis may serve as a dam safety management supporting tool to evaluate dams’ vulnerability to CC and define future adaptation strategies [24].
The inclusion of CC in the design and construction of dams has been growing as societies have become increasingly aware of its effects. However, the methodologies proposed in other studies do not detail the stages to be considered in a general way so that the effects of CC could be included in studies and designs carried out worldwide, especially in developing countries. For these reasons, in this work, the authors analyze the risks of dams under CC conditions with a focus on the spillway as one of the most vulnerable components. The analysis includes some worldwide cases in which dams failed and others in which the risks were minimized by applying a variety of construction strategies. The article also seeks to define a general methodology for the hydraulic analysis under CC conditions, which is applied to a case study aiming to evaluate the impact of CC on the original design of the spillway of the Sube y Baja dam in Ecuador. The plan is for this dam to serve a population of ~18,471 inhabitants (2016), and its construction would be especially for irrigation purposes, downstream flood-control, and, with lower priority, for water consumption. To this end, issues related to the safety of dams in a changing climate are presented in Section 2, in Section 3, some approaches to spillway design under CC are reviewed, in Section 4, the Probable Maximum Precipitation (PMP) value is analyzed as a means to make safer hydraulic infrastructure, in Section 5, a general spillway design framework for CC conditions is proposed, in Section 6, the case of the Sube y Baja dam is presented, and some concluding remarks and discussions are developed in Section 7.
2. Dams’ Safety in a Changing Climate
Although there are some uncertainties in CC studies, especially regarding future precipitation, they are mostly related to inter-model differences in amounts, rather than to the trend of expected changes [25]. Inter-model uncertainties related to changes in temperature are very limited. An approach to implement the effects of CC in recent studies is the use of Representative Concentration Pathways (RCPs), which are predictions of how greenhouse gas (GHG) concentration in the atmosphere would change in the future. Indeed, as the emission scenario worsens (from RCP 2.6—optimistic scenario to RCP 8.5—pessimistic scenario), the discharge contributions and the increase in evapotranspiration related to the rise in temperatures are expected to reduce the water levels in dams during dry seasons [14], and the increase in precipitation may produce higher levels during wet seasons. RCPs are considered useful in CC studies because they facilitate the prediction of long-term temperature and precipitation behavior under radiative forcing scenarios that include physical and anthropogenic factors. The use of RCPs is appropriate to consider the effects of CC in the design of water management infrastructure, including assessment and dam design improvements [1,24,26], as in the case of the Sube y Baja dam, the subject of this study (see Section 6).
CC is causing the hydrological cycle to quicken as rising temperatures increase the rate of evapotranspiration. On average, the increase in evapotranspiration is causing more precipitation [27]. Hence, CC modifies the frequency and intensity of precipitation events, disrupting the hydrological pattern, and generating a direct impact on the resilience of dam operation [28,29,30]. Extreme rainfall results in an increase in dam flow, leading to a higher possibility of floods, which compromise the structure and operation of dams. The challenge when an extreme event occurs is to minimize the flood peak at the control point downstream and ensure that the water level is below the critical height [22,31]. If CC effects are not considered, there is a high potential to increase failure risk due to insufficient existing storage and spillway capacity and the underestimation of the outcomes of extreme events [31]. Although particularly complex, dam risk evaluation can provide a reasonable basis for risk management, the importance of which has increasingly been recognized by both academic researchers and managers [32].
Throughout the lifetime of a dam, it is continuously exposed to risk due to extreme precipitation events and other natural or operational hazards. CC may exacerbate this exposure due to its effects on Earth’s atmosphere, which has a direct connection with the water cycle and, therefore, with the water level in dams [26,33]. In the past, most risk assessment approaches assumed stationary conditions in precipitation and water routed to reservoirs [1,14,33]. Nevertheless, CC is affecting weather patterns and the frequency of extreme events that influence dam failure risks; thus, the assumption of a stationary climatic background is no longer appropriate for long-term dam safety adaptation and support for decision making [24,31]. Therefore, there is an urgent need worldwide to modify traditional approaches considering CC to improve design parameters and reduce risks that may produce major consequences to populations downstream [34,35,36].
CC consideration in the design of dams is not a regular engineering practice to date [37]. However, several reports attribute the failure of dams to extreme events related to CC, the frequency and intensity of which is projected to increase in this century [1,13,14,22,31,32]. A summary of possible CC impacts in dams is presented in Table 1.

Table 1.
Possible climate change impacts in dams. Adaptation of (Fluixá-Sanmartín et al., 2018.).
Dams, as important and high-hazard structures for water and electricity supply, need ancillary components and facilities, such as spillways, to allow them to pass design floods [4]. Spillways are designed to release excess water or floodwater that cannot be held in the assigned storage space. The excess is normally drawn from the top of the reservoir and routed through a constructed waterway back to the river or some natural drainage channel. The importance of a safe spillway cannot be sufficiently emphasized; many dam failures have been caused by poorly designed spillways resulting in dam structure and downstream population damage [45]. CC increases the risk factors for dams due to changes in atmospheric conditions (Table 1), making it necessary to design more hydraulically efficient spillways to ensure the safety of existing and new dams. To this end, it is required to modify or update the design parameters used for the construction of spillways, so that they consider CC as part of the analysis of future atmospheric conditions [46].
3. Approaches to Spillway Design to Cope with Climate Change Conditions
In dams’ operation, the spillway releases the excess water from an elevated reservoir into a stilling basin to dissipate energy prior to downstream discharge into the river. Optimized spillway design minimizes the river scour and controls the erosion of bed material. Proper and sustainable dam operation requires a systematic discharge of excess water based on the water level and rainfall events, as well as the provision of sufficient capacity [31]. The spillway must be hydraulically and structurally adequate and must be well located so when it releases water, it does not erode or undermine the downstream base of the dam [45]. The spillway type and design are major hydraulic challenges, and the right selection and layout are critical for dam safety. Topography, hydrology, geology, dam body type, dam construction, and site conditions are key in the selection of the spillway type and location [47]. Essentially, considerations are largely based on the experience of engineers in practice.
The best location for the spillway is within the dam body. Although topography is the main factor in the spillway design and construction, the maximum discharge capacity should not be neglected. For instance, when the discharge is high and the conditions of the site are challenging due to topography and geological formation, spillways are built in tunnels on the abutments. This is the case for earthfill and rockfill dams, where spillways are built on the side of the dam with adequate geological formation. In engineering practice, lateral flow spillways are mostly used for extreme conditions [47]. Based on discharge capacity, spillway Type III and VII are used for 1000 m3/s, Type V for 1500 m3/s, and Type IV and VIII for more than 2000 m3/s; however, Type III is usually preferred for low flow discharge and Type V for asymmetric flow patterns caused by a combination of low and high values of approach velocity. Type VII is commonly used in roller-compacted concrete and hardfilll dams. Finally, ungated spillways are generally used in Type II, Type III, Type V, and Type VII for irrigation, flood control, or recreational purposes (Figure 2) [45,47].
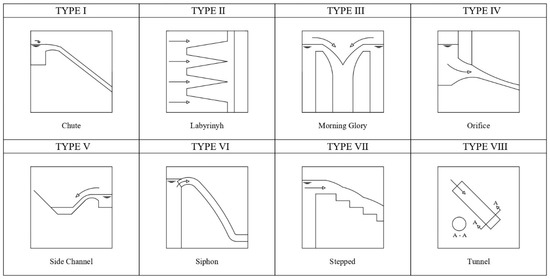
Figure 2.
Overview of several spillway types. Adapted from: [47].
There are several cases where spillways or dams’ designs have not been able to cope with the effects of CC. Therefore, various proposals to mitigate this issue have been discussed. For instance, the implementation of auxiliary spillways, such as the Warragamba Dam in New South Wales, Australia [48]. The auxiliary spillway works in the case of an extreme flood event supporting the dam discharge capacity. The central spillway of the dam manages the normal discharge of floodwater up to around the Annual Exceedance Probability (AEP) flood [48] Another approach could be the implementation of fuse plugs defined on the existing spillway, as at the Douglas Dam in Fort Collins, Colorado, USA. Fuse plugs are basically earth and rockfill embankments constructed across the upstream crest of the spillway. They improved flood control by increasing the auxiliary spillway capacity to pass the incoming floodwaters [49]. Another example is the implementation of a bypass or a diversion dam, which was defined as a proposal for flood control in the Cañar and Bulubulu rivers in Ecuador to reduce the impact of floods in the dam under CC conditions. The bypass allows for the diversion of a part of the river’s flood to another river system, whether natural or artificial [50].
4. Considerations Related to the Probable Maximum Precipitation (PMP)
As we showed in previous sections, every element of a dam design is important to its stability. However, according to the US Bureau of Reclamation (USBR), the spillway design flow of a dam must consider water uses and land or social impacts around its location. In the event of dam failure, the spillway must be capable of evacuating the flood caused by the Maximum Probable Precipitation (PMP) as a climatological risk [45]. Commonly, the design flow for maximum flood is defined by analyzing the available historical data from hydrometeorological stations that are located within or nearby the river basin. However, historical data may not properly reveal the reality of CC trends. For instance, in 2017, extreme events in California increased the water levels of Oroville Lake, damaging the spillway. This event ended in the evacuation of around 188,000 people and USD one billion in repair costs [51]. Another example is the well-known case of the Chapucal dam break (Santa Elena province, Ecuador), which occurred during El Niño 97-98 ENSO phase, where the lack of discharge capacity of the spillway produced dam breakage, affecting a great portion of the nearby population [52].
PMP was introduced in engineering practice as a safety design standard to consider the climatological risk while designing a dam [1]. It represents the theoretical maximum amount of rainfall to which a particular area can be exposed for a given period under current meteorological conditions [1,53]. PMP, which is a key parameter in the design of a variety of hydrological structures, also plays a critical role in floodplain management, where it is set to correspond to the extreme potential risk of flooding at a given time and place. PMP is consequently very useful for hydrologists to estimate the probable maximum flood and thus, the most appropriate spillway type to minimize the risk of overtopping in a particular hydraulic structure, such as a dam. With the correct selection and design of the spillway, the risks of human losses, damages, and impacts on the community can be minimized and managed [54].
PMP estimations, along with watershed models to calculate flood runoff, have been widely accepted in recent decades as a basis for the evaluation and design of spillways in dams where structure failure cannot be tolerated [55]. However, a drawback of conventional PMP estimation is the omission of a long-term climatic trend analysis, which is expected to continue in the future. In fact, CC trends suggest that the intensity and frequency of extreme precipitation events will change [1,56]. Under the effects of CC, like other hydroclimatic variables, PMP is also expected to increase over the years due to the increase in atmospheric moisture content and consequently, higher levels of moisture transport into storms [57]. Thus, traditional PMP estimation does not provide any information on uncertainty, making it less appealing for risk assessment scenarios. Because of this, it is important to study more alternatives to this commonly used parameter; for instance, it has been determined that there is a potential to develop more physically based PMP estimation approaches [1].
Some studies have recently analyzed shortcomings related to conventional PMP estimation [1,24,31] and as a design tool for meteorological risk, state its importance when it is modified under CC considerations [31]. The research presented by Chen and Hossain (2019) explored a “hybrid” method merging both the conventional PMP estimation of moisture maximization and Earth System Model (ESM) data in the U.S. Pacific Northwest. The hybrid approach tends to provide more consistent PMP estimations of the historical period, which makes the interpretation of future increases easier. This study showed the importance of an evaluation of common methods used in dam design considering CC trends to avoid issues with the infrastructure and operation in the future. The necessity of this methodological improvement becomes more pressing when considering the failures that have occurred in dams worldwide [21,22,51,52].
5. Methodology Considering CC in the Spillway Design/Redesign
The spillway design including CC analysis is based on four stages: data gathering and hydro-climatic, hydrological, and hydraulic analyses (design/redesign) (Figure 3).
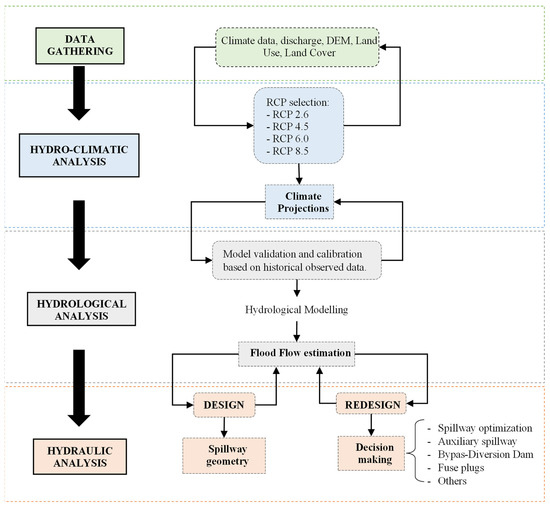
Figure 3.
Methodology of spillway design including CC considerations.
During the data gathering stage, all input data from previous studies, observed data of hydrometeorological stations, satellite remote sensing information, data from Global Climate Models (GCMs), and cartographic maps are collected. Previous studies provide a general project overview and contribute to the methodology and therefore decision making. At first, having data from hydrometeorological stations near or around the project site is desired; however, this is not always possible due to the lack of data or the non-existence of nearby stations. So, other options must be considered, such as satellite data or the use of other stations by applying well-known methodologies, e.g., regression analysis and interpolation with other stations, among others.
The hydro-climatic analysis stage is developed with the use of climate projections that enable the inclusion of CC in the analysis. The projections used come from the international efforts on CC, where the Intergovernmental Panel on Climate Change (IPCC) presented four emission scenarios called Representative Concentration Pathways (RCPs) for the development of future projections in the context of CC [58]. The trajectories in the IPCC’s fifth report present an optimistic scenario of low GHG emissions (RCP 2.6), two stabilization scenarios, considered neutral (RCP 4.5 and RCP 6.0), and a pessimistic scenario with high emissions (RCP 8.5). In this stage, it is important to define the trajectories to be selected depending on the objectives of the study [58,59]. For instance, for high-hazard dams, the use of the less conservative scenario (RCP 8.5) is recommended. Once the future scenario is selected, the atmospheric variables such as temperature and precipitation must be obtained as inputs for the following stages.
For the hydrological analysis, the model is set up, and then, calibration and validation processes are carried out to ensure that the model replicates the hydrological processes of the basin [60]. For the model calibration process, hydrological parameters are evaluated and readjusted to match observed and simulated flows. Once the model is acceptable based on performance indicators, a validation process is developed with a different set of input data to verify the capacity of the hydrological model. Once the model is validated, the output data (projected flood flows) will become key input data for the next stage [52,60].
Finally, the hydraulic analysis includes two options: design or redesign, which depends on the project’s objectives. In the case of a new dam/reservoir project, the spillway design is developed based on the maximum flood flow considering CC. On the other hand, if there is existing construction on the project site or if the design phase is already completed, a redesign of the spillway considering CC analysis could be required. In this regard, it is necessary to make decisions to improve the physical performance of the spillway such as spillway optimization, including an auxiliary spillway, incorporating a bypass-diversion dam, or including fuse plugs, among others [48,49,52].
6. Case Study: Evaluating the Impact of Climate Change in the Spillway Geometry of the Sube y Baja Dam in Ecuador
The north-central part of Santa Elena Province is affected by dry seasons and the low availability of water resources. These meteorological conditions impact socio-economic activities by blocking the development of crop areas that could be incorporated into the national agricultural production. The Sube y Baja project aims to supply water permanently to 80% of the agricultural sector of Santa Elena from Chongon reservoir and then transfer it to a new reservoir called Pedregalito (Figure 4). During the planning stage, it was discussed that a failure of the dam structure would have major consequences affecting the Zapotal hydrological system, specifically the Sube y Baja town (~18,471 inhabitants) and the infrastructure downstream of the dam. Damage would be mainly reflected in the El Azucar dam, the drinking water treatment plant that supplies a large portion of the inhabitants of the province, the Azucar–Río Verde irrigation canal, and the Guayaquil–Santa Elena Road [61].
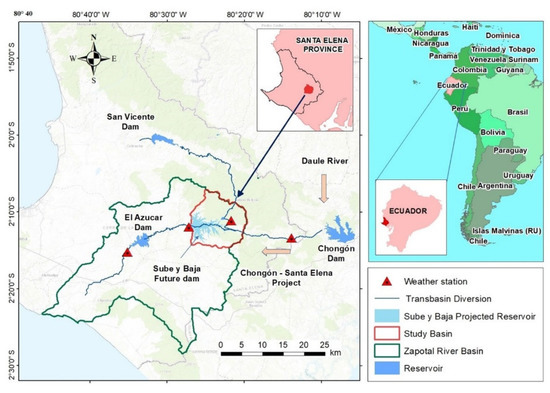
Figure 4.
Chongón–Santa Elena transfer system and the Sube y Baja dam.
6.1. Study Area
The Sube y Baja dam is located in the Cachul river basin, in Santa Elena province, in the coastal region of Ecuador (Figure 4). The basin has an area of 137 km2 and belongs to the Zapotal hydrographic system that drains to the El Azúcar dam, located at the bottom of the commune of the same name [62]. Santa Elena province is characterized by a dry, arid climate, mainly in the coastal areas; therefore, the province needs water transfer for its productive activities. Santa Elena receives water through the Chongón–Santa Elena transfer system, supplied by the Daule-Peripa reservoir, which diverts flow to San Vicente and El Azúcar dams [62]. The soils of the region are colluvial–residual in nature, dominated by different geological units such as volcanic and sedimentary bedrock [63].
The study area has an average annual rainfall ranging between 600 and 750 mm [64]. However, in the western part of Santa Elena Province, this average drops to 150 mm per year. There are two main seasons, the dry season from June to November and the rainy season from December to May [64]. The main source of interannual climate variability is El Niño Southern Oscillation (ENSO), and decadal climate influences are caused by Pacific Decadal Oscillation (PDO) [65]. The warm phase of ENSO affects the coastal region of Ecuador during austral summer, with increasing precipitation levels, which have historically affected water infrastructure, especially in populations with incipient development. This impact also affects the inhabitants’ health due to the collapse of sewage systems or overflowing of wells and water reservoirs, which causes an increase in tropical diseases such as Dengue and Chikungunya [66].
6.2. Basic Information of the Original Design of the Overflow Spillway
The design parameters of the Sube y Baja dam are defined in Table 2. The dam includes drainage to allow occasional emptying for maintenance purposes or in the case of an emergency event. The dam was also designed to be able to operate as a water intake to supply water and cover the demands for irrigation [61].
Table 2.
Design parameters of the Sube y Baja dam components.
The Sube y Baja dam was designed with loose material and clay. The crest elevation is at 100 m.a.s.l., and the dam’s total height and length are 38 m and 550 m, respectively. The overflow spillway has a rectangular shape with a Creager profile crest. The structure material of the spillway is reinforced concrete, which is located on the left bank of the Sube y Baja dam. Figure 5 shows the implementation plan of the overflow spillway and the stilling pool placed at the bottom of the dam.
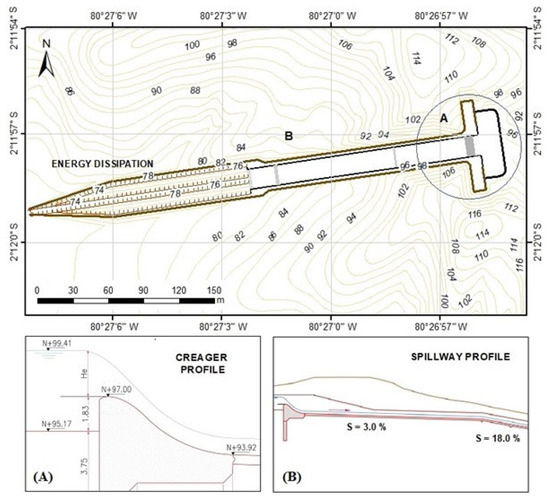
Figure 5.
Spillway designed for the Sube y Baja dam. Adapted from: [61]. (A) Creager profile, (B) Spillway profile.
6.3. Methodology for the Spillway Optimization for the Sube y Baja Dam
The methodology proposed in the previous section was applied to the case of the Sube y Baja dam. It follows the four-stage procedure presented earlier, e.g., data gathering and hydro-climatic, hydrological, and hydraulic analyses. All the theoretical and mathematical support is presented in Appendix A.
6.3.1. Data Gathering Stage
At this stage, information about the pre-feasibility of the Sube y Baja dam project was provided by the Santa Elena Government. The daily records of observed rainfall data were collected from Sube y Baja and Julio Moreno meteorological stations from the National Institute of Meteorology and Hydrology (INAMHI). Additionally, daily precipitation data were obtained from the Third Climate Change National Communication (TCN) for present and future CC scenarios. Finally, cartography, topography, geomorphology, land use, and soil cover maps were obtained from online platforms of local entities. The soil type in the study area is mainly constituted of fine materials such as clays, silts, shales, and fine to medium-grained sandstones [67]. Table 3 shows the information details gathered for this study.
Table 3.
Spatial and temporal information available.
6.3.2. Hydro-Climatic Analysis Stage
For this stage, the RCP 8.5 was selected. This RCP is the least conservative since it assumes a high level of GHG emissions in the future [58,68]. Despite being considered conservative, during the first twenty years of the present century, several studies show that measurements of GHG emissions agree with RCP 8.5 [69,70]. The precipitation information was obtained from the TCN climate dynamically downscaled data. The downscaling process was developed with the Weather Research and Forecast (WRF) model. These data have resolutions of 10 km and cover a period from 1981 to 2005 for the historical data, and from 2011 to 2070 for the projections under CC conditions. The input files for the WRF model came from CSIRO-Mk36, GISS-E2, and IPSL-CM5A-MR climatological models [71]. Percentile correction was applied using the QMAP library [72], which uses the comparison and correction of the historical data modeled for the historical period (1981–2005) to the future period (2011–2070).
6.3.3. Hydrological Analysis Stage
PMP was estimated during the third stage. The daily future precipitation considering CC, obtained as output from the previous step, was transformed into maximum 24-h precipitation by multiplying it with a factor of 1.2 [73].
PMP was obtained based on the maximum 24-h precipitation using the Hershfield method Ec. A1 (Appendix A—Appendix A.1.1). Once the PMP was estimated, the IDF curves of Julio Moreno and Sube y Baja meteorological stations were developed (Figure A1, Appendix A—Appendix A.1.2). With the IDF, the pluviometric equations were obtained for PMP, which were used to estimate the maximum intensities for each time step and to generate the hyetographs for PMP using the alternating block method which is presented in Ec. A2 of Appendix A.1.2—Appendix A [74,75]. The hyetograph is the input data for the HEC-HMS hydrological model.
In the model, the basin was divided into fifteen sub-basins characterized by different land uses and soil types, in addition to the topographic features. Several parameters related to the sub-basin features were considered in the HEC-HMS model in each of the three calculation processes: the Infiltration Loss Calculation, the Rainfall-Runoff Transformation, and the Flood Flow Calculation process. In the Infiltration Loss Calculation Process, the Soil Conservation Service (SCS) method was used, and the Curve Number (CN) parameter was defined for each sub-basin for agricultural, suburban, and urban land uses. For the Rainfall-Runoff transformation process, the Clark unit hydrograph method was used, the concentration (tc) and return time (tr) parameters were defined by using Ec. A3 (Appendix A—Appendix A.2). Finally, for the Flood Flow Calculation process, the Muskingum transit method was used (Ec. A4, Appendix A—Appendix A.2).
6.3.4. Hydraulic Analysis Stage
Finally, at this stage, the original design flow estimated in previous studies and the flow under CC conditions were compared. The Sube y Baja spillway needs a redesign due to the flow under CC conditions which was higher than the original design flow. More details can be found in Appendix A—Appendix A.3. In this context, to optimize the spillway, the dimensions were redefined using the general equation for the discharge flow, which includes variables of length (L) and height (H) of the spillway (Ec. A7, Appendix A—Appendix A.4). The discharge coefficient C was obtained from Figure A2 (Appendix A—Appendix A.5).
6.4. Case Study Results
All results include the original design, as a reference, and the redesign determined under CC conditions with RCP 8.5. Finally, the comparison between spillway dimensions is presented to analyze the impact of implementing CC conditions in infrastructure projects such as dams and their components.
6.4.1. Hydrological Analysis
The hyetographs with the representative rainfall of the watershed show around a 20% increase from 290 mm to 350 mm in the precipitation peaks (12 h) when CC is considered (Figure 6). The hyetographs are the input data for the hydrological model, thus directly affecting the flood flows as the model output data. In this regard, the increase in precipitation turns into larger water volumes, which are not considered in the original design.
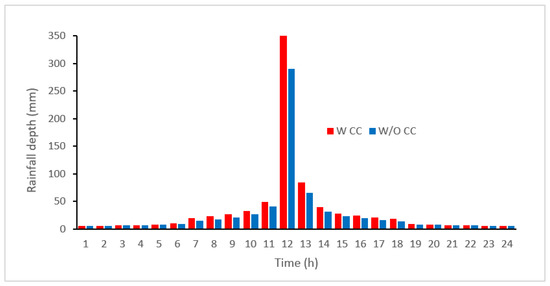
Figure 6.
Precipitation hyetograph for PMP with CC (W CC) and without CC (W/O CC).
HEC-HMS calculated the flood flow hydrographs for the Cachul watershed, showing values of 2819.3 m3/s and 2253.5 m3/s using the PMP with and without CC, respectively, which represents a difference of around 25% (Figure 7). The estimated design flows for PMP considering CC will cause over-storage in the Sube y Baja dam reservoir, making it necessary to verify the design capacity of the original spillway through a hydraulic analysis.
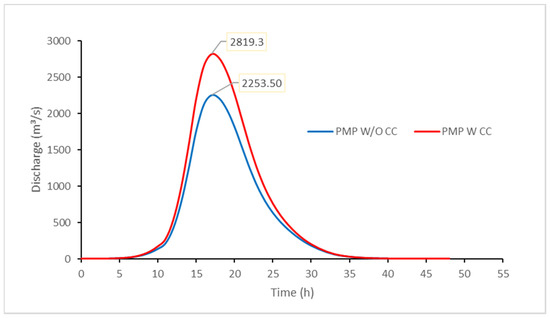
Figure 7.
Flood hydrograph for the probable maximum precipitation with (PMP W CC) and without climate change (PMP W/O CC).
The original inflow hydrograph shows a peak of around 2200 m3/s, which is 25% less than the one that considers the PMP with CC. The outflow hydrograph considering CC has a peak of 228.99 m3/s, exceeding the maximum flow without CC of 135.32 m3/s (Figure 8), which again implies a revision of the original design of the spillway is necessary. Usually, the overflow structures are calculated based on a given flow rate, and therefore, the underestimation of these structures will not provide the capacity to release the excess flow that could occur under a CC scenario.
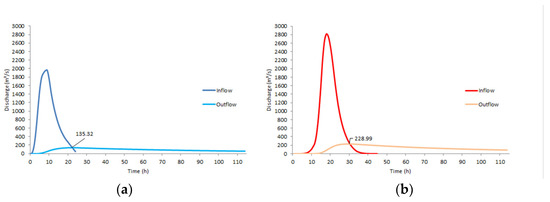
Figure 8.
Flood transits based on the original design with PMP (a) without CC and (b) with CC.
6.4.2. Hydraulic Analysis
The original spillway design was developed to discharge the overflow water gradually and in a controlled manner if the dam could support the design flood volume of 76 hm3. However, when CC is considered, the dam does not have the capacity to store a larger flood volume (~100.5 hm3). In this case, the spillway must evacuate the water to prevent the water level from exceeding the dam crest. The considerable difference between the flood flow with CC and the one without it led to a rigorous check of the spillway dimensions to verify their capacity. Hence, it is necessary to redesign the hydraulic structure to allow the evacuation of the excess water of the Probable Maximum Flood (PMF).
The redesign consists of a change in the spillway geometry, where the width was modified from 17 to 62 m to adapt its capacity to the flood flow up to 633.61 m3/s under CC conditions (Figure 9). The design load increased from 2.41 to 2.8 m, setting the crest elevation al 101 m.a.s.l. (1 m above the original design). Under these considerations and due to the topographic conditions of the study case, it was not possible to consider an increase in the spillway height. Table 4 shows the hydraulic characteristics of the overtopping spillway redesign under CC conditions.
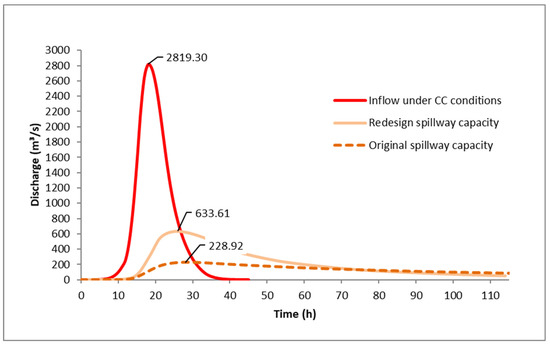
Figure 9.
Inflow and outflow hydrographs for the original and redesign excess spillway.
Table 4.
Comparison of the hydraulic parameters between the original design and the redesign for the Sube y Baja dam.
Figure 10 shows the comparison between the spillway overtopping original design versus the redesign and their maximum load levels. The redesign ensures that reservoir water levels do not exceed the maximum head level and stay below the crest level of the dam. An excessive increase in the reservoir water volume implies additional pressure forces over the dam structure, which might affect the spillway’s stability and might compromise the operation of the dam.
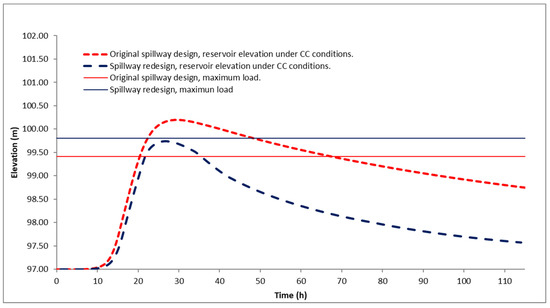
Figure 10.
Comparison of reservoir levels with maximum flood for the Sube y Baja Dam.
7. Discussion
Dams are mainly designed under the hypothesis of climatic stationarity, then calculating the PMP, and making use of derived flows. To consider non-stationarity in the climatic signal is not a mere academic exercise, but an urgent procedure to evaluate the capability of dams to cope with CC conditions. The Santa Elena Province, where the Sube y Baja dam is located, is bordered by the Pacific Ocean, where El Niño produces above-average precipitation. To date, no studies related to the safety risks of dams in this region are available, especially during El Niño 1982/1983 and the so-called “The Monster” El Niño 1997/1998, in which reservoirs were overflooded, and in the latter event, the Chapucal dam failed due to the inadequacy of the spillway “Morning Glory”, ending in the destruction of more than 40 houses and the displacement of 120 families. Such events make evident the importance of revisiting hydraulic structures design criteria under CC conditions, especially in regions where more rainfall and extreme events are expected.
In the case of the Sube y Baja dam, the inclusion of CC using precipitation projections under RCP 8.5 showed a PMP increase of ca. 20%, and a 25% increment in the maximum flow over the spillway. These results agree with previous studies. In [76], non-stationary PMP recalculations were reported at South Holston Dam in Tennessee, Folsom Dam in California, and Owyhee Dam in Oregon in the United States, indicating that currently accepted PMP values are significantly increased when future changes in dew points from observational trends or numerical models are considered. In the Alabama–Coosa–Tallapoosa (ACT) river basin, [77] produced high-resolution simulations for 120 storms using the Weather Research and Forecasting model, WRF, with future climate models. They reported that PMP increased ca. 20% for 2021–2025 and 44% for the 2017–2100 period, in relation to the 1981–2010 baseline. They suggest that the projected increase in precipitation extremes in a warmer environment is reasonable for a more in-depth examination of the PMP.
In Section 5 of the present study, we propose a general four-stage methodology. However, the consideration of the uncertainties related to each stage is still lacking [78]. In [79], the sensitivity of 120 relative-humidity PMP storms for present and future climate was evaluated over the Alabama–Coosa–Tallapoosa (ACT) river basin in the southeastern United States, showing that the most sensitive factors were those related to meteorological and climate forcings, followed by antecedent soil moisture, reservoir storage, and finally, land use and land cover change. For instance, in under-monitored basins which are usual in developing countries, at least the most sensitive factor, the climate change signal, is advisable to be considered. In fact, projections of climate change are characterized by considerable uncertainties, e.g., future climate scenarios, the selection of adequate global climate models and downscaling approaches, especially for impact studies, and bias correction [80]. To quantify the uncertainty related to each stage of this climatic signal would take enormous effort, which should be added to the evaluation of uncertainties in the remaining factors. In the Sube y Baja case study, the inter-model uncertainty was partially addressed due to the computational burden of using a regional model to downscale the global climate models. When using statistical downscaling approaches which are less computationally costly, the use of more climate models is advisable [81].
Although the PMP increase highlights the risks related to CC conditions, in Section 2 of this study, the description of the vulnerability of dams under CC conditions was presented. Risks caused by erosion, temperature changes, blockage due to debris from changes in the basin, and sedimentation should be also considered (Atkins, 2013). Thus, to consider the risks of dams, an evaluation of risks related to catchment conditions is key to an adequate assessment. Among several, the main impact mechanisms related to rainfall are the increase in storms leading to higher runoffs and landslides or the drying of catchments producing sediments around the spillway. Additionally, with the increase in the frequency of stored floodwaters, keeping the soil with high moisture affects the health of trees and vegetation, which may increase the potential of spillway blockage. In line with this threat is the occurrence of droughts followed by strong rainfall seasons, which is a characteristic feature of CC due to increasing extremes (Atkins, 2013). Therefore, the assessment of risks related to CC should not only be limited to the hydrologic component, but rather should encompass a broader analysis of factors affecting the flows in the catchment under study.
Biophysics risks have the potential to affect the structure and functioning of a dam; nevertheless, the decision of its construction also considers the social impacts of the project. Thus, multipurpose dams bring many benefits to the direct population and in general to the entire region since the main objective is to cover different water deficits that are one of the causes of the stagnation of economic growth. In general, a dam represents job opportunities, investment, economic development, among other assets [82]. However, it should not be forgotten that many large-scale dams have brought serious consequences to the environment and to the population nearby the construction site in terms of fishing and agricultural losses [83,84]. These communities are also exposed to flooding and in many cases even involuntary resettlement. There are several opinions about the significance of the risk associated with the construction of a dam, and there are arguments for and against it, but the final decision is mostly dependent on the previously defined benefits.
In fact, the relevance of the implementation of the Sube y Baja dam lies in its strategic geographical location and the adequate storage capacity, which would allow the provision of permanent irrigation water to approximately 80% of the agricultural land in the Santa Elena Province. The irrigation area will cover 5620 ha, which will mainly benefit the Sube y Baja, Calicanto, and Azucar communities. This project will also supply water to the Pedregalito reservoir which benefits an approximate population of 18,471 inhabitants. In this regard, the dam has a strong social contribution not only to the local sector but also at a provincial level. The irrigation water supply enables the population to develop economically in the agricultural sector, which will improve the life quality of the inhabitants. However, the final version of the current project design does not include climate change scenarios, and yet, the excess spillway was designed with maximum probable precipitation unable to withstand the magnitude of the extreme precipitation events calculated under CC conditions, and therefore, its future construction may represent a potential risk to the population downstream if climate change remains ignored.
8. Conclusions
In this study, the main safety issues of dams due to climate change were reviewed, and then, the case of the redesign of the Sube y Baja dam’s spillway was shown. Dams are one of the most vulnerable and expensive types of infrastructure and could present structural failure after extreme weather events. CC is responsible for several threats to the safety of dams, as reported by several studies. For instance, climate change is expected to increase flood risk by changing the distribution, variability, and intensity of rainfall events. Additionally, reservoir water levels can be altered due to precipitation variability, potential evapotranspiration, and a decrease in ice storage related to climate change. The spillway performance may be also affected by changes in temperature related to CC, causing structural deformations to the spillway gates. Such changes in temperature may affect other concrete dam components, whereas extreme precipitation may increase the sediment content, making spillway gates prone to abrasion processes. Thus, several risks to the dam’s safety are exacerbated by CC, and several studies have highlighted spillways as especially vulnerable to extreme events related to CC.
The flow under CC conditions should be included in the spillway design during the conceptualization of development projects due to its vulnerability to climate change effects. Meanwhile, for dams that are already built, a comparison between the original flows with the flows under CC will determine a spillway redesign or a search for other alternatives such as, but not limited to, (a) the construction of an auxiliary spillway, (b) the enlargement of the dam, (c) the increase in the storage volume to buffer the flood, (d) fuse plugs to relieve excess water in a progressive and controlled manner, or (e) diversion dams to reduce the inflow to the reservoir. Regarding the Sube y Baja dam case study, resizing was proposed as a decision-making tool for the redesign at the hydraulic analysis stage. However, modifications to the original design without CC may cause additional construction costs. For future works and research, further exploration of these alternatives could be developed in depth. The measures to be taken require a holistic analysis and will depend on the spillway type being analyzed and the difference between calculated flows.
For the design of hydraulic infrastructure oriented to spillway design, the PMP calculation method is traditionally considered. PMP, as a climatological risk, allows the floods that the spillway must be able to evacuate to be defined. However, under CC conditions, this method may have two main caveats if used in the traditional way, e.g., (i) given the considerable trends measured in meteorological variables, should PMP be applied to data measured from the past, or applied to projected data, or better, a compromise of both may be more adequate; (ii) the PMP method is mainly based on statistical groundings; should we consider more physically based criteria, as some authors have proposed? This issue is not closed, but it is rather important to consider if CC will be included in the design process. In this context, a comparison of the different methods to be applied for PMP estimation involves a big opportunity for future works to know how the methods differ from each other and how they affect the design. In this study, the PMP was estimated with projected data by using the Hershfield method (Equation (A1)), which is the most used, and it is based on the statistical analysis only from the annual series of maximum daily rainfall, including the mean and standard derivation in the equation.
This study and others related to infrastructure design emphasize CC as a key factor in hydraulic design practices. Due to the exponential increase in dams around the world in recent decades, climate change analysis becomes imperative for all hydraulic designs (in the case of new dams) or redesigns (in the case of existing dams). The proposed methodology is very general, and it aims to establish the main steps to make a complete analysis that includes climate change, hydrological modeling, and hydraulic design to ensure that the overflow spillway has the capacity to evacuate the excess flows to protect the infrastructure itself and especially the downstream inhabitants. Certainly, each reservoir has unique characteristics, and therefore, the methodology is a guide rather than a tailor-made approach. Although the proposed methodology has its limitations, the main intention is to highlight that if climate change scenarios are not considered in the design or redesign of excess reservoir spillways, the consequences could be deadly. Decision makers and authorities working in flood hazard and risk assessments ought to consider the outcomes of these studies as scientific evidence for changing policies and regulations that require the inclusion of climate change scenarios for hydraulic infrastructure projects that could potentially compromise the safety of communities downstream.
Author Contributions
Conceptialization, J.E.H., L.C. and L.E.M.; methodology, J.E.H., M.J.G. and V.M.; software, J.E.H.; validation, L.C. and V.M.; formal analysis, L.E.M., M.J.G., P.H., C.M. and V.C.; investigation, J.E.H. and L.E.M.; resources, L.C., V.M. and J.E.H.; data curation, L.C. and J.E.H.; writing–original draft preparation, L.E.M., M.J.G. and J.E.H.; writing–review and editing, L.E.M., V.M. and L.C.; visualization, J.E.H.; supervision, V.M., L.C. and L.E.M.; project administration, L.C. All authors have read and agreed to the published version of the manuscript.
Funding
This research received no external funding.
Institutional Review Board Statement
Not applicable.
Informed Consent Statement
Not applicable.
Data Availability Statement
The data used in this study are available upon request to the corresponding author.
Conflicts of Interest
The authors declare no conflict of interest.
Appendix A
Appendix A.1. Calculation of the Design Storm Based on the PMP with Historical and Future Precipitation
Appendix A.1.1. Estimation of Probable Maximum Precipitation (PMP)
The PMP calculation requires 24-h annual maximum precipitation [73]. The Hershfield method was used, which is based on the general frequency equation of Chow [54].
where PMP is the Probable Maximum Daily Precipitation in mm. : are, respectively, the mean and standard deviation of the annual series of maximum daily rainfall in mm. is the frequency factor which is a function of the mean rainfall [54].
Both are pre-corrected values by the maximum precipitation value observed in the series and by the record length. K depends on the duration of the PMP (24 h) and the annual mean of the maximum values [54].
Appendix A.1.2. PMP Distribution Graph and 24-h-Design Hyetograph
Using the Hershfield method to obtain PMP and applying the universal relationships described by Bell (1969) and Chen (1983) (Figure A1), the IDF curve (intensity, duration, and frequency) was obtained for the Julio Moreno and Sube y Baja stations (Figure A1).
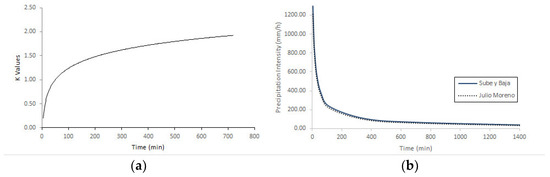
Figure A1.
(a) K values vs. time chart, (b) IDF curves for PMP of Sube y Baja and Julio Moreno stations.
The hyetograph for PMP was defined using the alternating block method (McCuen, 1998); this method specifies the amount of precipitation for successive time steps of duration (Δt) over a total duration of Td = n ∗ Δt [75]. The average intensities were obtained as a function of the area covered by each station based on the Thiessen polygons for each return period, and then the intensity is multiplied by the time (Equation (A2)).
where P = precipitation height (mm); I = precipitation intensity (mm/h); Δt = time step.
Appendix A.2. Crescent Flow Calculation Using the HEC-HMS Hydrological Model
The HEC-HMS hydrologic model uses the precipitation hyetographs obtained with historical and climate change information for the generation of outflows at the end of the basin. The SCS Soil Conservation Service method was used to calculate the Infiltration Loss. Curve Numbers (CNs) were determined for each sub-watershed. For this case study, antecedent moisture type II was chosen, which represents an average runoff potential based on the total precipitation in the five days prior to the event [75].
The Clark unit hydrograph method was used to transform rainfall into the flow. This is a robust method due to its theoretical foundation and fits the natural unit hydrograph, which requires the values of concentration time and lag time. The concentration time was determined using the California Culverts Practice (Equation (A3)), while the lag time was 0.6 times the concentration time.
where Tc is the concentration time (h); L is the length of the main channel (km); H is the difference in elevation between the farthest point and the analysis point (m).
Muskingum’s method is a hydrological flow routing model for routing hydrographs through stream reaches, which describes the transformation of discharge waves in a riverbed using two equations. The first one is the continuity equation (conservation of mass), and the second one is the relationship between the storage, inflow, and outflow of the reach (Equation (A4)) [85,86,87].
where Qs = outflow; Qe = inflow; 1 and 2 = start and end of the interval Tci. K is the travel time taken for the crescent to go through a given reach and is calculated by the equation: K = 0.5Tc. Tc is the concentration time in the main channel of the sub-basin.
The X factor is a weighting parameter that determines the extent to which upstream flows enter the analysis section. Values near 0 mean that there is no inflow or flows upstream of the section, while a value of 0.5 indicates that there is no attenuation of the incoming hydrograph. A value of X of 0.2 to 0.3 is widely used because they are average values within the range of this factor. X is close to 0 in very fast-flowing streams and low slopes, and it is close to 0.5 when the opposite occurs [88,89].
Appendix A.3. Evaluation of the Spillway and Reservoir Routing with Hydrograph Inflow Affected by Climate Change
To perform the evaluation of the spillway discharge capacity, it is necessary to perform a procedure known as Reservoir Routing through a reservoir. This procedure determines the time and magnitude of a flow at a given site using known or assumed hydrographs at one or more sites. The equation for storage routing is based on the conservation of mass; specifically, the inflow (I), outflow (O), and storage (S) is expressed as (Equation (A5)) [90].
where ds is the change in storage during the time interval dt; I and Q are the inflow and outflow as a function of time, respectively.
In this case, the Modified Puls Method was used to determine the outflow of the reservoir with a horizontal water surface given the inflow hydrograph and the variation curve of the water volume above the relief crest, as a function of the load He [88]. The method is based on the continuity equation (Equation (A6)), developed for time steps t, and assuming that the variation of inflow and outflow through the time is lineal. Equation (A5) was substituted into the following equation:
where S represents the reservoir volume, I, the inflow and Q, the outflow, j: beginning of time; j + 1: end of time Δt.
This method requires a relationship between the storage elevation–volume curve, with the curve of flows discharged through the relief crest. This relationship is identified as the storage vs. outflow function (2S/Δτ + Qs).
For its application it requires (i) the storage–elevation curve, (ii) the spillway geometric design, and (iii) the storage and flood transit function. Finally, the reservoir level is compared to the spillway level, and the hydraulic capacity of the spillway must be equal to or greater than the reservoir discharge flow rate. If these conditions are not met, the spillway geometric design must be changed, and so on iteratively.
Appendix A.4. Spillways Geometry Design
The general equation for the calculation of the discharge flow rate above the dam crest in free flow is given by Equation (A7) [91,92].
where Q is the discharge (m3/s), C is the discharge coefficient, L s is the crest development length (m), and H is the load on the spillway (m).
Appendix A.5. Discharge Coefficient C
The factors that influence the spillway discharge coefficient are (a) the relative depth of approach P/Hd (US Army Corps of Engineers, 1990), (b) the slope of the upstream surface of the crest, and (c) the relative load on the crest He/Hd (Figure A2).
Where P is the spillway wall; Hd is the design load equivalent to 0.75 Hm; Hm is the maximum load; He is the head considered on the crest (including the velocity of the approach head).
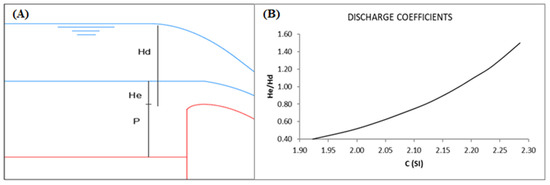
Figure A2.
(A) Hd, He, and P parameters. (B) Spillway discharge coefficient (C) as a function of the relative load on the crest (He/Hd). Adapted from: (U.S. Army Corps of Engineers, 1990).
The wall of the spillway, P, influences the discharge coefficient. For a ratio P/Hd > 1, flat slopes upstream of the crest slopes tend to produce a decrease in the discharge coefficient. The U.S. Army Corps of Engineers (1990) provided data on the depth of approach and slope effects of the weir face. In this study, the upstream face of the crest is considered vertical and the P/Hd ratio is equal to 1.0. With this parameter, the discharge coefficient C was obtained from Figure A2B).
References
- Chen, X.; Hossain, F. Understanding Future Safety of DAMs in a Changing Climate. Bull. Am. Meteorol. Soc. 2019, 100, 1395–1404. [Google Scholar] [CrossRef]
- Richter, B.D.; Revenga, C.; Scudder, T.; Lehner, B.; Churchill, A.; Chow, M. Lost in Development’s Shadow: The Downstream Human Consequences of Dams. Water Altern. 2010, 3, 14–42. [Google Scholar]
- Adamo, N.; Al-Ansari, N.; Sissakian, V.K.; Laue, J. Dam Safety: General Considerations. J. Earth Sci. Geotech. Eng. 2020, 10, 1–21. [Google Scholar]
- Ferdowsi, A.; Mousavi, S.F.; Farzin, S.; Karami, H. Optimization of Dam’s Spillway Design under Climate Change Conditions. J. Hydroinform. 2020, 22, 916–936. [Google Scholar] [CrossRef]
- Lehner, B.; Liermann, C.R.; Revenga, C.; Vörösmarty, C.; Fekete, B.; Crouzet, P.; Döll, P.; Endejan, M.; Frenken, K.; Magome, J.; et al. High-resolution Mapping of the World’s Reservoirs and Dams for Sustainable River-flow Management. Front. Ecol. Environ. 2011, 9, 494–502. [Google Scholar] [CrossRef] [Green Version]
- Moran, E.F.; Lopez, M.C.; Moore, N.; Müller, N.; Hyndman, D.W. Sustainable Hydropower in the 21st Century. Proc. Natl. Acad. Sci. USA 2018, 115, 11891–11898. [Google Scholar] [CrossRef] [PubMed] [Green Version]
- International Hydropower Association (IHA). Ecuador. Available online: https://www.hydropower.org/country-profiles/ecuador (accessed on 23 January 2022).
- U.S. Energy Information Administration (EIA). Country Analysis Executive Summary; EIA: Quito, Ecuador, 2021. Available online: https://www.eia.gov/international/content/analysis/countries_long/Ecuador/ecuador.pdf (accessed on 24 January 2022).
- Duricic, J. Dam Safety Concepts; Delft University of Technology: Delft, The Netherlands, 2014. [Google Scholar]
- Loucks, D.P.; van Beek, E. An Introduction to Probability, Statistics, and Uncertainty. In Water Resource Systems Planning and Management; Springer International Publishing: Cham, Switzerland, 2017; pp. 213–300. [Google Scholar] [CrossRef] [Green Version]
- Lindsey, R. Climate Change: Global Sea Level. Available online: https://www.climate.gov/news-features/understanding-climate/climate-change-global-sea-level (accessed on 2 January 2022).
- Allen, M.R.; Dube, O.P.; Solecki, W.; Aragón-Durand, F.; Cramer, W.; Humphreys, S.; Kainuma, M.; Kala, J.; Mahowald, N.; Mulugetta, Y.; et al. Framing and Context. In Global Warming of 1.5 °C; Masson-Delmotte, V., Zhai, P., Pörtner, H.-O., Roberts, D., Skea, J., Shukla, P.R., Pirani, A., Moufouma-Okia, W., Péan, C., Pidcock, R., et al., Eds.; IPCC: Geneva, Switzerland, 2018. [Google Scholar]
- Boulange, J.; Hanasaki, N.; Yamazaki, D.; Pokhrel, Y. Role of Dams in Reducing Global Flood Exposure under Climate Change. Nat. Commun. 2021, 12, 417. [Google Scholar] [CrossRef]
- Fluixá-Sanmartín, J.; Altarejos-García, L.; Morales-Torres, A.; Escuder-Bueno, I. Review Article: Climate Change Impacts on Dam Safety. Nat. Hazards Earth Syst. Sci. 2018, 18, 2471–2488. [Google Scholar] [CrossRef] [Green Version]
- Pudyastuti, P.; Agung Nugraha, N. Climate Change Risks to Infrastructures: A General Perspective. AIP Conf. Proc. 2018, 1977, 040030. [Google Scholar] [CrossRef]
- Bárcena, A.; Samaniego, J.; Peres, W.; Alatorre, J.E. La Emergencia Del Cambio Climático En América Latina y El Caribe ¿Seguimos Esperando La Catástrofe o Pasamos a La Acción? Naciones Unidas: Santigo, Chile, 2020; Volume 160, ISBN 978-92-1-047955-4. [Google Scholar]
- Bowers, S. The Vulnerability of Dams: A Rising Threat to Life & Property. 2020. Available online: https://jsheld.com/insights/articles/the-vulnerability-of-dams-a-rising-threat-to-life-property (accessed on 24 January 2022).
- Organization for Economic Co-Operation and Development (OECD). Integrating Climate Change Adaptation into Development Co-Operation: Policy Guidance; OECD: Paris, France, 2009; ISBN 9789264054769. [Google Scholar]
- Intergovernmental Panel on Climate Change (IPCC). Managing the Risks of Extreme Events and Disasters to Advance Climate Change Adaptation; Field, C.B., Barros, V., Stocker, T.F., Qin, D., Dokken, D.J., Ebi, K.L., Mastrandrea, M.D., Mach, K.J., Plattner, G.K., Allen, S.K., et al., Eds.; Cambridge University Press: Cambridge, UK, 2012; Volume 1, ISBN 978-1-107-60780-4. [Google Scholar]
- Homeland Security Dams Sector. Estimating Loss of Life for Dam Failure Scenarios. 2011. Available online: https://damsafety.org/sites/default/files/files/DamsSectorConsequenceEstimation_LossOfLife.pdf (accessed on 26 January 2022).
- Ebbighausen, R. Laos Disaster Reveals the Ugly Side of Hydropower in Southeast Asia. Available online: https://www.dw.com/en/laos-disaster-reveals-the-ugly-side-of-hydropower-in-southeast-asia/a-44822877 (accessed on 5 January 2022).
- Fountain, H. ‘Expect More’: Climate Change Raises Risk of Dam Failures. The New York Times. 2020. Available online: https://www.nytimes.com/2020/05/21/climate/dam-failure-michigan-climate-change.html (accessed on 7 December 2021).
- Flores, A.; Peralta, L. The Enhancement of Resilience to Disasters and Climate Change in the Caribbean through the Modernization of the Energy Sector; Santiago, Chile. 2020. Available online: http://www.usbr.gov/infrastr/waterbull (accessed on 4 January 2022).
- Fluixá-Sanmartín, J.; Morales-Torres, A.; Escuder-Bueno, I.; Paredes-Arquiola, J. Quantification of Climate Change Impact on Dam Failure Risk under Hydrological Scenarios: A Case Study from a Spanish Dam. Nat. Hazards Earth Syst. Sci. 2019, 19, 2117–2139. [Google Scholar] [CrossRef] [Green Version]
- Seneviratne, S.; Nicholls, N.; Easterling, D.; Rusticucci, M.; Semenov, V.; Alexander, L.V.; Allen, S.; Benito, G.; Cavazos, T.; Nicholls, N.; et al. Changes in Climate Extremes and Their Impacts on the Natural Physical Environment; Cambridge University Press: Cambridge, UK, 2012. [Google Scholar]
- Fowler, K.; Hill, P.; Jordan, P.; Nathan, R.; Sih, K. Application of Available Climate Science to Assess the Impact of Climate Change on Spillway Adequacy. ANCOLD Proc. Tech. Groups. 2010. Available online: https://www.ancold.org.au/?product=2010-application-of-available-climate-science-to-assess-the-impact-of-climate-change-on-spillway-adequacy (accessed on 4 January 2022).
- World Meteorological Organization (WMO). Climate Change and Water. WMO. 2020. Available online: https://public.wmo.int/en/resources/world-meteorological-day/previous-world-meteorological-days/climate-and-water/climate-change-water (accessed on 13 March 2022).
- Blenkinsop, S.; Alves, L.M.; Smith, A.J.P. Climate Change Increases Extreme Rainfall and the Chance of Floods; ScienceBrief: Norwich, UK, 2021. [Google Scholar] [CrossRef]
- Ilbay-Yupa, M.; Ilbay, F.; Zubieta, R.; García-Mora, M.; Chasi, P. Impacts of Climate Change on the Precipitation and Streamflow Regimes in Equatorial Regions: Guayas River Basin. Water 2021, 13, 3138. [Google Scholar] [CrossRef]
- Tabari, H. Climate Change Impact on Flood and Extreme Precipitation Increases with Water Availability. Sci. Rep. 2020, 10, 13768. [Google Scholar] [CrossRef]
- Wan Mohtar, W.H.M.; Sharil, S.; Samion, M.K.H.; Mohamad, M.F.; Hamzah, S.B.; Mohd Razali, S.F.; Muhammad, N.S.; Md Desa, S. Assessment of Dam Appurtenant Structures under Multiple Flow Discharge Scenarios. Ain Shams Eng. J. 2020, 11, 913–922. [Google Scholar] [CrossRef]
- Chen, Y.; Lin, P. The Total Risk Analysis of Large Dams under Flood Hazards. Water 2018, 10, 140. [Google Scholar] [CrossRef] [Green Version]
- DeNeale, S.; Baecher, G.; Stewart, K.; Smith, E.; Watson, D. Current State-of-Practice in Dam Safety Risk Assessment, Oak Ridge, United States. 2019. Available online: https://www.osti.gov/servlets/purl/1592163/ (accessed on 4 January 2022).
- Adger, W.N.; Agrawala, S.; Mirza, M.; Conde, C.; O’Brien, K.; Pulhin, J.; Pulwarty, R.; Smit, B.; Takahashi, K. Assessment of Adaptation Practices, Options, Constraints and Capacity. In Climate Change 2007: Impacts, Adaptation and Vulnerability. Contribution of Working Group II to the Fourth Assessment Report of the Intergovernmental Panel on Climate Change; Parry, M., Canziani, O., Palutikof, J., van der Linden, P., Hanson, C., Eds.; Cambridge University: Cambridge, UK, 2007. [Google Scholar]
- Kuylenstierna, J.; Burke, J.; Timmerman, J.; Bernardini, F.; van der Most, H.; Pageler, M.; Haas, L.; Taylor, R. Introduction, Summaries and Key Messages. In Perspectives on Water and Climate Change Adaptation; Government of the Netherlands: The Hague, The Netherlands, 2009. [Google Scholar]
- World Health Organization (WHO). Floods: Climate Change and Adaptation Strategies for Human Health; WHO: London, UK, 2002.
- Maritz, A.; Macfarlane, G.; Bolton, C. Consider Climate Change in Tailings Dam Design. Available online: https://www.srk.com/en/publications/Consider-Climate-Change-in-Tailings-Dam-Design (accessed on 3 January 2022).
- Hepler, T.; Fiedler, B.; Vermeyen, T.; Dewey, B.; Wahl, T. Overtopping Protection for Dams-A Technical Manual Overview; Association of State Dam Safety Official: Denver, CO, USA, 2012. [Google Scholar]
- Pawson, J.; Mcnicoll, R.; Davison, C.; Hill, T. Scoping the Risk Assessment Process for Small Reservoirs. 2010. Available online: www.defra.gov.uk/environ/fcd (accessed on 3 February 2022).
- Norouzi, N. Climate Change Impacts on the Water Flow to the Reservoir of the Dez Dam Basin. Water Cycle 2020, 1, 113–120. [Google Scholar] [CrossRef]
- Fischer, J.; Graham, W.J.; Hilldale, R.C. Spillway Gate Failure or Misoperation: Representative Case Histories. 2002. Available online: https://www.usbr.gov/infrastr/waterbull (accessed on 15 January 2022).
- Miyamoto, C. Gates and Other Mechanical Systems at Dams Need to Be Inspected and Maintained. Available online: https://damfailures.org/lessons-learned/gates-and-other-mechanical-systems-at-dams-need-to-be-inspected-and-maintained/ (accessed on 29 December 2021).
- Pandya, A.; Goel, N.; Pillai, B. Management of Design Flood Issues in Existing Dams under Climate Change. In Proceedings of the International Symposium on Dam’s in a Global Environmental Challenges, Bali, Indonesia, 1–6 June 2014. [Google Scholar]
- Lee, B.S.; You, G.J.Y. An Assessment of Long-Term Overtopping Risk and Optimal Termination Time of Dam under Climate Change. J. Environ. Manag. 2013, 121, 57–71. [Google Scholar] [CrossRef]
- Bureau of Reclamation. Design of Small Dams, 3rd ed.; United States Department of the Interior: Washington, DC, USA, 1987.
- Tiwari, H.; Sharma, N. Developments to Improve Hydraulic Competence of Spillways. Aquat. Procedia 2015, 4, 841–846. [Google Scholar] [CrossRef]
- Gul, E.; Alpaslan, N.; Emiroglu, M.E. Robust Optimization of SVM Hyper-Parameters for Spillway Type Selection. Ain Shams Eng. J. 2021, 12, 2413–2423. [Google Scholar] [CrossRef]
- Water NSW. Warragamba Dam Auxiliary Spillway. Water NSW, 2019. Available online: https://www.waternsw.com.au/supply/Greater-Sydney/safety/warragamba-dam-auxiliary-spillway (accessed on 26 February 2022).
- Glunz, G. Fuse Plug Construction to Improve Flood Control. NS Energy. 2006. Available online: https://www.nsenergybusiness.com/features/featurefuse-plug-construction-to-improve-flood-control/ (accessed on 28 March 2022).
- Presidencia de la República del Ecuador. Más de 65 Mil Habitantes Se Benefician Con El Sistema de Control de Inundaciones Bulubulu. Available online: https://www.presidencia.gob.ec/mas-de-65-mil-habitantes-se-benefician-con-el-sistema-de-control-de-inundaciones-bulubulu/# (accessed on 24 March 2022).
- Henn, B.; Musselman, K.N.; Lestak, L.; Ralph, F.M.; Molotch, N.P. Extreme Runoff Generation from Atmospheric River Driven Snowmelt During the 2017 Oroville Dam Spillways Incident. Geophys. Res. Lett. 2020, 47, 1–11. [Google Scholar] [CrossRef]
- Herbozo, J. Análisis de los Efectos del Cambio Climático en los Caudales de Crecidas del Río Cachul y su Afectación al Prediseño del Vertedor de Excesos de la Presa Sube y Baja, Provincia de Santa Elena; Quito. 2020. Available online: https://biblioteca.epn.edu.ec/cgi-bin/koha/opac-detail.pl?biblionumber=90204 (accessed on 14 March 2022).
- Department of Environment Food and Rural Affais (Defra). Impact of Climate Change on Dams & Reservoirs Final Guidance Report. 2013. Available online: https://assets.publishing.service.gov.uk/media/6033dfa3e90e076605eab4de/Review_of_indirect_Impacts_of_climate_change_on_dams_and_reservoirs_final_report.pdf (accessed on 16 December 2021).
- World Meteorological Organization (WMO). Manual on Estimation of Probable Maximum Precipitation (PMP); World Meteorological Organization (WMO): Geneva, Switzerland, 2009; p. 1045. [Google Scholar]
- Association of State Dam Safety Officials (ASDSO) High and Significant Hazard Dams Should Be Designed to Pass an Appropriate Design Flood. Dams Constructed Prior to the Availability of Extreme Rainfall Data Should Be Assessed to Make Sure They Have Adequate Spillway Capacity. Lesson Learned. 2014. Available online: https://damfailures.org/lessons-learned/high-and-significant-hazard-dams-should-be-design-to-pass-an-appropriate-design-flood-dams-constructed-prior-to-the-availability-of-extreme-rainfall-data-should-be-assessed-to-make-sure-they-have-ad/ (accessed on 28 January 2022).
- Mahoney, K.; Lukas, J.; Mueller, M. Considering Climate Change in the Estimation of Extreme Precipitation for Dam Safety; Colorado-New Mexico, United States. 2018. Available online: https://wwa.colorado.edu/sites/default/files/2021-07/Considering%20Climate%20Change%20in%20the%20Estimation%20of%20Extreme%20Precipitation%20for%20Dam%20Safety.pdf (accessed on 30 March 2022).
- Sarkar, S.; Maity, R. Increase in Probable Maximum Precipitation in a Changing Climate over India. J. Hydrol. 2020, 585, 124806. [Google Scholar] [CrossRef]
- Intergovernmental Panel on Climate Change (IPCC). Cambio Climático 2014: Informe de Síntesis. In Quinto Informe de Evaluación del Grupo Intergubernamental de Expertos Sobre el Cambio Climático; IPCC: Geneva, Switzerland, 2014. [Google Scholar]
- Wayne, G.P. Representative Concentration Pathways … and Then There’s Physics. 2015. Available online: https://andthentheresphysics.wordpress.com/2015/08/14/representative-concentration-pathways/ (accessed on 2 November 2021).
- Pascual, J.; Díaz, M. Guía Práctica Sobre La Modelización Hidrológica y El Modelo HEC-HMS. In Cuadernos de Geomática; Centro para el Conocimeinto del Paisaje: Alcalá de Henares, Spain, 2016; p. 155. ISBN 9788461770021. [Google Scholar]
- Corporación Asociación FPC. Estudios de Prefactibilidad Del Proyecto Presa Sube y Baja–Conducción–Presa Pedregalito y Formulación de Una Propuesta de Modelo de Gestión Público–Comunitaria a Nivel Provincial; ASO-FPC: Santa Elena, Ecuador, 2016. [Google Scholar]
- Gobierno Autónomo Descentarizado de la Provincia de Santa Elena (GADPSE) Plan de Desarrollo y Ordenamiento Territorial Provincial-Santa Elena 2015–2019. Santa Elena. 2015. Available online: http://app.sni.gob.ec/sni-link/sni/PORTAL_SNI/data_sigad_plus/sigadplusdocumentofinal/0968580510001_PDyOT%20%20SANTA%20ELENA%20DOCUMENTO_FINAL_16-05-2016_09-31-46.pdf (accessed on 18 January 2022).
- Luján, J.; Sánchez, P. Plan Hidráulico Del Acueducto de Santa Elena (PHASE). CEDEX: Santa Elena, Ecuador. 2003. Available online: https://ceh.cedex.es/planificacion/Cooperacion_Internacional/Ecuador/phase.htm (accessed on 17 January 2022).
- García-Garizábal, I.; Romero, P.; Jiménez, S.; Jordá, L. Evolución Climática En La Costa de Ecuador por Efecto Del Cambio Climático. DYNA 2017, 84, 37–44. [Google Scholar] [CrossRef]
- Campozano, L.; Robaina, L.; Samaniego, E. The Pacific Decadal Oscillation Modulates the Relation of ENSO with the Rainfall Variability in Coast of Ecuador. Int. J. Climatol. 2020, 40, 5801–5812. [Google Scholar] [CrossRef]
- Paixão, E.S.; Teixeira, M.G.; Rodrigues, L.C. Zika, Chikungunya and Dengue: The Causes and Threats of New and Re-Emerging Arboviral Diseases. BMJ Glob. Health 2018, 3, 1–6. [Google Scholar] [CrossRef] [Green Version]
- Instituto Espacial Ecuatoriano (IEE). Memoria Técnica Cantón Santa Elena: Generación de Geoinformación Para La Gestión Del Territorio a Nivel Nacional; IEE: Santa Elena, Ecuador, 2012. [Google Scholar]
- Intergovernmental Panel on Climate Change (IPCC). Topic 2: Future Changes, Risks and Impacts. IPCC Synthesis Report. 2021. Available online: https://ar5-syr.ipcc.ch/topic_futurechanges.php (accessed on 29 November 2021).
- Anderson, T.R.; Hawkins, E.; Jones, P.D. CO2, the Greenhouse Effect and Global Warming: From the Pioneering Work of Arrhenius and Callendar to Today’s Earth System Models. Endeavour 2016, 40, 178–187. [Google Scholar] [CrossRef] [Green Version]
- World Meteorological Organization (WMO). Greenhouse Gas Bulletin: Another Year Another Record; World Meteorological Organization (WMO): Geneva, Switzerland, 2021; Available online: https://public.wmo.int/en/media/press-release/greenhouse-gas-bulletin-another-year-another-record (accessed on 24 March 2022).
- Ministerio del Ambiente Ecuador (MAE). Tercera Comunicación Nacional Del Ecuador a La Convención Marco de Las Naciones Unidas Sobre Cambio Climático; MAE: Quito, Ecuador, 2017; Available online: https://www.ambiente.gob.ec/wp-content/uploads/downloads/2017/10/TERCERA-COMUNICACION-BAJA-septiembre-20171-ilovepdf-compressed1.pdf (accessed on 11 November 2021).
- Gudmundsson, L.; Bremnes, J.B.; Haugen, J.E.; Engen-Skaugen, T. Technical Note: Downscaling RCM Precipitation to the Station Scale Using Statistical Transformations—A Comparison of Methods. Hydrol. Earth Syst. Sci. 2012, 16, 3383–3390. [Google Scholar] [CrossRef] [Green Version]
- del Ángel, M.; Domínguez, R. Ecuaciones Universales Ajustadas Para El Cálculo de Lluvias Máximas de Corta Duración. GEOS 2013, 33, 332–349. [Google Scholar]
- McCuen, R.H. Hydrologic Analysis and Design, 2nd ed.; Pearson: Upper Saddle River, NJ, USA, 1998; ISBN 9780134313122. [Google Scholar]
- Editorial Macro. Manual de Hidrología, Hidráulica y Drenaje; Editorial Macro: Lima, Perú, 2011. [Google Scholar]
- Stratz, S.A.; Hossain, F. Probable Maximum Precipitation in a Changing Climate: Implications for Dam Design. J. Hydrol. Eng. 2014, 19, 1–7. [Google Scholar] [CrossRef]
- Rastogi, D.; Kao, S.; Ashfaq, M.; Mei, R.; Kabela, E.D.; Gangrade, S.; Naz, B.S.; Preston, B.L.; Singh, N.; Anantharaj, V.G. Effects of Climate Change on Probable Maximum Precipitation: A Sensitivity Study over the Alabama-Coosa-Tallapoosa River Basin. J. Geophys. Res. Atmos. 2017, 122, 4808–4828. [Google Scholar] [CrossRef] [Green Version]
- François, B.; Schlef, K.E.; Wi, S.; Brown, C.M. Design Considerations for Riverine Floods in a Changing Climate–A Review. J. Hydrol. 2019, 574, 557–573. [Google Scholar] [CrossRef]
- Gangrade, S.; Kao, S.; Naz, B.S.; Rastogi, D.; Ashfaq, M.; Singh, N.; Preston, B.L. Sensitivity of Probable Maximum Flood in a Changing Environment. Water Resour. Res. 2018, 54, 3913–3936. [Google Scholar] [CrossRef]
- Campozano, L.; Célleri, R.; Trachte, K.; Bendix, J.; Samaniego, E. Rainfall and Cloud Dynamics in the Andes: A Southern Ecuador Case Study. Adv. Meteorol. 2016, 2016, 3192765. [Google Scholar] [CrossRef] [Green Version]
- Mora, D.E.; Campozano, L.; Cisneros, F.; Wyseure, G.; Willems, P. Climate Changes of Hydrometeorological and Hydrological Extremes in the Paute Basin, Ecuadorean Andes. Hydrol. Earth Sys. Sci. 2014, 18, 631–648. [Google Scholar] [CrossRef] [Green Version]
- Llamosas, C.; Sovacool, B.K. The Future of Hydropower? A Systematic Review of the Drivers, Benefits and Governance Dynamics of Transboundary Dams. Renew. Sustain. Energy Rev. 2021, 137, 110495. [Google Scholar] [CrossRef]
- Hensengerth, O. South-South Technology Transfer: Who Benefits? A Case Study of the Chinese-Built Bui Dam in Ghana. Energy Policy 2018, 114, 499–507. [Google Scholar] [CrossRef] [Green Version]
- Yoshida, Y.; Lee, H.S.; Trung, B.H.; Tran, H.-D.; Lall, M.K.; Kakar, K.; Xuan, T.D. Impacts of Mainstream Hydropower Dams on Fisheries and Agriculture in Lower Mekong Basin. Sustainability 2020, 12, 2408. [Google Scholar] [CrossRef] [Green Version]
- Wu, H.; Chen, J.; Xu, J.; Zeng, G.; Sang, L.; Liu, Q.; Yin, Z.; Dai, J.; Yin, D.; Liang, J.; et al. Effects of Dam Construction on Biodiversity: A Review. J. Clean. Prod. 2019, 221, 480–489. [Google Scholar] [CrossRef]
- Bell, F.C. Generalized Rainfall-Duration-Frequency Relationships. J. Hydraul. Div. 1969, 95, 311–328. [Google Scholar] [CrossRef]
- Chen, C. Rainfall Intensity-Duration-Frequency Formulas. J. Hydraul. Eng. 1983, 109, 1603–1621. [Google Scholar] [CrossRef]
- Baláž, M.; Danáčová, M.; Szolgay, J.; Baláž, M.; Danáčová, M.; Szolgay, J. On the Use of the Muskingum Method for the Simulation of Flood Wave Movements. Slovak J. Civ. Eng. 2010, XVIII, 14–20. [Google Scholar] [CrossRef] [Green Version]
- Chow, V.T.; Maidment, D.R.; Mays, L.W. Applied Hydrology; Clark, B.J., Morriss, J., Eds.; McGraw-Hill International Editions: New York, NY, USA, 1988; ISBN 0070108102. [Google Scholar]
- Aparicio, F.J. Fundamentos de Hidrología de Superficie; Grupo Noriega Editores, Ed.; LIMUSA S.A.: Mexico City, Mexico, 1992; ISBN 9681830148. [Google Scholar]
- Pulla, J.F.; Jarrín, A.A. Estudio y Diseño de Presa Pequeña Para El Recinto Sartanejal Del Cantón Isidro Ayora, Guayaquil; Universidad de Guayaquil: Guayas, Ecuador, 2016. [Google Scholar]
- Broome, M.A.; Manual, E. Hydraulic Design of Spillways; U.S. Army Corps of Engineers Engineering and Design: Washington, DC, USA, 1999.
Publisher’s Note: MDPI stays neutral with regard to jurisdictional claims in published maps and institutional affiliations. |
© 2022 by the authors. Licensee MDPI, Basel, Switzerland. This article is an open access article distributed under the terms and conditions of the Creative Commons Attribution (CC BY) license (https://creativecommons.org/licenses/by/4.0/).