Abstract
The impact on the Gulf Stream and Kuroshio from Arctic sea ice loss is investigated using the Community Climate System Model version 4 (CCSM4) model for their important roles during climate change. Results show that the Gulf Stream (Kuroshio) weakens (strengthens) in response to Arctic sea ice loss via ocean (atmosphere) adjustments. More precisely, the Kuroshio acceleration is mainly due to the anomalous wind stress over the North Pacific, while the ocean gyre adjustments in the Atlantic are responsible for the weakened Gulf Stream. As positive buoyancy fluxes induced by Arctic sea ice loss trigger a slowdown of the Atlantic Meridional Overturning Circulation (AMOC), the Gulf Stream decelerates evidently and the current speed decreases by about 5–8 cm/s in the upper ocean. Resulting from less advection and horizontal diffusion in the temperature budget, less poleward warm water leads to narrow sea surface cooling sandwiched between strong warming in the subpolar and subtropical Atlantic. Furthermore, colder surface decreases the upward heat flux (mainly latent heat flux) along the Gulf Stream Extension (GE) path, which leads to a warming hole in the atmosphere.
1. Introduction
The Gulf Stream in the North Atlantic and the Kuroshio in the North Pacific are important subtropical western boundary currents (WBCs) in the Northern Hemisphere (NH), influencing the weather and climate through both hydrodynamics and thermodynamics [1,2,3]. These two currents are characterized by fast ocean velocities, high sea surface temperature (SST), and intensive ocean heat loss [4]. The poleward ocean heat transport by the Gulf Stream and the Kuroshio contributes to the global heat balance [5,6]. Still, the large amount of water mass, salinity, and nutrient exchanges can significantly impact the fisheries and environments [7]. Therefore, it is necessary to understand the evolution of the Gulf Stream and the Kuroshio.
With global warming occurring as a result of increased greenhouse gas (GHG) concentrations in the atmosphere, there has been a growing interest in the evolution of WBCs. Wu et al. [8] found a regionally accelerated warming (2–3 times larger than the global surface ocean warming rate) since 1900 over the path of WBCs in all ocean basins. The accelerated warming is associated with a poleward shift and/or intensification of WBCs. Dong et al. [9] used satellite altimetry data to demonstrate that the Gulf Stream experienced a southward shift east of 65° W, accompanied by a slowdown trend during 1993–2016. In agreement with Dong et al. [9], climate models project a weaker Gulf Stream in the 21st century in response to global warming [7]. To explain the variations in the path and strength of the Gulf Stream, many studies have considered the effect of the Atlantic meridional overturning circulation (AMOC) changes [10,11,12]. A slower AMOC is found when the Gulf Stream is weaker and displaced southward [10]. On the other hand, Zhang et al. [13] suggested that the weakening trend of the Gulf Stream from 1993 to 2016 resulted from the decline in the North Atlantic Oscillation (NAO). With regard to the Kuroshio, Wang et al. [14] showed a weakened Kuroshio during the period 1993–2013 despite enhanced warming along its path. The Kuroshio decelerates during the negative phase of Pacific Decadal Oscillation (PDO) [15]. However, the projected global warming intensifies and shifts the Kuroshio northerly in models [12,16]. Sakamoto et al. [17] thought that the acceleration of the Kuroshio was due to the changes in the large-scale wind stress over the North Pacific, but some researchers demonstrated that the sea surface warming, not the wind changes, dominated the intensification of the upper-layer Kuroshio in a warming climate [12].
Another significant consequence of anthropogenic warming is the sea ice reduction in the Arctic [18,19,20]. Substantial evidence from observations and numerical simulations indicates that Arctic sea ice has declined rapidly in recent decades [21,22], with broad impacts on surface albedo, air–sea heat/moisture fluxes, as well as atmospheric and oceanic circulations [23]. For example, the AMOC is projected to slow down in response to Arctic sea ice loss across climate models [24,25,26]. Previous studies also suggested that Arctic sea ice reduction induced a negative phase of NAO during winter [27,28,29]. Moreover, Arctic sea ice loss can bring about much stronger warming in the Arctic compared with the global warming, which is called Arctic amplification (AA) [30], and causes the anomalies in wind field around the world [31,32]. The AA contributes to weather and climate changes in mid-latitudes, including WBCs in the Northern Hemisphere [33,34]. The Arctic Ocean may influence the North Pacific Ocean via water exchange through the Bering Strait, and it may even affect the water properties (e.g., temperature and salinity) in the Kuroshio [35,36]. Meanwhile, the Arctic Ocean affects the North Atlantic Ocean across the Fram Strait and the Barents Sea. The Gulf Stream’s influence would be amplified over the Barents Sea region by interacting with the sea ice anomaly, promoting cold Eurasian [37,38]. Compared to the narrow Bering Strait, the water exchange between the Arctic Ocean and the North Atlantic Ocean is more efficient. On the other hand, the Gulf Stream and the Kuroshio can both be influenced indirectly by Arctic via atmosphere [5,37,39]. As a result, the responses of the Gulf Stream and the Kuroshio to Arctic sea ice loss may be different, but the details and physical processes of how Arctic sea ice loss affects these two important currents remain uncertain.
Although previous studies have focused on the responses of the Gulf Stream and the Kuroshio to global warming [7,12,17], and the Arctic sea ice impacts on climate change [29,40], the variations in the Gulf Stream and the Kuroshio induced by Arctic sea ice loss alone are not clear. The first question arises regarding whether the responses of the Gulf Stream and the Kuroshio to Arctic sea ice loss are the same. If the answer is no, how do the Gulf Stream and the Kuroshio respond to the Arctic sea ice loss, and what mechanisms drive them to occur? To answer these questions, using the numerical simulations, we investigated the different responses of the Gulf Stream and the Kuroshio to Arctic sea ice loss in this paper—that is to investigate only the sea ice loss response without CO2-induced warming. This paper is organized as follows: the model and design of the various experiments are described in Section 2. Section 3 shows the different responses of the Gulf Stream and the Kuroshio to Arctic sea ice loss, and the possible mechanisms driving the Gulf Stream and the Kuroshio anomalies, respectively. Finally, a summary and discussion are provided in Section 4.
2. Model and Experiments
A fully coupled global climate model, the Community Climate System Model version 4 (CCSM4) was used in this study. The atmospheric component has 26 vertical levels, with the finite volume nominal 0.9° × 1.25° in the horizontal direction. The oceanic resolution is about 1° in the horizontal and 60 levels in the vertical direction. The ice model has the same horizontal grid as the ocean model.
A suite of experiments (Table 1) was designed to explore the differences in the mechanism of the Gulf Stream and the Kuroshio responses to Arctic sea ice loss. The model was configured in two ocean configurations: full ocean model (FOM) and slab-ocean model (SOM). SOM has FOM’s spatially varying mixed layer depth climatology. FOM and SOM both have two kinds of simulations with different Arctic sea ice states. One ice state (ICE_20) is the average Arctic sea ice conditions representative of the late 20th century (1980–1999) under historical radiative forcing (the black line in Figure 1), and the other one (ICE_21) is representative of the late 21st century (2080–2099) under representative concentration pathway 8.5 (RCP8.5) radiative forcing (the blue line in Figure 1). As Figure 1 shows, each Arctic sea ice state has a seasonal cycle of Arctic sea ice extent (defined as the area with at least 15% fractional ice cover). The greatest sea ice extent is in March, and the lowest ice extent appears in September. A year-round reduction in Arctic sea ice extent happens in response to RCP8.5 radiative forcing. The Arctic becomes nearly ice-free from August to October during 2080–2099. To achieve the sea ice conditions for the late 20th and 21st centuries, a seasonally varying longwave radiative flux is artificially added to the sea ice model at each grid box and time step in the Arctic only. The spatial distribution of the additional longwave radiative flux is related with the sea ice reduction (Figure 1b and Figure S1). For example, Figure 1b shows the added longwave radiative flux to the ice model in September in ICE_21 compared to ICE_20. The additional longwave radiative flux is the largest in the central Arctic close to Greenland where the sea ice loss is the strongest in September. The value is southward decreasing and becomes zero where there is no ice. It should be noted that apart from the different sea ice state, radiative forcing conditions are kept fixed at the year 2000 in FOM and SOM to isolate the response to sea ice loss.

Table 1.
Design of the model experiments. The results use the ensemble mean of the runs. Each run is integrated for 100 years. ∆FOM = ICE_21_FOM–ICE_20_FOM, ∆SOM = ICE_21_SOM–ICE_20_SOM.
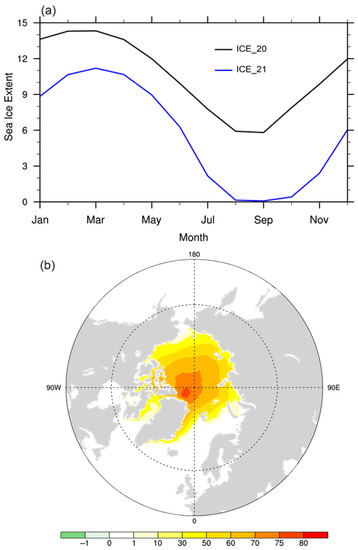
Figure 1.
(a) Monthly Arctic sea ice extent (106 km2) in the late 20th century (1980–1999) under historical radiative forcing (the black line) and the late 21st century (2080–2099) under RCP8.5 radiative forcing (the blue line). (b) The longwave radiative flux (W/m2) artificially added to the sea ice model in September in ICE_21 compared to ICE_20. The direction of longwave radiative flux is downward.
In order to reduce the noise from the inherent variability of the ocean currents, 20 (10) pairs of runs with FOM (SOM) were performed to ensure the robustness of results. Each run was integrated for 100 years. The difference between the ensemble mean of 20 (10) simulations with different Arctic sea ice states, referred to as ∆FOM (∆SOM), represents the climate response to late 21st-century Arctic sea ice loss relative to present day. Comparing ∆FOM with ∆SOM, the role of ocean adjustments is isolated in the response to sea ice loss. In this study, we focus on the quasi-equilibrium responses over the last 20 years of each experiment [26]. Statistical significance of the responses was assessed at the 95% confidence level by a two-tailed Student’s t test. Details of the method and model components coupling can be found in [26,41].
3. Results
3.1. SST Changes
The SST’s response to the Arctic sea ice loss exhibits significantly different patterns in SOM (Figure 2a) and FOM experiments (Figure 2b). In SOM experiments (Figure 2a), there is pronounced warming in the NH for lack of ocean dynamics. The warming amplitude is poleward amplified significantly in the North Atlantic and North Pacific, suggesting that the meridional gradient of the SST response is much stronger than the zonal gradient response. The SST warming maximum appears in the subpolar to polar regions where the sea ice reduction is the largest. However, the SST anomaly distributes in a more complex pattern in FOM (Figure 2b). The different patterns between SOM and FOM indicate the important role of ocean dynamics in the SST response.
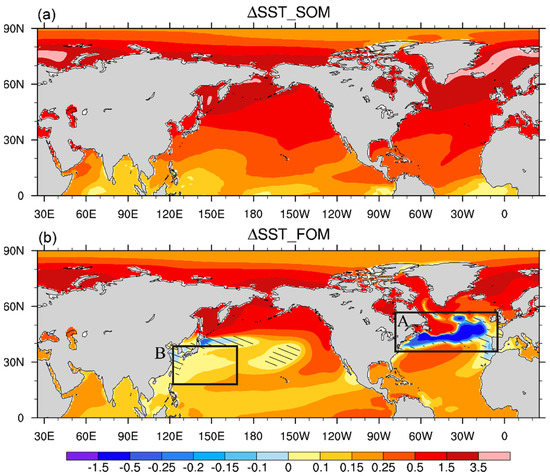
Figure 2.
The quasi-equilibrium response of sea surface temperature (SST, °C) to Arctic sea ice loss in (a) SOM and (b) FOM. Values not significant at the 95% confidence level are hatched. Black box A shows the position of the Gulf Stream and its extension. Black box B represents the position of the Kuroshio and its extension.
In contrast to whole warming NH in SOM, there is enhanced warming at high latitudes and along the equator in the Eastern Pacific in FOM. In addition, the FOM response shows that a cooling occurs along the path of the Gulf Stream Extension (GE) among the warming in the North Atlantic (black box A in Figure 2b). The SST decreasing in the Labrador Sea is hatched indicating that it is not significant at the 95% confidence level, as well as the cooling along the Oyashio Extension in the North Pacific. The warming is relatively weak in the Kuroshio and its extension region compared to other regions in the North Pacific (black box B in Figure 2b). The warming in the eastern equatorial Pacific has been discussed in [26]. However, the mechanism of surface cooling along the GE path has not been explained, which is another key difference between FOM and SOM. Moreover, the sign of SST response is opposite over the WBCs in the North Atlantic and North Pacific (black box A and black box B in Figure 2b), associated with an interesting phenomenon that the two important currents show contrary responses to Arctic sea ice loss—that is, the Gulf Stream weakens (Figure 3b) while the Kuroshio intensifies (Figure 4b).
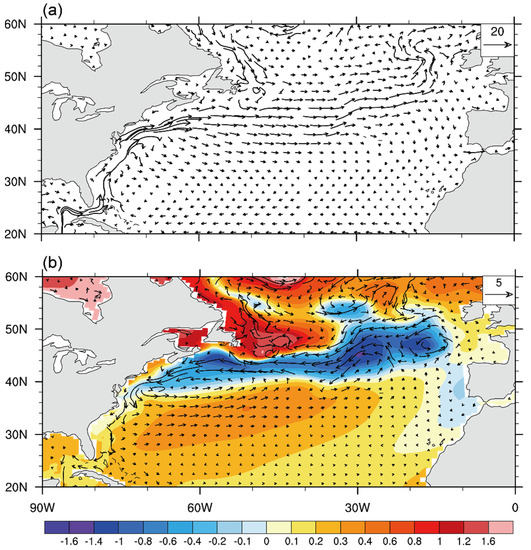
Figure 3.
(a) Climatological ocean currents averaged in the upper 100 m depth of the North Atlantic in FOM. (b) The quasi-equilibrium responses of ocean currents averaged in the upper 100 m depth (vectors, cm/s) and SST (color shading, °C) to Arctic sea ice loss in FOM.
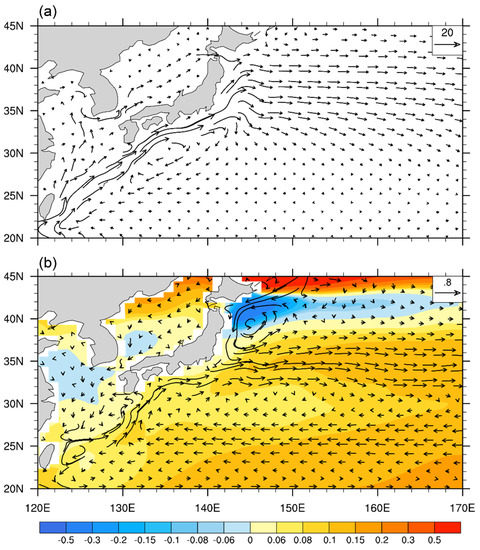
Figure 4.
(a) Climatological ocean currents averaged in the upper 100 m depth of the North Pacific in FOM. (b) The quasi-equilibrium responses of ocean currents averaged in the upper 100 m depth (vectors, cm/s) and SST (color shading, °C) to Arctic sea ice loss in FOM.
3.2. Mechanisms for the Gulf Stream Response
The Climatological Gulf Stream and GE with fast ocean velocities are well captured by CCSM4 in ICE_20_FOM with full ocean configuration (Figure 3a). When the prescribed longwave radiative flux is added into the sea ice model component in FOM case, the Arctic and subpolar Atlantic get warmer (Figure 2b and Figure S2a), where the upper ocean stratification becomes stable, hindering deep water formation and triggering the weakening of the AMOC (Figure 5). Thereafter, the sea ice melting starts to take effect, freshening the upper ocean, which causes the AMOC to diminish further (Figure S3). The AMOC index is defined as the maximum value of the streamfunction between 20° and 70° N and 300–2000 m in the Atlantic. In climatology, the AMOC strength is about 22 Sv (figure not shown) and the maximum value is at about 1000 m between 30° N and 40° N. The AMOC reduces by nearly 6 Sv within the first 30 years of ice loss and 4.5 Sv by year 100 (Figure 5a). The weakened strength is approximately 20.5% of the AMOC before the Arctic sea ice loss and 33.3% of the total AMOC decline under RCP8.5 in CCSM4 [26]. The maximum change for AMOC happens in the depth 1000–2000 m between 30° N and 50° N (Figure 5b). As part of the upper branch of the AMOC, the Gulf Stream and GE slow down evidently. The meridional streamfunction reduces significantly above 300 m in the subtropical North Atlantic (the black box in Figure 5b) and the upper ocean current velocity decreases by about 5–8 cm/s (vectors in Figure 3b) with a narrow cooling along the Gulf Stream and GE path. The vertically integrated volume transport in the upper 1000 m of the Gulf Stream and GE averaged over 32°–42° N where the deceleration of the current is large decreases by about 24.2%. The weakening of the Gulf Stream caused by the slowdown of the AMOC in our experiments is in agreement with some previous studies [7,12].
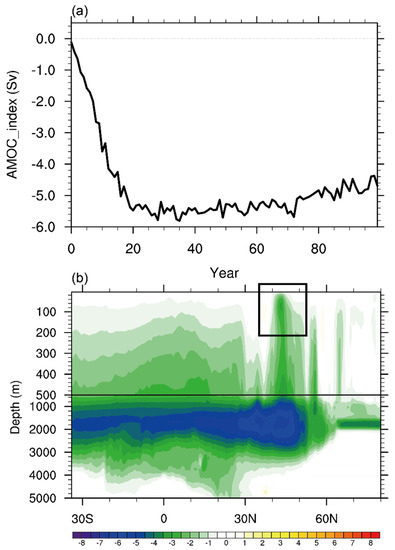
Figure 5.
(a) The temporal evolution of the AMOC index (unit: Sv, 1 Sv = 106 m3/s) in FOM. The AMOC index is defined as the maximum value of the streamfunction in the region of 20–70° N, 300–2000 m in the Atlantic. (b) The quasi-equilibrium AMOC responses to Arctic sea ice loss in FOM. The black box shows the positon of the Gulf Stream and GE.
3.3. SST Cooling Induced by the Gulf Stream Variations
Strong warming happens in the North Atlantic except profound negative SST anomalies over the Gulf Stream and GE region (Figure 2b). Since the net surface heat flux (Qnet) response has a warming effect on the ocean along the Gulf Stream and GE path (Figure 6), the sea surface cooling is mainly due to the slowdown of the Gulf Stream and GE. As the largest warm current in the world, the Gulf Stream and GE transports a lot of heat to high-latitude regions. In order to understand the processes attributed to the SST cooling, the heat budget terms were calculated online in FOM. The heat budget equation can be simply written as
where T is temperature. The term on the left-hand side of Equation (1) is the temperature tendency (TEND). The right-hand side terms are temperature advection (ADV), horizontal diffusion (HDIFF), vertical diffusion (VDIFF), and the heat flux term (Q), respectively. u, v, and w are zonal, meridional, and vertical velocities. AH and κ are the horizontal and vertical diffusivity coefficient, respectively, which are used to calculate the diffusive temperature flux resulting from diapycnal diffusion and parameterized isopycnal diffusion. is the reference density of seawater. cp is the specific heat of seawater. The net surface heat flux (Qnet) is a sum of solar radiation flux (SW), long wave radiation flux (LW), latent heat flux (LH), and sensible heat flux (SH). A positive value of Qnet indicates that the ocean gets energy. We performed a heat budget analysis along the Gulf Stream and GE path, focusing on the upper 100 m (H = 100 m) [12]. The location is 42°–47° N, 20°–55° W. Figure 7a shows the responses of the terms to Arctic sea ice loss (ICE_21_FOM–ICE_20_FOM). Apart from the temperature tendency (TEND), the positive value means a warming effect, while the negative value represents a cooling effect.
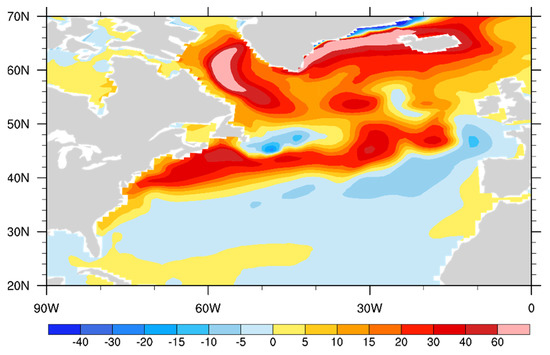
Figure 6.
Net surface heat flux (Qnet) response to Arctic sea ice loss over the North Atlantic in FOM. A positive value indicates that the ocean gets energy. Qnet=SW–LW–LH–SH. Unit: W/m2.
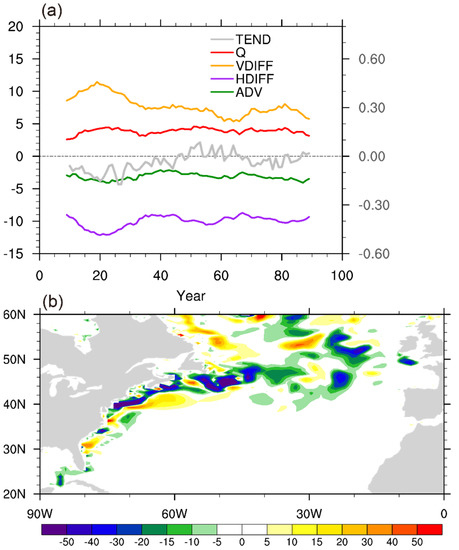
Figure 7.
(a) Temporal evolutions of the heat budget terms in Equation (1). The grey curve is for the temperature tendency (TEND); green is for three-dimensional advection (ADV); purple is for the horizontal diffusion (HDIFF); orange is for the vertical diffusion (VDIFF); and red is for heat flux term (Q). The right y-axis is for TEND, and the left, for the other variables. The direction of Q is downward. All variables are averaged over the box of 42°–47° N, 20°–55° W, and 0–100 m. Unit: 10−8 °C/s. (b) The temperature advection and horizontal diffusion anomalies (ADV + HDIFF) in the upper ocean in FOM. Unit: 10−8 °C/s.
As Figure 7a shows, the temperature tendency (the grey curve) remains negative in the first 45 years, indicating that the temperature decreases with time. Thereafter, the temperature tendency fluctuates around zero. The temperature response stays nearly stable. To analyze the heat budget terms on the right-hand side of Equation (1), the temperature advection (the green curve) and horizontal diffusion (the purple curve) contribute to the cooling, while the heat flux term (the red curve) and the vertical diffusion (the orange curve) act as warming terms. The Gulf Stream and its extension region has the highest level of eddy variability in the North Atlantic. Eddies play an important role in the transport of heat and nutrients [42]. As the ocean model resolution is about 1°, the horizontal mixing is parameterized as part of horizontal diffusion for the mesoscale turbulence and submesoscale processes in the ocean model, which makes the value of horizontal diffusion large. As a result, the role of horizontal diffusion is important for the temperatures changes. When the Gulf Stream current velocities decrease, the temperature advection and horizontal diffusion weaken, whose negative pattern is well matched with the sandwiched cooling region in the North Atlantic (Figure 7b). The net surface heat flux is positive along the Gulf Stream and GE path (Figure 6). The space pattern also reveals that the sea surface cooling results from the ocean adjustments, not the heat exchange between ocean and atmosphere.
Induced by the cooling along the GE path and a band of weak warming in the western subtropical gyre (Figure 2b), the crosswind SST gradient decreases near the Gulf Stream or SST fronts, but that increases at 30°–40° N of the ocean interior. As a result, there is a negative (positive) wind stress curl anomaly over the Newfoundland Basin in the northwest Atlantic (central subtropical Atlantic) [43] (ICE_21_FOM–ICE_20_FOM, contour in Figure 8a). The Sverdrup transport is the net meridional transport diagnosed in both the subtropical and subpolar gyres, resulting from planetary vorticity changes that balance Ekman pumping or Ekman suction [44]. The cyclonic wind stress anomaly in the ocean interior (30°–40° N) causes the anomalous Ekman upwelling, and then the southward Sverdrup transport deceases (color shading in Figure 8a) via Sverdrup balance. The Gulf Stream and GE weakens as the compensating current. Therefore, the wind stress changes due to the SST anomaly can in turn partly influence the strength of the Gulf Stream and GE. There exists positive feedback between the wind changes over the ocean interior and the Gulf Stream variations.
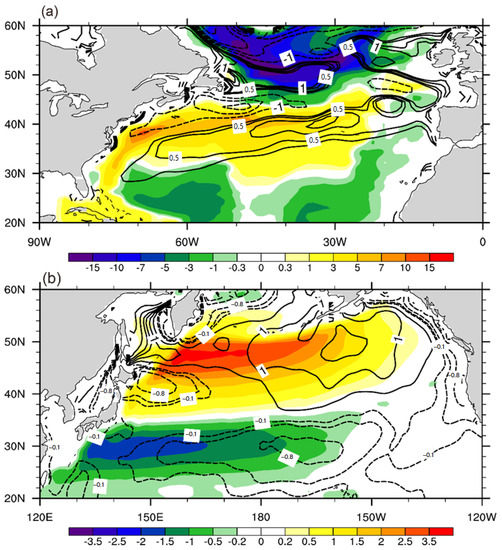
Figure 8.
Anomalies of Sverdrup transport streamfunction (color shading, Sv) and the wind stress curl (contour, 10−8 N/m3) in the North Atlantic (a) and North Pacific (b). The anomalies are the differences between the ICE_21_FOM and ICE_20_FOM (ICE_21_FOM–ICE_20_FOM). For the Sverdrup transport streamfunction, the positive value indicates the strengthening northward transport, while the negative value indicates the increasing southward transport.
3.4. Mechanisms for the Kuroshio Response
In contrast to the weakening of Gulf Stream, the Kuroshio and its extension shows a slight strengthening in response to the Arctic sea ice loss (Figure 4b). The increase in the current velocity is up to 1.4 cm/s southeast of Japan in comparison with the climatological Kuroshio and KE in Figure 4a. The vertically integrated volume transport of the Kuroshio and KE averaged over 26°–36° N, where the acceleration of the current is large, increases by about 7.1%. Dissimilar to the Gulf Stream influenced largely by the AMOC, the acceleration of the Kuroshio and KE is mainly due to the responses of wind field to Arctic sea ice loss. Though there is some cooling in the northeast of Japan, the SST response displays a warming pattern in the entire North Pacific. The warming is fairly strong in the high latitudes compared to the lower latitudes (recall Figure 2b). A great zonal temperature gradient response appears in the low-mid latitudes, which means it is much warmer in the East Pacific than the West Pacific. Along the meandering Kuroshio path, the warming is quite weak. As a result, a positive change in wind stress curl occurs in the northern North Pacific, but that of the opposite sign in the southwestern and southern regions of the North Pacific (contour in Figure 8b). The cyclonic anomaly in wind stress curl indicates the development of the Aleutian Low and the strengthening of the subpolar gyre. The anticyclonic wind stress curl anomaly in lower latitudes intensifies the subtropical gyre. Furtherly, the norward (southward) Sverdrup transport anomaly (shading in Figure 8b) increases up to 3.5 Sv (1.8 Sv) in the subpolar (subtropical) North Pacific calculated from wind stress via Sverdrup relation. As the frictional western boundary current, the Kuroshio and KE intensifies, which balances the negative vorticity by the Ekman pumping in the subtropical ocean interior. The position of Kuroshio is almost unchanged.
Chen et al. [12] found that the acceleration of the upper-layer Kuroshio is dominantly forced by the surface warming through increasing the isopycnal slope in representative concentration pathway 4.5 (RCP4.5) simulations. Though the surface warming also exists in our experiments, the amplitudes of subsurface warming do not show a marked difference between the east and west of the Kuroshio to influence the isopycnal slope due to the lack of the local warming effect from CO2. The SST warming response in the North Pacific originates from Arctic sea ice loss alone, and that is why the mechanism is different from that in the CO2 forcing simulations. Therefore, we conclude that the Kuroshio response to Arctic sea ice loss is mainly due to the wind changes.
3.5. Impact of the WBC Variations on Atmosphere
Consistent with the SST changes (recall Figure 2a), the air temperature in the lower troposphere (850 hpa level) increases significantly in almost the entire NH in SOM (Figure 9a). The largely atmospheric warming is approximately confined to the north of 40° N in the NH in FOM for the global energy balance constraints, suggesting that ocean dynamics can in turn impact the mid-latitude atmospheric response to sea ice loss, especially in the subtropical western boundary current regions. As is known, the atmosphere and the ocean transport heat from the equator to the poles, maintaining the heat balance of the Earth [45] in climatology. Owing to the reduced meridional temperature gradient from the Arctic warming, the oceanic northward energy transport is reduced, cooling the NH. The strongest cooling effect is in the mid-latitudes and near the WBCs and their extensions [46], which compensates for the excess heat from the Arctic into the northern mid-latitudes. Therefore, the SST response in the Kuroshio region is quite weak. Although the Kuroshio and KE have a slight strengthening due to the wind stress anomaly, the atmospheric warming on the 850 and 925 hpa levels is relatively weak or even not significant at the 95% confidence level (the stippling regions in Figure 9b,c) compared to other regions over the North Pacific.
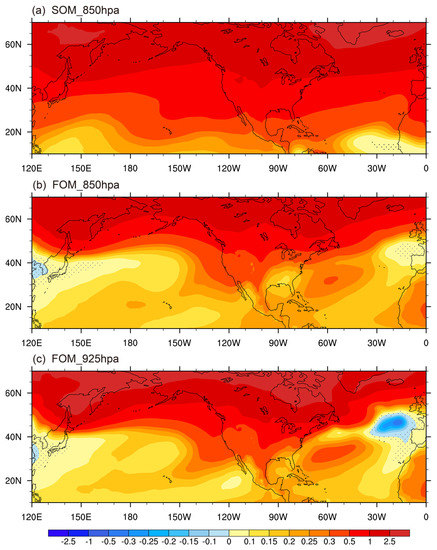
Figure 9.
The quasi-equilibrium response of air temperature (°C) to Arctic sea ice loss at (a) 850 hpa level in SOM, (b) 850 hpa level in FOM, and (c) 925 hpa level in FOM. The values are statistically significant at the 95% confidence level except in the stippling regions.
Meanwhile, the entire North Atlantic warms except for the GE region on the 925 hpa level in the atmosphere. The GE region is cooling, similar to a “hole” embedded in the warming pattern (Figure 9c), a phenomenon known as the warming hole. The North Atlantic warming hole is characterized in the observed record as a region south of Greenland with negative trends in surface air temperature (SAT) despite global warming [47]. Some studies associated the North Atlantic warming hole with a decline in the AMOC [48,49], but we indicate that it involves an adjustment of the gyre circulation and the air–sea interaction is important here. In our sea ice loss experiments, the sea surface cooling causes the upward heat flux to decrease, including the long wave radiation flux (LW), the sensible heat flux (SH), and the latent heat flux (LH) (Figure 10). The LH anomaly is the largest, which means that the atmosphere gets less energy from the ocean. As a result, a warming hole appears over the North Atlantic. The impact of the loss of upward heat flux decreases with height, which results in the warm hole being more clear on the 925 hpa level than on the 850hpa level (Figure 9b,c). It should be noted that the solar radiation also decreases, which makes the surface cooling amplified, especially in the GE region, where there is a minima SST center (Figure 2b and Figure 3b). Though the solar radiation anomaly has a cooling effect on SST, the triggering mechanism of the cooling pattern in the Atlantic is the slowdown of the Gulf Stream and GE, and then it causes the warming hole over the Atlantic.
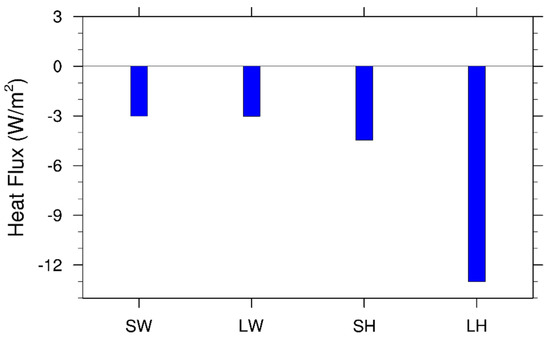
Figure 10.
The average short wave radiation flux (SW), long wave radiation flux (LW), latent heat flux (LH), and sensible heat flux (SH) over the area 42°–50° N, 15°–35° W. The direction is downward for SW while it is upward for LW, LH, and SH. Unit: W/m2.
4. Conclusions and Discussion
To exclude the anthropogenic warming effects and isolate the direct effect of sea ice loss, we used a fully coupled climate model to explore the responses of the Gulf Stream and the Kuroshio. The artificially added longwave radiation flux provides the energy for the melting of sea ice. As the sea ice cover reduces, the Arctic Ocean warms through surface albedo changes. The SST changes in the northern mid-latitudes seen in our sea ice loss experiments contain two parts. One part is the influence of reduced northward ocean heat transport associated with a weakening of the AMOC, and the other part is the influence of heat released to the atmosphere from the newly open waters of the Arctic Ocean, reducing the need for poleward heat transport within the atmosphere. This excess heat is vented from the Arctic into the northern mid-latitudes to warm the ocean [41,46]. The sign of the SST response is determined based on what influence is larger. For the Gulf Stream and GE regions, the ocean circulations adjustments due to the weakened AMOC play a crucial role in causing cooing.
The Arctic sea ice loss causes positive buoyancy fluxes in the subpolar Atlantic, triggering the slowdown of AMOC. As the northward flowing upper limb of the AMOC, the Gulf Stream and GE velocity decrease in the upper ocean. As the current velocity decreases, the diminished temperature advection (ADV) and horizontal diffusion (HDIFF) dominates the sandwiched cooling region in the North Atlantic. The wind stress change due to the SST gradient anomaly partly influences the strength of the Gulf Stream and GE. The role of thermodynamic air–sea interaction is more important in the Kuroshio region in contrast to the Gulf Stream region. Along the meandering Kuroshio and KE path, there is a weak warming response to Arctic sea ice loss on the ocean surface. The anticyclonic anomaly in wind stress curl strengthens the subtropical gyre. The increasing southward Sverdrup transport in the ocean interior indicates the acceleration of the Kuroshio and KE.
The variations in Gulf Stream, Kuroshio, and their extensions in turn modify the mid-latitude atmospheric response to sea ice loss. The warming hole, a phenomenon that is observed as a cooling trend over the North Atlantic, has been simply linked to a slowdown of the AMOC in previous studies [49,50]. Here, we suggest that the warming hole is a chain reaction caused by the responses of the Gulf Stream and GE to Arctic Sea ice loss in our experiments. The sea surface cooling along the Gulf Stream and GE path causes the upward LW, SH and LH (largest) decreasing, which leads to the warming hole in the atmosphere. Apart from the heat exchange from the ocean, the reduced downward solar radiation has a cooling effect on SST, which also contributes to the warming hole formation. In the North Pacific, the Kuroshio and KE have a slight strengthening due to the wind stress anomaly, releasing more heat into the atmosphere, but the reduced northward ocean heat transport has a cooling effect on the Kuroshio and KE regions. A tongue of warming stretching from the United States into the western subtropics in the lower atmosphere shows a zonal temperature gradient in the North Pacific. All the processes discussed above are summarized in Figure 11. The conclusions drawn in this study may be subject to model limitations. To what extent our results depend on the particular model and the experimental design calls for further investigation. Studies using observations and different models would be helpful for determining the robustness of this work.
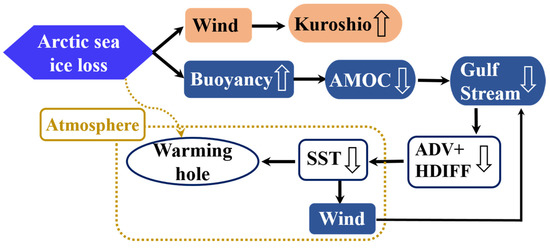
Figure 11.
Schematic diagram showing the mechanisms for the Gulf Stream and Kuroshio responses to Arctic sea ice loss, a series of ocean adjustments, and the atmospheric teleconnections.
Supplementary Materials
The following supporting information can be downloaded at: https://www.mdpi.com/article/10.3390/atmos13040514/s1, Figure S1: The annual mean of longwave radiative flux (W/m2) artificially added to the sea ice model in ICE_21 compared to ICE_20. The direction of longwave radiative flux is downward; Figure S2: The average of 6–25 year response of SST to Arctic sea ice loss in FOM. Values not significant at the 95% confidence level are hatched; Figure S3: Temporal evolutions of the responses to Arctic sea ice loss in FOM. The black curve is for the AMOC index; the green for potential density (kg/m3); the orange for salinity (psu); the red for potential temperature (°C). The right y-axis is for the AMOC index, and the left, for the other variables. All variables, except for the AMOC index, are averaged over the box of 56°–62° N, 50°–58° W and 0–200 m in the Labrador Sea.
Author Contributions
Conceptualization, methodology, and writing—original draft preparation, K.W.; visualization, L.W.; writing—review and editing, H.L. and H.D.; investigation and software, B.D.; resources, C.D. All authors have read and agreed to the published version of the manuscript.
Funding
This research was funded by the National Natural Science Foundation of China (41906009), the National Key R&D Program of China (2020YFB1600103), the joint fund of the State Key Program of National Natural Science of China and the Civil Aviation Administration of China (Grant No. U2033207), the fund of the China civil aviation safety capability project (Grant No. 2146903), and the National Natural Science Foundation of China (42106016).
Institutional Review Board Statement
Not applicable.
Informed Consent Statement
Not applicable.
Data Availability Statement
Not applicable.
Acknowledgments
We greatly appreciate the invaluable suggestions from anonymous reviewers and the editor.
Conflicts of Interest
The authors declare no conflict of interest.
References
- Zhang, L.; Wu, L.; Zhang, J. Coupled Ocean–Atmosphere Responses to Recent Freshwater Flux Changes over the Kuroshio–Oyashio Extension Region. J. Clim. 2011, 24, 1507–1524. [Google Scholar] [CrossRef]
- Frankignoul, C.; Coëtlogon, G.D.; Joyce, T.M.; Dong, S. Gulf Stream Variability and Ocean–Atmosphere Interactions. J. Phys. Oceanogr. 2001, 31, 3516–3529. [Google Scholar] [CrossRef]
- Minobe, S.; Kuwano-Yoshida, A.; Komori, N.; Xie, S.-P.; Small, R.J. Influence of the Gulf Stream on the troposphere. Nature 2008, 452, 206–209. [Google Scholar] [CrossRef]
- Hu, D.; Wu, L.; Cai, W.; Gupta, A.S.; Ganachaud, A.; Qiu, B.; Gordon, A.L.; Lin, X.; Chen, Z.; Hu, S. Pacific western boundary currents and their roles in climate. Nature 2015, 522, 299–308. [Google Scholar] [CrossRef]
- Kwon, Y.-O.; Alexander, M.A.; Bond, N.A.; Frankignoul, C.; Nakamura, H.; Qiu, B.; Thompson, L.A. Role of the Gulf Stream and Kuroshio–Oyashio Systems in Large-Scale Atmosphere–Ocean Interaction: A Review. J. Clim. 2010, 23, 3249–3281. [Google Scholar] [CrossRef]
- Sugimoto, S.; Qiu, B.; Kojima, A. Marked coastal warming off Tokai attributable to Kuroshio large meander. J. Oceanogr. 2020, 76, 141–154. [Google Scholar] [CrossRef]
- Yang, H.; Lohmann, G.; Wei, W.; Dima, M.; Ionita, M.; Liu, J. Intensification and poleward shift of subtropical western boundary currents in a warming climate. J. Geophys. Res. Ocean. 2016, 121, 4928–4945. [Google Scholar] [CrossRef] [Green Version]
- Wu, L.; Cai, W.; Zhang, L.; Nakamura, H.; Timmermann, A.; Joyce, T.; McPhaden, M.J.; Alexander, M.; Qiu, B.; Visbeck, M. Enhanced warming over the global subtropical western boundary currents. Nat. Clim. Chang. 2012, 2, 161–166. [Google Scholar] [CrossRef]
- Dong, S.; Baringer, M.O.; Goni, G.J. Slow Down of the Gulf Stream during 1993–2016. Sci. Rep. 2019, 9, 6672. [Google Scholar] [CrossRef] [Green Version]
- De Coëtlogon, G.; Frankignoul, C.; Bentsen, M.; Delon, C.; Haak, H.; Masina, S.; Pardaens, A. Gulf Stream Variability in Five Oceanic General Circulation Models. J. Phys. Oceanogr. 2006, 36, 2119–2135. [Google Scholar] [CrossRef] [Green Version]
- Joyce, T.M.; Zhang, R. On the path of the Gulf Stream and the Atlantic meridional overturning circulation. J. Clim. 2010, 23, 3146–3154. [Google Scholar] [CrossRef]
- Chen, C.; Wang, G.; Xie, S.-P.; Liu, W. Why does global warming weaken the Gulf Stream but intensify the Kuroshio? J. Clim. 2019, 32, 7437–7451. [Google Scholar] [CrossRef]
- Zhang, W.-Z.; Chai, F.; Xue, H.; Oey, L.-Y. Remote sensing linear trends of the Gulf Stream from 1993 to 2016. Ocean Dyn. 2020, 70, 701–712. [Google Scholar] [CrossRef]
- Wang, Y.L.; Wu, C.R.; Chao, S.Y. Warming and weakening trends of the Kuroshio during 1993–2013. Geophys. Res. Lett. 2016, 43, 9200–9207. [Google Scholar] [CrossRef] [Green Version]
- Andres, M.; Park, J.H.; Wimbush, M.; Zhu, X.H.; Nakamura, H.; Kim, K.; Chang, K.I. Manifestation of the Pacific decadal oscillation in the Kuroshio. Geophys. Res. Lett. 2009, 36. [Google Scholar] [CrossRef] [Green Version]
- Cheon, W.G.; Park, Y.G.; Yeh, S.W.; Kim, B.M. Atmospheric impact on the northwestern Pacific under a global warming scenario. Geophys. Res. Lett. 2012, 39. [Google Scholar] [CrossRef]
- Sakamoto, T.T.; Hasumi, H.; Ishii, M.; Emori, S.; Suzuki, T.; Nishimura, T.; Sumi, A. Responses of the Kuroshio and the Kuroshio Extension to global warming in a high-resolution climate model. Geophys. Res. Lett. 2005, 32. [Google Scholar] [CrossRef]
- Kwok, R.; Rothrock, D. Decline in Arctic sea ice thickness from submarine and ICESat records: 1958–2008. Geophys. Res. Lett. 2009, 36. [Google Scholar] [CrossRef] [Green Version]
- Zhou, Y.; Zhang, N.; Li, C.; Liu, Y.; Huang, P. Decreased takeoff performance of aircraft due to climate change. Clim. Change 2018, 151, 463–472. [Google Scholar] [CrossRef]
- Cvijanovic, I.; Caldeira, K. Atmospheric impacts of sea ice decline in CO2 induced global warming. Clim. Dyn. 2015, 44, 1173–1186. [Google Scholar] [CrossRef] [Green Version]
- Liu, J.; Curry, J.A.; Wang, H.; Song, M.; Horton, R.M. Impact of declining Arctic sea ice on winter snowfall. Proc. Natl. Acad. Sci. USA 2012, 109, 4074–4079. [Google Scholar] [CrossRef] [Green Version]
- Ding, Q.; Schweiger, A.; L’Heureux, M.; Battisti, D.S.; Po-Chedley, S.; Johnson, N.C.; Blanchard-Wrigglesworth, E.; Harnos, K.; Zhang, Q.; Eastman, R. Influence of high-latitude atmospheric circulation changes on summertime Arctic sea ice. Nat. Clim. Chang. 2017, 7, 289–295. [Google Scholar] [CrossRef]
- Chen, H.W.; Zhang, F.; Alley, R.B. The Robustness of Midlatitude Weather Pattern Changes due to Arctic Sea Ice Loss. J. Clim. 2016, 29, 7831–7849. [Google Scholar] [CrossRef]
- Liu, W.; Fedorov, A.; Sévellec, F. The Mechanisms of the Atlantic Meridional Overturning Circulation Slowdown Induced by Arctic Sea Ice Decline. J. Clim. 2019, 32, 977–996. [Google Scholar] [CrossRef]
- Sévellec, F.; Fedorov, A.V.; Liu, W. Arctic sea-ice decline weakens the Atlantic Meridional Overturning Circulation. Nat. Clim. Change 2017, 7, 604–610. [Google Scholar] [CrossRef]
- Wang, K.; Deser, C.; Sun, L.; Tomas, R.A. Fast response of the tropics to an abrupt loss of Arctic sea ice via ocean dynamics. Geophys. Res. Lett. 2018, 45, 4264–4272. [Google Scholar] [CrossRef]
- Screen, J.A.; Deser, C.; Simmonds, I.; Tomas, R. Atmospheric impacts of Arctic sea-ice loss, 1979–2009: Separating forced change from atmospheric internal variability. Clim. Dyn. 2014, 43, 333–344. [Google Scholar] [CrossRef] [Green Version]
- Seierstad, I.A.; Bader, J. Impact of a projected future Arctic Sea Ice reduction on extratropical storminess and the NAO. Clim. Dyn. 2008, 33, 937. [Google Scholar] [CrossRef]
- Peings, Y.; Magnusdottir, G. Response of the wintertime Northern Hemisphere atmospheric circulation to current and projected Arctic sea ice decline: A numerical study with CAM5. J. Clim. 2014, 27, 244–264. [Google Scholar] [CrossRef] [Green Version]
- Dai, H. Roles of surface albedo, surface temperature and carbon dioxide in the seasonal variation of Arctic amplification. Geophys. Res. Lett. 2021, 48, e2020GL090301. [Google Scholar] [CrossRef]
- Dai, H.; Zhao, J.; Yao, Q.; Zhang, X. The Seesaw of Seasonal Precipitation Variability Between North China and the Southwest United States: A Response to Arctic Amplification. J. Geophys. Res. Atmos. 2021, 126, e2020JD034039. [Google Scholar] [CrossRef]
- Screen, J.A. Arctic amplification decreases temperature variance in northern mid- to high-latitudes. Nat. Clim. Chang. 2014, 4, 577–582. [Google Scholar] [CrossRef] [Green Version]
- Overland, J.; Francis, J.A.; Hall, R.; Hanna, E.; Kim, S.-J.; Vihma, T. The Melting Arctic and Midlatitude Weather Patterns: Are They Connected? J. Clim. 2015, 28, 7917–7932. [Google Scholar] [CrossRef] [Green Version]
- Cohen, J.; Screen, J.A.; Furtado, J.C.; Barlow, M.; Whittleston, D.; Coumou, D.; Francis, J.; Dethloff, K.; Entekhabi, D.; Overland, J.; et al. Recent Arctic amplification and extreme mid-latitude weather. Nat. Geosci 2014, 7, 627–637. [Google Scholar] [CrossRef] [Green Version]
- Zhifang, F.; WALLACE, J.M. North-Pacific sea ice and Kuroshio SST variability and its relation to the winter monsoon. Polar Meteorol. Glaciol. 1998, 12, 58–67. [Google Scholar]
- Serreze, M.C.; Barrett, A.P.; Crawford, A.D.; Woodgate, R.A. Monthly variability in Bering Strait oceanic volume and heat transports, links to atmospheric circulation and ocean temperature, and implications for sea ice conditions. J. Geophys. Res. Ocean. 2019, 124, 9317–9337. [Google Scholar] [CrossRef]
- Sato, K.; Inoue, J.; Watanabe, M. Influence of the Gulf Stream on the Barents Sea ice retreat and Eurasian coldness during early winter. Environ. Res. Lett. 2014, 9, 084009. [Google Scholar] [CrossRef]
- O’Reilly, C.H.; Minobe, S.; Kuwano-Yoshida, A. The influence of the Gulf Stream on wintertime European blocking. Clim. Dyn. 2016, 47, 1545–1567. [Google Scholar] [CrossRef] [Green Version]
- Zhang, L.; Wu, L.; Zhang, J. Simulated Response to Recent Freshwater Flux Change over the Gulf Stream and Its Extension: Coupled Ocean–Atmosphere Adjustment and Atlantic–Pacific Teleconnection. J. Clim. 2011, 24, 3971–3988. [Google Scholar] [CrossRef]
- Blackport, R.; Kushner, P.J. The Transient and Equilibrium Climate Response to Rapid Summertime Sea Ice Loss in CCSM4. J. Clim. 2016, 29, 401–417. [Google Scholar] [CrossRef]
- Deser, C.; Tomas, R.A.; Sun, L. The Role of Ocean–Atmosphere Coupling in the Zonal-Mean Atmospheric Response to Arctic Sea Ice Loss. J. Clim. 2015, 28, 2168–2186. [Google Scholar] [CrossRef] [Green Version]
- Kang, D.; Curchitser, E.N. Gulf Stream eddy characteristics in a high-resolution ocean model. J. Geophys. Res. Ocean. 2013, 118, 4474–4487. [Google Scholar] [CrossRef]
- Chelton, D.B.; Schlax, M.G.; Freilich, M.H.; Milliff, R.F. Satellite Measurements Reveal Persistent Small-Scale Features in Ocean Winds. Science 2004, 303, 978–983. [Google Scholar] [CrossRef] [Green Version]
- Talley, L.D.; Pickard, G.L.; Emery, W.J.; Swift, J.H. Chapter 7—Dynamical Processes for Descriptive Ocean Circulation. In Descriptive Physical Oceanography, 6th ed.; Talley, L.D., Pickard, G.L., Emery, W.J., Swift, J.H., Eds.; Academic Press: Boston, MA, USA, 2011; pp. 187–221. [Google Scholar]
- Yang, H.; Li, Q.; Wang, K.; Sun, Y.; Sun, D. Decomposing the meridional heat transport in the climate system. Clim. Dyn. 2015, 44, 2751–2768. [Google Scholar] [CrossRef] [Green Version]
- Tomas, R.A.; Deser, C.; Sun, L. The Role of Ocean Heat Transport in the Global Climate Response to Projected Arctic Sea Ice Loss. J. Clim. 2016, 29, 6841–6859. [Google Scholar] [CrossRef]
- Drijfhout, S.; Van Oldenborgh, G.J.; Cimatoribus, A. Is a decline of AMOC causing the warming hole above the North Atlantic in observed and modeled warming patterns? J. Clim. 2012, 25, 8373–8379. [Google Scholar] [CrossRef]
- Woollings, T.; Gregory, J.M.; Pinto, J.G.; Reyers, M.; Brayshaw, D.J. Response of the North Atlantic storm track to climate change shaped by ocean–atmosphere coupling. Nat. Geosci. 2012, 5, 313–317. [Google Scholar] [CrossRef] [Green Version]
- Rahmstorf, S.; Box, J.E.; Feulner, G.; Mann, M.E.; Robinson, A.; Rutherford, S.; Schaffernicht, E.J. Exceptional twentieth-century slowdown in Atlantic Ocean overturning circulation. Nat. Clim. Chang. 2015, 5, 475–480. [Google Scholar] [CrossRef] [Green Version]
- Keil, P.; Mauritsen, T.; Jungclaus, J.; Hedemann, C.; Olonscheck, D.; Ghosh, R. Multiple drivers of the North Atlantic warming hole. Nat. Clim. Chang. 2020, 10, 667–671. [Google Scholar] [CrossRef]
Publisher’s Note: MDPI stays neutral with regard to jurisdictional claims in published maps and institutional affiliations. |
© 2022 by the authors. Licensee MDPI, Basel, Switzerland. This article is an open access article distributed under the terms and conditions of the Creative Commons Attribution (CC BY) license (https://creativecommons.org/licenses/by/4.0/).