Abstract
Airborne benzene in workplaces has progressively decreased due to preventive actions and the redesigning of facility processes. Professionals who assess occupational exposure should select techniques to detect benzene levels comparable to ambient air exposure. Thus, sensitive biomarkers are needed to discriminate the effects of confounding factors, such as smoking or sorbic acid (SA). In order to identify sensitive biomarkers and to study their correlation with confounding factors, 23 oil refinery workers were enrolled in the study; their airborne benzene exposures and biomarkers were monitored. Urinary benzene (U-B), t,t-muconic acid (t,t-MA), and S-phenylmercapturic acid (SPMA) were quantified. Urinary cotinine (U-C) and t,t-sorbic acid (t,t-SA) were evaluated to flag smoking and SA intake, respectively. The benzene measured in personal inhalation sampling ranged from 0.6 to 83.5 (median 1.7) µg/m3. The concentration range of the biomarkers, U-B, t,t-MA, and SPMA, were 18–4893 ng/m3, <10–79.4 µg/g creatinine, and <0.5–3.96 µg/g creatinine, respectively. Pearson tests were carried out; the best correlations were between airborne benzene and U-B (µg/L r = 0.820, p < 0.001) and between benzene and SPMA (g/L r = 0.812, p < 0.001), followed by benzene and t,t-MA (mg/L r = 0.465, p = 0.039). From our study, U-B and SPMA result to be the most reliable biomarkers to assess the internal number of low doses of benzene exposure, thanks to their specificity and sensitivity.
1. Introduction
Benzene is one of the most studied and controlled substances in occupational exposure assessment and in safety handling procedures. Its wide usage as a solvent in the past has led to a variety of workers being exposed. Nowadays, workplace exposures to benzene are strictly regulated and are limited to petrochemical workers, mechanics, firefighters, and a few other jobs. To assess this exposure, in addition to personal air monitoring, biomonitoring may add information, such as sources and pathways of exposure.
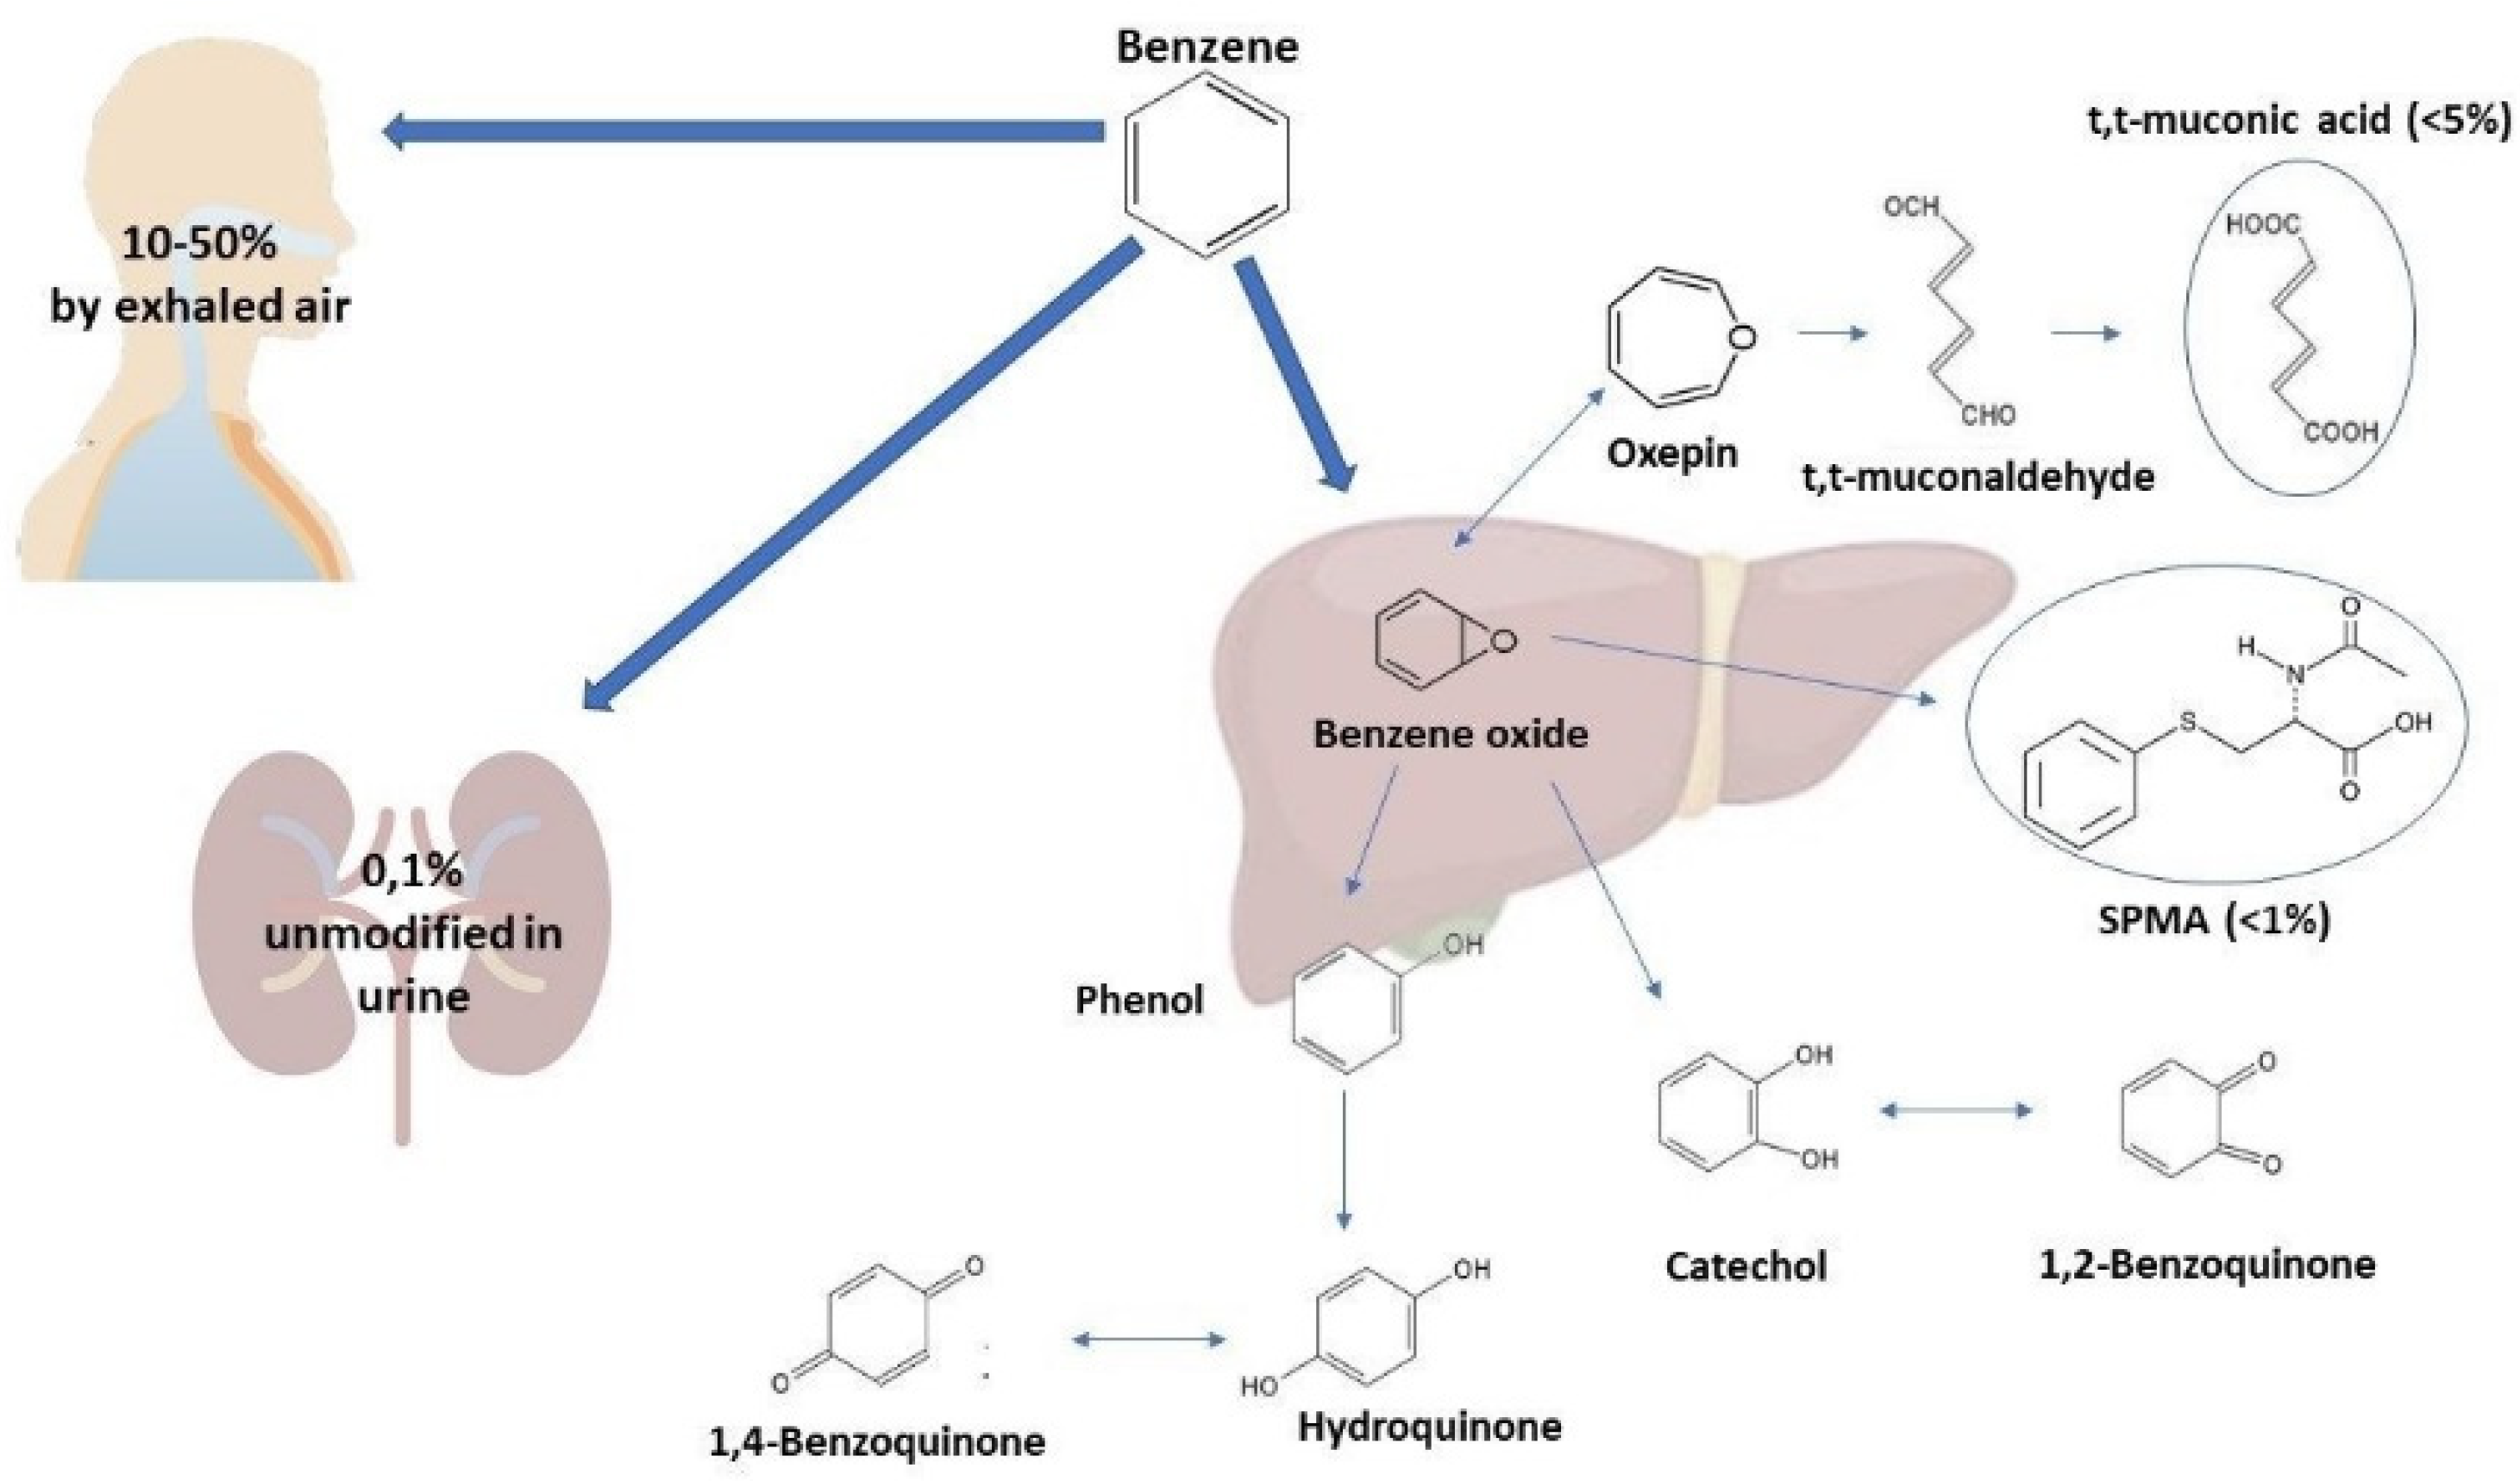
The toxic effects of benzene are related to its metabolism patterns (Figure 1) [1]. About 10% to 50% of benzene is eliminated from the body by exhaled air, while 0.1% is eliminated unmodified in urine. The remaining amount undergoes hepatic metabolism. Benzene oxidizes to benzene oxide, which mainly rearranges to phenol, which is excreted or metabolized to hydroquinone and 1,4-benzoquinone. The remaining benzene oxide hydrolyzes to catechol and 1,2-benzoquinone, rearranges in oxepine, or reacts with glutathione to form S-phenylmercapturic acid (SPMA). Oxepin metabolism opens the aromatic ring, yielding reactive muconaldehydes and t,t-muconic acid (t,t-MA) [2]. The most commonly-used benzene biomarkers for estimating occupational exposure include urinary benzene (U-B) and its urinary metabolites, t,t-MA and SPMA. However, international regulatory institutions still do not concur on preferred biomarkers as the basis for Biological Limit Values (BLV). The American Conference of Governmental Industrial Hygienists (ACGIH) recommends both SPMA and t,t-MA end-shift urine sampling, with Biological Exposure Indices (BEIs) of a maximum of 25 and 500 μg/g creatinine, respectively. Instead, the urinary benzene limit value in the EU is currently under revision. In 2018, a proposal from the Committee for Risk Assessment (RAC) suggested a BLV of 0.7 µg/L for U-B and of 2 µg/g creatinine for SPMA in end-shift urine, together with an inhalation occupational exposure limit (OEL) of 0.05 ppm. This suggestion was subsequently followed by an Advisory Committee on Safety and Health at work (ACSH) proposal of an ultimate limit value of 0.2 ppm to be reached four years after the directive’s publication, with a transitional OEL of 0.5 ppm in the meantime. Even if a BLV was not specified in the proposal, since BLVs are not currently regulated by the Carcinogens and Mutagens Directive (CMD), ACSH suggested using the BLVs proposed by the RAC when developing guidelines for biomonitoring.
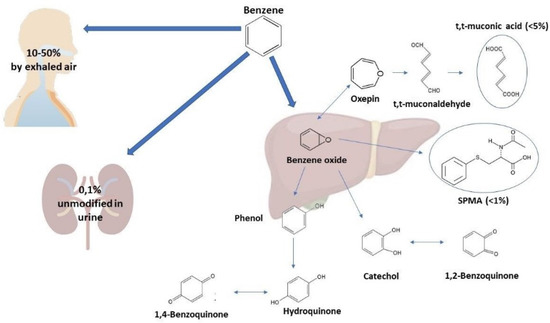
Figure 1.
Excretion pathways of benzene.
BLV aims to watch over and understand occupational exposure in different scenarios. BLVs do not distinguish between hazardous and non-hazardous exposures; an individual’s measurements might overcome the BLV without increasing the health risk due to biological variability. However, if specific markers in a worker’s samples, sampled on different occasions, repeatedly exceed the BLV, or if most measurements of a group of employers at the same workplace surpass the BLV, the causes must be investigated, and corrective actions have to be taken.
BLVs have been identified as those compounds that are most likely to be observed in biological samples collected from workers who are exposed by inhalation of at-risk chemicals. However, dermal route is gaining increasing attention; in 2000, the European Union identified 62 at-risk chemical substances and specified each one’s OEL; of these, 25 compounds received a “skin” notation to pinpoint that skin exposure to these chemicals could lead to toxicologically significant intakes [3]. For such substances, monitoring ambient air concentrations may not be enough, and biological monitoring must be enacted and is necessary due to the different exposure pathways that may occur, such as the dermal route. However, valid and useful biomarkers must be identified and regulated.
Concerning the canonical biomarkers of benzene exposure, several studies demonstrate a good correlation of t,t-MA and SPMA to airborne benzene concentration [4,5]. While t,t-MA could be a sensitive biomarker due to benzene’s relatively high biotransformation rate (>4%), it presents significant disadvantages [6]. Firstly, benzene’s t,t-MA biotransformation rate varies greatly between individuals (from <0.1 to 58%) due to exposure conditions [7]. Furthermore, t,t-MA is not a specific biomarker of low-dose exposure; it shows high variability in background levels since it is also a metabolite of t,t-sorbic acid (t,t-SA) [8]. Sorbic acid (SA) and its salts are used as preservatives in food and beverages, as well as in many drugs and cosmetics. Daily intake of SA and its salts has been reported to be on the order of tens of mg [9,10]. The biotransformation rate of SA into t,t-MA was estimated to vary between 0.05 and 0.51% [8]. Therefore, the t,t-MA suitability as a biomarker for low-dose exposure of benzene is being questioned. According to some authors [11], only a small percentage of background t,t-MA values can be imputed to the benzene, with the rest being due to food intake. Hoet et al. [12] noticed a correlation between t,t-MA and SA in urine, but this was modestly related to blood benzene. Currently, ACGIH recommends a BEI of 500 μg/g creatinine per t,t-MA (end of shift), based on a TLV-TWA of 0.5 ppm.
Due to the uncertainties related to t,t-MA, urinary benzene is considered the most specific indicator; however, SPMA can be used with U-B as a specific bio-indicator of exposure, since its only source is benzene [13]. The conversion rate of SPMA is low, but no other metabolic pathways from which SPMA originates are known. Some authors, although, have demonstrated the role of genetic polymorphisms on SPMA urinary levels as sensitive to “null” GSTT1 allele genotypes of glutathione transferases (GST), which reduce urinary elimination [14,15]. Nevertheless, analytical issues must be treated. Compared to t,t-MA, U-B and SPMA are quite low; thus, highly sensitive and precise analytical methods are needed [16,17]. These methods require sophisticated instruments and skilled technicians, both in sampling and analysis phases. Currently, pre-analytical and analytical factors limit the routine application of U-B [18]. In addition, SPMA, t,t-MA, and U-B are affected by smoking habits due to the direct inhalation of significant amounts of benzene in tobacco products; these doses might be of the same magnitude as low occupational exposure [19]. Thus, urinary cotinine (U-C) analyses are necessary to evaluate the smoking habits impact on occupational exposure measurements [20].
Dermal absorption of benzene is a further potential factor that must be factored in. However, it is generally considered less impactful than inhalation since benzene evaporates quickly from the skin. Furthermore, dermal exposure is prevented by the correct use of personal protective equipment. Nevertheless, our study monitored this by inspecting the internal part of workers’ gloves at the end of their shift [21].
This study presents a fully automated analytical methodology that allows a robust and traceable assessment of occupational exposure to airborne benzene. In addition, the analysis, and the correlation between personal environmental sampling and biomarkers of benzene exposure, carried out with oil refinery workers employed in petroleum refining activities is shown. This evaluation aims to analyze the ability of U-B, t,t-MA, and SPMA to estimate occupational exposure at low airborne benzene concentrations, considering the effect of known confounding factors and assessing the internal dose that may derive from dermal exposure.
2. Materials and Methods
The occupational monitoring campaign was conducted from March to April 2019. The study population was a non-smoking cohort of 23 workers at an oil refinery: 15 field operators employed in routine operations inside the plant, five laboratory technicians, and three supervisors of fuel-tank loading. All the subjects gave their informed consent in compliance with the Helsinki Declaration [22,23]. Personal sampling was performed in the breathing zone, in the space between the chin and shoulder, throughout the work shift. At the shift’s end, the operators proceeded with urine collection; these were immediately sealed to avoid leakage and placed at −20 °C. All participating workers filled out a questionnaire (see Supplementary Material Figure S1) to collect data on their professional and lifestyle habits, especially passive smoking exposure and diet. To better understand and exclude the possible contribution of dermal exposure, specific questions were asked in the questionnaire, and the conditions of the workers’ gloves were checked at the end of the shift to verify internal contamination.
In addition to U-B, t,t-MA, and SPMA, SA and U-C were analyzed to verify dietary intake and smoking habits, respectively. Furthermore, airborne n-hexane from personal air sampling and its specific metabolite in urine, the free fraction of 2,5-hexanedione (2,5 HD), were also determined. Since n-hexane is not affected by confounding factors, it helps to discriminate between exposure due solely to gasoline and other benzene sources of exposure. Airborne toluene was monitored as well, since it is a constituent of gasoline. All solvents and analytical standards were purchased by Merck KGaA.
The standard method adopted for evaluating airborne benzene and n-hexane was EN 14662-2 (EN 14662-2, 2005), using active sampling with standard 150/75 mg charcoal sorbent tubes (Di.Elle, Padova, Italia) and GilAir Pumps (Gilian-Sensidyne, St. Petersburg, US) at a flow rate of 200 mL/min, collecting for 480 min during the work-shift. The tubes were then closed with PTFE caps, stored at −20 °C, and analyzed no later than one week after collection. Prior to the gas-chromatography-mass spectrometry (GC-MS) analysis, the extraction step was carried out; 1 mL of carbon disulfide low-benzene (Merck KGaA) with a diluted internal standard (5 ppm of fluorotoluene, Merck KGaA) was added to each sample, and then they were shaken for 30 min.
A Shimadzu QP2010 GC-MS, equipped with a three-axis autosampler AOC-5000 Plus with Multi Tools Exchange (Shimadzu Europa GmbH, Duisburg, Germany), was used with a Varian Factor FOUR VF-5 MS analytical column, 60 m, 0.25 mm internal diameter, and 1.0 µm film thickness (J&W Agilent Technologies, Santa Clara, CA, USA). The MS acquired data in scan mode with intervals of 4.40–6.90 min (29–100 m/z) and 7.30–38.00 (40–250 m/z). Benzene, n-hexane, fluorotoluene, and toluene were quantified at m/z 78, 57, 109, and 91, respectively. The GC-MS quantification was performed using an internal standard calibration curve. Field blank tubes and spiked samples were used to build the calibration curve.
Concerning the biological monitoring, only one urine sample for each enrolled worker was collected at the end of the work-shift by a 40 mL amber glass vial with PTFE/silicone septum (Merck KGaA), and it was stored immediately at −20 °C. After thawing, the urine samples were portioned out and kept at −20 °C for SPMA, U-C, t,t-SA, t,t-MA, 2,5-HD, and creatinine determinations, scheduled within 30 days, while urine aliquots for U-B and U-MTBE were stored at 4 °C and analyzed within the following seven days. Creatinine was measured to adjust t,t-MA, t,t-SA, and SPMA concentrations, as μg/g creatinine, for comparison with ACGIH limit values.
The analytical methods applied, using GC/MS or LC/MS detection, are summarized in Table 1 and Table 2.

Table 1.
Main features of the analytical methods applied in the study.
Table 2.
Quantitative approaches applied in the study.
U-B analysis was performed by headspace (HS) Solid Phase MicroExtraction (SPME) and was analyzed with a Shimadzu QP2010 GC-MS in Selective Ion Monitoring (SIM) mode, equipped with an autosampler with a Multi-Fiber eXchange (MFX) [24]. Extraction was performed via a 20-mL vial, with an added 2 g of NaCl, and filled with an 8 mL urine aliquot and 15 μL of fluorotoluene (5 μg/mL, Merck KGaA); it was kept in temperature-controlled agitation at 60 °C for 20 min. Subsequently, a Fast Fit Assemblies (FFA) Carboxen/PDMS SPME fiber (Merck KgaA) was immersed for 20 min in HS and then desorbed in the GC injector. Separation was performed through a Varian Factor FOUR VF-5 MS with a 10 m EZ-GUARD (J&W Agilent Technologies). U-B was quantified by the m/z 78 ion.
SPMA analysis was performed by on-sample derivatization and direct immersion (DI) SPME with a Varian 3900/MS 320 triple quadrupole (TQ) GC-MS/MS, using 1% isobutane in an argon gas mixture for negative chemical impact; the GC-MS/MS system was equipped with a Flex x,y,z autosampler (EST Analytical, Fairfield, Ohio) equipped with a six-position MFX and devices as previously described [25,26]. The aliquot of 1 mL of sample was transferred into a 20-mL vial, added with 10-μL of internal standard solution (13C6-SPMA, Giotto Biotech, Prato, Italy), and then placed into the autosampler. The routine procedure is acidifying the urine to pH < 1 to convert pre-SPMA to SPMA [27]. After agitation, 215 μL of 0.1 M KOH (Merck KGaA) solution was added to adjust the pH to 8. Ultrasound-assisted derivatization of the SPMA with 2,3,4,5,6-pentafluorobenzyl bromide solution (Merck KGaA) was carried out [25]. Finally, the 20-mL sample vial was filled with 18 mL of water, and the DI-SPME extraction was carried out using a 65-μm FFA-PDMS/DVB (Merck KGaA) temperature-controlled agitation at 60 °C for 20 min. The GC was provided with a Varian Factor FOUR VF-5 MS column. The SPMA derivative was quantified in Q1 > Q3 mode, m/z 238 > 108.8, while the 13C6-SPMA derivative was quantified with m/z 244 > 115.
Free 2,5-HD was determined with on-sample derivatization; HS-SPME analysis was carried out with a Varian CP 3800/Saturn 2200 Ion Trap, equipped with a CTC CombiPAL autosampler (CTC Analytics, Zwingen, Switzerland) and an MFX. Acquisition operated in SIM mode [28]. In a 20-mL vial, 2 mL of urine was supplemented with 100 μL of O-(2,3,4,5,6-pentafluorobenzyl)-hydroxylamine (PFBHA, Merck KGaA) water solution at 20 mg/mL and 30 μL of internal standard (2 μg/L cyclohexanone, Merck KGaA). Derivatization at 20 °C lasted 16 h before HS-SPME extraction was performed at temperature-controlled agitation at 60 °C for 20 min with 30-μm FFA-PDMS (Merck KGaA). Separation was optimized with a Varian Factor FOUR VF-5MS. 2,5-HD/bis-PFB-oxime was quantified by m/z 292, m/z 181, and m/z 323 ions; the internal standard was quantified at m/z 276.
The t,t-SA was analyzed with on-sample derivatization; HS-SPME analysis was performed with a Varian CP3800/Saturn 2200 Ion Trap, mentioned above. An amount of 200 µL of urine was added to 1.8 mL of water in a 20-mL vial, and then 40 μL of internal standard (120 μg/mL cyclopentanecarboxylic acid-CPC, Merck KGaA) was inserted. Derivatization with trimethyloxonium tetrafluoroborate (Merck KGaA) was performed [29]. For extraction by HS-SPME, sodium chloride (0.5 g) was added to the vials, and an 85-μm FFA-PA (Merck KGaA) was used in temperature-controlled agitation at 60 °C for 20 min, and then it was desorbed in the GC injector. Separation was optimized with a Varian Factor FOUR VF-5 MS. The t,t-SA derivative was quantified at m/z 111, while m/z 67 and 95 were used as confirmation ions. CPC methyl ester was quantified at m/z 87.
The t,t-MA was analyzed with an on-line SPE LC-MS/MS method, set up on an Alliance e2695 LC Selector Valve coupled with a Quattro Micro API TQ-MS (Waters, Milford, CT, USA), using negative electrospray ionization (ESI) and collision-induced fragmentation. A urine aliquot of 1 mL was added with 20 μL of internal standard (30 μg/mL cis,cis-2,5-dimethylmuconic acid, Merck KGaA), 2 mL of a water/methanol 50:50 solution, and 15 μL of formic acid. After centrifugation, the samples were filtered with an Acrodisc Syringe Filter GHP (13 mm, 0.2 um) (Waters) and analyzed. On-line SPE purification was performed with an Oasis HLB, 25 μm with 2.1-mm internal diameter and 20-mm column length (Waters), followed by separation with an Atlantis T3, 3-μm particles with 2.1-mm internal diameter and 100-mm column length (Waters). Elution was conducted at 25 °C with a 0.3 mL/min flow and 10 μL of sample injection. The MS utilized multiple reaction monitoring (MRM). The t,t-MA was quantified by m/z 141.018 > m/z 52.77 and m/z 141.018 > m/z 96.89 as confirmation ion, while the internal standard acquisition was m/z 169.149 > m/z 125.039.
U-Cotinine was determined by LC-MS/MS with the same instrument as t,t-MA but by using positive ESI. A urine aliquot of 1 mL was added with the internal standard (25-μg/mL daunorubicin, Merck KGaA), then it was treated and analyzed as the t,t-MA samples. U-C was quantified by m/z 177.093 > m/z 79.861, while the internal standard acquisition was m/z 528.256 > m/z 321.124.
Five replicates for each standard sample were processed to perform the internal standard calibration to quantify all these biological markers. The least-square linear regression was used to estimate the slopes (m) and intercepts (b) of the calibration curve. The limit of detection (LOD) was estimated by the equation:
where SEb is the standard error of the intercept. The lower limit of quantification (LOQ) was calculated using the formula 10 SEb, corresponding to 3.3 LOD.
The precision of the methods (as a coefficient of variation, CV%) was calculated both as within-session and as intersession repeatability. In addition, the accuracy for toxic organic compounds was evaluated by ClinChek Controls (Recipe, Munich, Germany) and for SPMA using ClinChek Urine Control for Occupational Medicine, Levels I and II (Recipe, Munich, Germany). U-B, U-C, and SA accuracy were verified from a urine pool that had been previously quantified and then fortified by two different amounts of analyte. These accuracy values were then compared with the requirements of US Food and Drug Administration to validate the proposed analytical methods [30].
The Statistical Package for Social Science (SPSS) was used for the statistical analysis. Relationships between the analytes were assessed by simple linear correlation analysis between the data for environmental benzene paired with U-B and between U-B paired with benzene metabolites.
3. Results and Discussion
Our study proposes fully-automated, rapid, and high-throughput methods for determining airborne benzene through personal sampling while contemporaneously quantifying, with proficient LOQs, its more sensitive and specific metabolites to evaluate low-dose (<0.1 ppm) benzene exposure scenarios. Calibration curves, linearity parameters, and LOD/LOQ values are reported in Table 3. All methods proposed present the sensibility, accuracy, and precision required by the current limit value for each substance.
Table 3.
Calibration curve parameters, limit of detection (LOD), limit of quantification (LOQ) values, accuracy, and repeatability for personal sampling and biomonitoring analytes. (U-B urinary benzene; t,t-SA: trans-trans sorbic acid; U-C: urinary cotinine; t,t-MA trans-trans muconic acid; SPMA: S-phenylmercapturic acid; 2,5-HD: 2,5-hexanedione).
In terms of sensitivity and specificity, advances in analytical technologies allow us to find growingly lower concentrations of compounds in biological specimens. This expands the potential of human biomonitoring to include the assessment of environmental exposures, particularly occupational exposure to hazardous compounds. This recent development of valid biomonitoring methods and pinpointing specific biomarkers led our group to carry out this study to assess different aspects, among which are urine sampling cautions, correlation between airborne benzene concentration and biomarkers, potential dermal route contribution, and biological confounding factors.
All enrolled workers performed the personal sampling during their work shift, and the urine along with the questionnaires were gathered at the end of the shift. The urine specimens had to be immediately sealed in an amber vial to prevent losses during sample collection and possible analyte photodegradation; moreover, the handling and storage of urine had to be minimized to maintain unchanged physicochemical characteristics. Particularly, U-B requires special attention because benzene will equilibrate rapidly in the air above the sample, reducing or enriching the analyte in the sample, depending on the benzene concentration above it. For that reason, the sealing of samples must be carried out as fast as possible. Another fundamental aspect to underline is that the only practical occupational approach to collect urine samples is a single voiding before, during, or at the end of the work shift [31]. This approach could be less representative that the one used in clinical practice, where 24 h of total urine collections are routine, and thus the measurement of creatinine is often used to adjust analyte concentrations for the effects of fluid balance. In the occupational settings, the ACGIH proposed acceptability criteria (range: 0.5–2.3 g/L) for urinary creatinine [32]. We found that all the urine samples were compliant with the ACGIH range. Three urine samples resulted in >10 ng/mL of U-C, probably due to passive smoking not reported in the questionnaire; thus, these subjects were not included in the study. The t,t-SA results ranged from <8.1 to 154 μg/L in the urine samples.
Concerning the correlation between airborne benzene values and the biomarker concentrations, the combined results of personal air and biological monitoring are shown in Table 4. We can observe that when airborne benzene concentrations increase, higher values of U-B and SPMA were found in the biological samples (e.g., samples 7 and 16). This correlation was not so clear for t,t-MA; although some urine samples contained high values of this metabolite, the respective personal airborne monitoring showed low benzene concentration (e.g., samples 9 and 11). It is noticeable that high concentrations of toluene may lead to misjudging SPMA evaluation (e.g., samples 3 and 20), in line with the literature [33]. Inhalation exposure to benzene is generally low. It should be noted that operators involved in the study did not necessarily correspond to the ones performing tasks with higher benzene exposures, but the aim was to enroll exposed workers that likely were subject to a smaller number of confounding factors.
Table 4.
Values of personal air samplings and biomonitoring. Legend: free 2.5-HD = hexanedione; U-B = urinary benzene; t.t-MA = trans-trans muconic acid; SPMA = S-phenylmercapturic acid.
In addition, we considered the contribution of the dermal route, whose potential influence had been indicated in a previous study [34]. However, none of the analyzed gloves showed traces of internal contamination that would have led to skin exposure. This finding is in line with the results of van Wendel de Joode et al. [35]; in a similar study, they tested a charcoal pad sampler in a petrochemical setting, observing very low benzene concentration and estimating the contribution of the dermal route to internal benzene exposure as less than 0.06%. Therefore, only airborne benzene levels and biomarker concentrations in urine were compared. Our results show a considerable correlation between airborne benzene with U-B and SPMA (Pearson test = 0.820, p < 0.001 and 0.812, p < 0.001, respectively) (Table 5). Furthermore, U-B and SPMA have a better correlation than U-B and t,t-MA (Pearson test = 0.795, p < 0.001 and 0.440, p = 0.052 respectively). In fact, most of the workers had been exposed to airborne benzene concentrations of less than 0.1 ppm, yet their t,t-MA level ranged from <10 μg/g creatinine to 79.4 μg/g creatinine. Moreover, workers with the highest amounts of t,t-MA did not correspond to those with the highest inhalation exposure. The weak correlation observed between t,t-MA and airborne benzene or the other metabolites analyzed might be due to the interference of dietary SA intake [36,37]; therefore, only workers that declared no assumption of SA on the questionnaires were enlisted in this study. Nowadays, preservative additives are widely used in the food industry that they significantly affect urinary t,t-MA. Even if t,t-MA is a good biomarker for occupational exposure to airborne benzene in high concentration scenarios, it fails in low-dose exposure contexts due to its lack of specificity, e.g., for smoke and inter-individual metabolic variability [38]. Since preventative actions have generally lessened benzene exposure in the workplace, more sensitive biomarker exposures are now required. Hence, the growing interest in SPMA and U-B, which present high correlation rates with airborne benzene, is due to their specificity and not having interferences, such as SA for t,t-MA.
Table 5.
Pearson’s correlation (PC) analysis to evaluate the relationships between benzene from personal samplings and its metabolites (20 subjects). Legend: U-B = urinary benzene; t,t-MA = trans-trans muconic acid; SPMA = S-phenylmercapturic acid.
To distinguish the contribution of workplace activity to metabolite concentrations from the main confounding factors from non-occupational sources, U-B and t,t-SA were analyzed concurrently, while specific questions of the questionnaire aimed at identifying possible confounding factors. Only non-smokers were enrolled for this study, and potential passive smoke exposure was verified by U-C determination, while t,t-SA was measured, and the results were cross-checked with the questionnaire. Our methodologies successfully identified the correlation between airborne substances and their metabolites due to their sensitivity and specificity. On the other hand, even though our results are promising and in accordance with other studies [39], it should be noticed that the number of samples analyzed to evaluate the correlations is small. Therefore, these correlations should be confirmed with a further study involving a greater number of workers, always bringing attention to confounding factors enrolling the subjects (diet, urinary creatinine, passive smoking).
Focusing on the analytical aspects, in chromatography, automated, unattended sample treatment could increase laboratory throughput and diminish costs, offering results of higher precision than manual operated tools, maximizing work efficiency and data consistency/accuracy, and making any procedure applicable for routine analysis [40]. The autosamplers proposed in this study are equipped with several tools available on the market, comprising a barcode reader, automatic change liners and syringes, decapper, heaters, stirrers, shaking and/or filtration modules, solvent addition, and Local Area Network (LAN) connections, expanding the applicability and efficiency of these autosamplers. The proposed methods use full-automation in sample preparation, chromatographic separation, and MS detection, allowing a reduction in sample handling, which is considered one of the most error-prone phases in the analytical process, while boosting sensitivity. On the other hand, these instruments require skilled operators, important economic effort, and continuous maintenance to guarantee optimal results.
Thus, to obtain a clear view of occupational exposure to benzene in today’s new low-dose work settings and to pursue safety in the workplace, the authors suggest this protocol, using U-B and SPMA as biomarkers. The choice of the instruments/methods to be adopted will be based on several factors, such as the financial resources, the expected concentrations, the exposure limits proposed, the range values, and the exposure scenarios. Above all, the most critical problem is determining the best internal dose biomarker, allowing the integration of all the pathways and sources of exposure.
4. Conclusions
Our results reported that, at low levels of benzene exposure, t,t-MA may not represent benzene exposure in environmental airborne concentrations less than 0.1 ppm in an 8 h work shift; on the other hand, U-B and SPMA show a good correlation with airborne benzene concentration and demonstrate the dose of exposure with similar accuracy, but U-B requires special precautions for urine collecting and, for each analyte, especially sensitive and accurate analytical techniques are necessary, such as those proposed in this study.
As a future perspective, the correlations between biomarkers should be verified using a sample size more significant and focusing on the biomarkers that better reflect the health effects due to benzene exposure. In addition, thanks to the development of new laboratory technologies and tools, the achievement of more automatized sampling and analytical procedures applied to occupational monitoring can guarantee higher productivity and data consistency.
Supplementary Materials
The following supporting information can be downloaded at: https://www.mdpi.com/article/10.3390/atmos13030450/s1, Figure S1: Questionnaire to assess the non-occupational exposure to benzene confounding factor.
Author Contributions
Conceptualization, S.D., G.P. and A.B.; methodology, G.C. and I.P.; software, A.B.; validation, A.B., N.M. and I.R.; formal analysis, G.C.; investigation, G.C. and G.P.; resources, M.C.; data curation, G.P.; writing—original draft preparation, S.D. and A.B.; writing—review and editing, S.D.S. and V.R.; visualization, M.S.; supervision, N.M. and S.D.S.; project administration, G.A. All authors have read and agreed to the published version of the manuscript.
Funding
This research received no external funding.
Informed Consent Statement
Informed consent was obtained from all subjects involved in the study.
Data Availability Statement
Not applicable.
Conflicts of Interest
The study was funded by Eni Spa. Among the authors, Giulia Pizzella, Mario Santillo, and Jacopo Rainaldi are employed by Eni Spa, while Maria Carrara is a medical doctor for Eni Spa.
References
- Snyder, R. Benzene and leukemia. Crit. Rev. Toxicol. 2002, 32, 155–210. [Google Scholar] [CrossRef] [PubMed]
- Bleasdale, C.; Kennedy, G.; MacGregor, J.O.; Nieschalk, J.; Pearce, K.; Watson, W.P.; Golding, B.T. Chemistry of muconaldehydes of possible relevance to the toxicology of benzene. Environ. Health Perspect. 1996, 104, 1201–1209. [Google Scholar] [PubMed] [Green Version]
- Commission Directive 2000/39/EC of 8 June 2000. Official Journal of the European Communiti, L 142/47 16.6.2000. Available online: https://eur-lex.europa.eu/legal-content/EN/TXT/PDF/?uri=CELEX:32000L0039&from=EN (accessed on 8 January 2020).
- Aprea, M.C.; Scapellato, M.L.; Valsania, M.C.; Perico, A.; Perbellini, L.; Ricossa, M.C.; Pradella, M.; Negri, S.; Iavicoli, I.; Lovreglio, P.; et al. Methodology to define biological reference values in the environmental and occupational fields: The contribution of the Italian Society for Reference Values (SIVR). Med. Lav. 2017, 108, 138–148. [Google Scholar] [PubMed]
- Fustinoni, S.; Rossella, F.; Polledri, E.; Bollati, V.; Campo, L.; Byun, H.-M.; Agnello, L.; Consonni, D.; Pesatori, A.; Baccarelli, A.; et al. Global DNA methylation and low-level exposure to benzene. Med. Lav. 2012, 103, 84–95. [Google Scholar]
- Inoue, O.; Seiji, K.; Nakatsuka, H.; Watanabe, T.; Yin, S.N.; Li, G.L.; Cai, S.X.; Jin, C.; Ikeda, M. Urinary t, t muconic acid as an indicator of exposure to benzene. Br. J. Ind. Med. 1989, 46, 122–127. [Google Scholar] [CrossRef]
- Kim, S.; Vermeulen, R.; Waidyanatha, S.; Johnson, B.A.; Lan, Q.; Rothman, N.; Smith, M.T.; Zhang, L.; Li, G.; Shen, M.; et al. Using urinary biomarkers to elucidate dose-related patterns of human benzene metabolism. Carcinogenesis 2006, 27, 772–781. [Google Scholar] [CrossRef]
- Renner, T.; Baer-Koetzle, M.; Scherer, G. Determination of sorbic acid in urine by gas chromatography–mass spectrometry. J. Chromatogr. A 1999, 847, 127–133. [Google Scholar] [CrossRef]
- Verger, P.; Chambolle, M.; Babayou, P.; Le Breton, S.; Volatier, J. Estimation of the distribution of the maximum theoretical intake for ten additives in France. Food Addit. Contam. 1998, 15, 759–766. [Google Scholar] [CrossRef]
- Tfouni, S.A.V.; Toledo, M.C.F. Estimates of the mean per capita daily intake of benzoic and sorbic acids in Brazil. Food Addit. Contam. 2002, 19, 647–654. [Google Scholar] [CrossRef]
- Ruppert, T.; Scherer, G.; Tricker, A.R.; Adlkofer, F. trans, trans-Muconic acid as a biomarker of non-occupational environmental exposure to benzene. Int. Arch. Occup. Environ. Health 1997, 69, 247–251. [Google Scholar] [CrossRef]
- Hoet, P.; De Smedt, E.; Ferrari, M.; Imbriani, M.; Maestri, L.; Negri, S.; De Wilde, P.; Lison, D.; Haufroid, H. Evaluation of urinary biomarkers of exposure to benzene: Correlation with blood benzene and influence of confounding factors. Int. Arch. Occup. Environ. Health 2009, 82, 985–995. [Google Scholar] [CrossRef] [PubMed]
- Melikian, A.A.; Qu, Q.; Shore, R.; Li, G.; Li, H.; Jin, X.; Cohen, B.; Chen, L.; Li, Y.; Yin, S.; et al. Personal exposure to different levels of benzene and its relationships to the urinary metabolites S-phenylmercapturic acid and trans, trans-muconic acid. J. Chromatogr. B Analyt. Technol. Biomed. Life Sci. 2002, 778, 211–221. [Google Scholar] [CrossRef]
- Carrieri, M.; Bartolucci, G.B.; Scapellato, M.L.; Spatari, G.; Sapienza, D.; Soleo, L.; Lovreglio, P.; Tranfo, G.; Manno, M.; Trevisan, A. Influence of glutathione S-transferases polymorphisms on biological monitoring of exposure to low doses of benzene. Toxicol. Lett. 2012, 213, 63–68. [Google Scholar] [CrossRef] [PubMed]
- Manini, P.; De Palma, G.; Andreoli, R.; Mozzoni, P.; Poli, D.; Goldoni, M.; Petyx, M.; Apostoli, P.; Mutti, A. Occupational exposure to low levels of benzene: Biomarkers of exposure and nucleic acid oxidation and their modulation by polymorphic xenobiotic metabolizing enzymes. Toxicol. Lett. 2010, 193, 229–235. [Google Scholar] [CrossRef] [PubMed]
- Frigerio, G.; Mercadante, R.; Polledri, E.; Missineo, P.; Campo, L.; Fustinoni, S. An LC-MS/MS method to profile urinary mercapturic acids, metabolites of electrophilic intermediates of occupational and environmental toxicants. J. Chromatogr. B 2019, 1117, 66–67. [Google Scholar] [CrossRef]
- Marrubini, G.; Dugheri, S.; Pacenti, M.; Coccini, T.; Arcangeli, G.; Cupelli, V.; Manzo, L. Determination of S-phenylmercapturic acid by GC-MS and ELISA: A comparison of the two methods. Biomarkers 2005, 10, 238–251. [Google Scholar] [CrossRef]
- Ong, C.N.; Kok, P.W.; Ong, H.Y.; Shi, C.Y.; Lee, B.L.; Phoon, W.H.; Tan, K.T. Biomarkers of exposure to low concentrations of benzene: A Weld assessment. Occup. Environ. Med. 1996, 53, 328–333. [Google Scholar] [CrossRef] [Green Version]
- Polzin, G.M.; Kosa-Maines, R.E.; Ashley, D.L.; Watson, C.H. Analysis of volatile organic compounds in mainstream cigarette smoke. Environ. Sci. Tecnol. 2007, 41, 1297–1302. [Google Scholar] [CrossRef]
- Petersen, G.O.; Leite, C.E.; Chatkin, J.M.; Thiesen, F. Cotinine as a biomarker of tobacco exposure: Development of a HPLC method and comparison of matrices. J. Sep. Sci. 2010, 33, 516–521. [Google Scholar] [CrossRef]
- Williams, P.R.; Paustenbach, D.J. Reconstruction of benzene exposure for the Pliofilm cohort (1936–1976) using Monte Carlo techniques. J. Toxicol. Environ. Health A 2003, 66, 677–678. [Google Scholar] [CrossRef]
- Lovreglio, P.; Barbierato, M.; Crociata, F.; Tomao, E.; Diomede, L.; Gallo, E.; Scaramuzzo, P.; Drago, I.; Paganelli, M.; Apostoli, P.; et al. Biological monitoring of exposure to polycyclic aromatic hydrocarbons and to metallic elements in Italian Navy workers operating near the industrial area in Taranto (South Italy). Med. Lav. 2018, 110, 339–362. [Google Scholar] [PubMed]
- European Society of Anesthesiology. The Helsinki Declaration on Patient Safety in Anaesthesiology, WMA 2010. Available online: https://www.esahq.org/patient-safety/patient-safety/helsinki-declaration (accessed on 12 December 2019).
- Fustinoni, S.; Rossella, F.; Campo, L.; Mercadante, R.; Bertazzi, P.A. Urinary BTEX, MTBE and naphthalene as biomarkers to gain environmental exposure profiles of the general population. Sci. Total Environ. 2010, 408, 2840–2849. [Google Scholar] [CrossRef] [PubMed]
- Dugheri, S.; Mucci, N.; Cappelli, G.; Bonari, A.; Campagna, M.; Arcangeli, G.; Bartolucci, G. New fully automated gas chromatographic analysis of urinary S-phenylmercapturic acid in isotopic dilution using negative chemical ionization with isobutane as reagent gas. J. Mass Spectrom. 2019, 55, e4481. [Google Scholar] [CrossRef] [PubMed]
- Dugheri, S.; Bonari, A.; Gentili, M.; Cappelli, G.; Pompilio, I.; Bossi, C.; Arcangeli, G.; Campagna, M.; Mucci, N. High-Throughput Analysis of Selected Urinary Hydroxy Polycyclic Aromatic Hydrocarbons by an Innovative Automated Solid-Phase Microextraction. Molecules 2018, 23, 1869. [Google Scholar] [CrossRef] [Green Version]
- Paci, E.; Pigini, D.; Cialdella, A.M.; Faranda, P.; Tranfo, G. Determination of free and total S-phenylmercapturic acid by HPLC/MS/MS in the biological monitoring of benzene exposure. Biomarkers 2007, 12, 111–122. [Google Scholar] [CrossRef]
- Pacenti, M.; Dugheri, S.; Traldi, P.; Degli Esposti, F.; Perchiazzi, N.; Franchi, E.; Calamante, M.; Kikic, I.; Alessi, P.; Bonacchi, A.; et al. New Automated and High-Throughput Quantitative Analysis of Urinary Ketones by Multifiber Exchange-Solid Phase Microextraction Coupled to Fast Gas Chromatography/Negative Chemical-Electron Ionization/Mass Spectrometry. J. Autom. Methods Manag. Chem. 2010, 2010, 972926. [Google Scholar] [CrossRef] [Green Version]
- Pacenti, M.; Dugheri, S.; Villanelli, F.; Bartolucci, G.; Calamai, L.; Boccalon, P.; Arcangeli, G.; Vecchione, F.; Alessi, P.; Kikic, I.; et al. Determination of organic acid in urine by solid-phase microextraction and gas chromatography-ion trap tandem mass spectrometry previous “in sample” derivatization with trimethyloxonium tetrafluoroborate. Biomed. Chromatogr. 2008, 22, 1155–1163. [Google Scholar] [CrossRef]
- Pharmaceutical Quality/CMC. Analytical Procedures and Methods Validation for Drugs and Biologics. Guidance for Industry. Available online: https://www.fda.gov/files/drugs/published/Analytical-Procedures-and-Methods-Validation-for-Drugs-and-Biologics.pdf (accessed on 12 January 2020).
- Cocker, J.; Mason, H.J.; Warren, N.D.; Cotton, R.J. Creatinine adjustment of biological monitoring results. Occup. Med. 2011, 61, 349–353. [Google Scholar] [CrossRef] [Green Version]
- ACGIH. TLVs and BEIs Based on the Documentation of the Threshold Limit Values for Chemical Substances and Physical Agents and Biological Exposure Indices; ACGIH: Cincinnati, OH, USA, 2019. [Google Scholar]
- Carrieri, M.; Spatari, G.; Tranfo, G.; Sapienza, D.; Scapellato, M.L.; Bartolucci, G.B.; Manno, M. Biological monitoring of low-level exposure to benzene in an oil refinery: Effect of modulating factors. Toxicol. Lett. 2018, 298, 70–75. [Google Scholar] [CrossRef]
- Pizzella, G.; Macrì, S.; Gregio, M.; Zamengo, L.; Barbiero, N.; Orrù, G. Ridurre l’esposizione cutanea: l’uso corretto dei DPI. In Proceedings of the 17th Conference Associazione Italiana degli Igienisti Industriali, Corvara, Italy, 25 March 2011. [Google Scholar]
- van Wendel de Joode, B.; Tielemans, E.; Vermeulen, R.; Wegh, H.; Kromhout, H. Dermal exposure assessment to benzene and toluene using charcoal cloth pads. J. Expo. Sci. Environ. Epidemiol. 2005, 15, 47–50. [Google Scholar] [CrossRef]
- Jalai, A.; Ramezani, Z.; Ebrahim, K. Urinary trans, trans-muconic acid is not a reliable biomarker for low-level environmental and occupational benzene exposures. Saf. Health Work 2017, 8, 220–225. [Google Scholar] [CrossRef] [PubMed] [Green Version]
- Marrubini, G.; Coccini, T.; Maestri, L.; Manzo, L. Effect of sorbic acid administration on urinary trans, trans-muconic acid excretion in rats exposed to low levels of benzene. Food Chem. Toxicol. 2002, 40, 1799–1806. [Google Scholar] [CrossRef]
- Sanguinetti, G.; Accorsi, A.; Barbieri, A.; Raffi, G.B.; Violante, F.S. Failure of urinary trans, trans-muconic acid as a biomarker for indoor environmental benzene exposure at PPB levels. J. Toxicol. Environ. Health A 2001, 63, 599–604. [Google Scholar] [CrossRef] [PubMed]
- Carrieri, M.; Tranfo, G.; Pigini, D.; Paci, E.; Salamon, F.; Scapellato, M.L.; Fracasso, M.E.; Manno, M.; Bartolucci, G.B. Correlation between environmental and biological monitoring of exposure to benzene in petrochemical industry operators. Toxicol. Lett. 2010, 192, 17–21. [Google Scholar] [CrossRef]
- Locatelli, M.; Tartaglia, A.; Piccolantonio, S.; Di Iorio, L.A.; Sperandio, E.; Ulusoy, H.I.; Furton, K.G.; Kabir, A. Innovative configurations of sample preparation techniques applied in bioanalytical chemistry: A review. Curr. Anal. Chem. 2019, 15, 731–744. [Google Scholar] [CrossRef]
Publisher’s Note: MDPI stays neutral with regard to jurisdictional claims in published maps and institutional affiliations. |
© 2022 by the authors. Licensee MDPI, Basel, Switzerland. This article is an open access article distributed under the terms and conditions of the Creative Commons Attribution (CC BY) license (https://creativecommons.org/licenses/by/4.0/).