Abstract
Climate change is accelerating its adverse impact on ecosystems and infrastructure systems in cold regions. For extensive carbonate saline soil areas, their response to the freeze-thaw cycle remains uncertain. By considering the continuous intensification of freeze-thaw cycle frequency, the mechanical characteristics of carbonate saline soils are analyzed for different salt content (0.6% to 2.1%) based on the mechanical test in this paper. The purpose is to reveal the change law of shear strength and its parameters of carbonate saline soils under the scenario of continuous freezing and thawing cycles. The micro-characteristics of the carbonate saline soil before and after freeze-thaw cycling were analyzed by scanning electron microscopy, indicating changes in the structural soil properties caused by the combination of freeze-thawing and salinity. The scanning electron microscope images reveal the cumulative effect of frost heaving and salt expansion, i.e., increasing the number of pores between particles, reducing the effective contact between particles, and weakening the interaction force, resulting in cracks development. A series of mechanical tests demonstrate the stress-strain behavior of carbonate saline soils for different numbers of freeze-thaw cycles under different confining pressures. A transformation from strain-softening to strain-hardening is observed with an increase in the salt content from 0.6% to 2.1%. Furthermore, the shear strength of the carbonate saline soil decreases as the salt content and number of freeze-thaw cycles increase. The shear strength degradation mechanism is attributed to the cohesion and the internal friction angle. These shear strength parameters are critical in geotechnical analyses, such as evaluating of load capacity of foundations and slope stability in similar saline soils.
1. Introduction
Climate change is accelerating its impact on ecosystems and infrastructure in the permafrost regions [1,2]. The majority of highways, high-speed rails, and dams in cold regions are constructed on permafrost, but climate warming was not anticipated in the design and construction, and the effects of climate warming now threaten the foundation stability and functional capacity of these facilities [3,4]. In particular, for high-speed railways and highways in permafrost regions, some cutting slopes consist primarily of saline soils. Saline soil regulates the soil water-salt transport during the freeze-thaw cycles (FTCs) [5,6]. This type of soil may crystallize at freezing temperatures, resulting in frost heaving, salt expansion, dissolution, and corrosion. Fatani and Khan (1993) reported foundation problems related to saline soils, including embankment and slope instability due to the dissolution of the salt rock underneath the footing [7]. The factors affecting the physical and mechanical properties of saline soils are the focus of this research to mitigate problems in saline soil areas, such as uneven settlement and foundation cracking.
The effect of freeze-thaw cycling on the behavior of soils has been recently investigated in geotechnical research, particularly saline soils prevalent in cold areas. Repeated FTCs and salinity degrade the development of the physical-mechanical properties of soils due to microscopic pore structure change, macroscopic strength loss, and other factors [8,9,10,11]. In particular, saline soil is characterized by the migration of water and salt under the action of frequent FTCs. The salt migrates into the soil along with the pore water, and salt ions enter charged porous media, reacting with soil particles [12]. The adverse effects of salt are exacerbated by FTCs, and the effects of different salt types and salt contents differ. Most studies analyzed the physical and mechanical properties of several different types of saline soils using laboratory tests and discussed the effects of the type and amount of soil minerals, soil structure, water content, salt content, and freezing conditions on soil behavior [13,14,15,16]. The chloride ions in chloride saline soil cause soil corrosivity and change the physical properties of the soil [17,18]. The cementation of salt crystals in the soil is of great significance in maintaining the strength characteristics of saline soil. Moreover, there is a threshold value for salt content, below which the shear strength and steady-state strength of soil increase due to the solute salt’s crystallization and expansion. Above this threshold, the strength decreases due to the structural damage caused by excessive crystallization and expansion [19,20,21,22]. The effect of osmotic suction generated by electrical conductivity in saline soils on the shear strength of soil has also been investigated [23]. Therefore, the combined effects of the chemical properties of the inundation liquid, the stress history, and the cation exchange capacity of the soil are the key parameters influencing the mechanical behavior of saline soils [24]. For sulfate saline soil, the saline soil with a sulfate content exceeding 0.5% exhibits volumetric expansion due to salt crystallization and formation of mirabilite at low temperatures. The stress-strain behavior of the soil changes from strain-softening to strain-hardening as the number of FTCs and the confining pressure increase [25,26]. Meanwhile, the presence of a sulfate solution increases the unfrozen water content in frozen soil, while the cohesive force decreases as the sodium sulfate concentration increases [27]. Liao et al. (2016) confirmed that frozen saline soil containing Na2SO4 exhibited the minimum critical strength as a salt content of 0.5% [28]. In contrast, You et al. (2017) believed that the mechanical strength of frozen saline soil initially decreased and subsequently increased with an increase in the mass content of Na2SO4 for a soil salinity threshold of 1.5% [10].
However, most saline soils contain many types of salts. Zhang et al. (2019) analyzed the volumetric strain, stress-strain, and shear strength of fine-grained, complex, mixed saline soils containing NaCl and Na2SO4 at low temperatures [29]. Some researchers also explored the effects of FCTs and salt solution (Na2SO4 and NaHCO3) contents on the shear properties of mixed saline soil in the Songnen Plain, Northeast China [30,31,32]. It was found that the transportation of soil water and salt of saline soil was affected by temperature, and the FTCs increased the ion exchange capacity. The amount of water migration was about 3.5%, while the soil salt content generally decreased with increasing depth. In addition, Chen et al. (2022) indicated that lime and fly ash can effectively improve the physical and mechanical properties of carbonate saline soil [33]. Previous literature indicates that most studies have focused on the mechanical properties of sulfate and chloride saline soil. However, there carbonate saline soils are widespread in cold areas, but the evolution of their mechanical properties and microstructure under freeze-thaw cycle conditions remains unclear.
Our study addresses the following questions: how the freeze-thaw cycle impacts the carbonate saline soils in cold regions? The general objective of this paper is to reveal the change law of shear strength and its parameters of carbonate saline soils under the scenario of continuous freezing and thawing cycles. Research findings are beneficial to geotechnical analyses in the saline soil in cold regions under the scenario of climate change.
2. Materials and Methods
2.1. Materials
In order to examine the possible effects of soluble carbonate (NaHCO3) on the shearing strength of silty clay, salinized soil specimens were collected from the ground surface of Durbert Mongolian Autonomous County in Songnen Plain, Northeast China (45°23′–45°59′ latitude and 123°47′–125°45′ longitude). It is a typical carbonate saline soil area and commonly experiences seasonal high-latitude frozen soil. The precipitation falls mainly in the form of summer rain, and snowfall accounts for about 15% (in snow water equivalent, or SWE). The average annual evaporation (117.55 mm) in this area exceeds the average annual precipitation (37.3 mm), accelerating the salinization process in the area [31]. The experimental soil sample was taken from a depth of 1.0 m (Figure 1). The soil samples were then grouped as silty clay based on the Unified Soil Classification System [34]. The mineral compositions of natural soil samples were analyzed by X-ray diffraction, shown in Figure 2. The proportions of different mineral compositions that exist are listed in Table 1. The collected natural saline soil samples were mainly composed of quartz, potash feldspar, and albite. Figure 3 contains the grain size distributions. Table 2 reports the basic physical properties of the natural soil sample. Table 3 show the ion contents of the soil samples, the HCO3− was the predominant anion and Na+ was the major cation in the soil. Therefore, this paper mainly studied the effects of NaHCO3 content on the mechanical properties of soil.
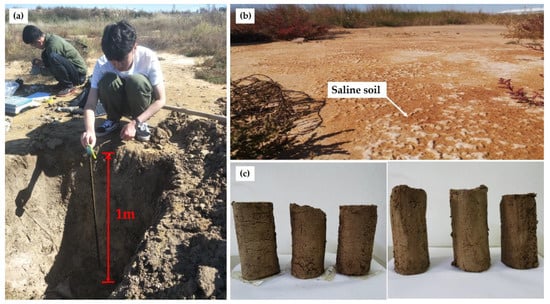
Figure 1.
Natural soil specimens were obtained from sampling sites. Notes: (a) Saline soil site; (b) Surrounding environment; (c) Nature soil specimen.
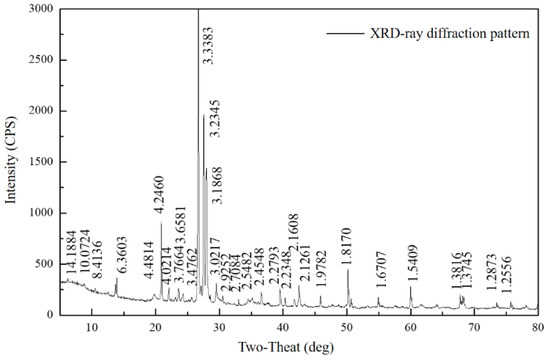
Figure 2.
XRD-ray diffraction pattern.

Table 1.
The mineral content of natural saline soil.
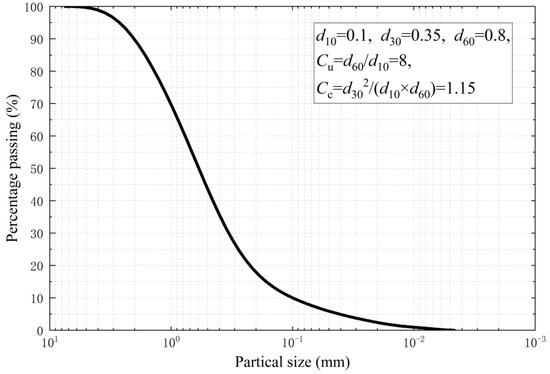
Figure 3.
Grain size distribution of natural saline soil.

Table 2.
Physical properties of the natural saline soil.

Table 3.
Soluble salt contents of natural saline soil.
2.2. Specimen Preparation
The air-dried collected soil specimens were passed through a 2 mm sieve. The crushed soil specimens were immersed in deionized water for desalinization and fully stirred to release the ions before 24 h of sedimentation. The supernatant is then replaced with fresh deionized water, and the procedure is repeated 15–20 times until the soluble salt contents are determined to be lower than 0.1%. The desalted soil was subsequently dried in an oven at 105 °C for 24 h. The salt solution used in this test to prepare the reshaped saline soil was NaHCO3 solution. Following desalination, the soil specimens were mixed with NaHCO3 solutions of different concentrations in a calculated dosage and controlled by the optimum water content (18.0%). Considering that the salt content of the remolded soil specimens should lie within the soil salt content range of the sampling points, five soil specimen groups with different salt contents were established: 0 (non-saline state), 0.6%, 1.1%, 1.6%, and 2.1%. All soil specimens were sealed at room temperature (20 °C) for 24 h to ensure homogeneity and water retention. The standard test methods for the laboratory compaction characteristics of soil were performed following [35], based on the maximum dry density (1.68 g/cm3). Triaxial soil specimens (50 mm diameter, 100 mm height) and direct shear soil specimens (61.8 mm diameter, 20 mm height) were then made at a compaction degree of 90%. The saturations of all the soil specimens were about to 86%.
2.3. Test Methods
The test program consists of the freeze-thaw cycle (FTC test), scanning electron microscopy (SEM), static triaxial compression, and direct shear tests. In the laboratory, a simulation platform for freeze-thaw testing of geotechnical was used in the freeze-thaw cycle tests. The triaxial compression and direct shear test specimens were sealed by membranes and placed into the freeze-thaw cycle apparatuses chamber, respectively. According to the climate conditions in the Duerbert area and the variation characteristics of near-surface ground temperature, the temperature during FTC is between −20 °C and 20 °C [5]. Previous studies have shown that the freezing temperature of saline soil is lower than 0 °C, and it needs to be kept for about 12 h to reach the thermal equilibrium at −20 °C [29]. Therefore, within each FTC, the chamber was maintained at a constant temperature (20 °C or −20 °C) for 24 h to allow the soil sufficient time to reach thermal equilibrium. Figure 4 shows the change in specimen temperature with time during FTC. The specimens did not have any water supply behavior during the FTC process. The specimens were set to 1, 5, 10, 15, 30, and 60 to simulate a different number of FTCs. Following the completion of a freeze-thaw cycle group, it should be corrected the varying amounts of bulging induced by volumetric changes to adapt to the size of the test apparatus.
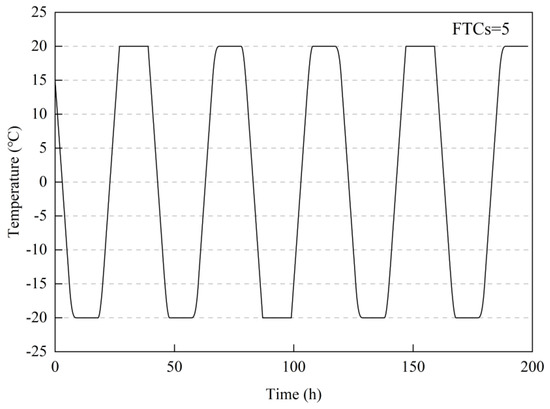
Figure 4.
Variation of the specimen temperature with time during FTC.
In order to systematically research the freeze-thaw cycle effect in the mechanical behavior of carbonate saline soil, a series of unconsolidated-undrained triaxial compression and quick, direct shear tests were performed [36,37]. As the freeze-thaw cycles often occur in surface parts of the ground, considering the instantaneity of driving load, shallow soil generally lacks time to develop drainage consolidation in the thawing stage, and thus the unconsolidated-undrained test is suitable for investigating the behavior of thawing soil subjected to rapid and repeated load at the shallow surface. To simulate these conditions at shallow soil depths, three confining pressures, 100, 200, and 300 kPa, were selected for the triaxial compression and direct shear tests. The triaxial tests were performed by applying the MTS-810 low-temperature triaxial apparatus. All triaxial tests were carried out at a constant hydrostatic pressure rate of 500 kPa/min and a constant axial displacement rate of 0.6 mm/min. The computer was employed to record the real-time axial force applied to the soil column at different axial strains. Then, the peak undrained shear strength of the carbonate saline soil was evaluated using a ZJ strain-controlled direct shear apparatus. The shear rate was maintained constant at 0.8 mm/min, and the test was terminated when the shear displacement reached 4 mm. The corresponding shear stress was determined as the shear strength of the soil specimens.
In order to observe the microstructure of the carbonate saline soil that was subjected to before, and after the freeze-thaw cycles, SEM tests were also conducted on a Quanta Training-X50 scanning electron microscope on soil samples with 2.1% salt contents that had been exposed to 0, 30 cycles. An 8 mm3 cube was cut from the center of each specimen, and the surface of the specimen cut surface was required to be smooth and uniform. The images were acquired at the four magnifications of 500, 1000, 5000, and 10,000 and processed with Image Pro-Plus. Discussing the details of these pictures in the following sections results in finding the microstructural changes in the soil and comparing the shape and connectivity of the soil pores during the cycles.
3. Results
3.1. Results of Qualitative Analysis of the Microstructure
Figure 5 presents the SEM images of the unfrozen carbonate saline soil specimens under different magnifications. The images at 500× and 1000× magnification show aggregations of the soil particles of the carbonate saline soil; a fine clay particle is the basic unit (Figure 5a, b). The SEM image with 500× magnification shows soil particles with small pores and good connectivity, indicating that sodium bicarbonate has no significant effect on the soil structure and density.
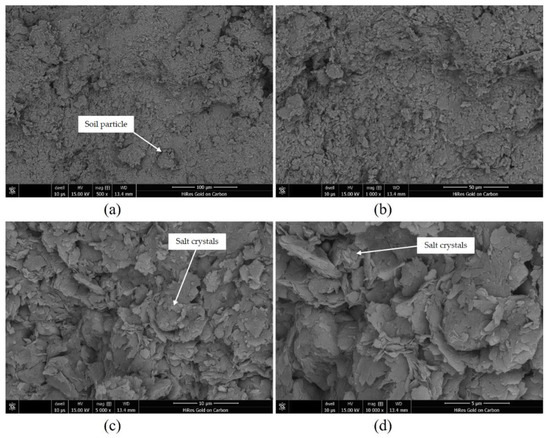
Figure 5.
SEM images of the unfrozen specimens (S = 2.1%) with different magnifications. Notes: (a) 500× image; (b) 1000× image; (c) 5000× image; and (d) 10,000× image.
The cumulative effect of frost heaving and salt expansion resulting from long-term freeze-thaw cycling gradually destroys the aggregation of coarse and fine particles, increasing the distance between the particles and causing particle dislocation (Figure 6a,b). Compared with the unfrozen samples, the change in the carbonate saline soil fabric is significant after 30 FTCs, and the soil structure changes from tight to loose aggregation. During the FTC, the salt ions in the soil move with the pore water, intensifying the effect of the sodium bicarbonate crystals on the internal soil structure. This action destroys soil aggregates. A comparison of the particle aggregates before and after the FTC shows that the growth of ice and salt crystals causes aggregate decomposition (Figure 5b and Figure 6b). Furthermore, the number of pores between the particles increases, while the pores and small cracks penetrating the soil form external macroscopic tensile cracks. Thus, structural deformation is characterized by a change in the micro-pores, potentially reducing soil strength.
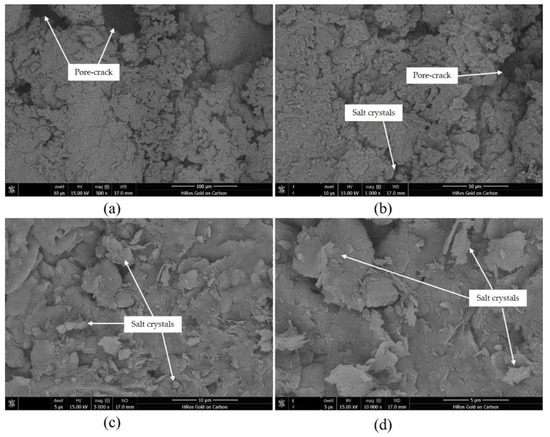
Figure 6.
SEM images of specimens (S = 2.1%) subjected to freeze-thaw cycles (FTCs = 30) with different magnifications. Notes: (a) 500× image; (b) 1000× image; (c) 5000× image; and (d) 10,000× image.
3.2. Stress-Strain Behavior
Triaxial compression tests are typically used to obtain the stress-strain curve and evaluate soil deformation and strength. The axial strain () is plotted on the abscissa, and the principal stress () is depicted on the ordinate axis. The peak value of () on the curve is considered the failure point. In the absence of a peak value, the value of () at 15% of the maximum is used as the failure point. Figure 7 and Figure 8 show the stress-strain behavior for varying confining pressures, FTC numbers, and salt contents, respectively. The stress increases nonlinearly with an increase in the axial strain regardless of the salt content and the number of FTCs. It is worth noting that the stress-strain behavior differs for different salt contents of the specimens. The stress-strain behavior of specimens with a 0.6% salt content after the FTCs exhibits more pronounced strain-softening behavior under different confining pressures. In the initial stage, the stress increases with the strain until the peak is reached; subsequently, the stress decreases with the increasing strain and then stabilizes. The specimens exhibit strain-hardening behavior as the salt content increases to 2.1%. The stress initially increases with the strain, and then the rate of increase slows down. As the salinity content increases from 0.6% to 2.1%, the deviatoric stress increases under a specific axial strain for a given normal stress. The reason is that as the salinity content increases, the amount of dissolved salt remains constant at a certain water content. The insolubility results in the formation of salt crystals, and the salt consolidates. However, the specimen strength generally decreases as the number of FTCs increases under the same confining pressure, regardless of the salt content. The results confirm that the salt content and FTC numbers affect the soil’s microstructure and its stress-strain characteristics. This reason is that the number of FTCs and the salt content change the position, configuration, and stress history of the soil particles, dispersing them. Thus, the soil volume increases, and the damage strength of specimens increases.
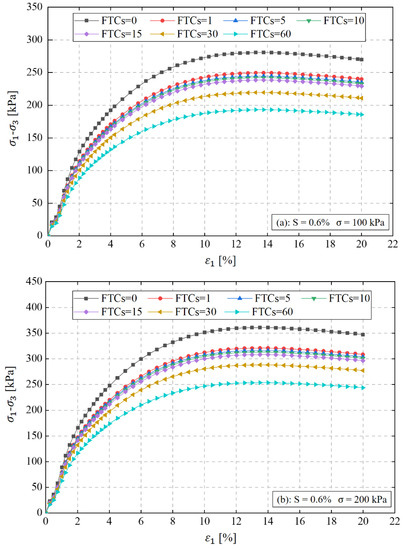
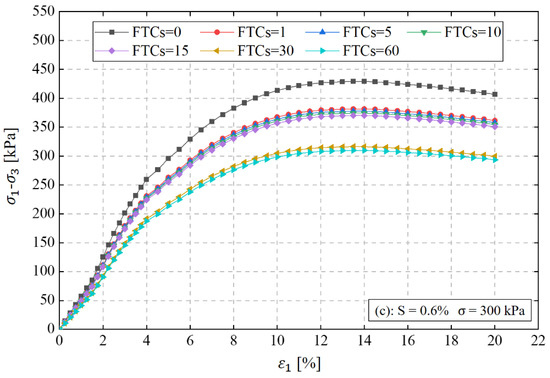
Figure 7.
Stress-strain behavior of the specimens (S = 0.6%) at an increasing number of FTCs varying confining pressures. Notes: (a) = 100 kPa; (b) = 200 kPa; (c) = 300 kPa.
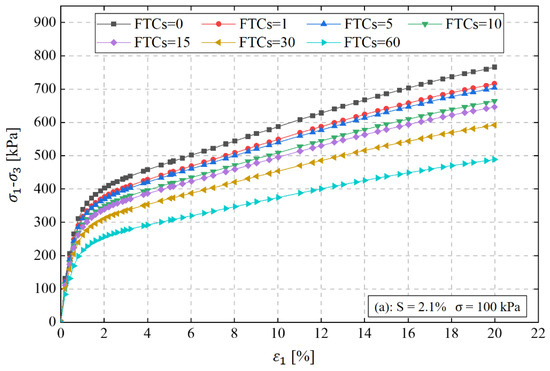
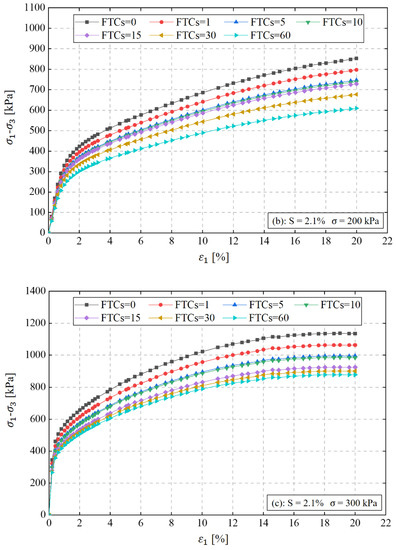
Figure 8.
Stress-strain behavior of the specimens (S = 2.1%) at an increasing number of FTCs varying confining pressures. Notes: (a) = 100 kPa; (b) = 200 kPa; (c) = 300 kPa.
3.3. Shear Strength
Direct shear testing provides undrained shear strength () of the carbonate saline soil for different FTC numbers and salt contents. The shear strength of the specimens increases linearly with the confining pressure for all numbers of FTCs, suggesting no internal crushing of the soil occurred under low confining pressure. An increase in confining pressure compacts the soil and increases the interlocking force between particles and the frictional force since the normal stress on the failure surface of the specimen increases, thereby increasing the peak shear strength. Figure 9 shows the shear strength versus the number of FTCs (x = 1, 2, 3 …, n) at different NaHCO3 contents and different confining pressure. The equations of the trendlines and the coefficient of determination (R2) value are listed in Table 4, Table 5 and Table 6. Specimen of each salt content, the decreases significantly within 10 FTCs, and the effect is more pronounced after the fifth cycle (the average reduction in the groups is 43.47 kPa to 50.83 kPa). The rate of decrease is moderate from 10 to 30 cycles (19.98 kPa to 26.26 kPa) and higher after 60 cycles (21.27 kPa to 38.06 kPa). Additionally, the shear strength of the specimens continuously decreases as the NaHCO3 content increases under the same FTC conditions. The shear strength of the saline soil is not only affected by the freeze-thaw cycle but is also reduced by the salt content increase. At any stage of the FTCs, the salt content has an influence, resulting in a decline in the shear strength. Frost heaving and salt expansion resulting from freezing and thawing damage the compacted soil structure. The soil particles are dislocated and squeezed, the soil density is reduced, and the porosity and permeability are enhanced. These factors reduce the shear strength of the specimens.
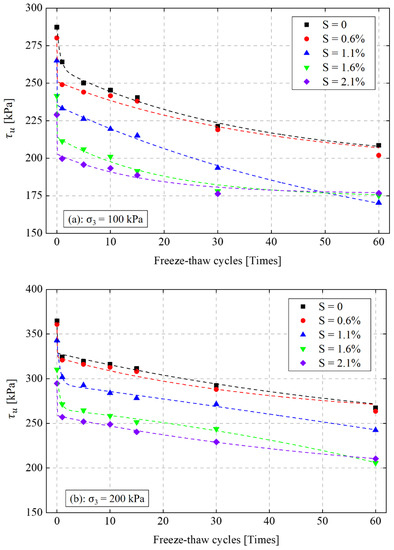
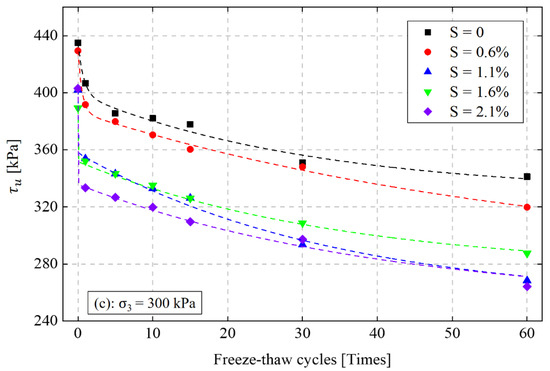
Figure 9.
Shear strength versus FTCs for the specimens with different salt contents.

Table 4.
Equation of trendlines of shear strength versus the number of FTCs at a confining pressure of 100 kPa.

Table 5.
Equation of trendlines of shear strength versus the number of FTCs at a confining pressure of 200 kPa.

Table 6.
Equation of trendlines of shear strength versus the number of FTCs at a confining pressure of 300 kPa.
3.4. Shear Strength Parameter
Shear strength parameters are typically used in geotechnical engineering to calculate the foundation’s bearing capacity slope stability. The friction strength depends on the normal stress on the shear surface and the internal friction angle of the soil. In addition, the cohesion of fine-grained soil depends on various forces between the particles, such as the Coulomb force, Van der Waals force, and cementing force. The classic Coulomb criterion is often expressed as follows:
where denotes the shear stress on the failure surface of the soil (i.e., the shear strength of the soil) (kPa); denotes the normal stress on the shear sliding surface, (kPa); cu denotes the cohesion of the soil, (kPa); denotes the internal friction angle of soil (°). The combination of and is denoted as the total stress and shear strength parameter of the soil.
Figure 10 plots the cohesion () and internal friction angle () of the specimens following the FTC. The equations of the trendlines and the coefficient of determination (R2) value are listed in Table 7 and Table 8. The results reveal a constant decrease in cohesion during the 60 FTCs (Figure 10a). The cohesion of the non-saline specimens and the four specimens with different salt contents decreases by 23 kPa, 23.5 kPa, 30 kPa, 23 kPa, and 24.5 kPa during the first 10 FTCs and by 11 kPa, 11 kPa, 13 kPa, 13 kPa, and 12 kPa during the following 20 cycles, respectively. The exhibits different change rates during the subsequent FTCs (up to 60 cycles). However, the of the specimens shows the same trends as the salt content increases during all FTCs. As the salt content increases from 0 to 2.1%, the of the unfrozen specimens decreases by 9.5 kPa, demonstrating the correlation between cohesion and salinity. In general, as the salt content increase, the cohesion of the soil specimens decreases linearly with the number of FTCs for all salt contents.
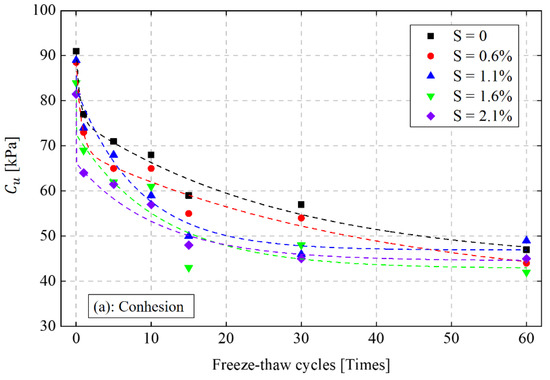
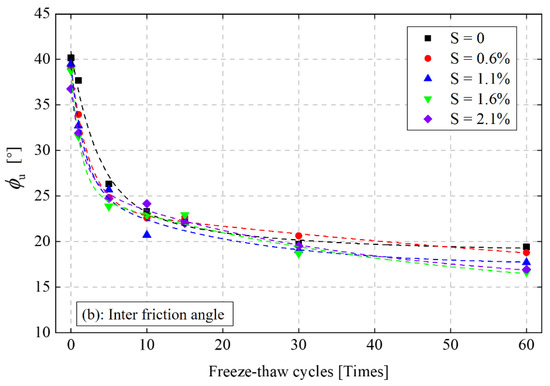
Figure 10.
Cohesion and inter-friction angle versus FTCs for the specimens with different salt contents.

Table 7.
Equation of trendlines of cohesion versus FTCs at different salt contents.

Table 8.
Equation of trendlines of inter friction angle versus FTCs at different salt contents.
The relationship between the and the number of FTCs is consistent with the trend (Figure 10b). The initial 15 FTCs exert a significant influence on the , resulting in a large decrease. The of the specimens with different salt, contents range from 39.5° to 19.5°. The rate of decrease in slows down at 30 FTCs and subsequently stabilizes after 60 FTCs. As the salt content increases from 0.6% to 2.1%, the changes slightly from 19.42° to 16.65°. A detailed discussion of the trend and the corresponding mechanism is provided in the following section.
4. Discussions
4.1. Impact of the Number of FTC on Soil Microstructure
SEM is an effective method to investigate the internal microstructure of saline soil specimens. The microstructure of the unfrozen carbonate saline soil specimens (S = 2.1%) exhibits good compactness. When the sodium bicarbonate in the soil reaches saturation, the precipitated crystals (Na2CO3) have a negligible impact on crack evolution. Figure 5 demonstrates that the pores between the soil particles have not increased significantly, suggesting that sodium bicarbonate does not significantly change the soil structure. Under freeze-thaw cycling, sodium bicarbonate is precipitated from the pore solution to form salt crystals. Further increases in the salt content enhance the crystallization rate. As the sodium bicarbonate crystals expand, the crystallization stress destroys the pore structure; thus, the NaHCO3 content exceeds the threshold, causing soil deformation. During thawing and ice melting, the salt crystals are re-dissolved into the pore solution while the expanded pores are retained. Moreover, increasing the number of FTCs facilitates the connection of the larger pores into a linear crack, significantly decreasing the soil’s strength (Figure 9).
Analysis of the microscopic pores in the carbonate saline soil reveals clotting of the particles of the unfrozen soil specimens, while the soil particles are mostly face-to-face aggregates with a coagulated structure. Under frequent FTCs, the cumulative effects of frost heaving and salt expansion cause the breakage of many soil aggregates, and the connection between the particles is transformed into an edge-to-edge structure or point-to-point contact, increasing the number of pores between particles [16]. During the FTC, the ice and salt crystals change the soil pores by filling or squeezing them, altering the configuration of the soil particles and the soil structure. Moreover, during the FTC, the crystalline stress generated by the ice and salt crystals during crystallization and dissolution is the primary cause of internal damage to the saline soil.
4.2. Impact of FTCs on Shear Strength Parameters of Saline Soils
Changes in the and are the reason for a decrease in the carbonate saline soil shear strength under FTCs. An increase in the number of FTCs can reduce the and of the specimens (Figure 10). The damage type is a shear failure, and the reduction in the shear strength occurs due to the combination, configuration, and interaction force between particles rather than the particle strength. The crystal phase transition process of water-salt to ice and salt crystals caused by FTCs consumes the soil’s potential energy and alters the combination, configuration, and interaction force between particles. These changes are irreversible and significantly affect the soil’s mechanical characteristics. Substantial changes in the soil structure occur during FTCs due to the action of salt in carbonate saline soils. The pore water freezes, and the salt crystallizes out of the pore solution. The expansion of salt crystals destroys the soil structure. Frost heaving and salt crystallization cause an increase in pore volume. The ice melts, and some of the salt redissolves into the pore solution during thawing. However, the expanded pores remain in situ, and additional FTCs can connect the larger pores, forming linear fissures. The SEM images (Figure 5 and Figure 6) reveal that the freeze-thaw damage increases the number of pores between particles, dislocating the particles, changing the location of mineral components, and reducing soil compactness. Thus, it is inferred that the structure of unfrozen soil is integrated, and the first five cycles destroy the structural integrity, accelerating the formation of fissures. The decreases due to an increase in the distance between particles during the first 15 FTCs, and the rate of decrease is low from 15 to 30 cycles. At 60 FTCs, the equilibrium state of the soil has been disturbed, and new fissures are generated. Thus, it is imperative to reduce cohesion. Figure 10b shows the effect of the number of FTCs on the . Similar to the effect on , decreases significantly during the first 10 FTCs. As the number of FTCs increases to 60, the of specimens with a low salt content (S = 0.6%) remains virtually unchanged or decreases slightly, but that of the specimens with a high salt content (S = 1.6% and 2.1%) decreases slightly. The microstructure of the specimens with high salt contents (S = 2.1%) after 30 FTCs shows that the effect of the salt crystals promotes the formation of many cracks, confirming the previous results. According to the principle of molar mass, as the salt content increases, the content of Na+ in the solution increases, resulting in a thicker water layer of the electric double layer, less suction, and better lubrication [15]; therefore, the is smaller. As the repeated FTCs, the Na2CO3 crystals in the specimens precipitate from the solution during the cooling process. The volume of the specimens expands, weakening the binding force between particle bonds. In addition, since the quick shear test was carried out at a room temperature of 20 °C, many crystals remained in the soil due to the low solubility of the salt solution. The cementation force between particles decreases, and the number of cracks increases from 30 to 60 FTCs; thus the decreases. The results indicate that the FTC affects the by affecting the , and the salt content influences the by affecting the . The degree of influence on the shear strength parameters differs for the FTCs and salt content, but both ultimately affect the shear strength.
4.3. Impact of Salt Content on Shear Strength Parameters of Saline Soils
The effect of the NaHCO3 content on the and is analyzed to investigate the influence mechanism on the strength of the carbonated saline soil. Note that we observed a correlation between cohesion and salt content. The of the unfrozen soil with different salinities decreases as the number of FTCs increases (Figure 10a). Specimens with salt contents of 0.6% to 2.1% exhibit reductions of 2.5 kPa, 2 kPa, 7 kPa, and 9.5 kPa compared to the non-saline group, respectively. The largest reduction occurs at 15 FTCs, i.e., reductions of 4 kPa, 9 kPa, 16 kPa, and 11 kPa, respectively. The change in the strength parameter is attributed to the soil-water-salt interaction.
Ions dissociated from salt interact with particles during the water-salt movement, changing the thickness of the water film adhering to the soil particles, thereby indirectly influencing the pore structure and the clay particle configuration [12]. The internal structure of clay is indirectly affected by salt, and a change in the chemical properties of the pore solution significantly affects the shear strength [38]. Han et al. (2018) found that mirabilite (Na2SO4·10H2O) crystals in the soil sample precipitated from the Na2SO4 solution during freezing in the FTCs, and the pore volume increased three times, weakening the binding force between the soil aggregates and significantly affecting the strength parameters of clay [30]. However, Na2CO3 crystals precipitated from the NaHCO3 solution during freezing, and the pore volume expansion was smaller than that of Na2SO4. Therefore, crack formation was more likely when Na2SO4 was present than when NaHCO3 existed. This result indicates that sulfate has a larger effect on the shear strength of soils than bicarbonate. In addition, the salt solution in silty clay is unsaturated, and the presence of salt reduces the initial freezing temperature of the specimen. Since the initial freezing temperature of saline soil is lower than that of the salt solution, the amount of unfrozen water increases with the solute concentration while the freezing temperature decreases gradually [39,40]. In this study, the relationship between the solubility of the NaHCO3 salt solution and temperature is expressed as follows [41]:
where C is the solubility of the salt solution, g/100 mL; T is the temperature, (°C). The solubility of NaHCO3 at 20 °C is 9.58 g/100 mL, and the mass content per solution is 9.58 g. The water content of the specimen is 18%, and the mass of dissolved salts in silty clay is 1.724 g. Thus, when the salt content increases from 0 to 2.1%, the salts in the soil dissolve completely, and the hydration ions and molecules react chemically due to the electrostatic force, forming a hydrated membrane adsorbed on the particle surface. The electrostatic repulsion between particles is strengthened by the overlapping hydrated film. A thick hydrated film limits the attraction forces between particles and reduces cementation and the pore volume. As a result, the cohesion decreases due to friction, interlocking abilities, and smaller attraction forces between particles.
C = 0.156·T + 6.48,
Meanwhile, it can be inferred that the soil-water (solution) interaction also changes the . The occlusal and sliding friction between particles can be used to determine the change in the sliding friction angle. As already mentioned, in the water-salt phase transition of the pore solution, the adsorption hydration film formed during salt crystallization dissolution covers the particle surfaces, and thicker hydration films provide more lubrication; thus the decreases. Subsequently, the combination of ions in pore water changes through water-rock reactions and ion exchange, altering the soil liquid phase. The stability of the particles is sensitive to the soil liquid phase affecting the sliding friction between particles. The reduction in the sliding friction angle can be attributed to a change in the occlusion state between particles and a decrease in the occlusal friction and sliding friction. However, the literature indicates contradicting information on the effect of the salt content on the internal friction angle. These differences may be a result of the intricate crystallization and dissolution processes for different types of saline soils affecting the physical and chemical properties of the soil. The basic physical soil properties, such as the water content, dry density, grain composition, and type of soil minerals, also result in different changes in the and of the soil.
5. Conclusions
Experimental and micro-analyses of carbonate saline soil were carried out to understand the effects of FTCs and salinity on the soil’s geotechnical behavior. The result can be used to evaluate the capacity of foundations and slope stability in similar saline soils. The following key conclusions were obtained:
The FTC’s caused the decomposition of soil particle aggregates and an increase in the number of pores between particles due to frequent frost heaving and salt expansion of carbonate saline soil. This action weakened the particle cementation force and destroyed the soil structure and the shear strength of the carbonate saline soil.
With the increase in the number of FTCs, the deformation characteristics of silty clay exhibited strain-softening when the salt contact was relatively small (0.6%), and the stress-strain curve type showed strain-hardening behavior when the salt content increased to 2.1%. The carbonate saline soil with different salt contents was restrained by an increase in the confining pressure, and the failure stress exhibited a linearly increasing trend with the confining pressure.
As the confining pressure increased, the shear strength of the carbonate saline soils with different sodium bicarbonate contents increased linearly. The shear strength of the soil decreased significantly as the number of FTCs increased, and this effect was more pronounced during the initial 15 cycles. In general, the higher the salt contents (0.6–2.1%) of the soil specimens, the greater the decrease in the shear strength of soils.
The cohesion and internal friction angle of the carbonate saline soil decreased significantly with an increase in the number of FTCs (0–60 cycles). Ice crystals and salt crystals formed in the carbonate saline soil, reducing the inter-particle bonds and contact area and increasing inter-aggregate porosity. As a result, an increase in the salt content (0.6–2.1%) was associated with a gradual decrease in the cohesion and internal friction angle.
Author Contributions
Conceptualization, K.Q., L.D. and W.Y.; Funding acquisition, L.D.; Investigation, S.H. and K.G.; Methodology, K.Q., L.D. and W.Y.; Project administration, L.D.; Supervision, W.Y.; Writing—original draft, K.Q. and K.C.; Writing—review & editing, K.Q., K.C., S.H. and K.G. All authors have read and agreed to the published version of the manuscript.
Funding
This research is financially supported by the National Natural Science Foundation of China (41071049), the Funds of State Key Laboratory of Frozen Soil Engineering (SKLFSE201919, SKLFSE201802).
Institutional Review Board Statement
Not applicable.
Informed Consent Statement
Not applicable.
Data Availability Statement
Not applicable.
Acknowledgments
The authors thank you for the experimental assistance provided by the State Key Laboratory of Frozen Soil Engineering. The authors would also like to acknowledge the editor/reviewers for their critical reviews and constructive remarks, which helped to improve the quality of the manuscript.
Conflicts of Interest
The authors declare no conflict of interest.
References
- Jin, H.; Ma, Q. Impacts of Permafrost Degradation on Carbon Stocks and Emissions under a Warming Climate: A Review. Atmosphere 2021, 12, 1425. [Google Scholar] [CrossRef]
- Revich, B.A.; Eliseev, D.O.; Shaposhnikov, D.A. Risks for Public Health and Social Infrastructure in Russian Arctic under Climate Change and Permafrost Degradation. Atmosphere 2022, 13, 532. [Google Scholar] [CrossRef]
- Chen, L.; Lai, Y.M.; Fortier, D.; Harris, S.A. Impacts of Snow Cover on the Pattern and Strength of Mobile Air Flow in Air Convection Embankment in Sub-Arctic Regions. Renew. Energy 2022, 199, 1033–1046. [Google Scholar] [CrossRef]
- Chen, L.; Voss, C.I.; Fortier, D.; McKenzie, J.M. Surface energy balance of sub-Arctic roads and highways in permafrost regions. Permafr. Periglac. Process. 2021, 32, 681–701. [Google Scholar] [CrossRef]
- Zhang, D.F.; Wang, S.J. Mechanism of freeze-thaw action in the process of soil salinization in northeast China. Environ. Geol. 2001, 41, 96–100. [Google Scholar] [CrossRef]
- Yu, T.W.; Wang, Q.; Zhang, X.D.; Zhou, X.; Wang, G.; Niu, C.C. Experimental study on grain size and soluble salt of saline soil in western Jilin Province, China. Sci. Cold Arid Reg. 2015, 7, 573–578. [Google Scholar]
- Fatani, M.N.; Khan, A.M. Foundations on Salt Bearing Soils of Jizan. In Proceedings of the 3rd Conference of the International Conference on Case Histories in Geotechnical Engineering, St. Louis, MI, USA, 1–4 June 1993; pp. 79–83. [Google Scholar]
- Qi, J.; Vermeer, P.A.; Cheng, G. A review of the influence of freeze-thaw cycles on soil geotechnical properties. Permafr. Periglac. Process. 2006, 17, 245–252. [Google Scholar] [CrossRef]
- Qi, J.; Ma, W.; Song, C. Influence of freeze–thaw on engineering properties of a silty soil. Cold Reg. Sci. Technol. 2008, 53, 397–404. [Google Scholar] [CrossRef]
- You, Z.; Lai, Y.; Zhang, M.; Liu, E. Quantitative analysis for the effect of microstructure on the mechanical strength of frozen silty clay with different contents of sodium sulfate. Environ. Earth Sci. 2017, 76, 11. [Google Scholar] [CrossRef]
- Zhou, Z.; Ma, W.; Zhang, S.; Mu, Y.; Li, G. Effect of freeze-thaw cycles in mechanical behaviors of frozen loess. Cold Reg. Sci. Technol. 2018, 146, 9–18. [Google Scholar] [CrossRef]
- Koniorczyk, M. Salt transport and crystallization in nonisothermal, partially saturated porous materials considering ions in-teraction model. Int. J. Heat Mass Transf. 2012, 55, 665–679. [Google Scholar] [CrossRef]
- Chen, W.T.; Wang, Y.; Wang, M.N.; Li, Z.; Wang, Y.S. Testing study on influence of freezing and thawing circulation on saline soil’s cohesion. Rock Soil Mech. 2007, 28, 2343–2347. (In Chinese) [Google Scholar]
- Sinitsyn, A.O.; Loset, S. Equivalent cohesion of frozen saline sandy loams at temperatures close to their freezing point. Soil Mech. Found. Eng. 2010, 47, 68–73. [Google Scholar] [CrossRef]
- Lai, Y.; Wu, D.; Zhang, M. Crystallization deformation of a saline soil during freezing and thawing processes. Appl. Therm. Eng. 2017, 120, 463–473. [Google Scholar] [CrossRef]
- Liu, J.; Chang, D.; Yu, Q. Influence of freeze-thaw cycles on mechanical properties of a silty sand. Eng. Geol. 2016, 210, 23–32. [Google Scholar] [CrossRef]
- de Carteret, R.; Buzzi, O.; Fityus, S.; Liu, X. Effect of Naturally Occurring Salts on Tensile and Shear Strength of Sealed Granular Road Pavements. J. Mater. Civ. Eng. 2014, 26, 04014010. [Google Scholar] [CrossRef]
- Li, M.; Chai, S.; Du, H.; Wang, C. Effect of chlorine salt on the physical and mechanical properties of inshore saline soil treated with lime. Soils Found. 2016, 56, 327–335. [Google Scholar] [CrossRef]
- Zhang, F.; Wang, G.; Kamai, T.; Chen, W.; Zhang, D.; Yang, J. Undrained shear behavior of loess saturated with different concentrations of sodium chloride solution. Eng. Geol. 2013, 155, 69–79. [Google Scholar] [CrossRef]
- Anatoli, B. Frozen saline soils of the Arctic coast: Their distribution and engineering properties. In Proceedings of the Eighth International Conference on Permafrost, Zurich, Switzerland, 21–25 July 2003; Phillips, S.M., Springman, Arenson, L.U., Eds.; pp. 95–100. [Google Scholar]
- Yang, C.S.; He, P.; Cheng, G.D.; Zhao, S.P.; Deng, Y.S. Study of stress strain relationships and strength characteristics of sat-urated saline frozen silty clay. Rock Soil Mech. 2008, 29, 3282–3286. (In Chinese) [Google Scholar]
- Liu, J.; Zhang, L. The Microstructure Characters of Saline Soil in Qarhan Salt Lake Area and Its Behaviors of Mechanics and Compressive Strength. Arab. J. Sci. Eng. 2014, 39, 8649–8658. [Google Scholar] [CrossRef]
- Pubudu, J.; Buddhima, I.; Ana, H. Influence of Salinity-Based Osmotic Suction on the Shear Strength of a Compacted Clay. Int. J. Geomech. 2021, 21, 04021041. [Google Scholar]
- Elkady, T.Y.; Al-Mahbashi, A.M. Effect of solute concentration on the volume change and shear strength of compacted natural expansive clay. Environ. Earth Sci. 2017, 76, 483. [Google Scholar] [CrossRef]
- Zhang, Y.; Yang, Z.; Liu, J.; Fang, J. Impact of cooling on shear strength of high salinity soils. Cold Reg. Sci. Technol. 2017, 141, 122–130. [Google Scholar] [CrossRef]
- Zhang, W.; Ma, J.; Tang, L. Experimental study on shear strength characteristics of sulfate saline soil in Ningxia region under long-term freeze-thaw cycles. Cold Reg. Sci. Technol. 2019, 160, 48–57. [Google Scholar] [CrossRef]
- Xu, X.; Wang, Y.; Bai, R.; Zhang, H.; Hu, K. Effects of sodium sulfate content on mechanical behavior of frozen silty sand considering concentration of saline solution. Results Phys. 2016, 6, 1000–1007. [Google Scholar] [CrossRef]
- Liao, M.; Lai, Y.; Wang, C. A strength criterion for frozen sodium sulfate saline soil. Can. Geotech. J. 2016, 53, 1176–1185. [Google Scholar] [CrossRef]
- Zhang, Y.; Yang, Z.J.; Liu, J.; Fang, J. Freeze-Thaw Cycle Impact on Volumetric and Low-Temperature Shear Behavior of High-Salinity Soils. J. Cold Reg. Eng. 2019, 33, 06018002. [Google Scholar] [CrossRef]
- Han, Y.; Wang, Q.; Wang, N.; Wang, J.; Zhang, X.; Cheng, S.; Kong, Y. Effect of freeze-thaw cycles on shear strength of saline soil. Cold Reg. Sci. Technol. 2018, 154, 42–53. [Google Scholar] [CrossRef]
- Cheng, S.K.; Wang, Q.; Wang, N.; Wang, J.Q.; Han, Y. Study on Mechanical Properties of Saline Soil and Evaluation of In-fluencing Factors. J. Cold Reg. Eng. 2021, 35, 04021002. [Google Scholar] [CrossRef]
- Peng, W.; Wang, Q.; Liu, Y.F.; Sun, X.H.; Chen, Y.T.; Han, M.X. The Influence of Freeze-Thaw Cycles on the Mechanical Properties and Parameters of the Duncan-Chang Constitutive Model of Remolded Saline Soil in Nong’an County, Jilin Province, Northeastern China. Appl. Sci. 2019, 9, 4941. [Google Scholar] [CrossRef]
- Chen, K.; Huang, S.; Liu, Y.; Ding, L. Improving Carbonate Saline Soil in a Seasonally Frozen Region Using Lime and Fly Ash. Geofluids 2022, 2022, 7472284. [Google Scholar] [CrossRef]
- D2487-17e1; Standard Practice for Classification of Soils for Engineering Purposes. American Society for Testing and Materials ASTM: West Conshohocken, PA, USA, 2017.
- D698-12e2; Standard Test Methods for Laboratory Compaction Characteristics of Soil Using Standard Effort. American Society for Testing and Materials ASTM: West Conshohocken, PA, USA, 2012.
- D2850-15; Standard Test Method for Unconsolidated-Undrained Triaxial Compression Test on Cohesive Soils. American Society for Testing and Materials ASTM: West Conshohocken, PA, USA, 2015.
- D6528-17; Standard Test Method for Consolidated Undrained Direct Simple Shear Testing of Fine Grain Soils. American Society for Testing and Materials ASTM: West Conshohocken, PA, USA, 2017.
- Moore, R. The chemical and mineralogical controls upon the residual strength of pure and natural clays. Geotechnique 1991, 41, 35–47. [Google Scholar] [CrossRef]
- Wan, X.; Lai, Y.; Wang, C. Experimental Study on the Freezing Temperatures of Saline Silty Soils. Permafr. Periglac. Process. 2015, 26, 175–187. [Google Scholar] [CrossRef]
- Xiao, Z.; Lai, Y.; Zhang, M. Study on the freezing temperature of saline soil. Acta Geotech. 2017, 13, 195–205. [Google Scholar] [CrossRef]
- Pang, Q.L.; Xie, Z.Y.; Wang, S.X.; Mei, S.Y.; Li, Z.S. Study on crystallization thermodynamics of sodium bicarbonate. Soda Ind. 2018, 4, 4. (In Chinese) [Google Scholar]
Publisher’s Note: MDPI stays neutral with regard to jurisdictional claims in published maps and institutional affiliations. |
© 2022 by the authors. Licensee MDPI, Basel, Switzerland. This article is an open access article distributed under the terms and conditions of the Creative Commons Attribution (CC BY) license (https://creativecommons.org/licenses/by/4.0/).