Article

Contribution of Airplane Engine Emissions on the Local Air Quality around Stuttgart Airport during and after COVID-19 Lockdown Measures

Institute of Combustion and Power Plant Technology (IFK), Department of Flue Gas Cleaning and Air Quality Control, University of Stuttgart, 70569 Stuttgart, Germany
*
Author to whom correspondence should be addressed.
Atmosphere 2022, 13(12), 2062; https://doi.org/10.3390/atmos13122062
Submission received: 13 November 2022 / Revised: 24 November 2022 / Accepted: 6 December 2022 / Published: 8 December 2022
(This article belongs to the Special Issue Feature Papers in Air Quality)

Abstract

:
Air quality investigations at airports have shown that aircrafts cause a significant increase in air pollution at and around the vicinity of the airport, which can cause adverse effects on human health. The objective of this research was to investigate the aircraft-sourced pollutant levels at the Stuttgart airport and in the surrounding areas during and after COVID-19 lockdown measures. Three phases of stationary measurements of ultrafine particles (UFP), particulate matter (PM), black carbon (BC), CO2, O3, NO, and NO2 were made at various points on the east and west sides of the airport in the extension of the airport runway. In first phase of measurement, the airport was closed for construction, and no air traffic took place. In the second phase, the airport was reopened with limited operation due to a lockdown period at the beginning of the COVID-19 pandemic. Finally, in the third phase, measurements were performed during the peak summer holiday travel season to measure the air quality during maximum air traffic, after the end of the first lockdown period. While there were fewer notable changes in the BC concentrations, coarse PM fractions, and gases across the three phases, there were significant increases in the UFP concentrations from aircraft emissions. Throughout the three phases, the peak particle concentration decreased from between 27 and 86 nm in phase 1. to between 27 and 35 nm in phase 2, to finally 11 nm in phase 3 on all days in which the aircraft plumes were measured. During flight arrivals, definite increases in UFP particle number concentration (PNC) were observed, with the majority of the particles being in the 10 nm size class. These results were measured repeatedly on both sides of the airport in the direct prolongation of the runway and even at distances of up to 3 km away in nearby neighbouring communities. While the overall PM and UFP levels are affected by vehicular traffic, the freeway measurements showed particles from aircrafts and vehicles are distinguishable using the parameters PNC and Dp. The BC concentrations were rarely influenced by aircraft activity, while only some NO and NO2 peaks were measured depending on the consistency of the wind.

1. Introduction

Aviation is a modern luxury that has made the world a smaller place by affording many the ability to arrive at a destination quicker than ever before. In 2019, the number of scheduled passengers had risen 4.2% from the previous year to 4.54 billion [1]. This increase can be attributed to affordable ticket prices, prospering societies [2], customer rewards programs, and marketing campaigns depicting jet-setting as the norm [3] even though only up to 10% of the global population flies each year [4]. However, increasing amounts of research studies and public awareness have fuelled the discussion as to whether the freedom and convenience aviation provides can be negated by the challenges it causes. The contribution of air traffic to the entire ambient air pollution around airports is not negligible, which has been shown by previous airport emission studies around the world [5,6,7,8]. In addition to CO2, aircrafts discharge NOX, SOX, CO, soot, particulate matter (PM), and ultrafine particles (UFP) [9]. When released at higher altitudes, it has been reported that these emissions persist longer and have a greater global warming potential [10].
A second and equally important concern is the impact of PM and UFP emissions on human health. When PM10 and PM2.5 are inhaled, they can be deposited in the upper and deeper regions of the lungs, causing a variety of health effects ranging from inflammation, reduced lung function, worsening of prediagnosed respiratory diseases, and even premature mortality [11,12,13,14] depending on the degree and duration of exposure. Additionally, the extremely small size of UFPs allows them to penetrate the lungs, enter the blood stream, and translocate to other parts of the body [7,15,16].
The measurements of elevated UFP levels in several airports, which took place at Los Angeles International Airport [5,6], Amsterdam Airport Schiphol [7], and Düsseldorf International Airport [8], provide reason to hypothesize that aircraft movements at the Stuttgart airport would also have a significant impact on the concentration level of UFPs, as well as other air pollutants, at and within the vicinity of the airport. However, there are no current research studies available to verify this hypothesis. Since the measurement results cannot be directly applied from one city to another due to differences in airport operation, topography, and meteorological conditions, each location must be evaluated independently. Therefore, it is important to investigate the impact of airplane emissions on the local air quality around the Stuttgart airport.
The Stuttgart airport is the sixth largest airport in Germany and had over 12.7 million passengers in 2019, an increase of 10% compared to the number in 2018 [17]. The airport has one runway which extends in the southwest and northeast directions and is approximately 3300 m long. The direction of landings and departures varies depending on the wind direction which changes frequently due to a combination of topography and wind patterns in the Stuttgart region, whereas the average wind rose for the airport area shows a strong component of westerly and south-westerly as well as easterly wind directions [18]. The airport’s surroundings are composed of communities and agricultural areas. There have been no previous studies specifically measuring emissions at the Stuttgart airport. The State Institute for the Environment in Baden-Württemberg (LUBW) monitors the air pollution of NO, NO2, O3, PM10, and PM2.5 at the closest air-quality monitoring station 1.3 km south of the Stuttgart airport. Ultrafine particles are not monitored by this air-quality monitoring station.
The objectives of this research were to investigate the contribution of airplane engine emissions on the local air quality around Stuttgart airport, during and after the COVID-19 lockdown measures, to assess the horizontal and temporal distribution of aircraft pollutants around the airport, and to compare the particle size distributions of UFPs emitted from airplanes to those of nearby road traffic. The dataset reported in this manuscript will be useful to understand the pollutant characteristics near the Stuttgart airport area. It should also provide an insight to set certain measures to improve the air quality in the study area in order to avoid adverse health effects for the people living in the near vicinity.

2. Methodology

Stationary measurements were performed during three phases so different air quality profiles could be compared. The first phase was in mid-April 2020 when maintenance work combined with the first lockdown due to COVID-19 pandemic led to the airport being completely closed for several weeks. After reopening, a second phase of measurements was conducted in June 2020 while the air traffic was still reduced. Finally, the third phase was conducted from mid-August to mid-September 2020 when flights had increased due to the summer holiday season, even though it was still reduced in comparison to the season in previous years. The air pollutant levels from these phases were then evaluated to determine the degree of exposure at the airport fence and within the vicinity.

2.1. Measurement Phases

2.1.1. Phase 1—No Flight Operation

Baseline measurements were taken for one week in April 2020 when no flight operations were taking place at the Stuttgart Airport due to the airport being closed for construction on the runway [19]. Eight consecutive days of measurement took place which included seven days of campaign measurements and one day of quality assurance (QA) measurements. All measurements were made for several hours in the afternoon between 13:00 and 18:00 CEST and only occurred on the west side of the airport since there were easterly winds throughout phase 1. Because a fire took place 370 km north of Stuttgart [20] on days five to seven, causing unusually high PM and UFP concentrations, only the results from days one to four were of primary interest.
An overview of the measurement locations during all the measurement phases is shown in Figure 1. Stationary measurements were mainly conducted at two locations west of the Stuttgart airport. Point 1’s location was in a field 1.85 km from the start of the runway in the south-westerly direction, and point 2a’s location was near the airport fence 950 m away from the start of the runway, also in the south-westerly direction. Points 1 on the one side and 2a on the other side are separated by the B27 highway, but due to the COVID-19 pandemic and many people working from home, traffic in mid-April 2020 was lighter than normal and was not expected to have a considerable influence on the baseline measurements. In addition, parallel measurements with a UFP counter device at a second location were also performed.

2.1.2. Phase 2—Partial Flight Operation

Three days (days eight to ten) were measured during phase 2 in June 2020 when some air traffic occurred. Consecutive measurements were only possible on days nine and ten due to unsuitable weather conditions.
Point 2 on the west side of the airport was measured instead of point 2a since it is in the extension of the runway, directly under the flight path. On days nine and ten, points 3, 4a, and 4b on the east side of the airport were measured due to westerly winds being forecasted. Point 3 was about 400 m from the start of the runway, and there is approximately a 2.5 km distance between point 3 and points 4a and 4b.

2.1.3. Phase 3—Full Flight Operation

The last phase of measurements was conducted from mid-August 2020 to mid-September 2020 to capture flights during the peak summer travel season. Only two to three days were measured each week due to unsuitable weather conditions. There were primarily westerly winds, so eight of the ten days of measurement were made on the east side of the airport with the remaining two days were on the west side of the airport.
Several additional measurement points were added to evaluate the pollutant levels at further distances away. Point 1+ was added to the measurements on the west side of the airport which was 300 m further than point 1 and lies on the border of a community. On the east side of the airport, point 4c was added as an adjustment to 4b, which was slightly upwind of the flight landing path. In addition, point 4c+ was also measured, which is an additional 315 m further than point 4c.
Table 1 shows the information regarding the measurement days and location for all three phases during the measurement campaign. The starting time for the measurement is also mentioned in this table.

2.2. Flight Operation

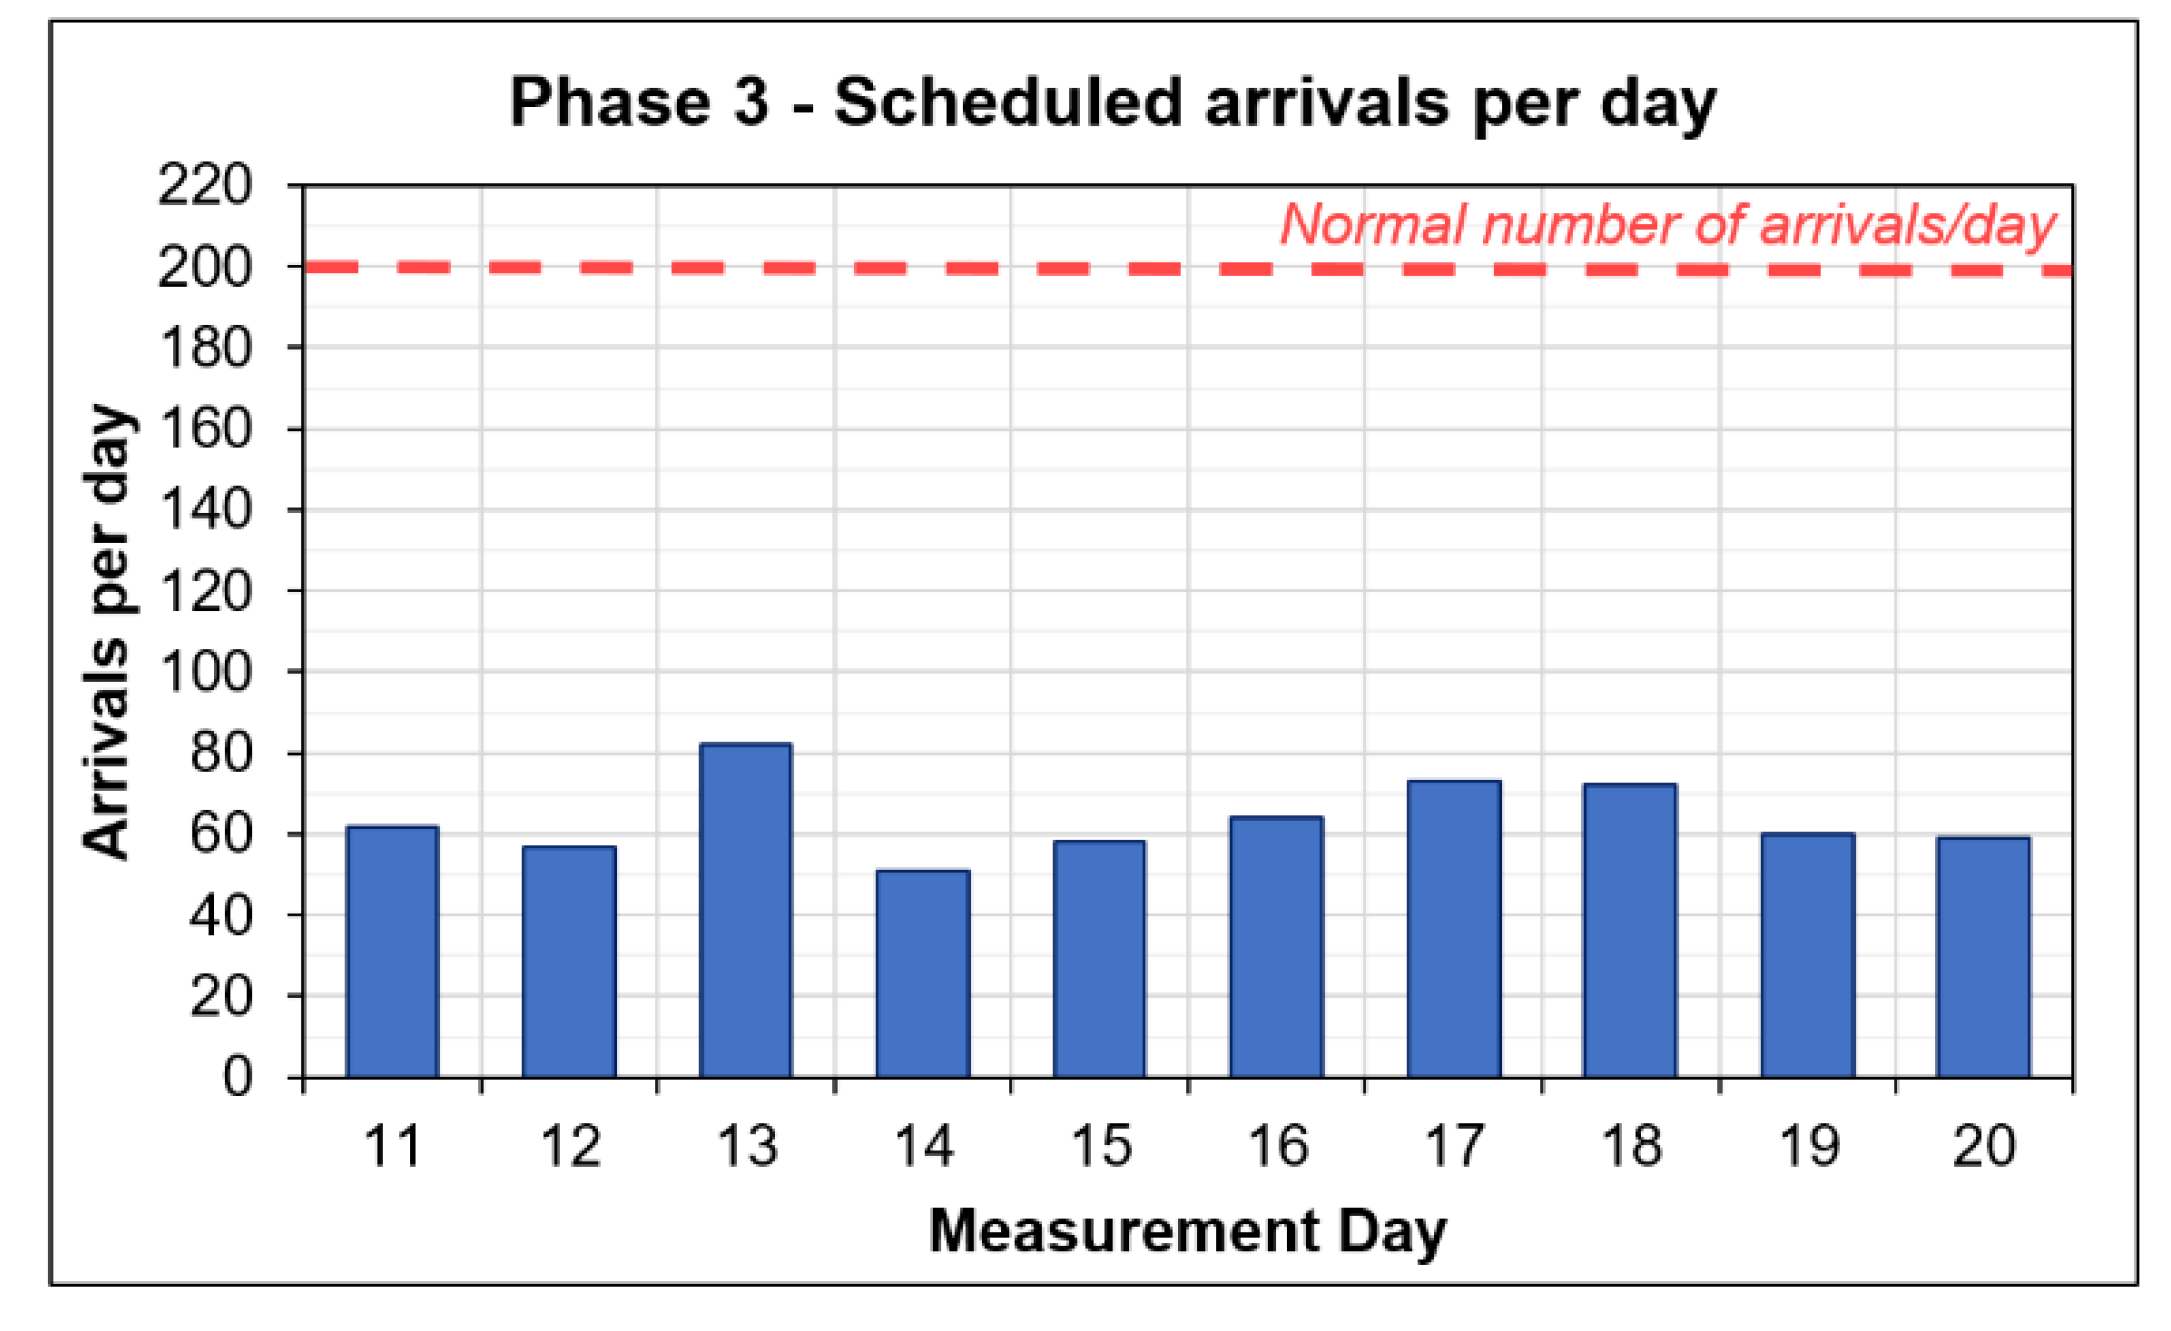
There were no flight operations during phase 1 of the measurement campaign. During phase 2 in June 2020, the number of flights during the measurement time per day ranged from nine to thirty, and there was an average of six arrivals per hour, which is low compared to that before the pandemic, twelve arrivals per hour. The third phase of measurements took place from mid-August to mid-September 2020, in which there was more air traffic. The average was 64 arrivals per day, still much lower than the number before the COVID-19 pandemic, which was 200 arrivals per day (Figure 2).
To compensate for the reduced number of flights, measurements were conducted during peak flight hours to simulate air quality conditions as close as possible to those before the COVID-19 pandemic. During these times the arrivals per hour (10 flights per hour) were much closer to those before the pandemic (12 flights per hour) as shown in Figure 3.

2.3. Setup and Protocol

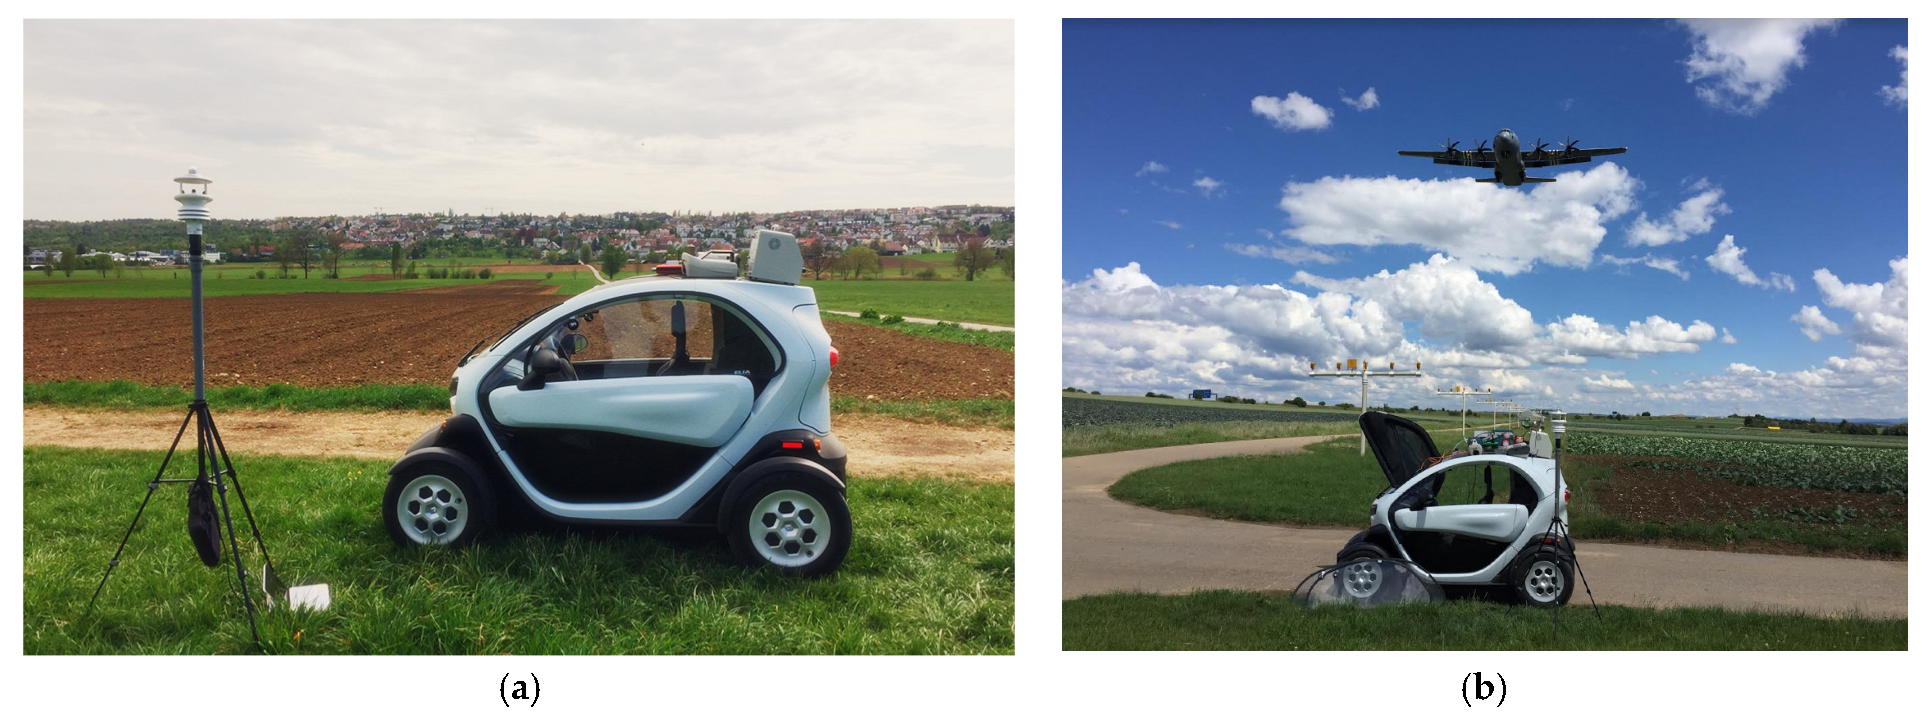
During the measurements conducted in phase 1, devices measuring UFP and PM concentration and size distributions, black carbon (BC), and meteorological conditions were employed. The majority of the devices were set on the roof of the measurement car at a height of around 2.5 m above the ground for the duration of the measurements and were positioned toward the wind’s direction at the start of the measurements. In addition, the meteorological device was set up approximately 3 m away, as shown in Figure 4.
During phases 2 and 3, the setup was similar to that conducted in phase 1, with the devices placed on top of the measurement car. However, during phase 2, the O3, CO2, and NO2 measurement devices were added and used throughout the rest of the campaign.
The measurement protocol included noting the times when aircrafts flew overhead and the general size of the aircraft (e.g., commercial size, personal plane, etc.). In addition, possible influences from other sources (e.g., cars, tractors, etc.) were also recorded, so that these influences could be distinguished from those sourced from aircrafts.

2.4. Measurement Devices

A variety of instruments were used in this study and covered a size range from ultrafine particles to coarse particle sizes, as well as particle distribution. Several gases were also measured, as well as the wind speed and direction. A precondition was that all instruments could be operated by batteries or accumulators as a permanent power supply was not available.

2.4.1. Particle Counters

Six particle counter models were used in this study. Two models utilized a condensation particle counter (CPC). One was the SMPS + CPC NanoScan 3910 (TSI), which measures the number concentration of UFPs and size distribution. The other device was CPC Model 3007 (TSI). Both measure the number concentration of UFPs by first growing them by condensation in the CPC condenser and then counting them using a laser; however, the SMPS has a particle size separator prior to the CPC [21,22]. Three optical particle counter (OPC) models were used, namely the Fidas Frog (Palas), the OPS 3330 (TSI), and the Model 1.108 (Grimm). All three utilized the light scattering principle and measured both fine- to coarse-size particles and size distribution [23,24,25]. Two diffusion charger DiSCmini (Testo) devices were used to measure the particle number concentration of UFPs. The device charges the particles and when discharging them, measures the number concentration [26]. The two DC DiSCmini (testo) devices were used in making parallel measurements at two sites at the same time.

2.4.2. Aethalometers

Two models of BC aethalometers, the AE51 (AethLabs, San Francisco, CA, USA) and the MA200 (AethLabs), were used to measure BC concentrations. The aethalometers work on the principle of light attenuation, in which the particles are collected on a filter while light is transmitted through it, and then the absorbance is measured and converted to concentration [27,28].

2.4.3. Gas Measurement Devices

Three gas monitors were used to measure CO2, NOX, and O3. The CO2 (LI-COR) monitor took measurements via IR absorption [29]. The NOX and O3 (2B Technologies) also took measurements via absorption but with different wavelengths of light (405 nm and 254 nm, respectively). [30,31].

2.4.4. Meteorological Devices

A compact weather station, the MaxiMet GMX501 (Gill Instruments, Lymington, UK), was used to measure the wind speed and direction [32].
A summary of the devices used can be found in Table 2.

3. Results and Discussion

3.1. Particle Size Distribution (PSD)

In phase 1, the particle concentration remained below 10,000 particles/cm3 on days 1 to 4. Days 1, 2, and 3 (Figure 5a–c) showed a higher number of UFPs, which decreased on day 4. The values on day 4 (Figure 5d,e), a Sunday, being significantly lower, could be due to there being fewer influences nearby. Another reason could be due to reduced road traffic, which could also explain why the maximum for the larger particles was on day 4 (86 nm).
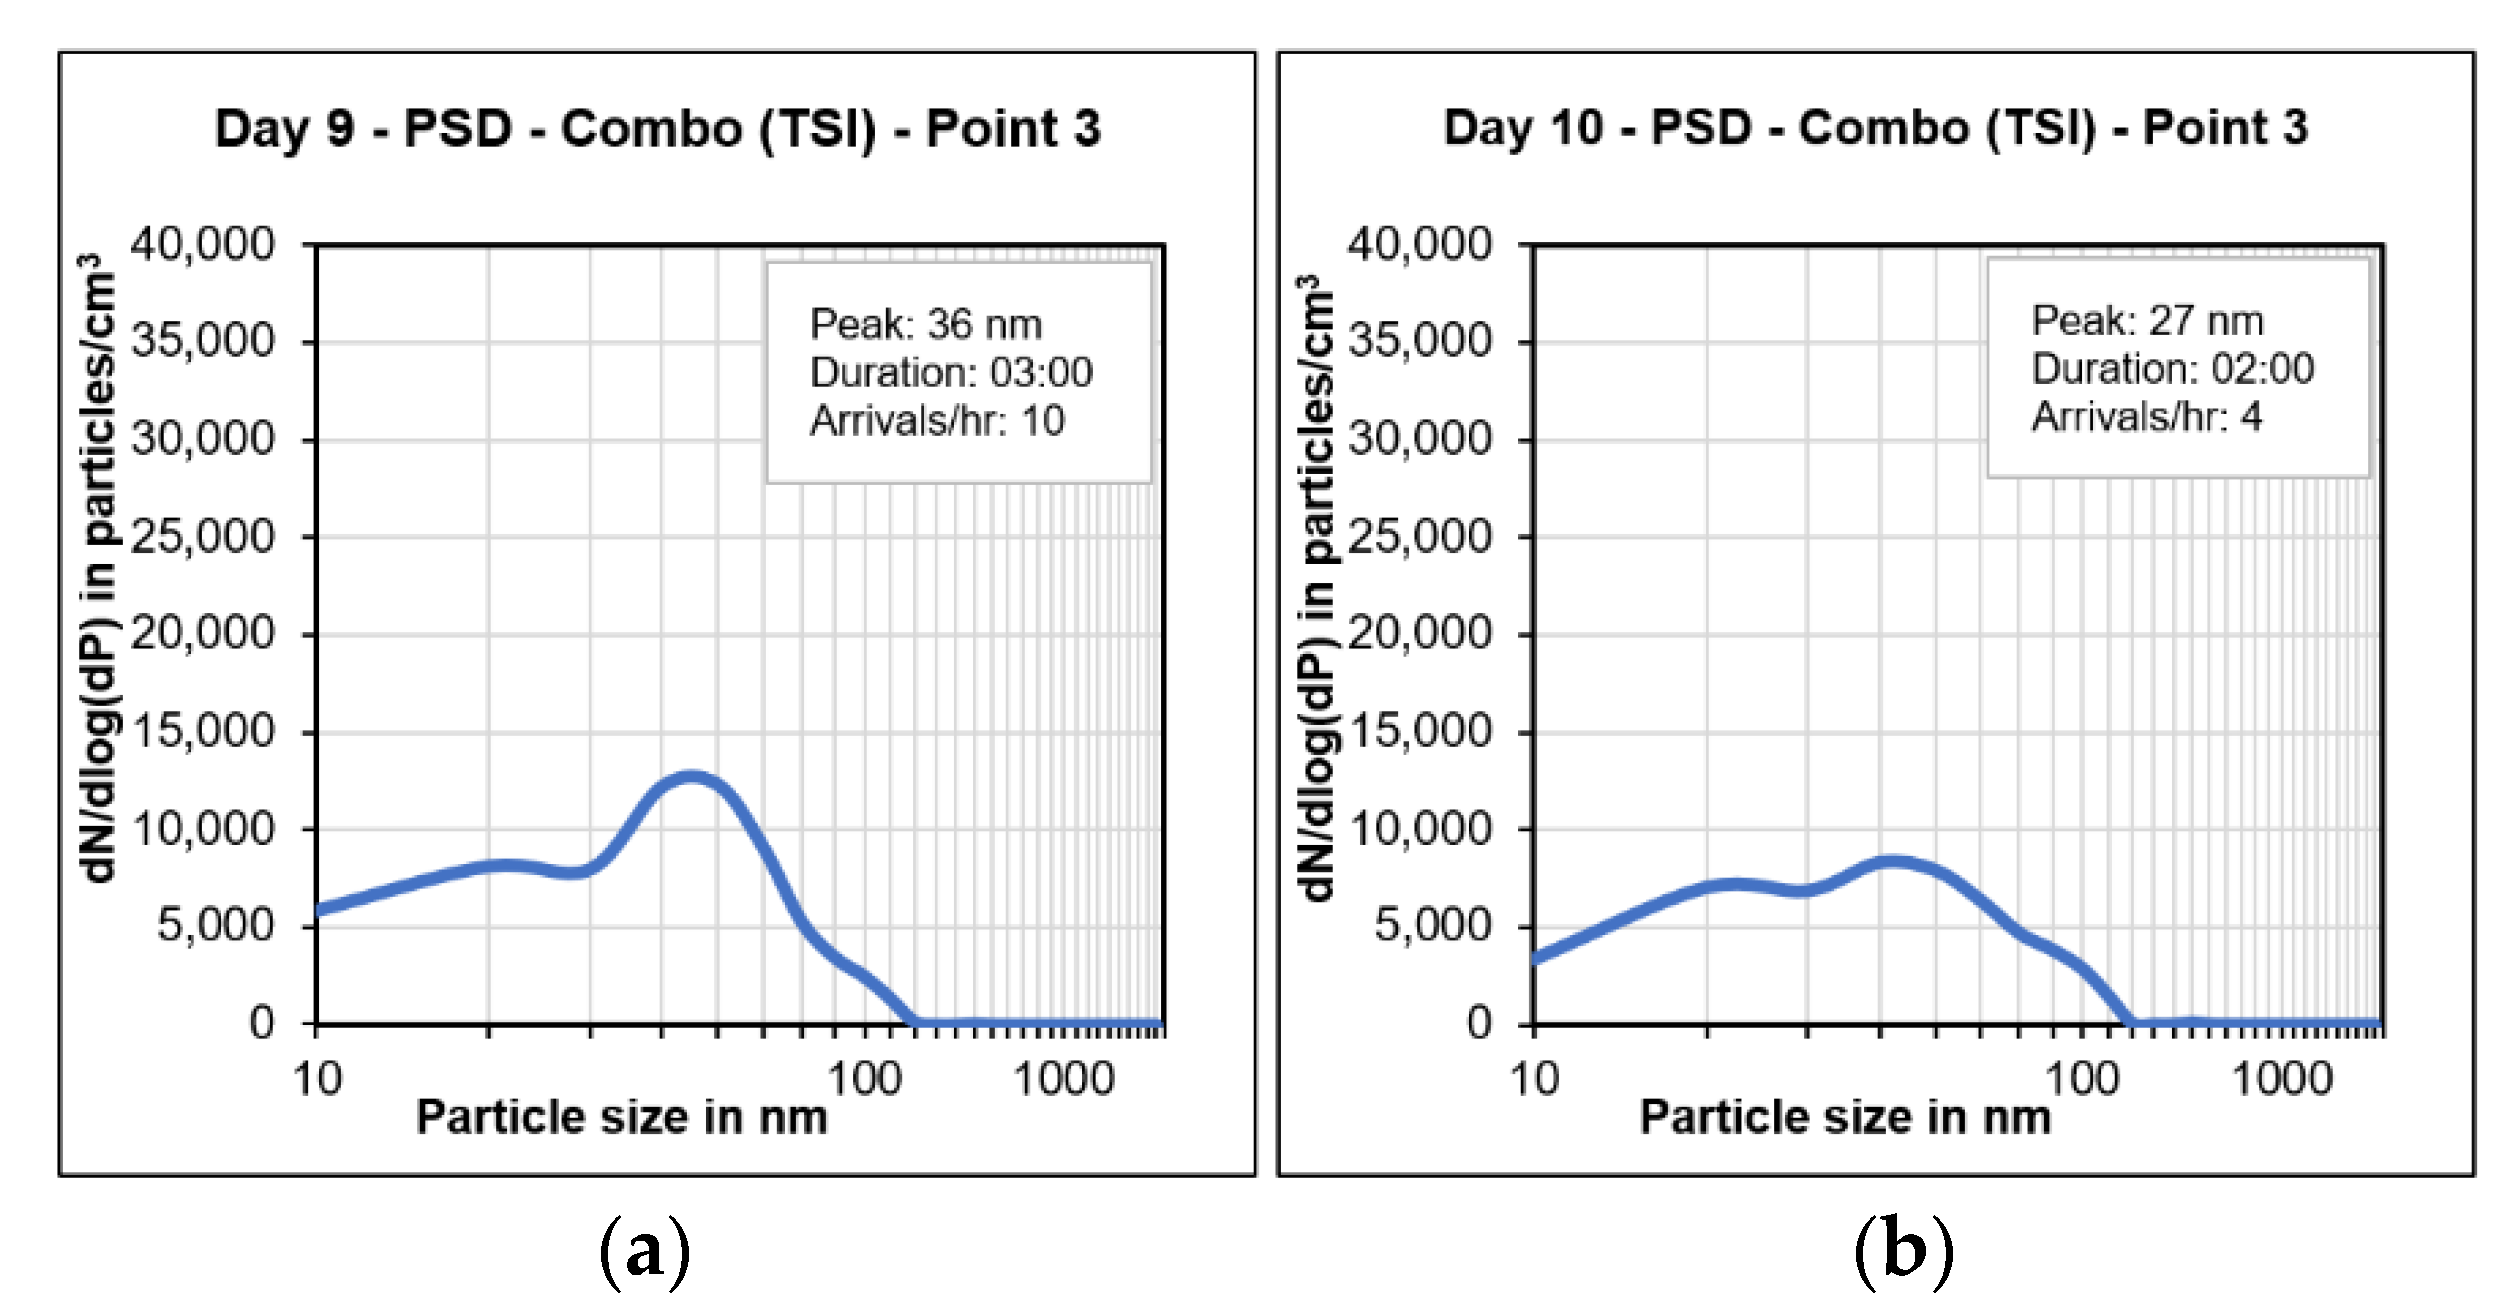
Beginning in phase 2, a higher number of particles in smaller size classes was observed compared to that in phase 1. On day 9, in which most flight arrivals occurred in phase 2, the maximum number of particles occurred in size classes smaller than 36 nm and there was an increase in the particle number concentration (PNC) to about 12,000 particles/cm3, as shown in Figure 6a. On day 10, the same location was measured, but the number of flights per hour decreased from ten to four. The overall PNC was lower at just over 8000 particles/cm3, but the peak particle concentration occurred at 27 nm (Figure 6b). The lower peak particle size, compared to that in phase 1, could be caused by the aircrafts influencing the concentrations on the ground, but not very much, due to the few numbers of aircrafts starting and landing in phase 2.
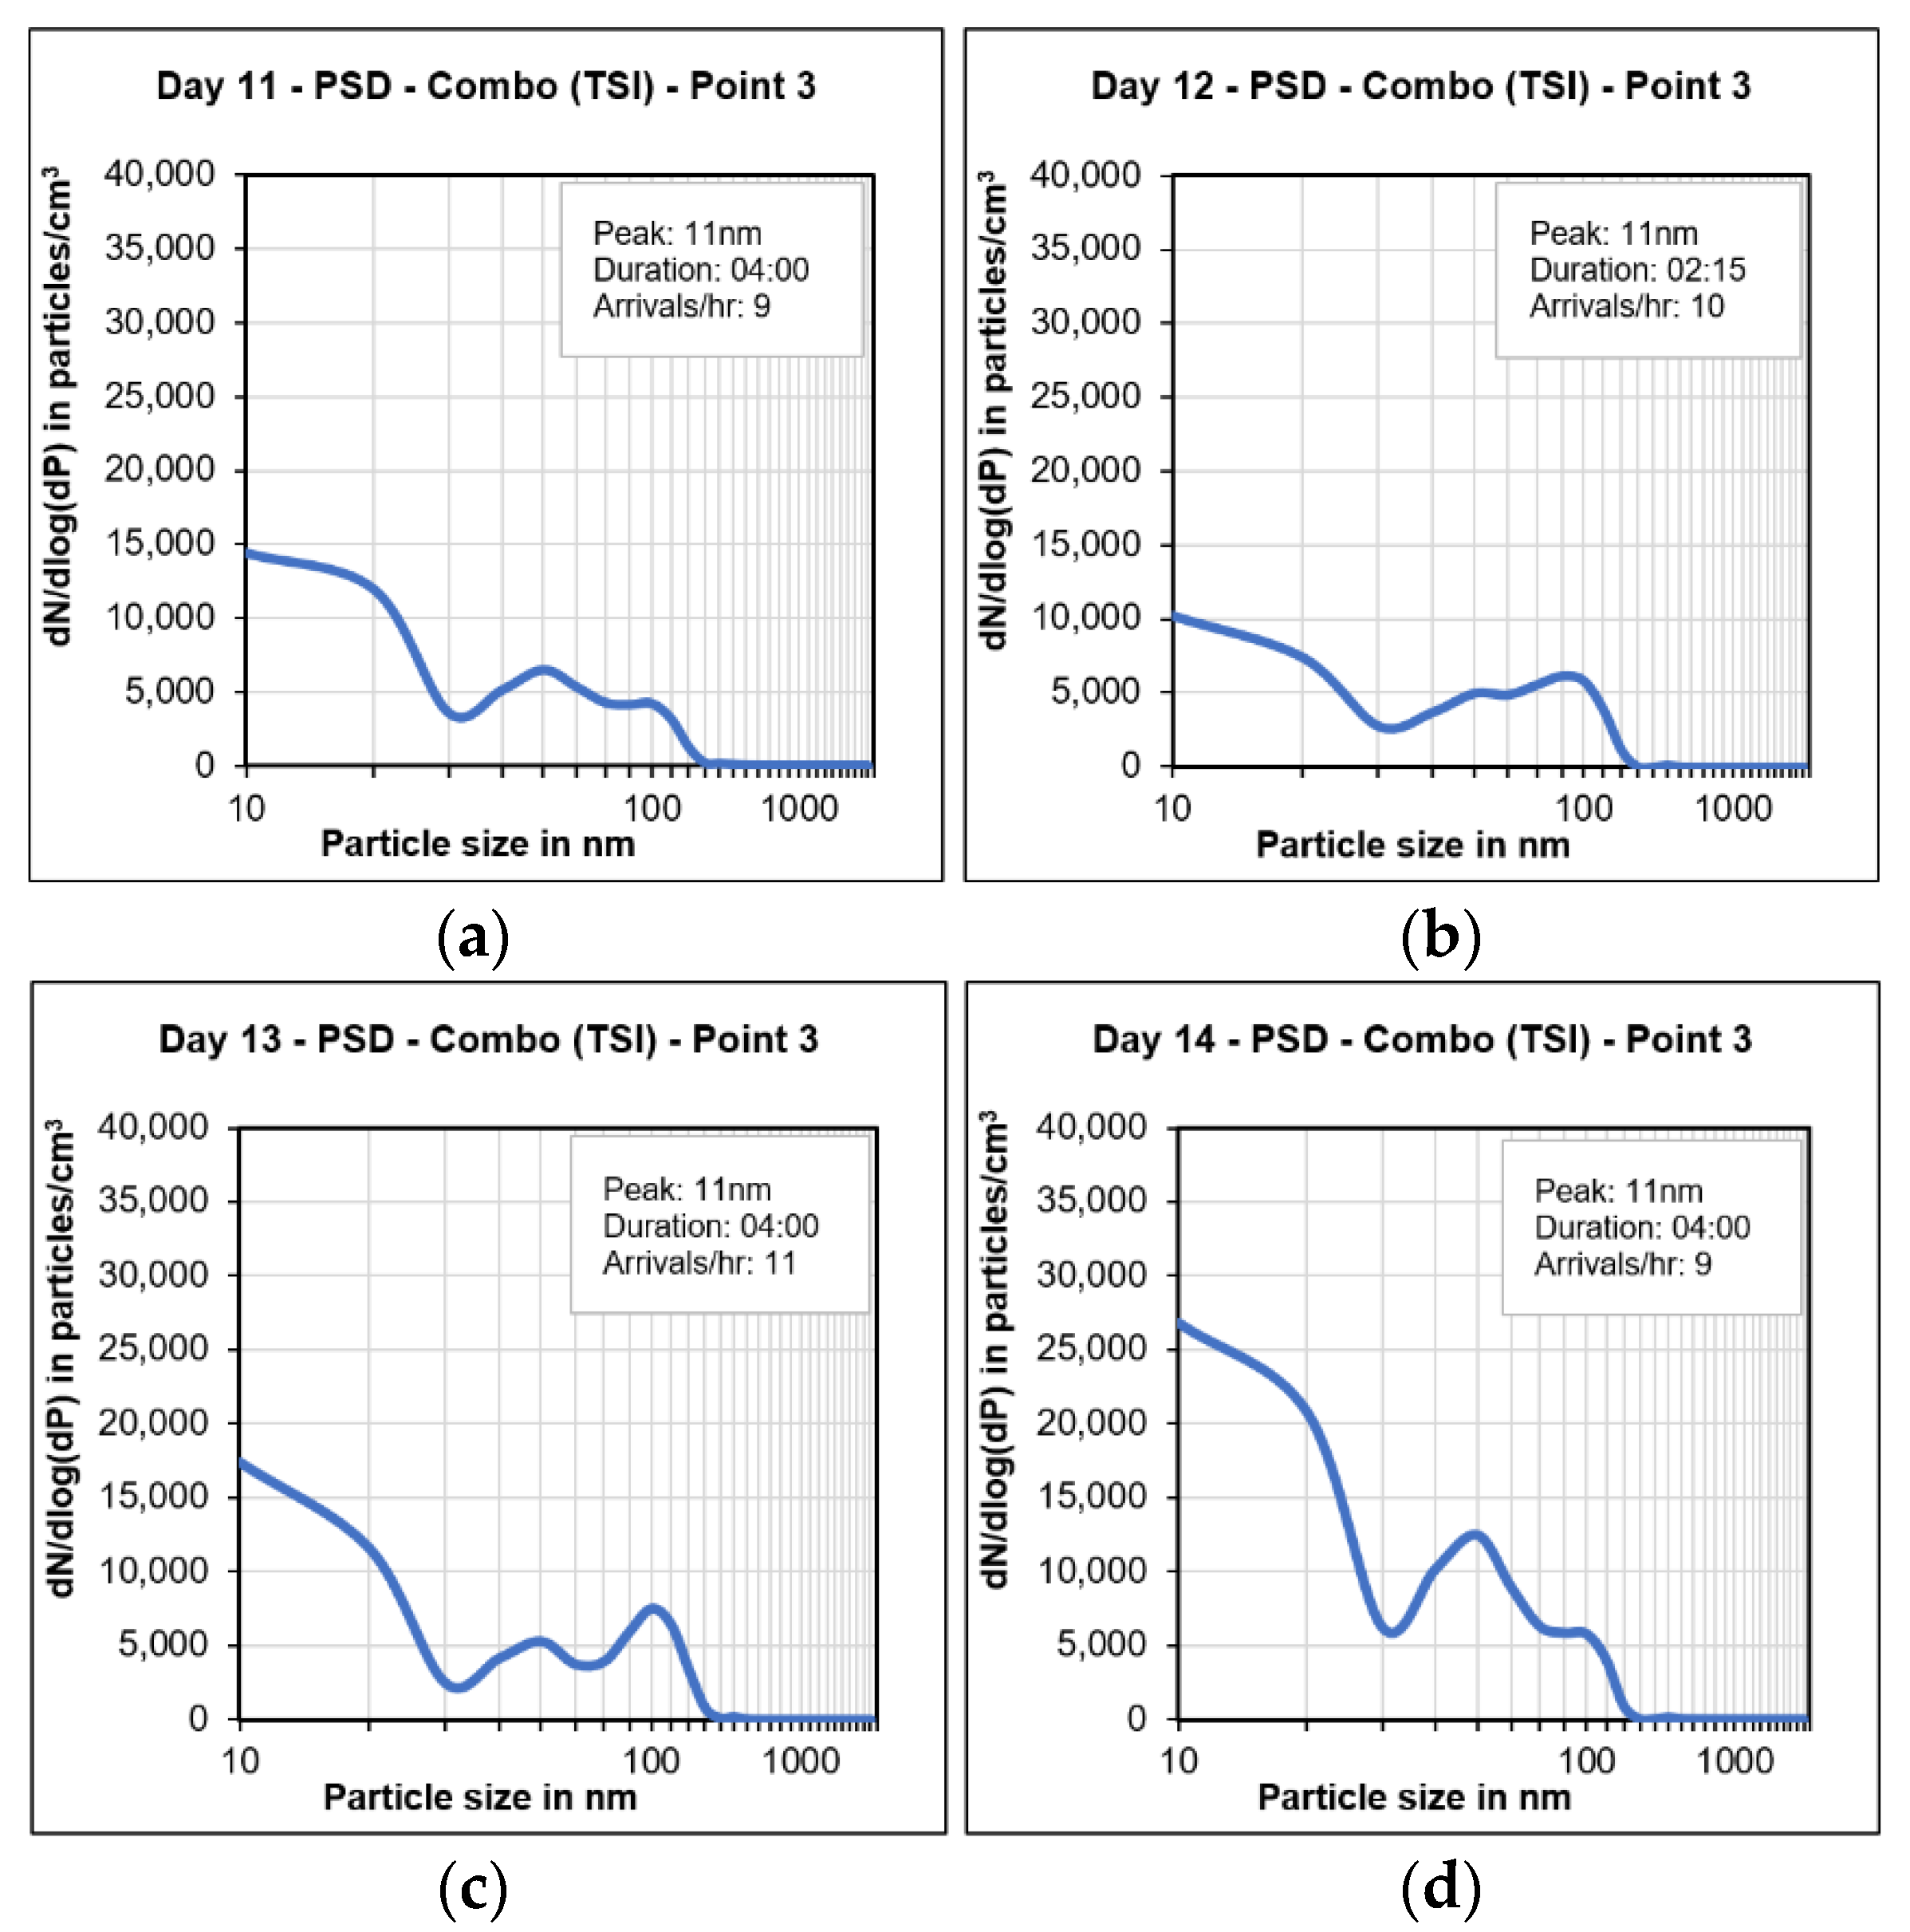
In phase 3, the daily average PSD can be characterized by the peak particle size. Figure 7a–d shows the daily average PSD on days 11, 12, 13, and 14, respectively. On all days when the flight arrivals were measured, the highest particle concentration levels were in the lowest size class of 10 nm, which is the smallest particle size measured by the device. On day 12 (Figure 7b), there were rain prior to the measurements and the particle concentration was relatively low compared to that of the day before. However, the general shape of the size distribution remained the same with the highest number of particles being in the 10 nm size class. A similar trend for the PSD was seen on days 13 and 14, as shown in Figure 7c,d, respectively. However, the number of particles per cm3 was higher for the 10 nm size class on these days.
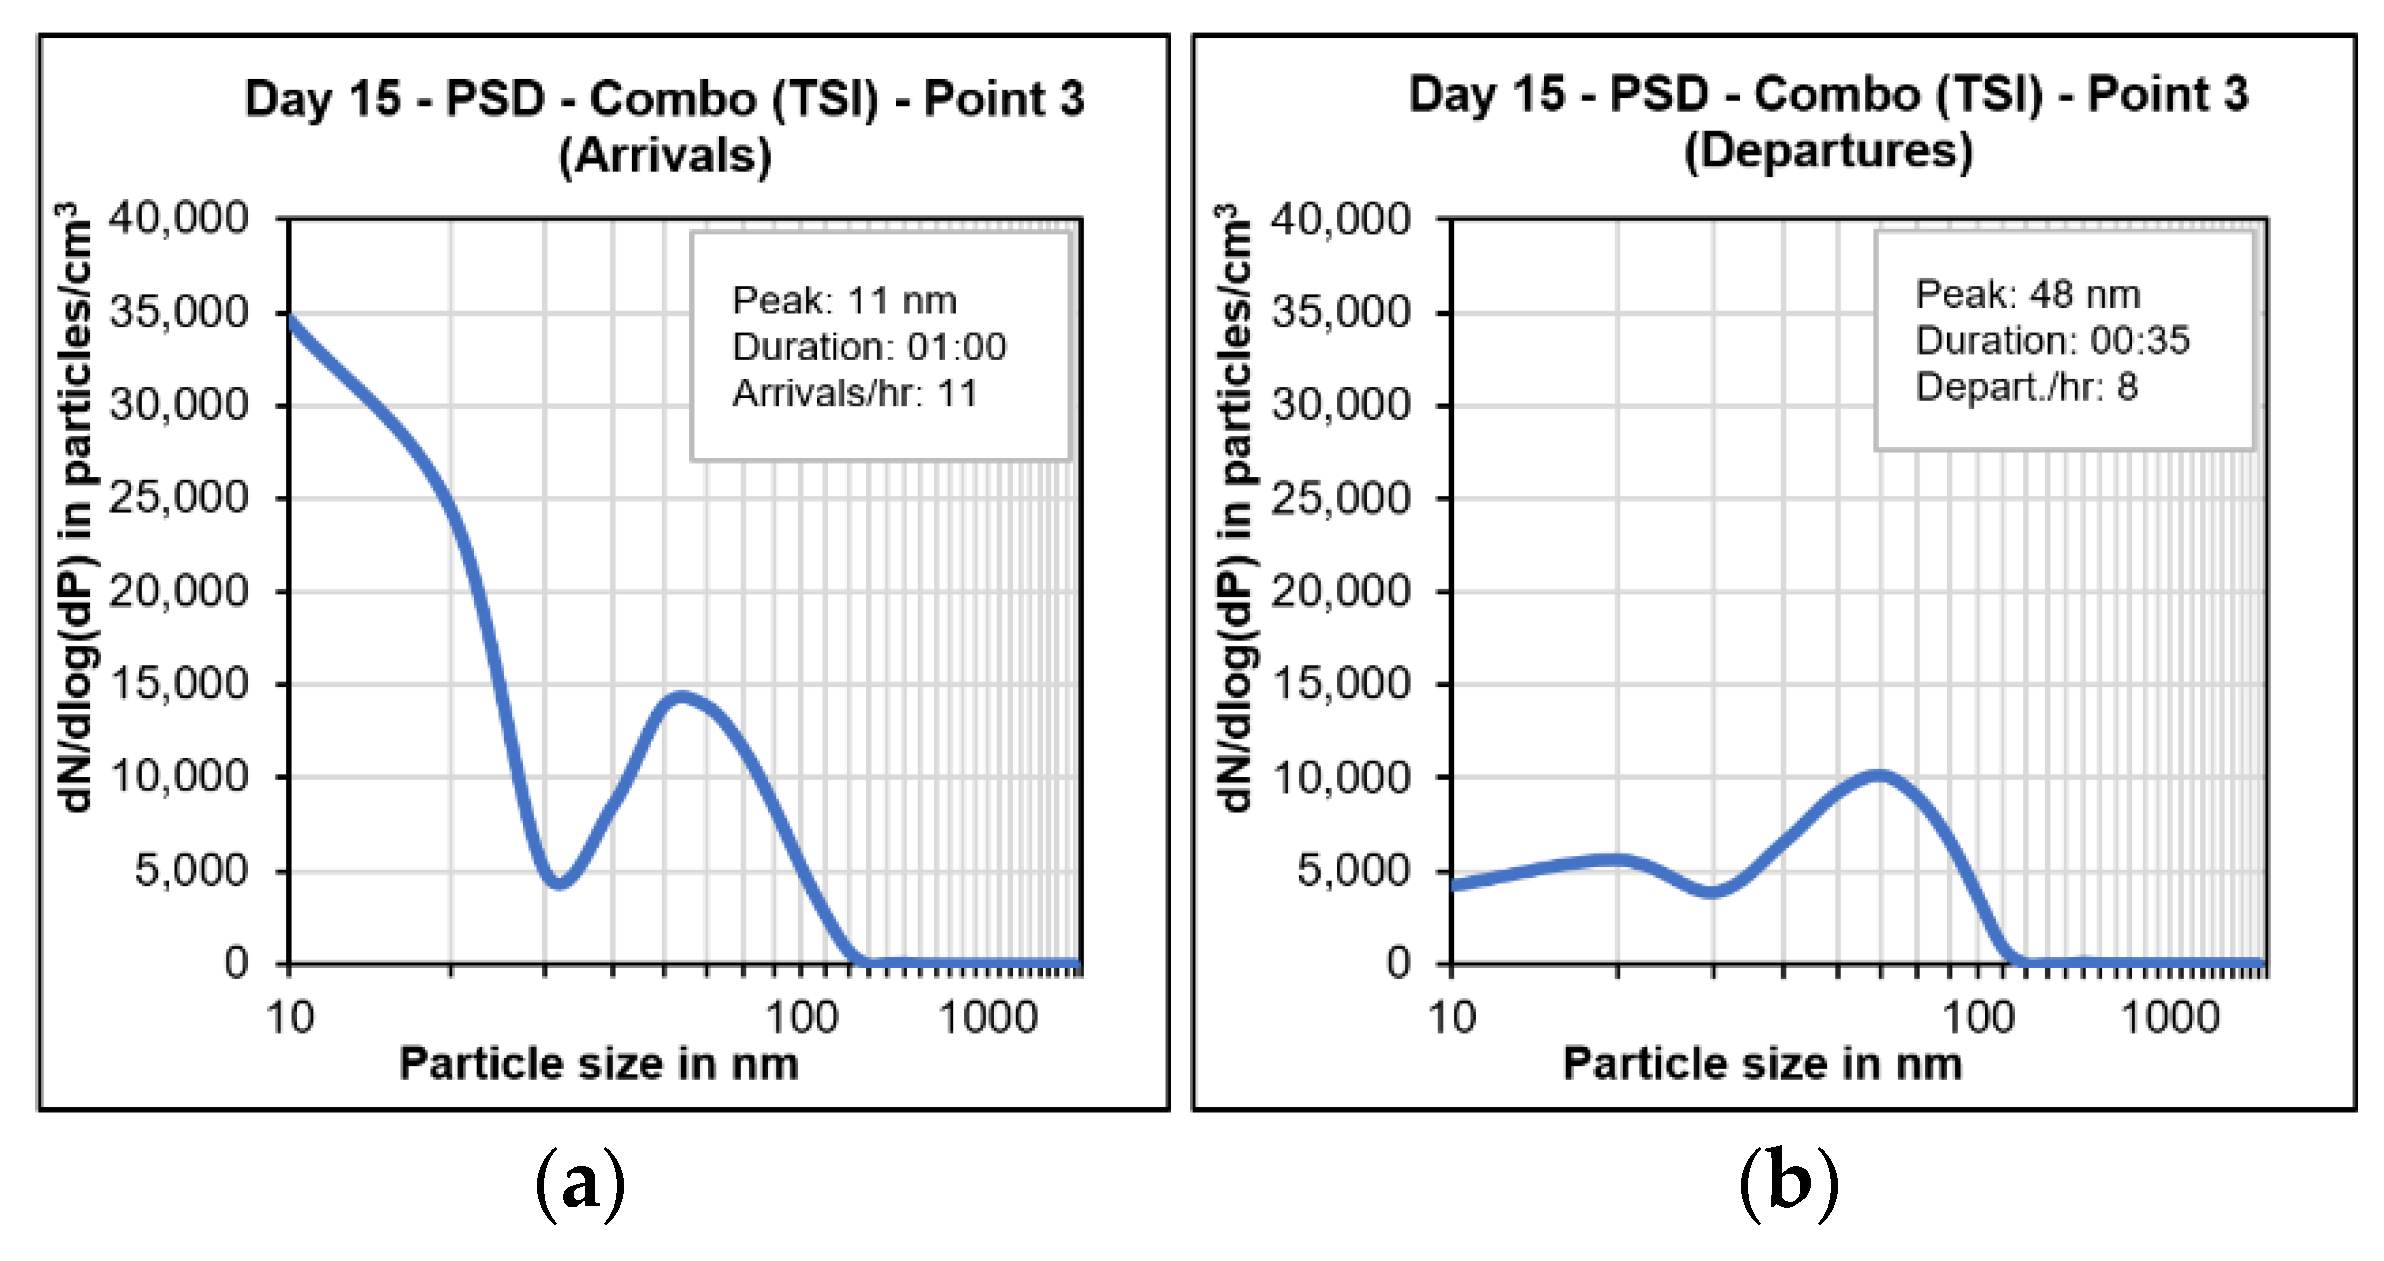
On day 15, the arrivals first of all flew over point 3, as on the previous days. However, the flight path changed mid-morning due to the changing wind direction, and the departures began taking off over point 3. The highest particle number concentration was initially at 10 nm when the arrivals were measured (Figure 8a) but then shifted to 48 nm when the departures were measured (Figure 8b). During the departures, the aircrafts gained altitude at a quick rate which was assumed to be too high to measure by the time they flew over point 3.
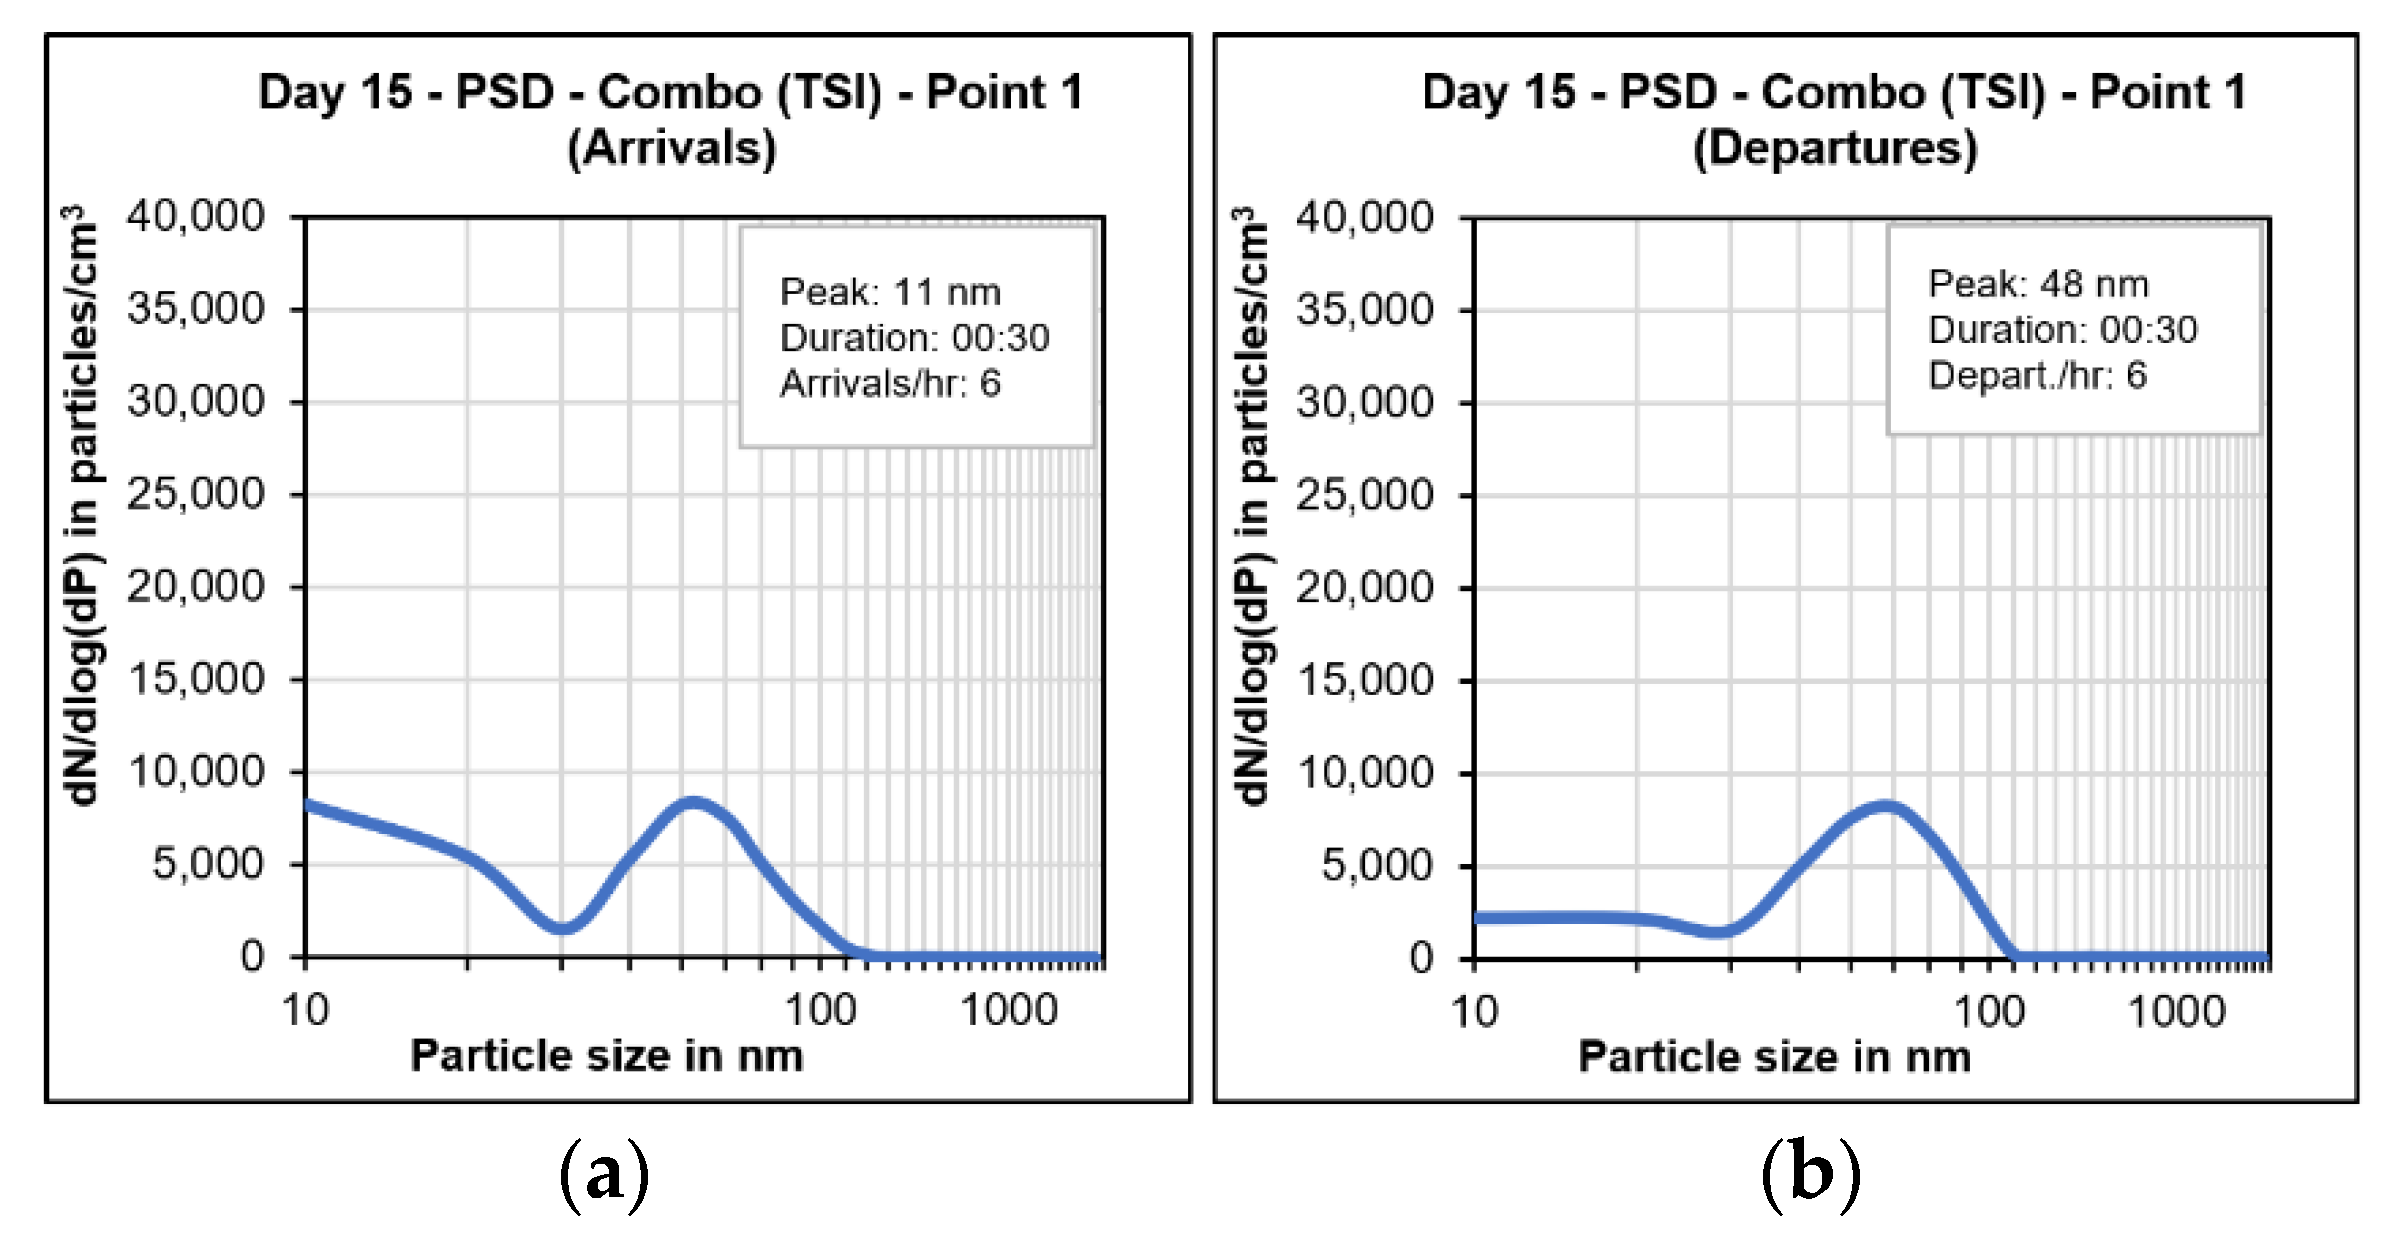
The measurement location was then moved to point 1 on the west side of the airport to continue measuring the arrivals and the same pattern was seen again. Only three arrivals were measured at this location before the flight path direction changed again. During the arrival measurements, the PSD at point 1 (Figure 9a) showed a higher number of particles in the 10 nm size class but with a lower PNC due to the planes being at a higher altitude when at a further distance (1.8 km) from the runway. For the departure measurements, the maximum of the particle number concentration was observed at 48 nm as shown in Figure 9b.
These results show that air traffic does contribute to an increase in UFPs even when there are as few as three planes arriving overhead. Thus, it can be expected that the number of particles in the 10 nm size class would be significantly higher during non-COVID19-pandemic conditions.

3.1.1. Particle Number Concentrations

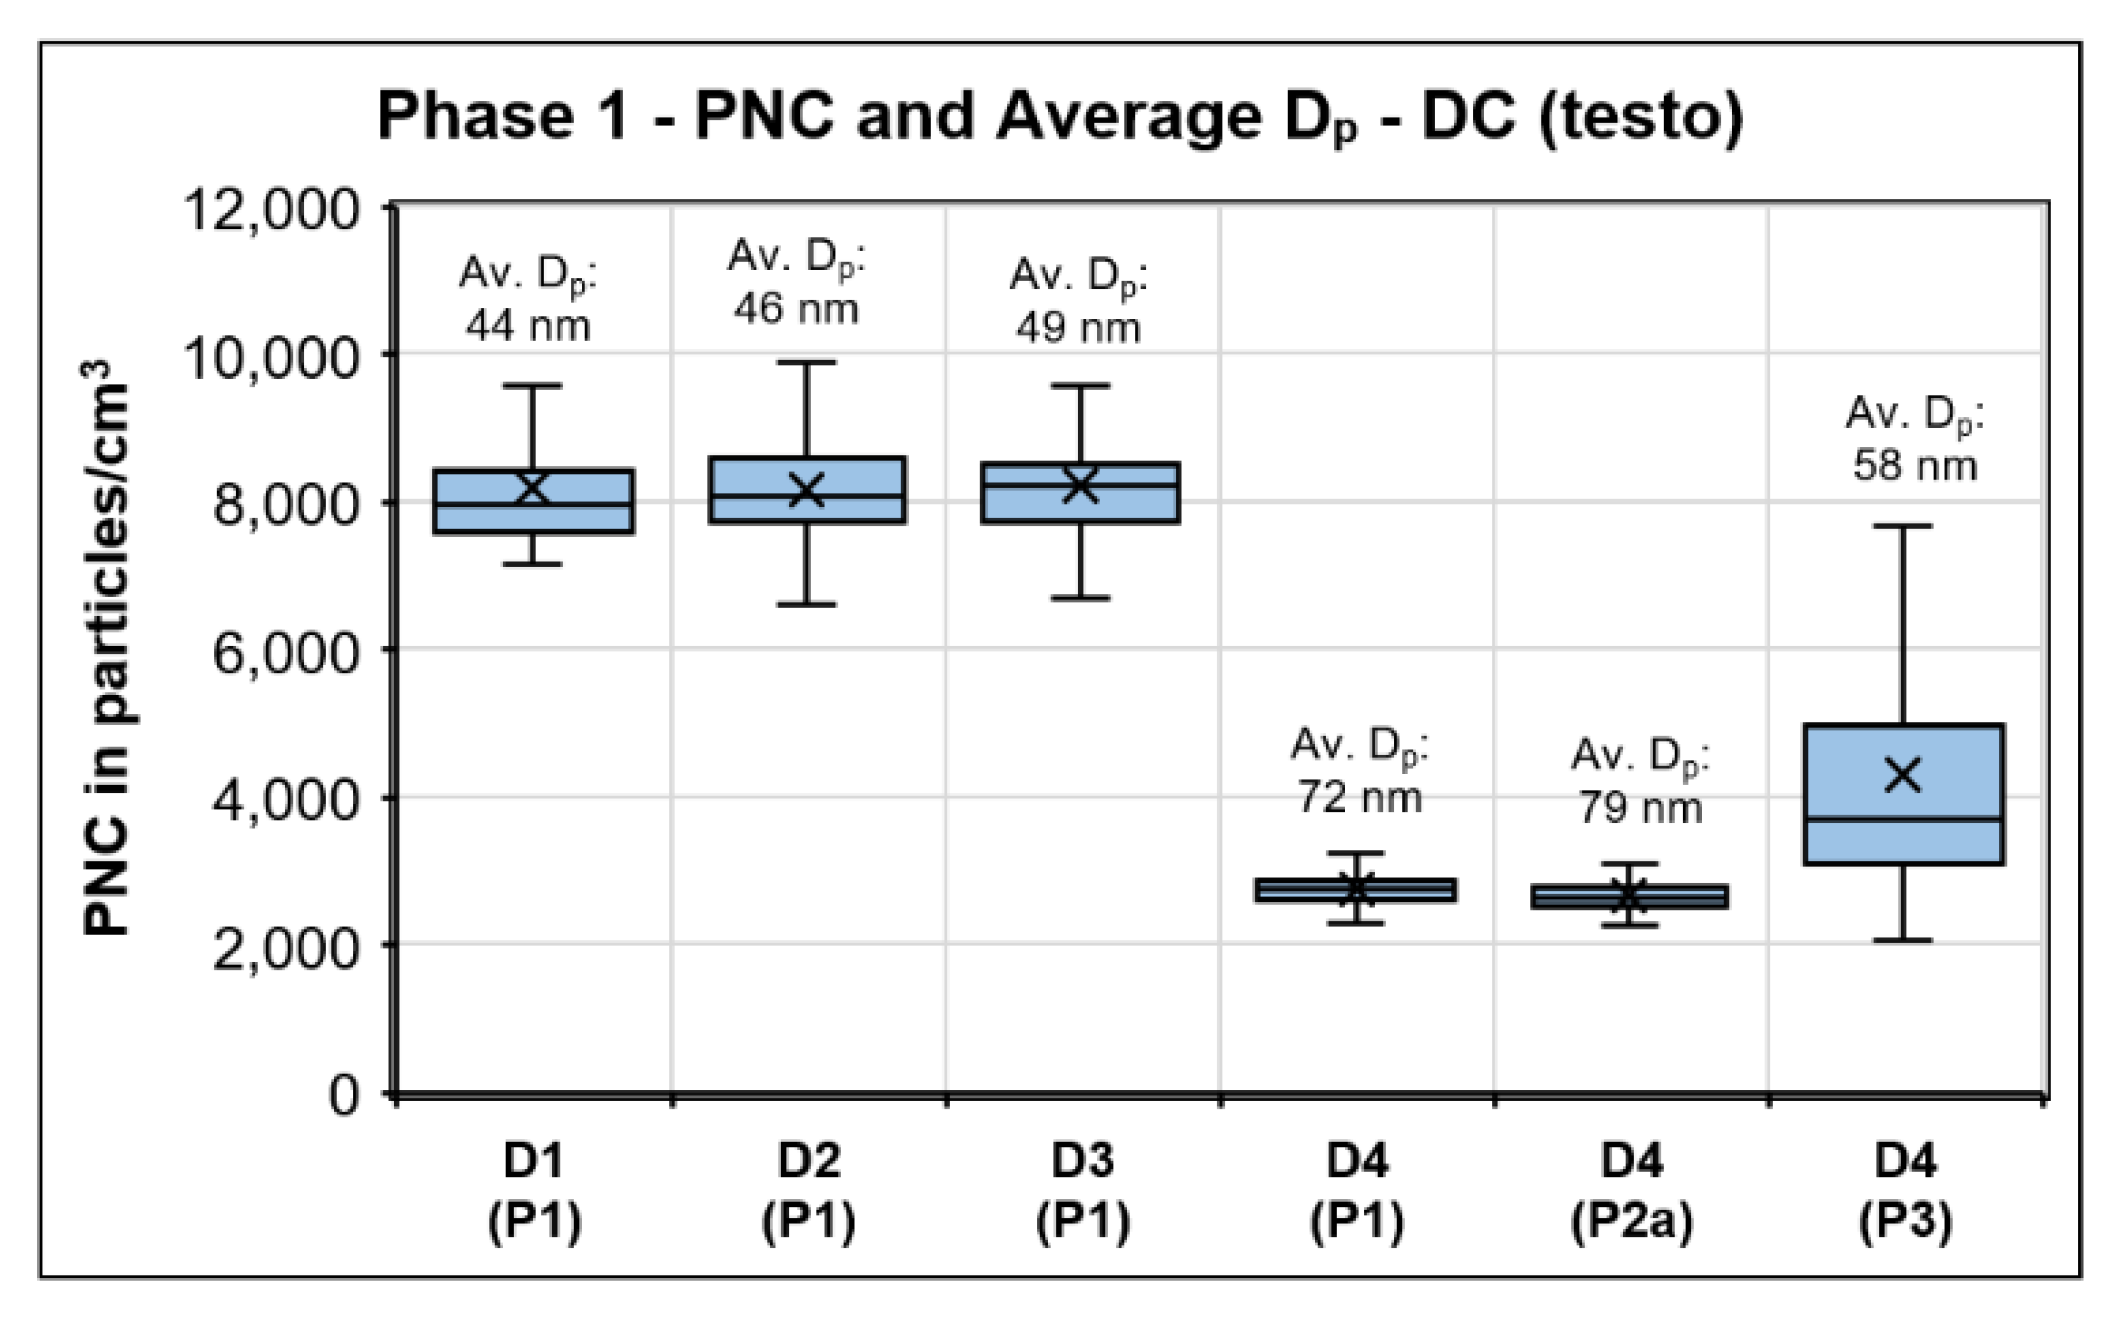
In phase 1, there was little change and variation in the particle counts on days 1 to 3. On day 4, there was a drop in the PNC and an increase in average particle size which could have been due to reduced emissions on Sundays. The higher variation at point 3 could have resulted from airport construction taking place nearby. During this phase, the PNC was less than 10,000 particles/cm3 and the particle diameter (Dp) was larger than 44 nm. In Figure 10, the PNC results for the phase 1 measurements are shown with the average Dp. All measurements depicted in Figure 10, Figure 11, Figure 12, Figure 13, Figure 14, Figure 15 and Figure 16 were performed by diffusion chargers (Model Discmini from Testo company). The particle number concentration, PNC, is measured in the range from 10 to 700 nm, and the average diameter, Dp, is calculated for the size range from 10 to 300 nm (see Table 2).
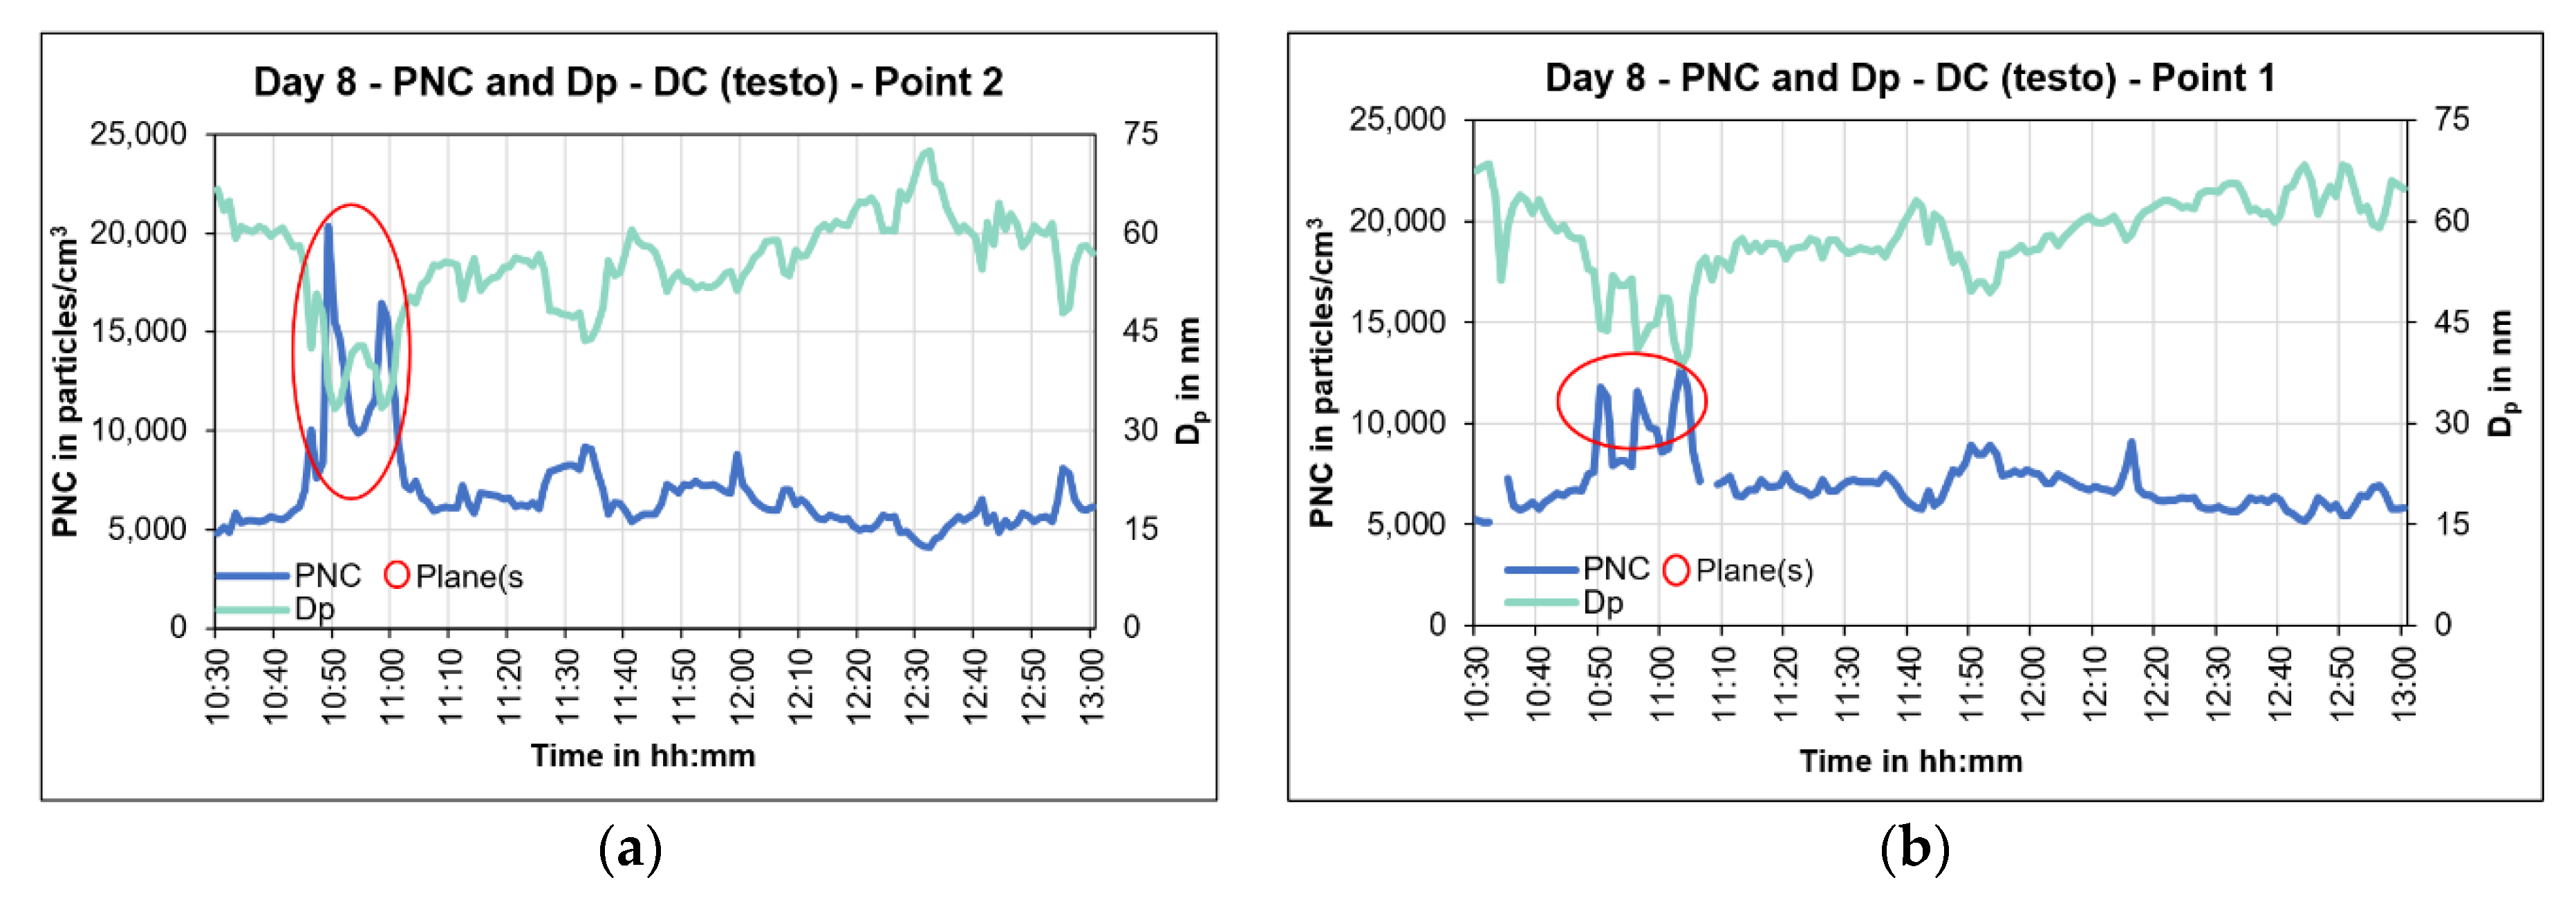
In phase 2 on day 8, there was a series of four departures within 11 min. Peaks were clearly seen at point 2 with residual levels also visible at point 1. With the increase in the PNC, there was a subsequent decrease in the Dp. Simultaneous UFP measurements on day 8 at point 2 and point 1 are shown in Figure 11a,b, respectively. While this is above the typical 20 nm diameter said to be from planes, one study suggested that when the aircraft is operating at more than 70% power, the maximum PNC can be found at around 40 nm [33], which is in accordance with the measured values. In addition, the particles agglomerate and grow after being emitted which could also explain the greater particle size. Another possibility could be that the emissions from the aircrafts are mixed well with other air masses and therefore the Dp decreases while the PNC increases, but not as much compared to days with more aircraft traffic.
None of the other four flights that occurred on this day were detected at either location. This highlights the importance of consistent wind directions and good atmospheric mixing when measuring aircraft plumes using stationary measurements on the ground.
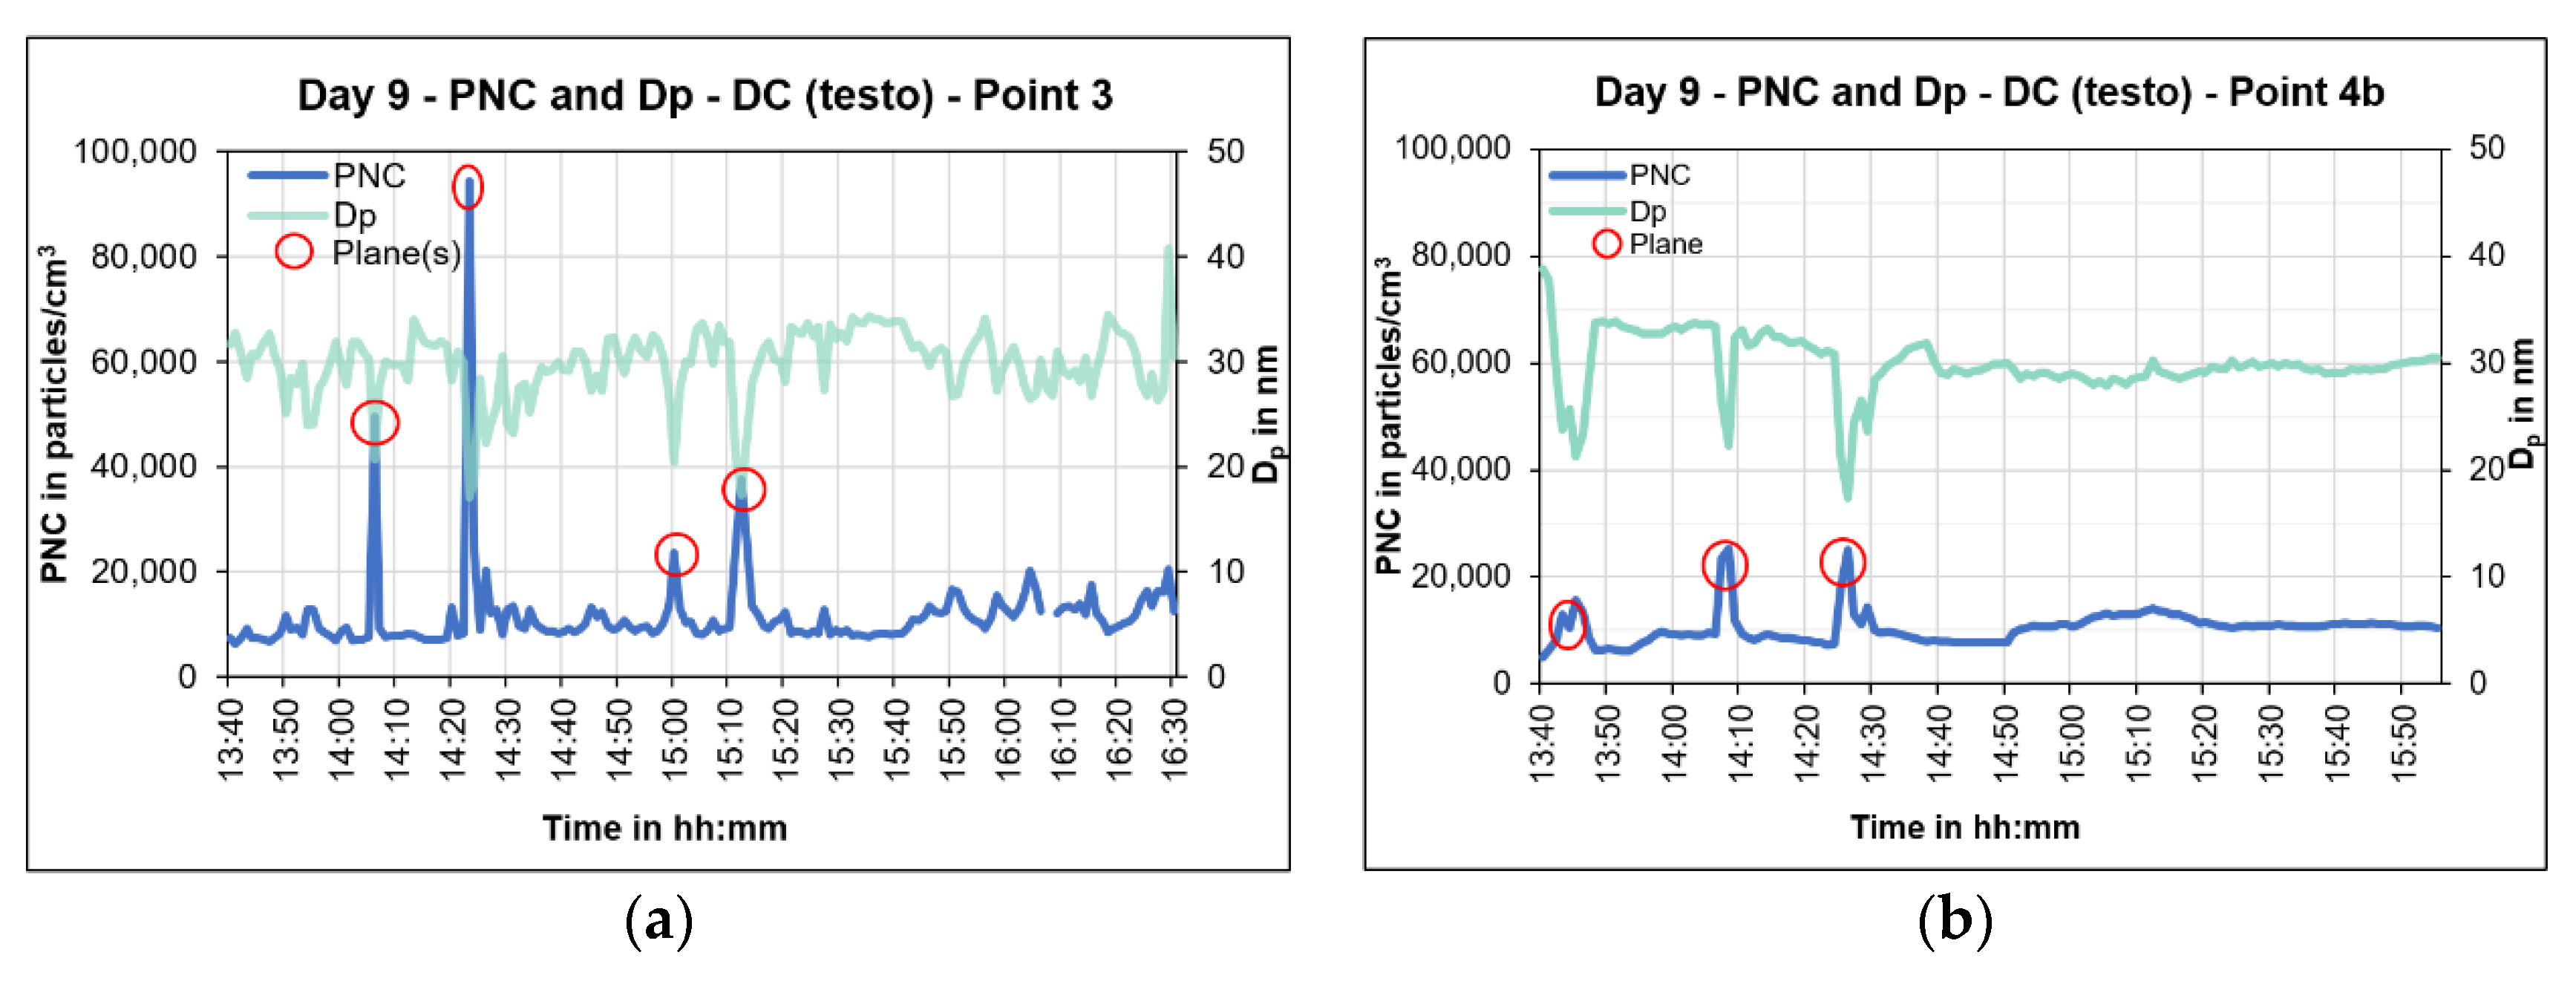
On day 9, there were 30 arrivals during the measurement which took place at point 3 on the east side of the airport. Figure 12a shows that seven of the flights were measured by the devices, two of which were measured at point 4b two kilometres away (Figure 12b).
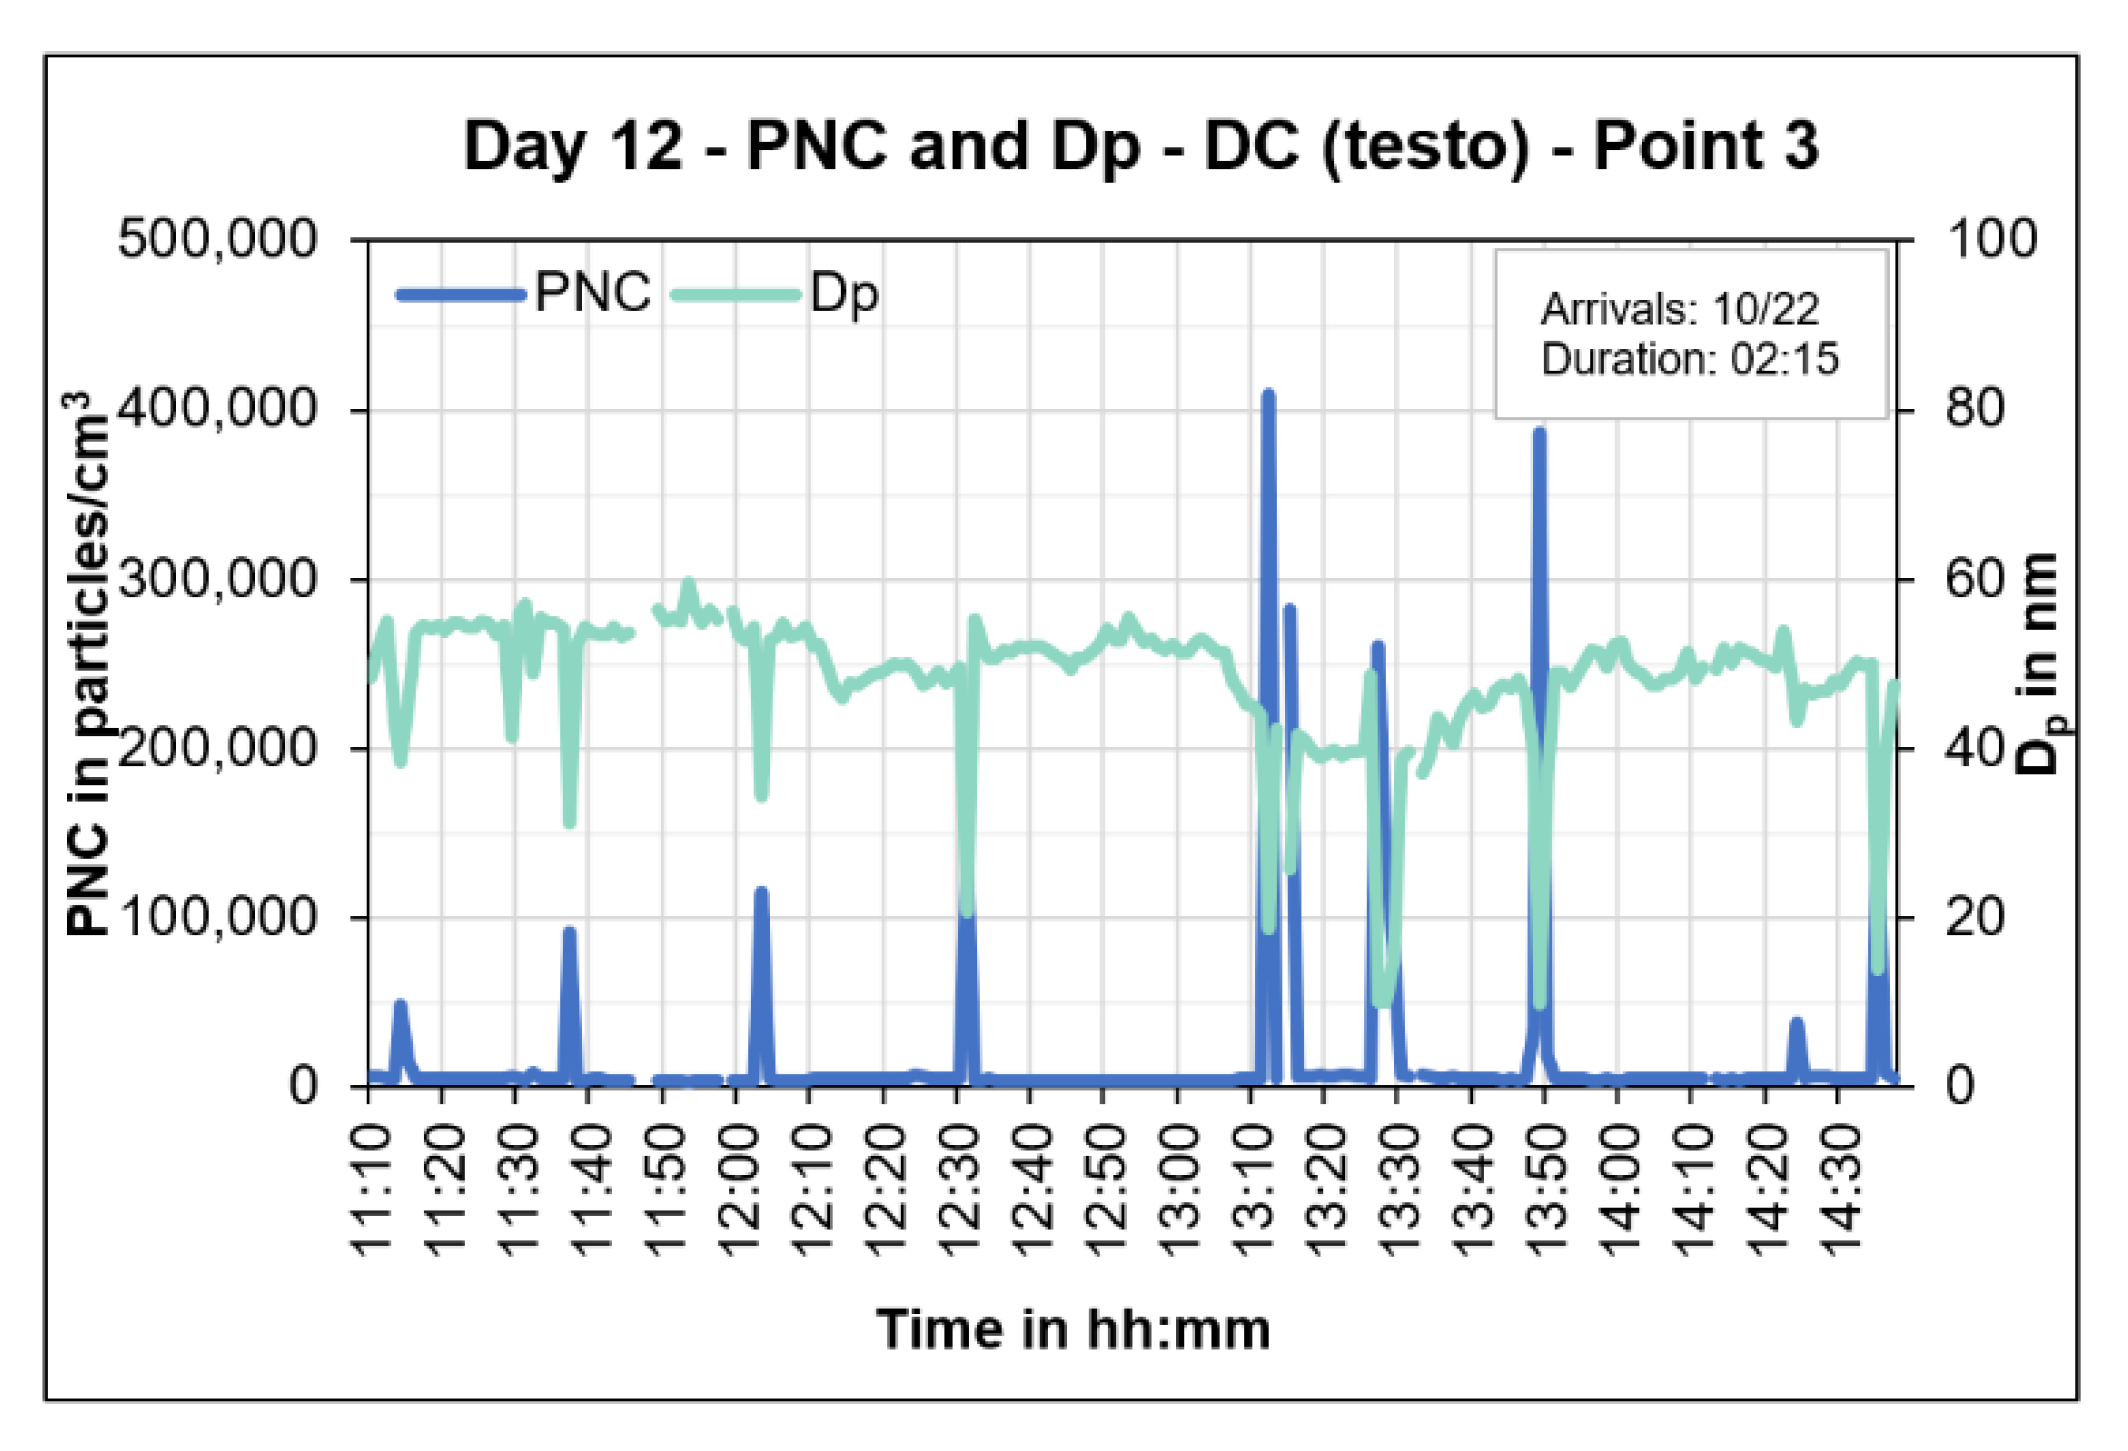
In phase 3, more PNC peaks and higher concentrations were measured than in phase 2. The peaks from aircrafts are distinguishable by the simultaneous decrease in Dp to the 10 to 20 nm size range.
On day 12, the concentrations increased to more than 400,000 particles/cm3. The results for the PNC and Dp for this day are shown in Figure 13. All the peaks measured were attributed to large aircrafts, except one at 14:20 CEST, which was from a medium-sized aircraft. This peak in the concentration did not have the same sharp decrease in Dp and could be due to either fewer overall emissions from a smaller aircraft or larger planes flying much lower over point 3, since a longer runway is needed for landing.
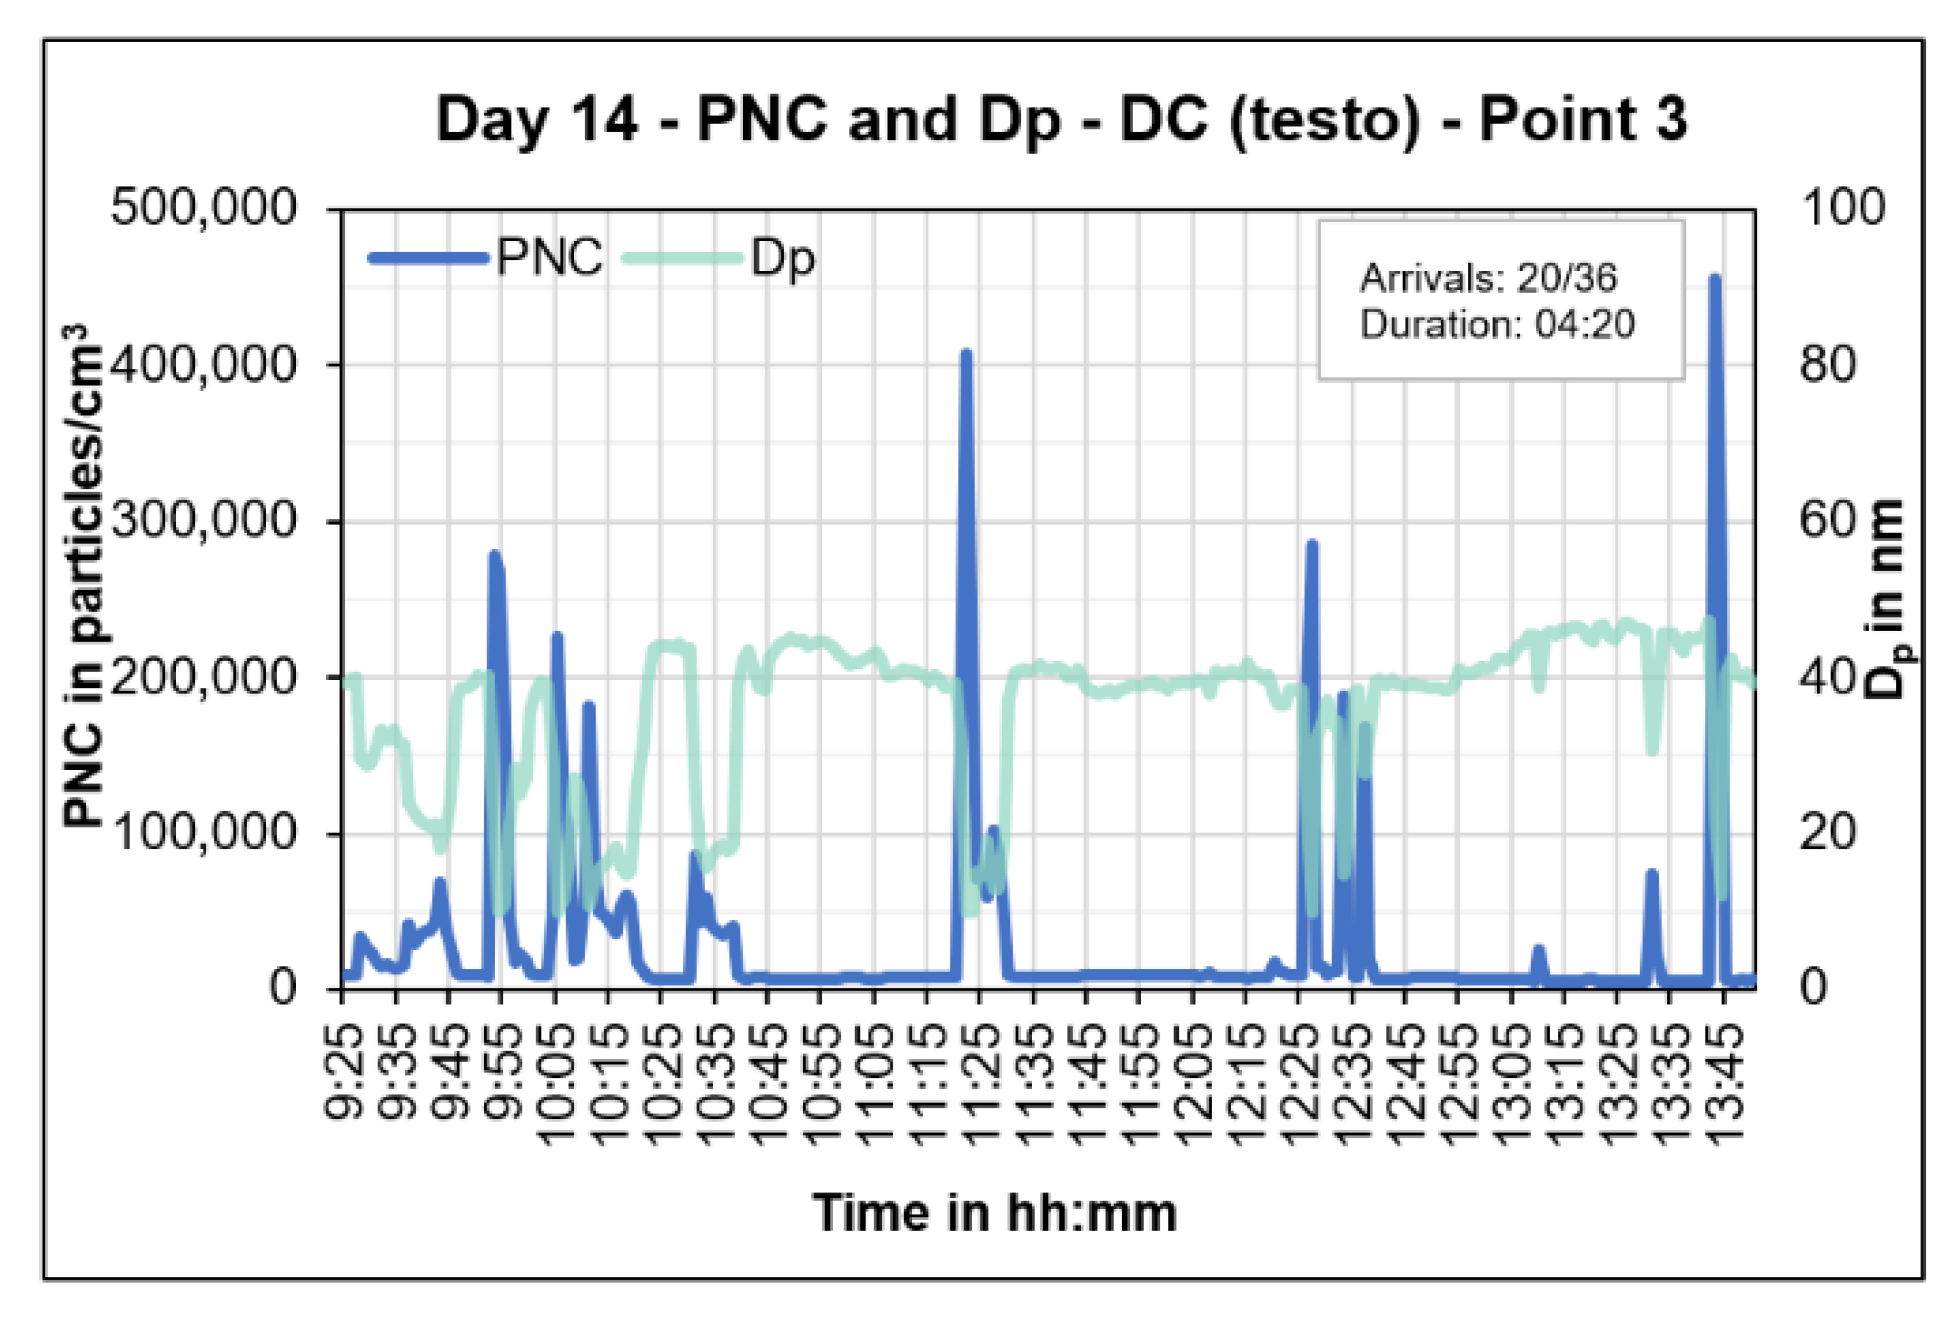
The same trend can also be seen on day 14. The PNC and Dp results for day 14 are presented in Figure 14. The weather was clear before the measurements and there were low wind speeds. Without the effect of the rain, nearly all the PNCs from the planes corresponded to the Dp between 10 and 20 nm.

3.1.2. Parallel Measurements

Parallel measurements were conducted on eight of the ten measurement days at a second location along the flight landing path. Depending on the wind direction, slight adjustments were made to the measurement location (e.g., point 4c was added). Furthermore, measurements were made an additional 300 m away (points 1+ and 4c+) to see if the pollutant concentration levels could still be measured.
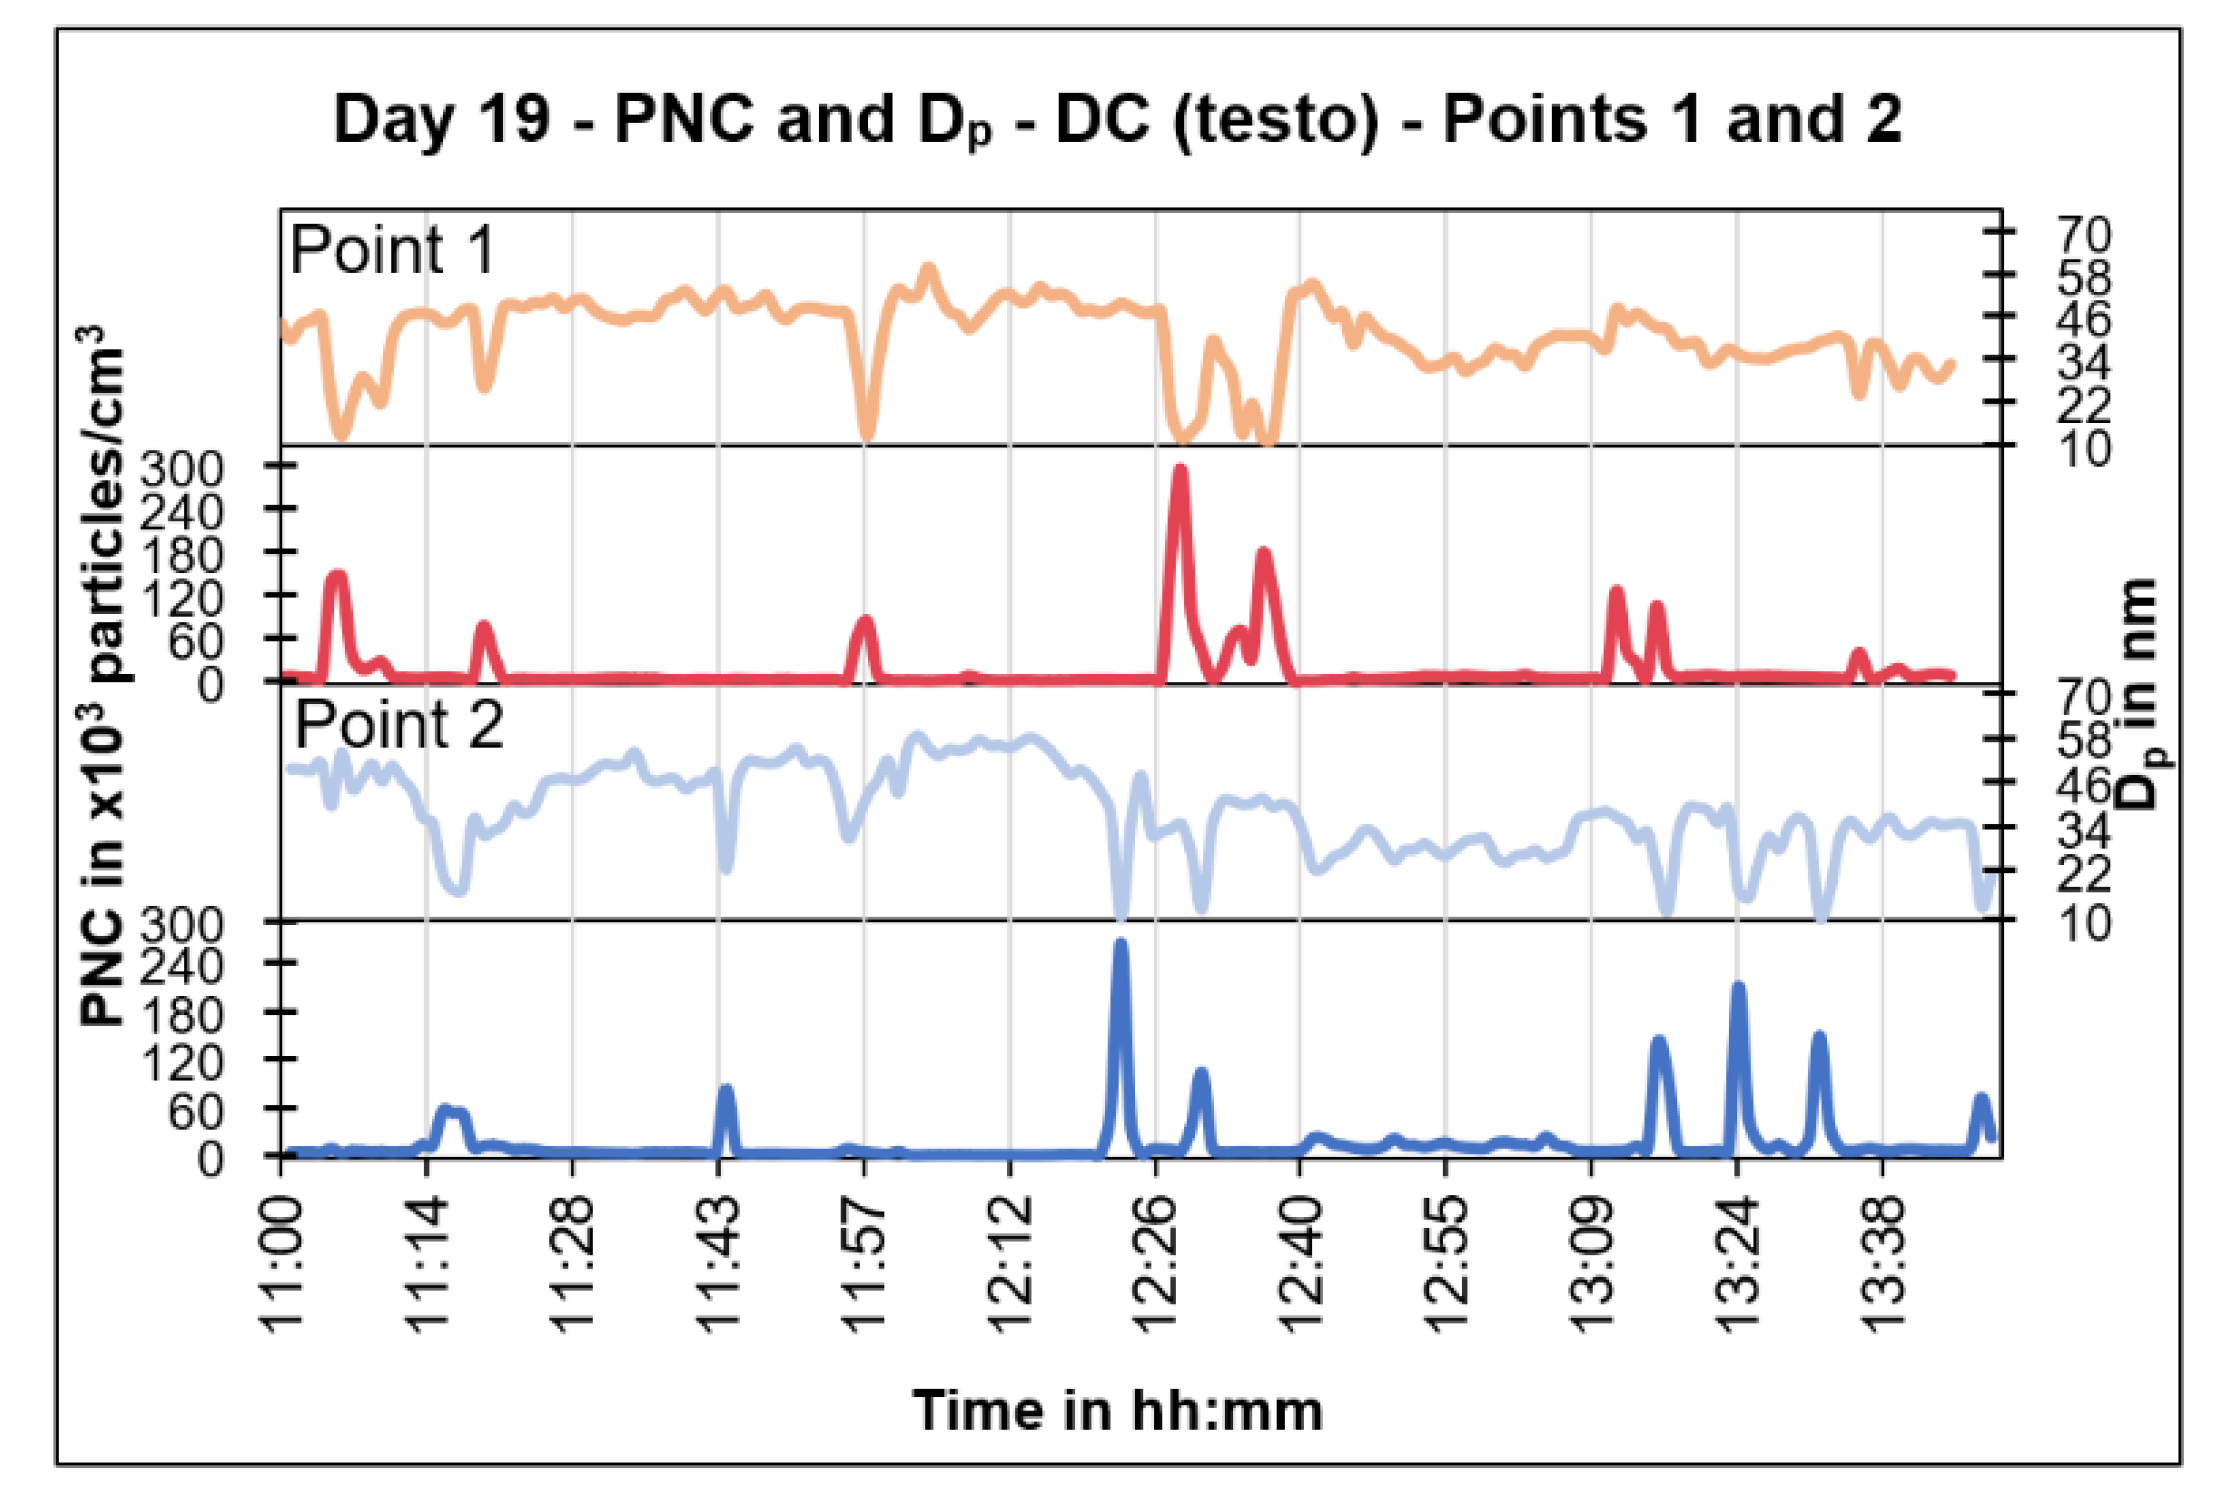
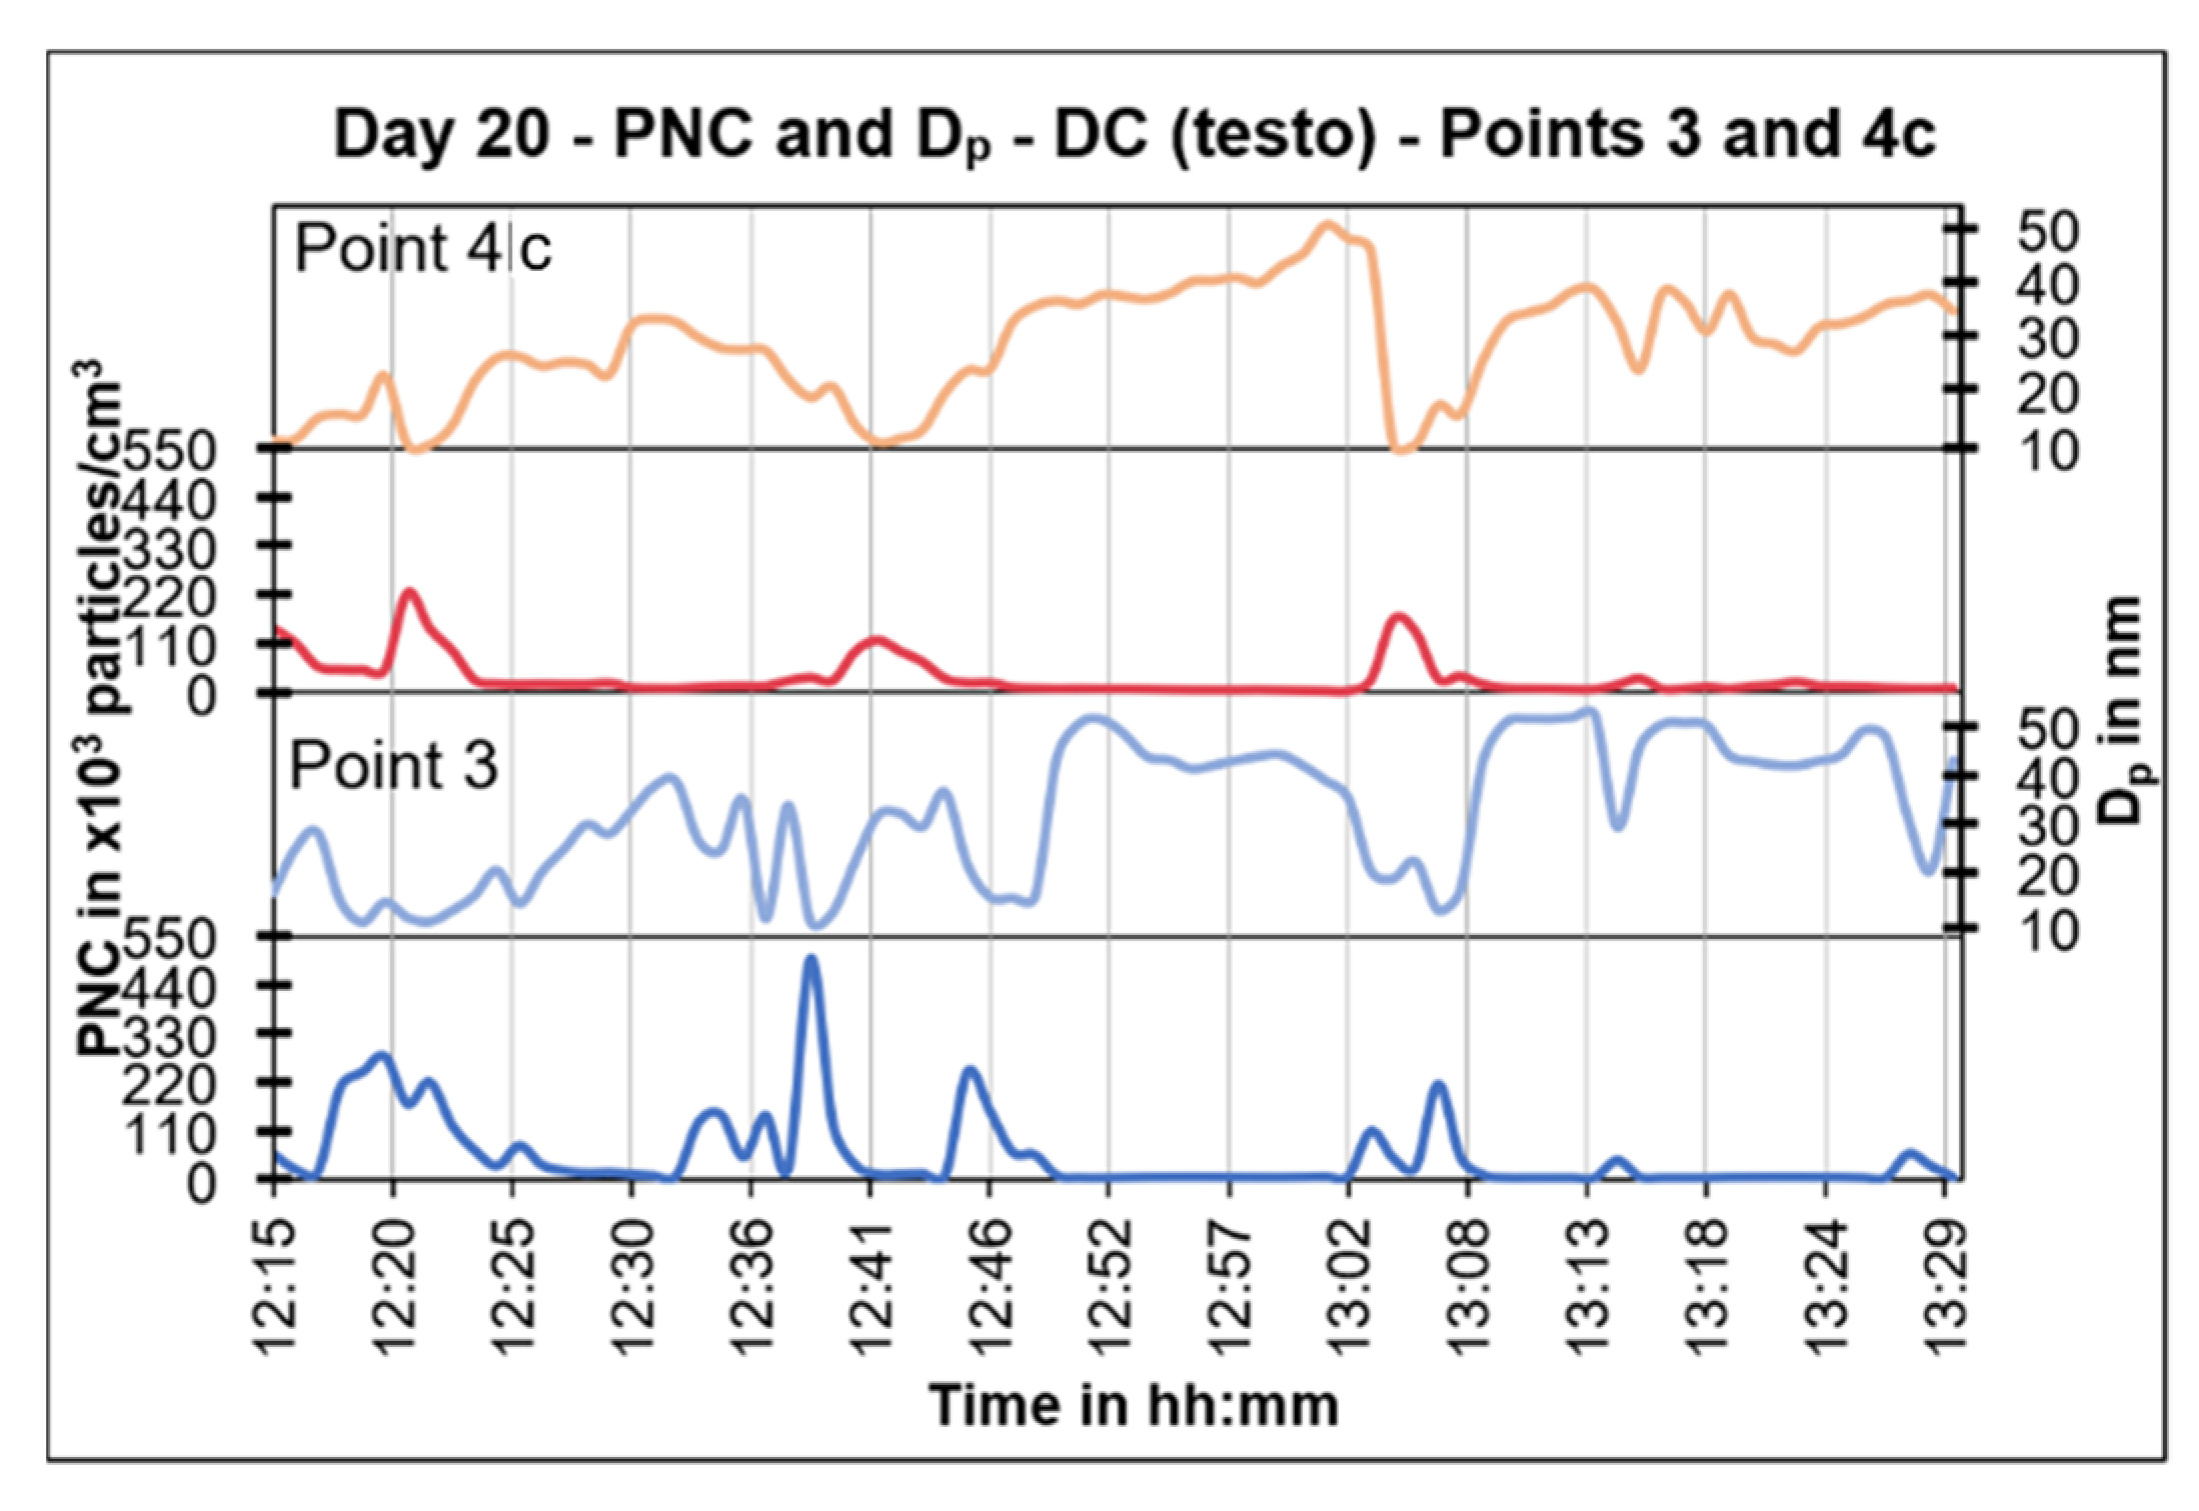
The results of the PNC and Dp measurements made in parallel at points 1 and 2 are shown in Figure 15. The similar peaks show that the UFP concentrations measured directly at the airport can also be measured nearly two kilometres away. There was a one-to-two-minute lag time between when the planes flew overhead and when the particles were measured at the location further from the airport due to the aircrafts being at a higher altitude when further away. Additionally, not all the same PNC peaks were measured at both locations due to dispersion from changing wind directions. After 12:20 CEST, the point 1 measurement location was moved to point 1+, which is 300 m further away and at the border of a residential area. Elevated UFP concentration levels could still be measured there, i.e., 2.1 km away from the runway.
The same trends were seen on day 20 (Figure 16) when the east side of the airport was measured. However, the PNC peaks were higher at point 3 than at point 2 which could be due to the fact that point 3 was closer to the runway and thus the planes were at a lower altitude. In turn, the levels were lower at point 4c than at point 2, as point 4c is located at a greater distance away (2.7 km). At 13:20 CEST, the measurement location was changed to point 4c+, which is 300 m further than point 4c, but no distinct UFP concentration peaks were measured there (not shown in diagrams).
While not all the peaks were measured at both locations, it may be of even of greater importance to observe that similar concentration levels were still detectable at ground level.

3.1.3. Particle Mass Concentrations

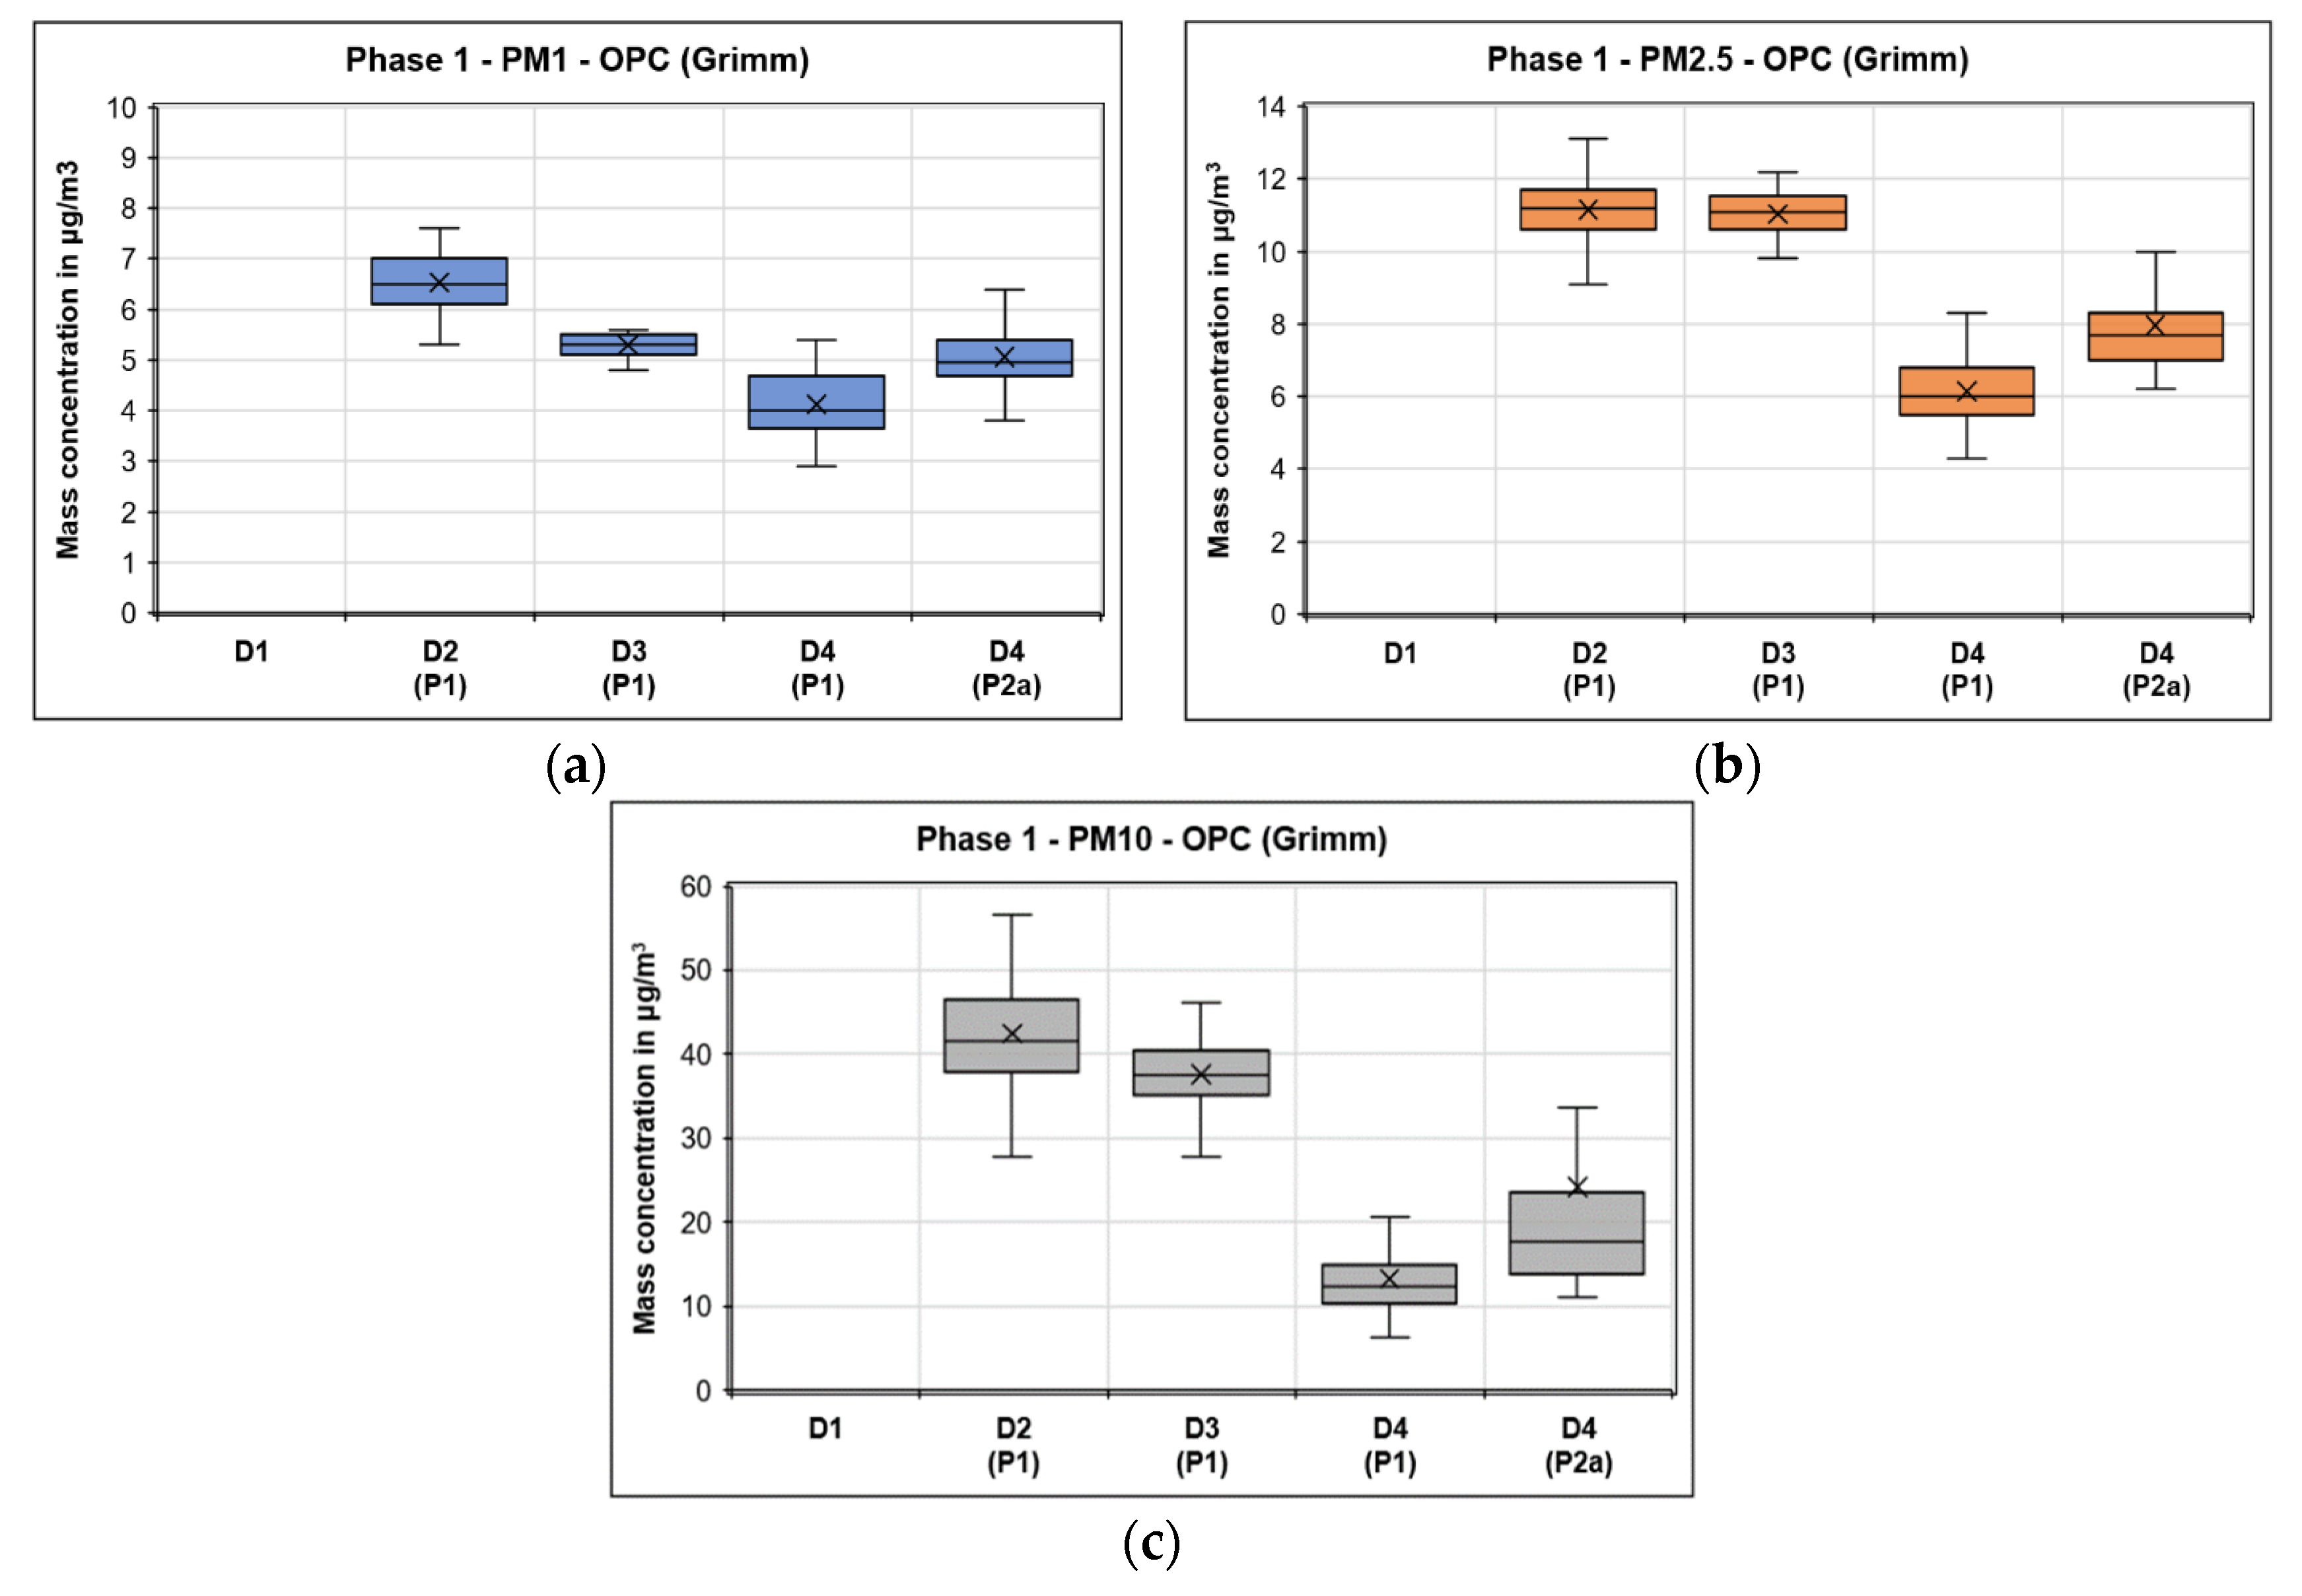
All results presented in this subchapter were measured with OPCs, measuring the fine dust fractions in the size range from 0.3 to 20 µm. In phase 1, all PM fractions (PM1, PM2.5, PM10) showed higher concentrations on days 2 and 3 (D2 and D3) when there were lower wind speeds from the north and north-eastern directions. They then decreased on day 4 due to lower emissions occurring generally on a Sunday. Due to device issues, no data were recorded on day 1. The mass concentration results of PM1, PM2.5, and PM10 for phase 1 measurements (day 1 to day 4) are shown in Figure 17a–c, respectively.
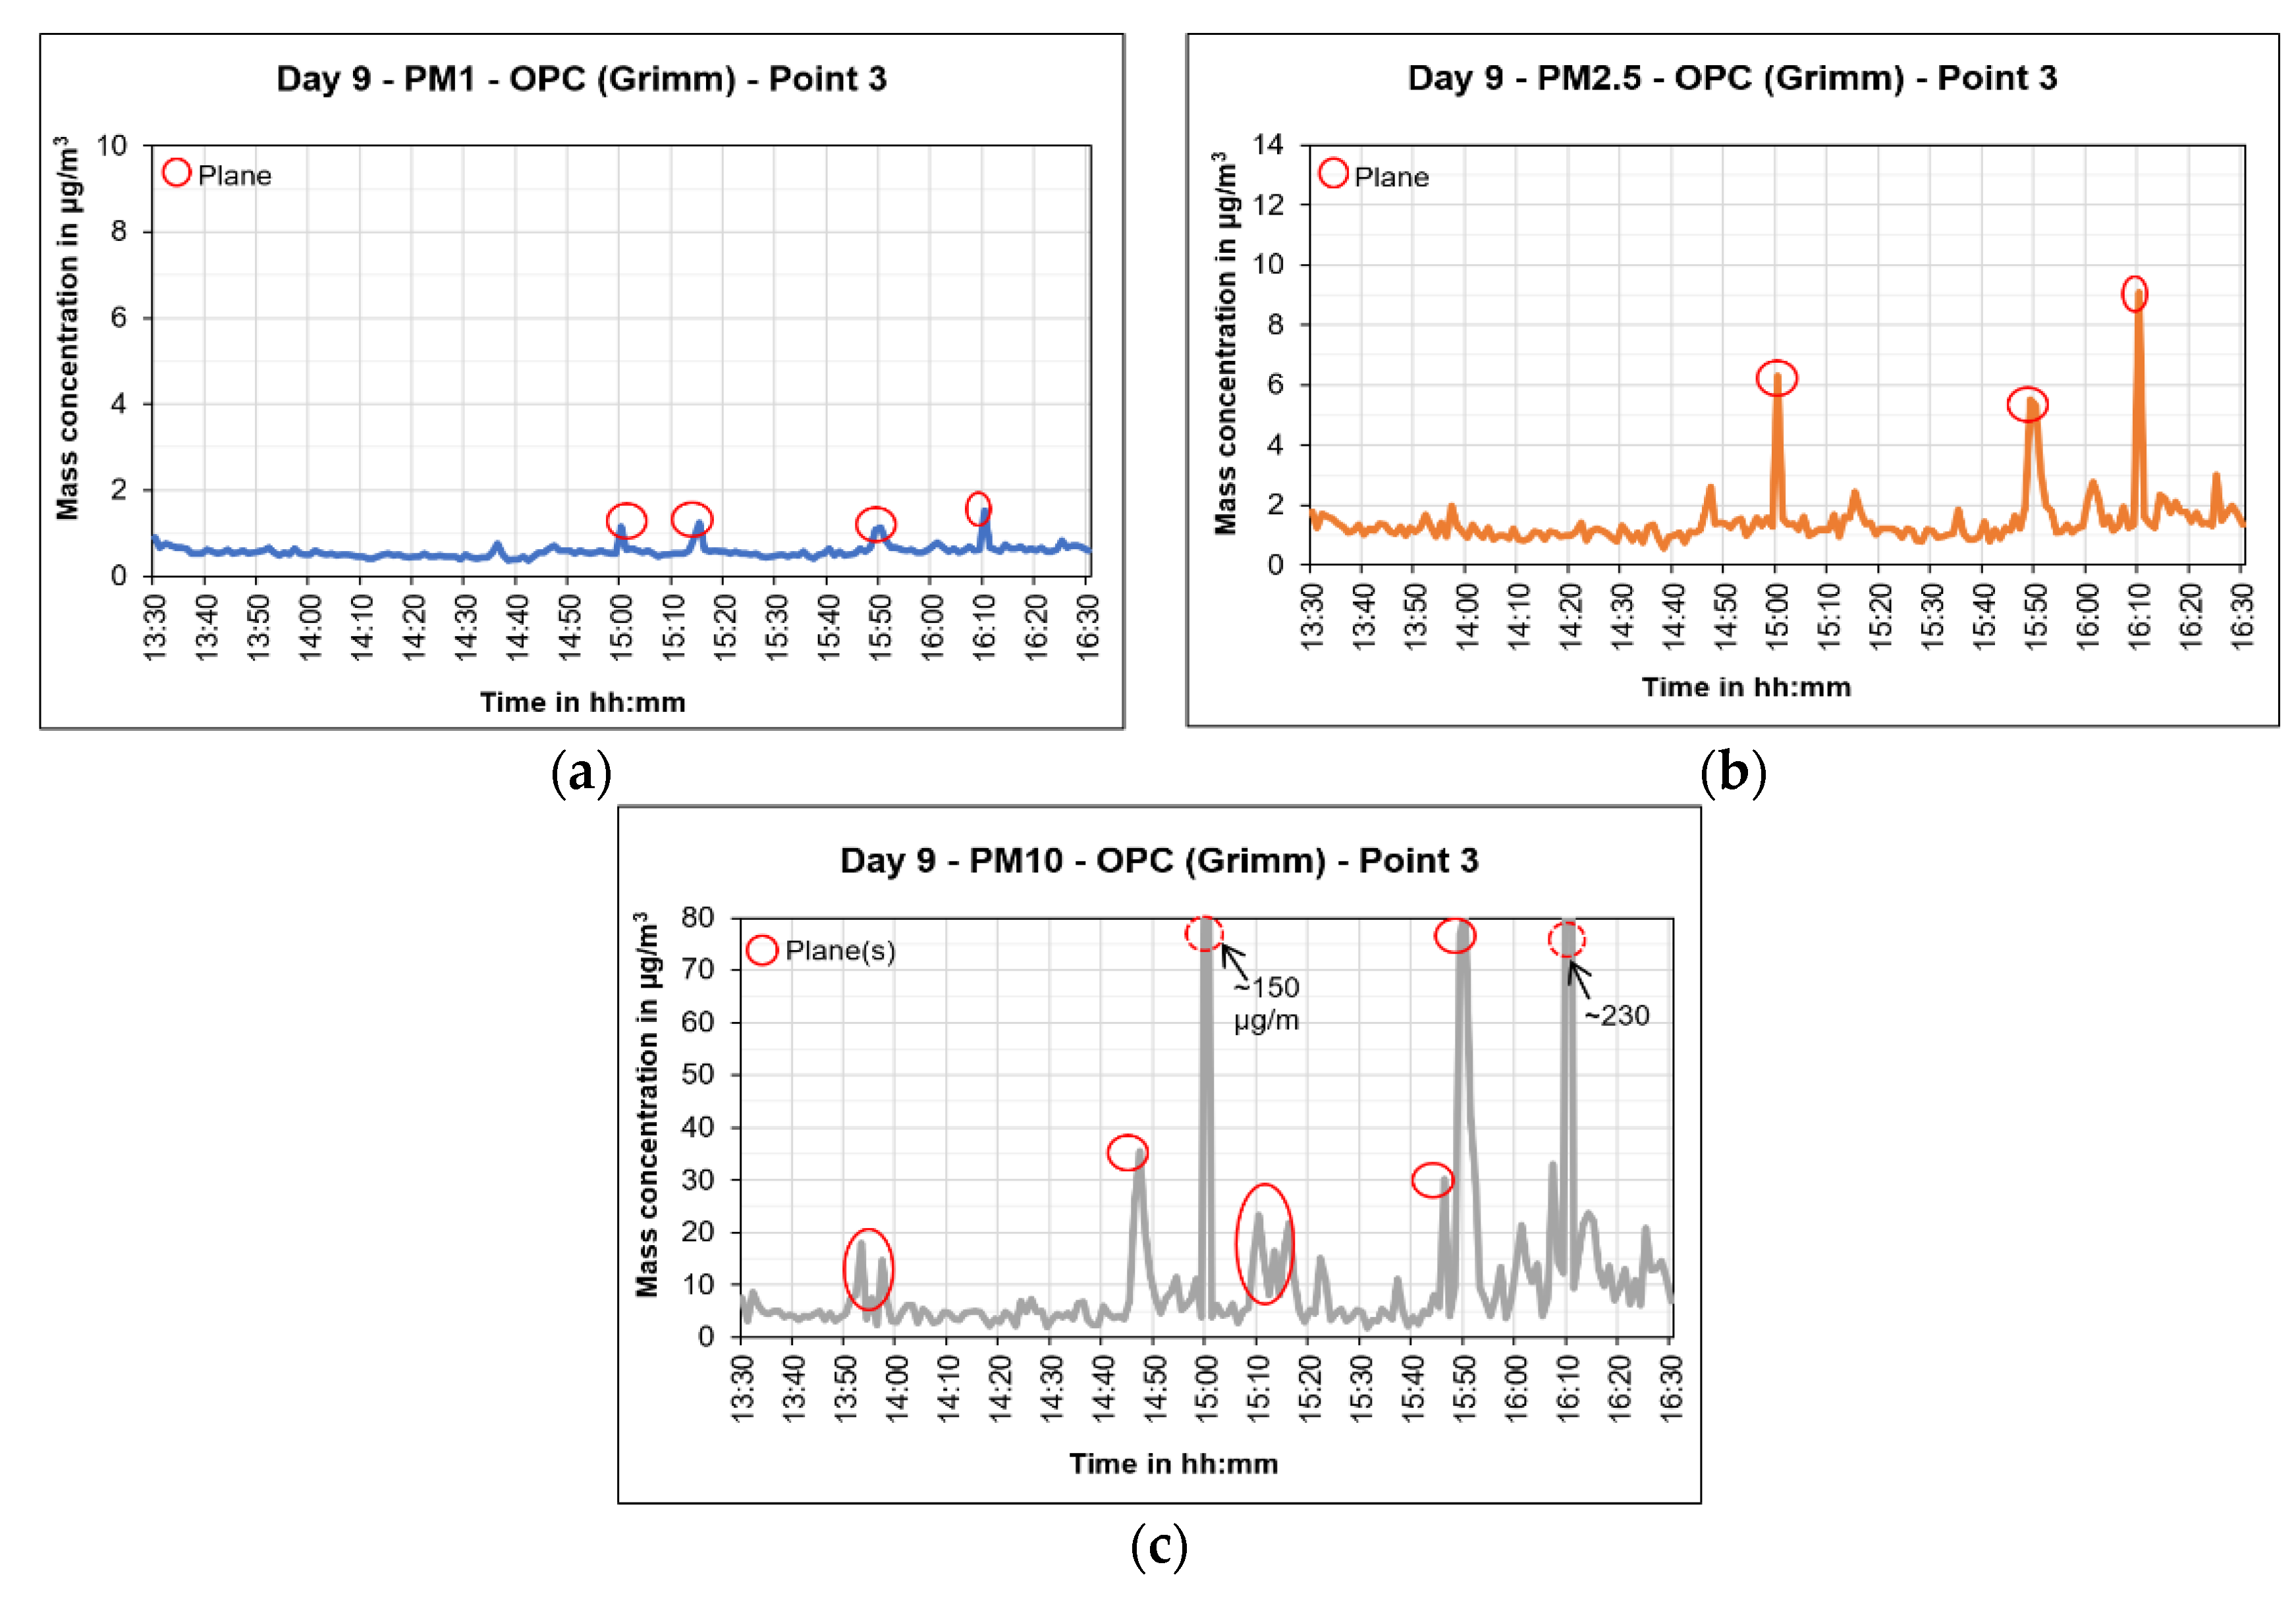
In phase 2, there were frequent periods of rain which could explain why the baseline concentrations were lower than those during phase 1. On day 9, 30 flights were measured at point 3 with most of the peaks measured being PM10. The additional peaks from PM10 not linked to a flight time could be due to agriculture activity in the surrounding area or particles left over from the construction which occurred a few days prior. Figure 18a–c shows the results of PM1, PM2.5, and PM10 mass concentrations, respectively, for day 9 of the measurement campaign.
In phase 3, the PM mass concentrations were moderately higher than those in phase 2. The PM1, PM2.5, and PM10 mass concentration results from one of the phase 3 days, i.e., day 14 at point 3 are shown in Figure 19a–c, respectively. It can be seen that the baseline PM concentration was higher on day 14 as compared to that on day 9. However, the peak concentrations caused by the flights were relatively similar for both days. The missing data in Figure 19 were due to battery issues with the device.

3.1.4. Black Carbon

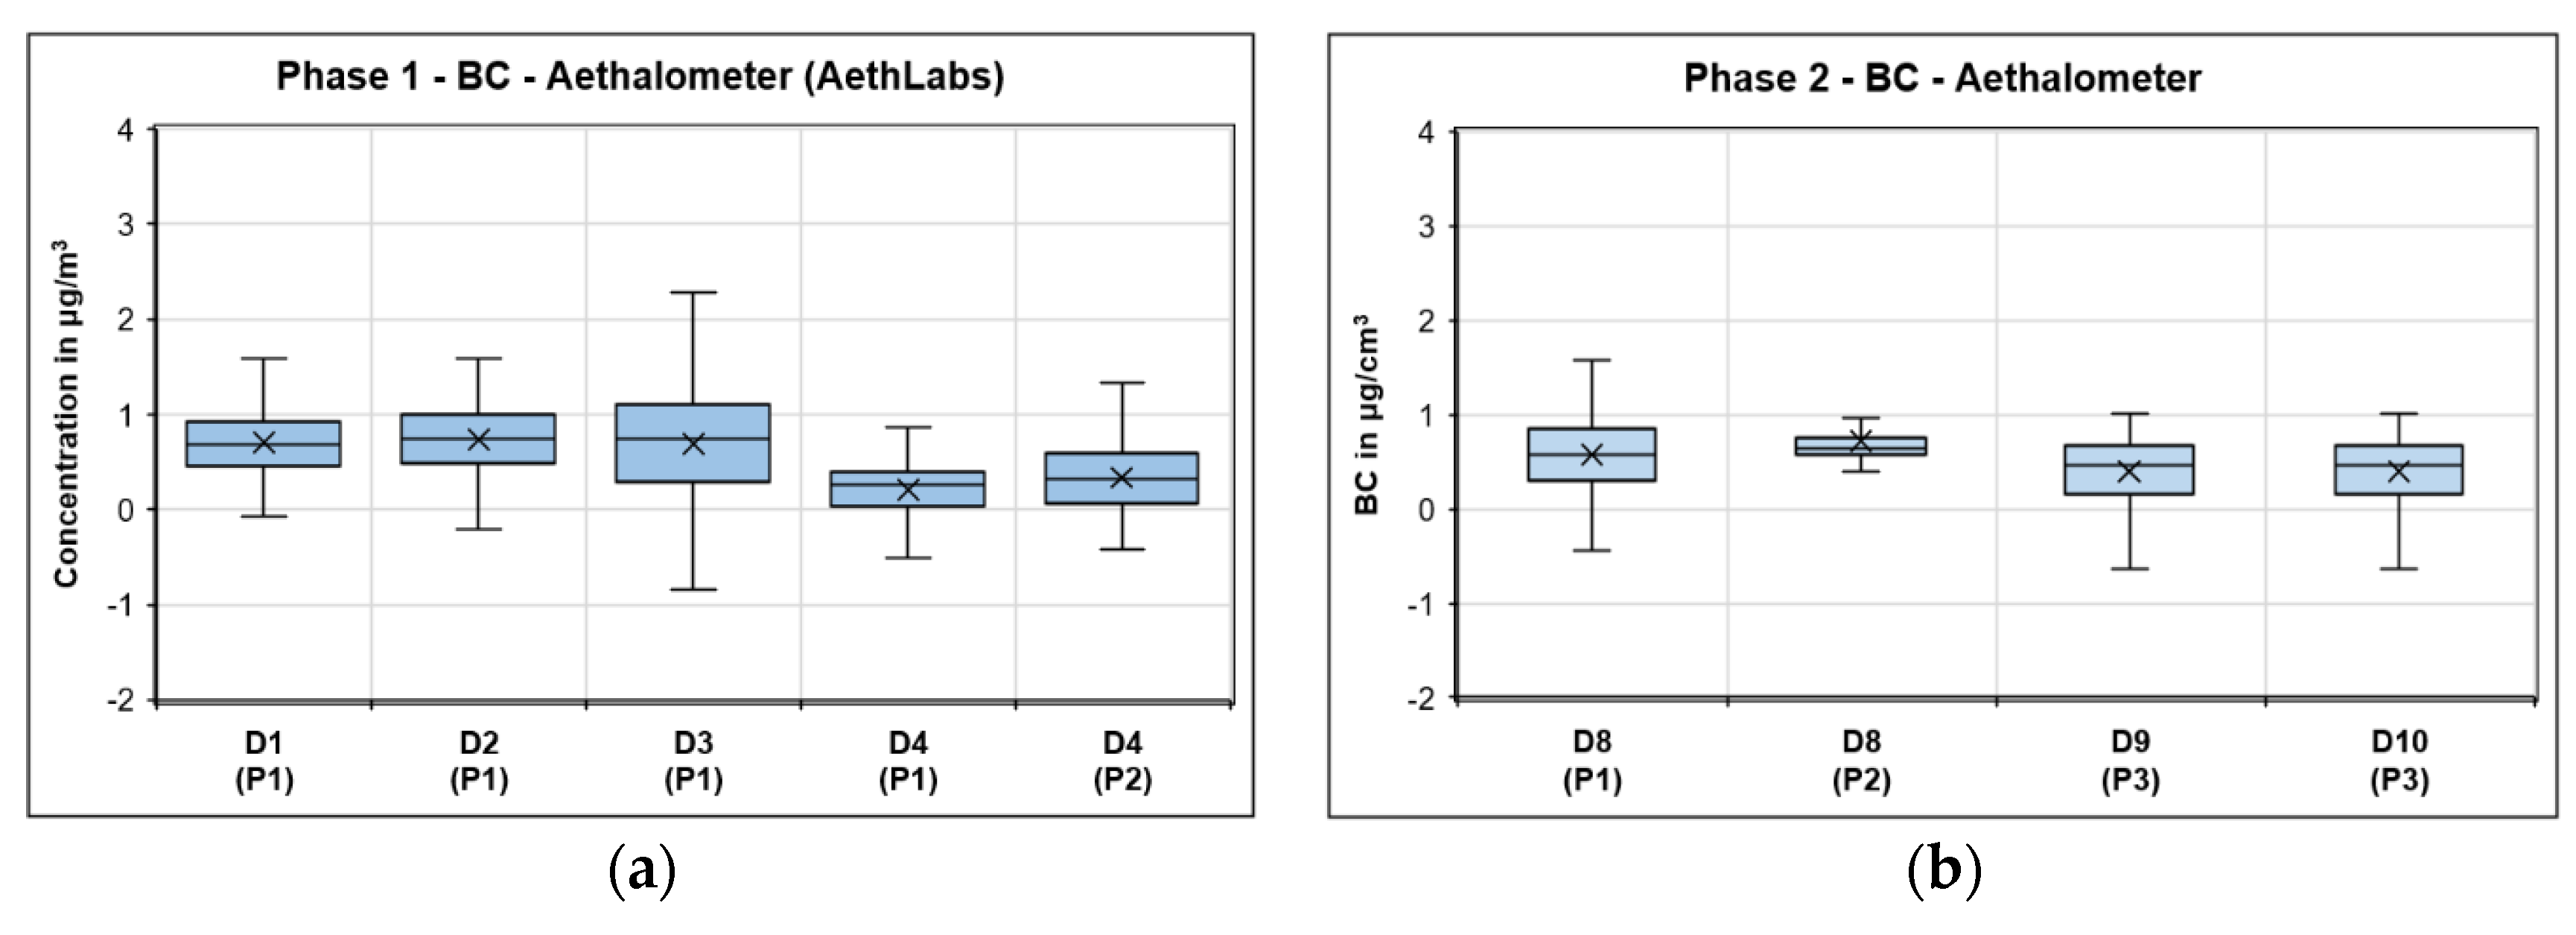
In phase 1, the BC levels (Figure 20a) remained low with the median concentration below 1 μg/m3 on all days. Since the actual BC concentrations with this measurement device are most closely represented when the recorded values are averaged, it was of interest to analyse the data every minute, so no further averaging was performed to smooth the concentration values. In phase 2, no major peaks were measured, and the BC values were similar to those from the baseline measurements with little variation (Figure 20b). These results are consistent with other studies that also measured a minimal influence from air traffic [6,7].
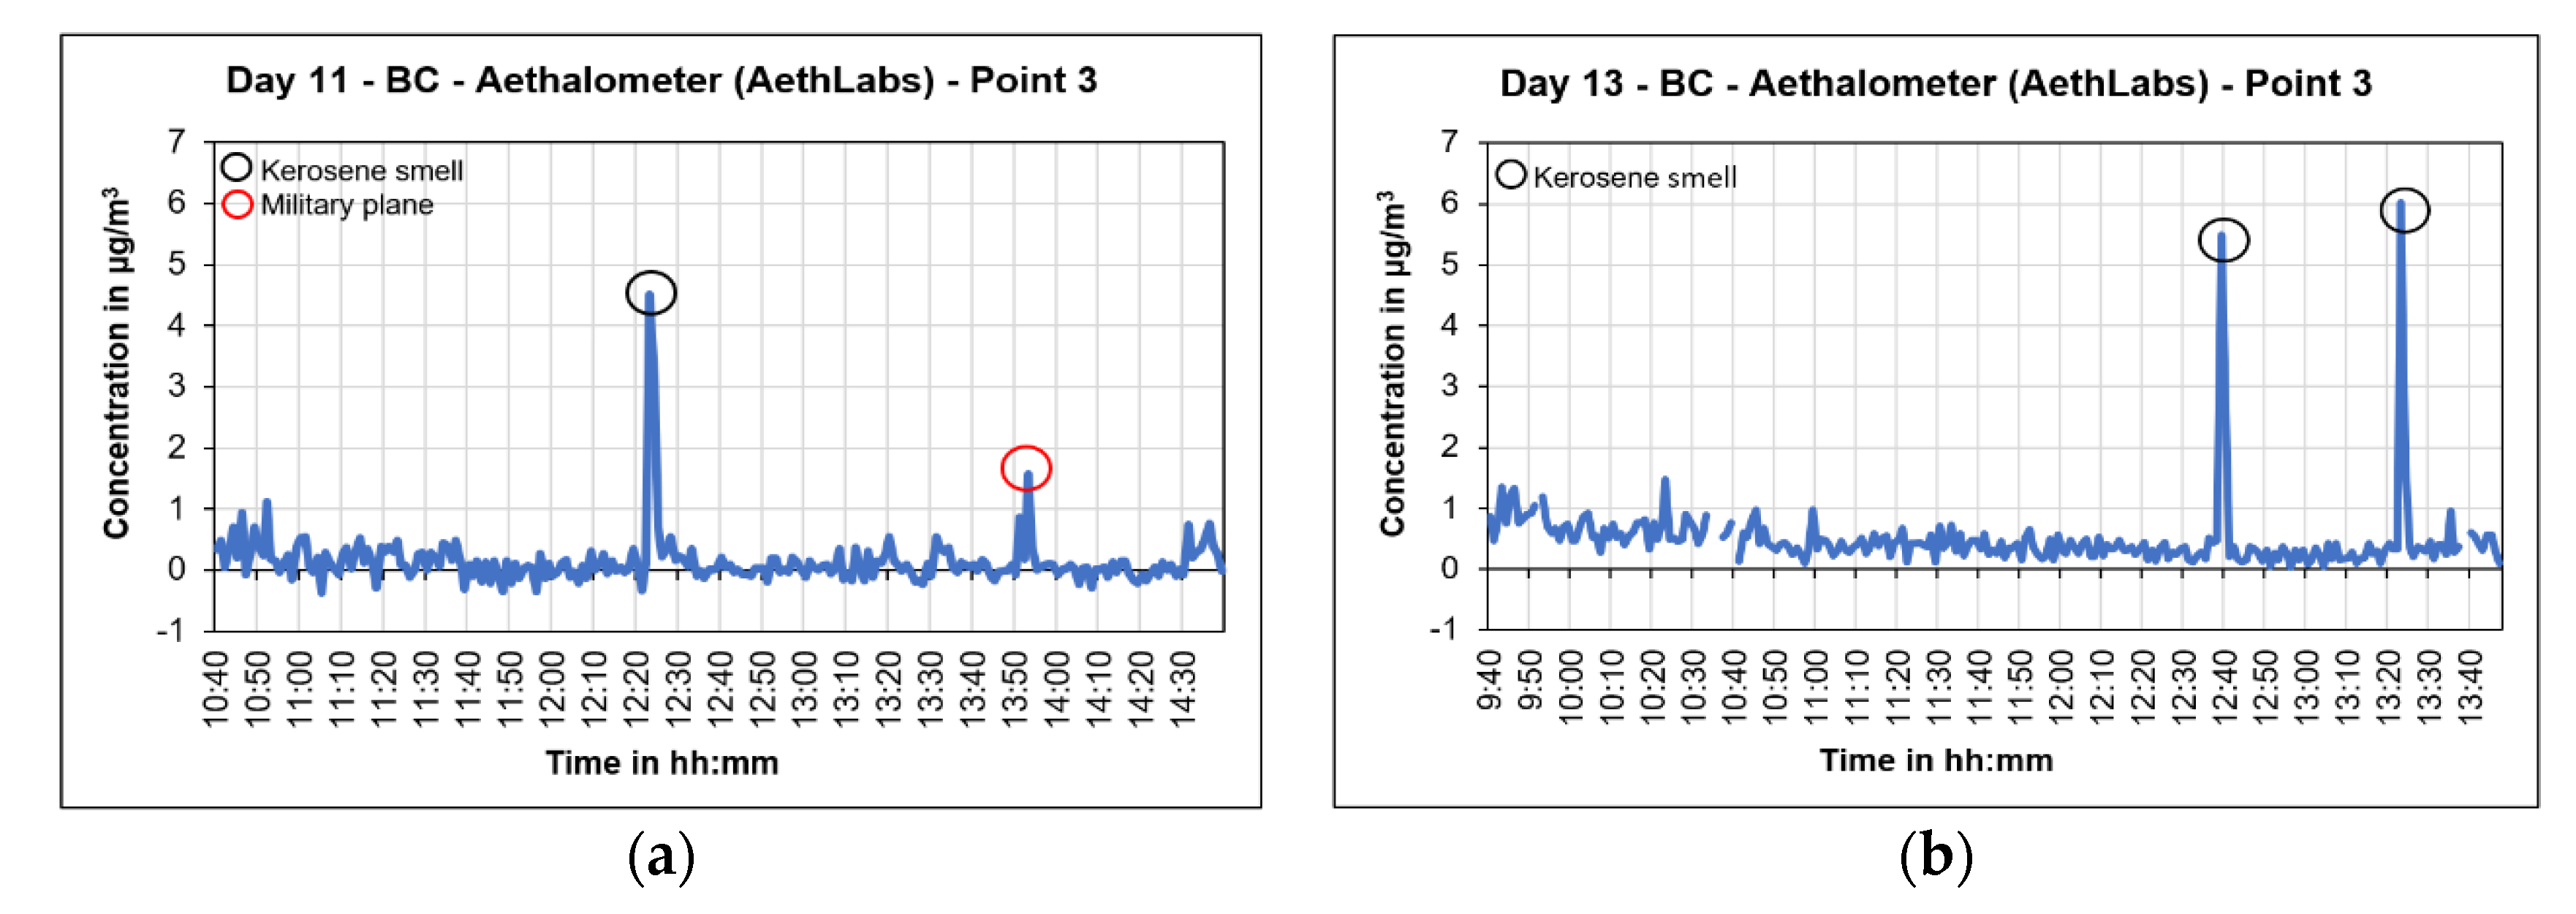
In phase 3, three BC peaks resulted from strings of three to five large commercial aircrafts landings within two minutes. At the same time, a strong smell of kerosene was noted when the BC peaks occurred. The peaks could have been from high concentrations of emissions being released in a short amount of time or from other activity taking place at the airport (BC emissions from diesel-driven electric generators while refuelling aircrafts). The BC concentrations for day 11 and day 13 at point 3 are shown in Figure 21a,b, respectively.

3.1.5. Nitrogen Oxides (NO and NO2)

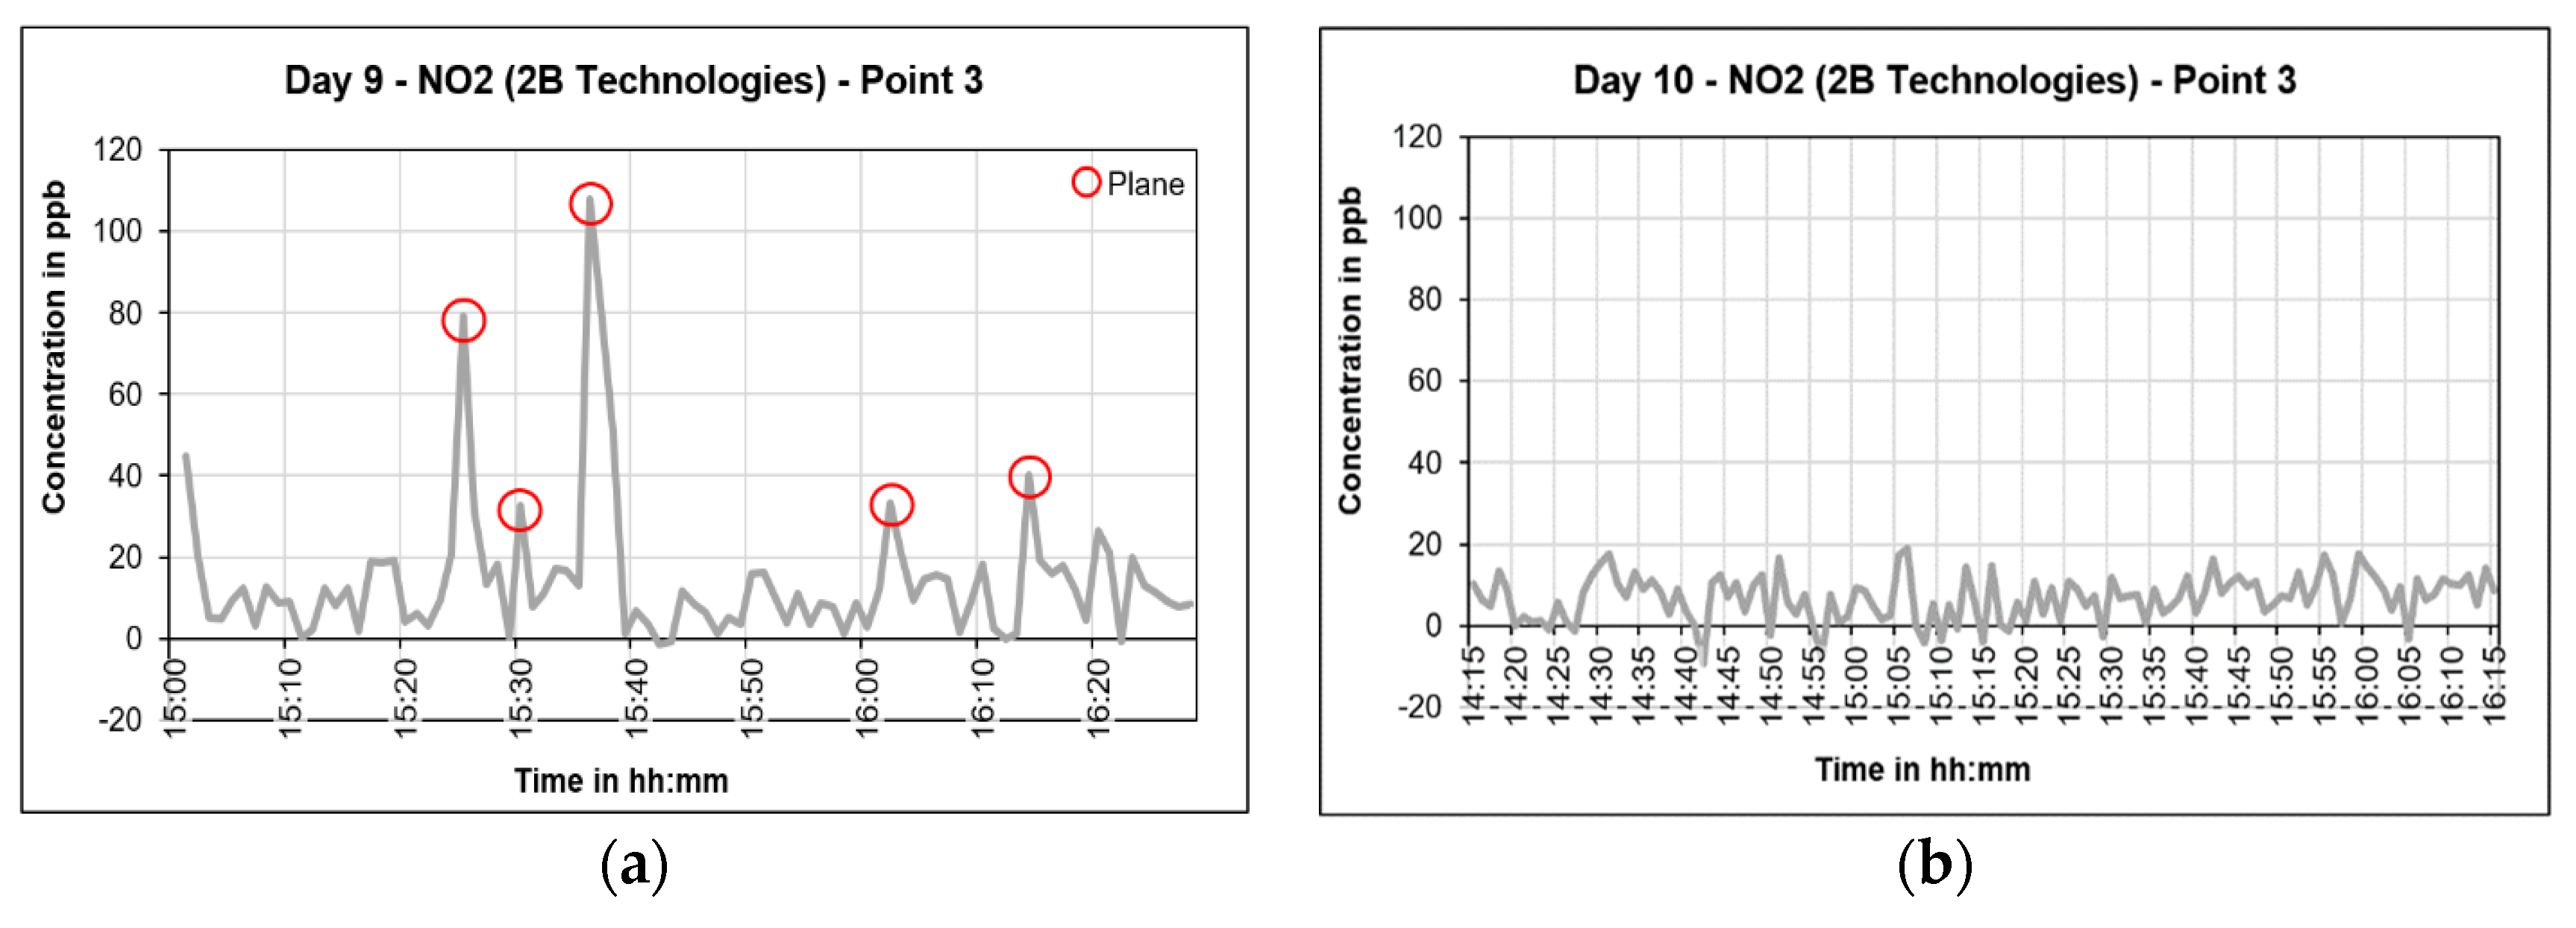
The NOx monitor was introduced in phase 2 starting on day 9 (Figure 22a) with five peaks being measured from the aircrafts. The inconsistent wind direction on day 10 (Figure 22b) likely negatively affected the NO2 measured and no significant peaks were observed on that day.
During phase 3, the NO and NO2 peaks from aircrafts on nine of the ten days could be measured. The levels were similar to those in phase 2 and in only two instances were the concentrations above 120 ppb; all other peaks caused by aircrafts were quite moderate. Figure 23a shows that on day 14, there were NO and NO2 peaks throughout the duration of the measurement, while on day 18 (Figure 23b), they were only captured towards the end of the measurement period due to the inconsistent wind direction.

3.2. Other Sources

This section will discuss measurements from other air pollutant sources, including vehicles on the nearby highway and tractors passing close to the measurement sites.

3.2.1. Freeway Measurements

Highway measurements were conducted to assess the degree of influence on the campaign measurements. For these measurements, the following instruments were in operation: OPC Model 1.108 (Grimm), DC DiSCmini (testo), and a combination of SMPS Nanoscan and OPS 3330 (TSI) devices.
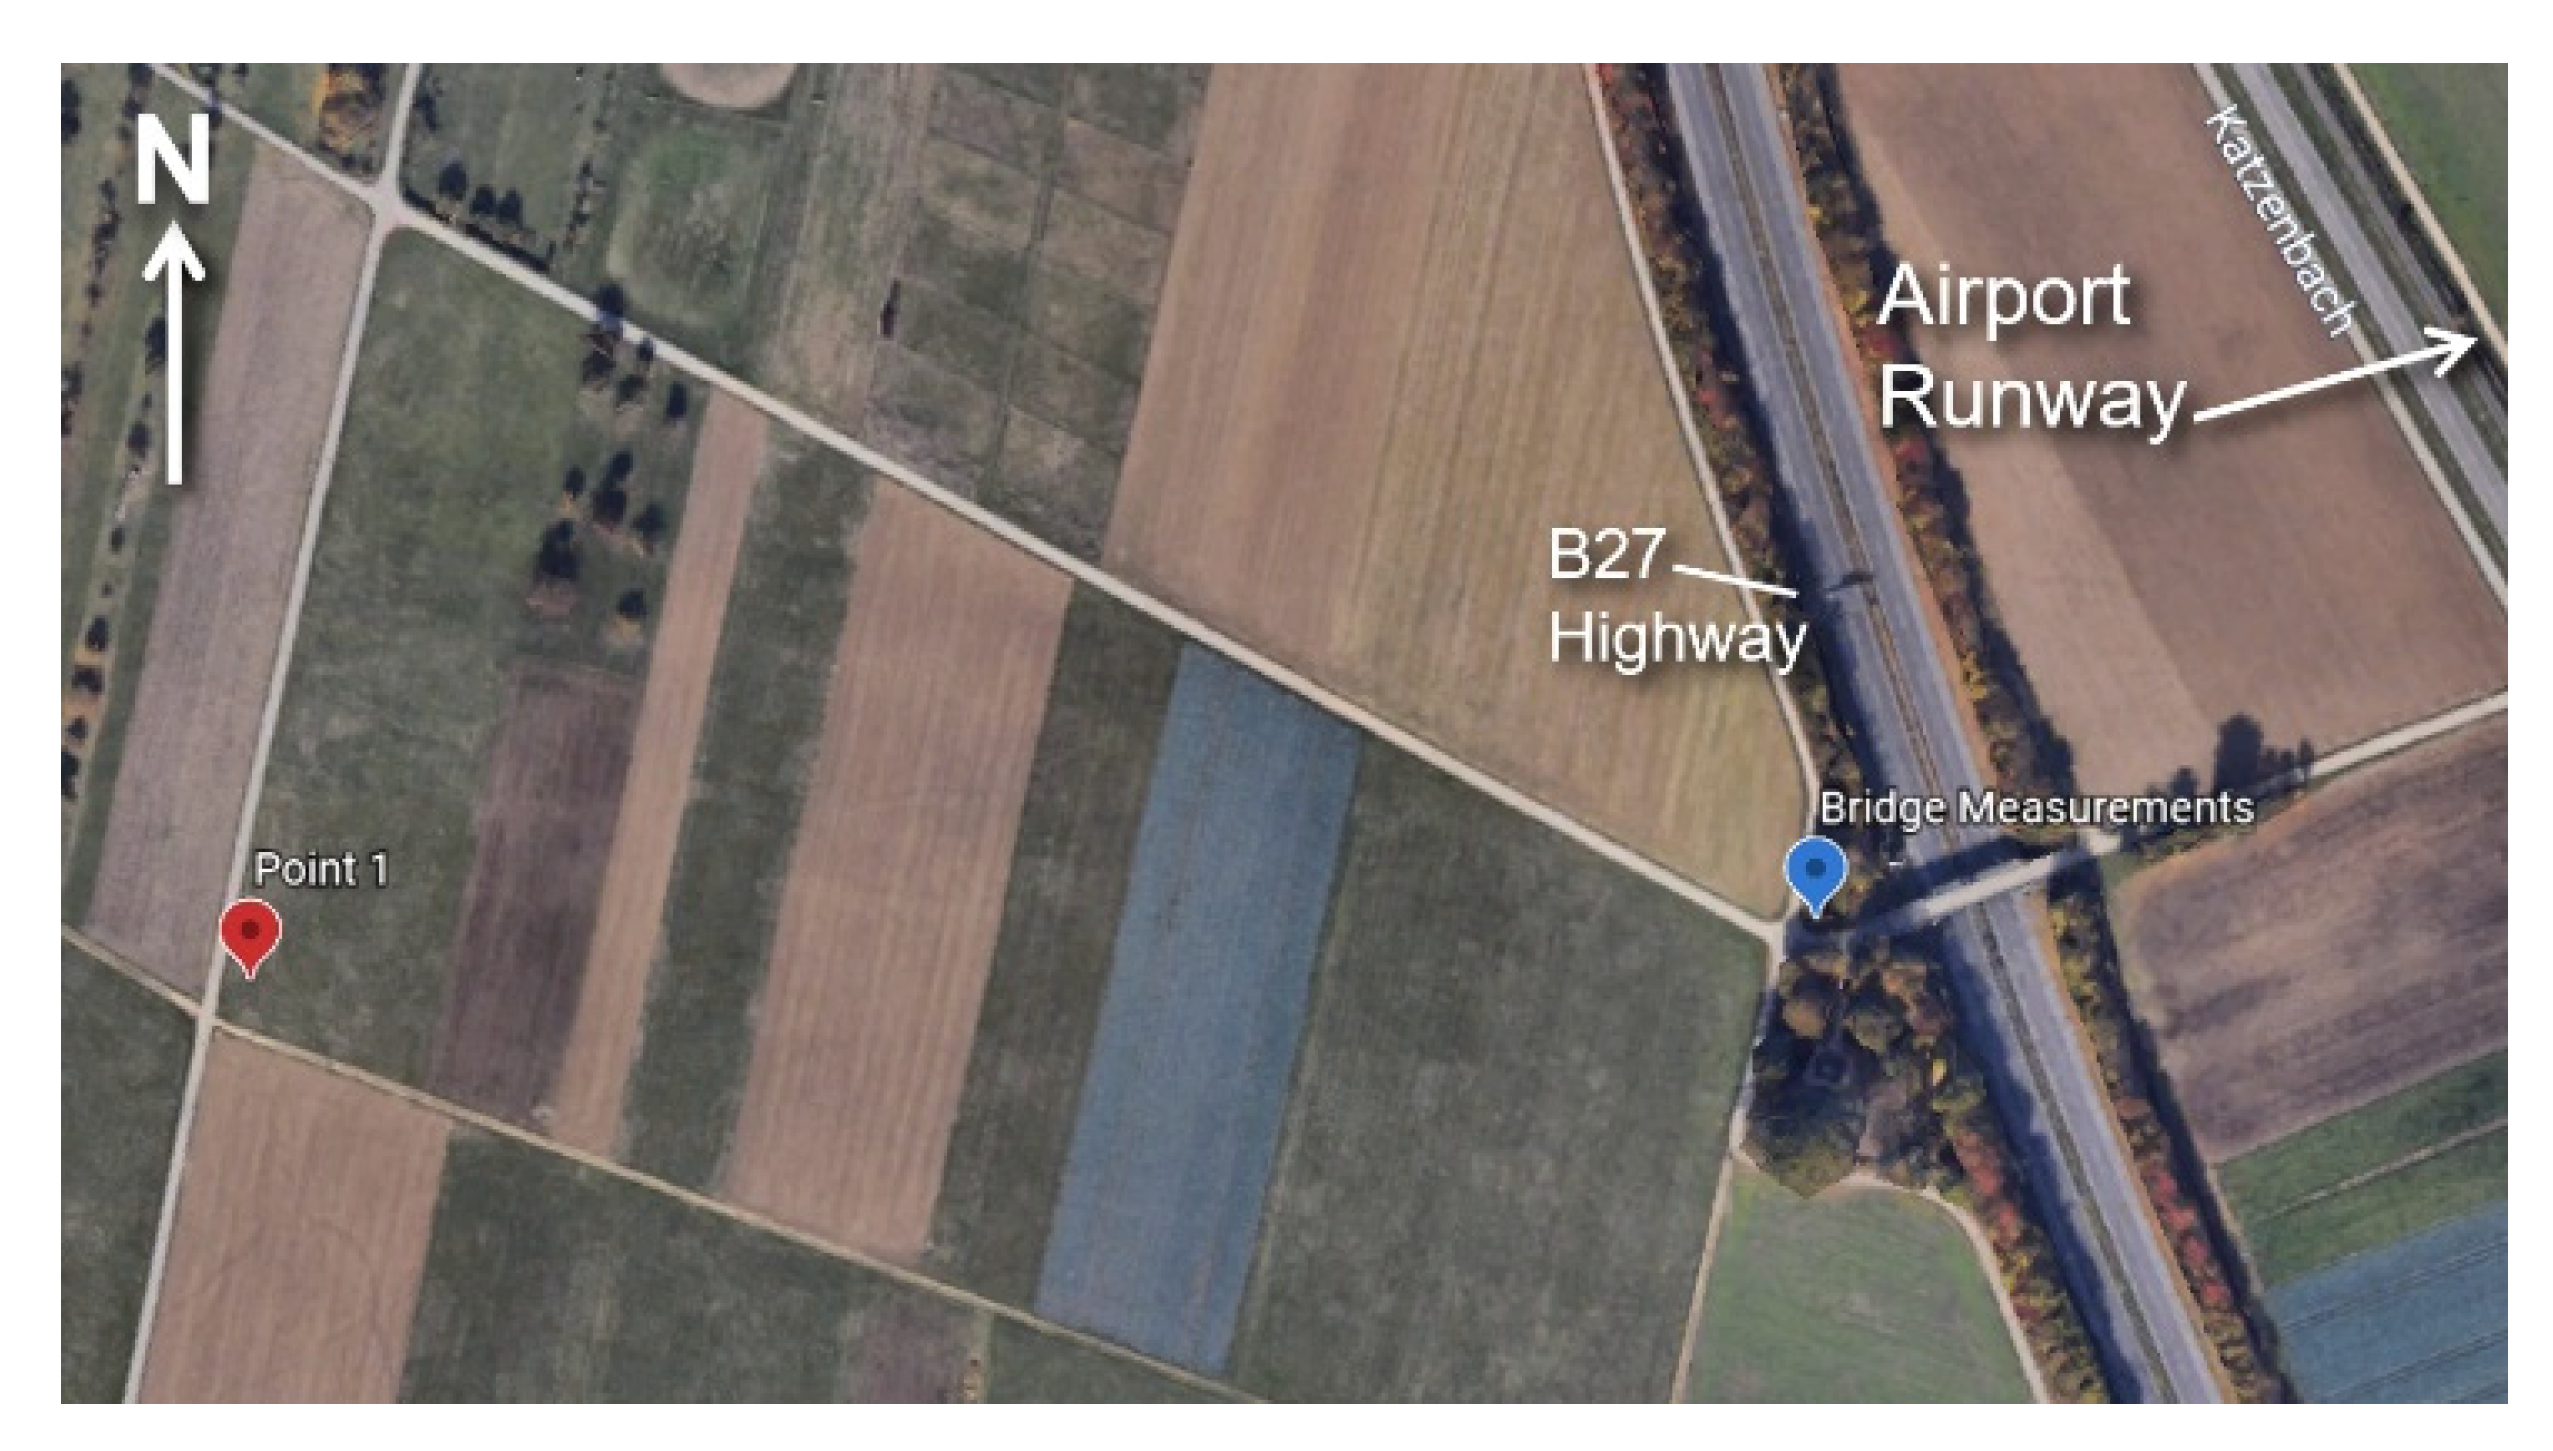
Measurements were made for an hour and a half just west of a bridge that crosses over the B27 highway 1.5 km away from the runway, as shown in Figure 24.
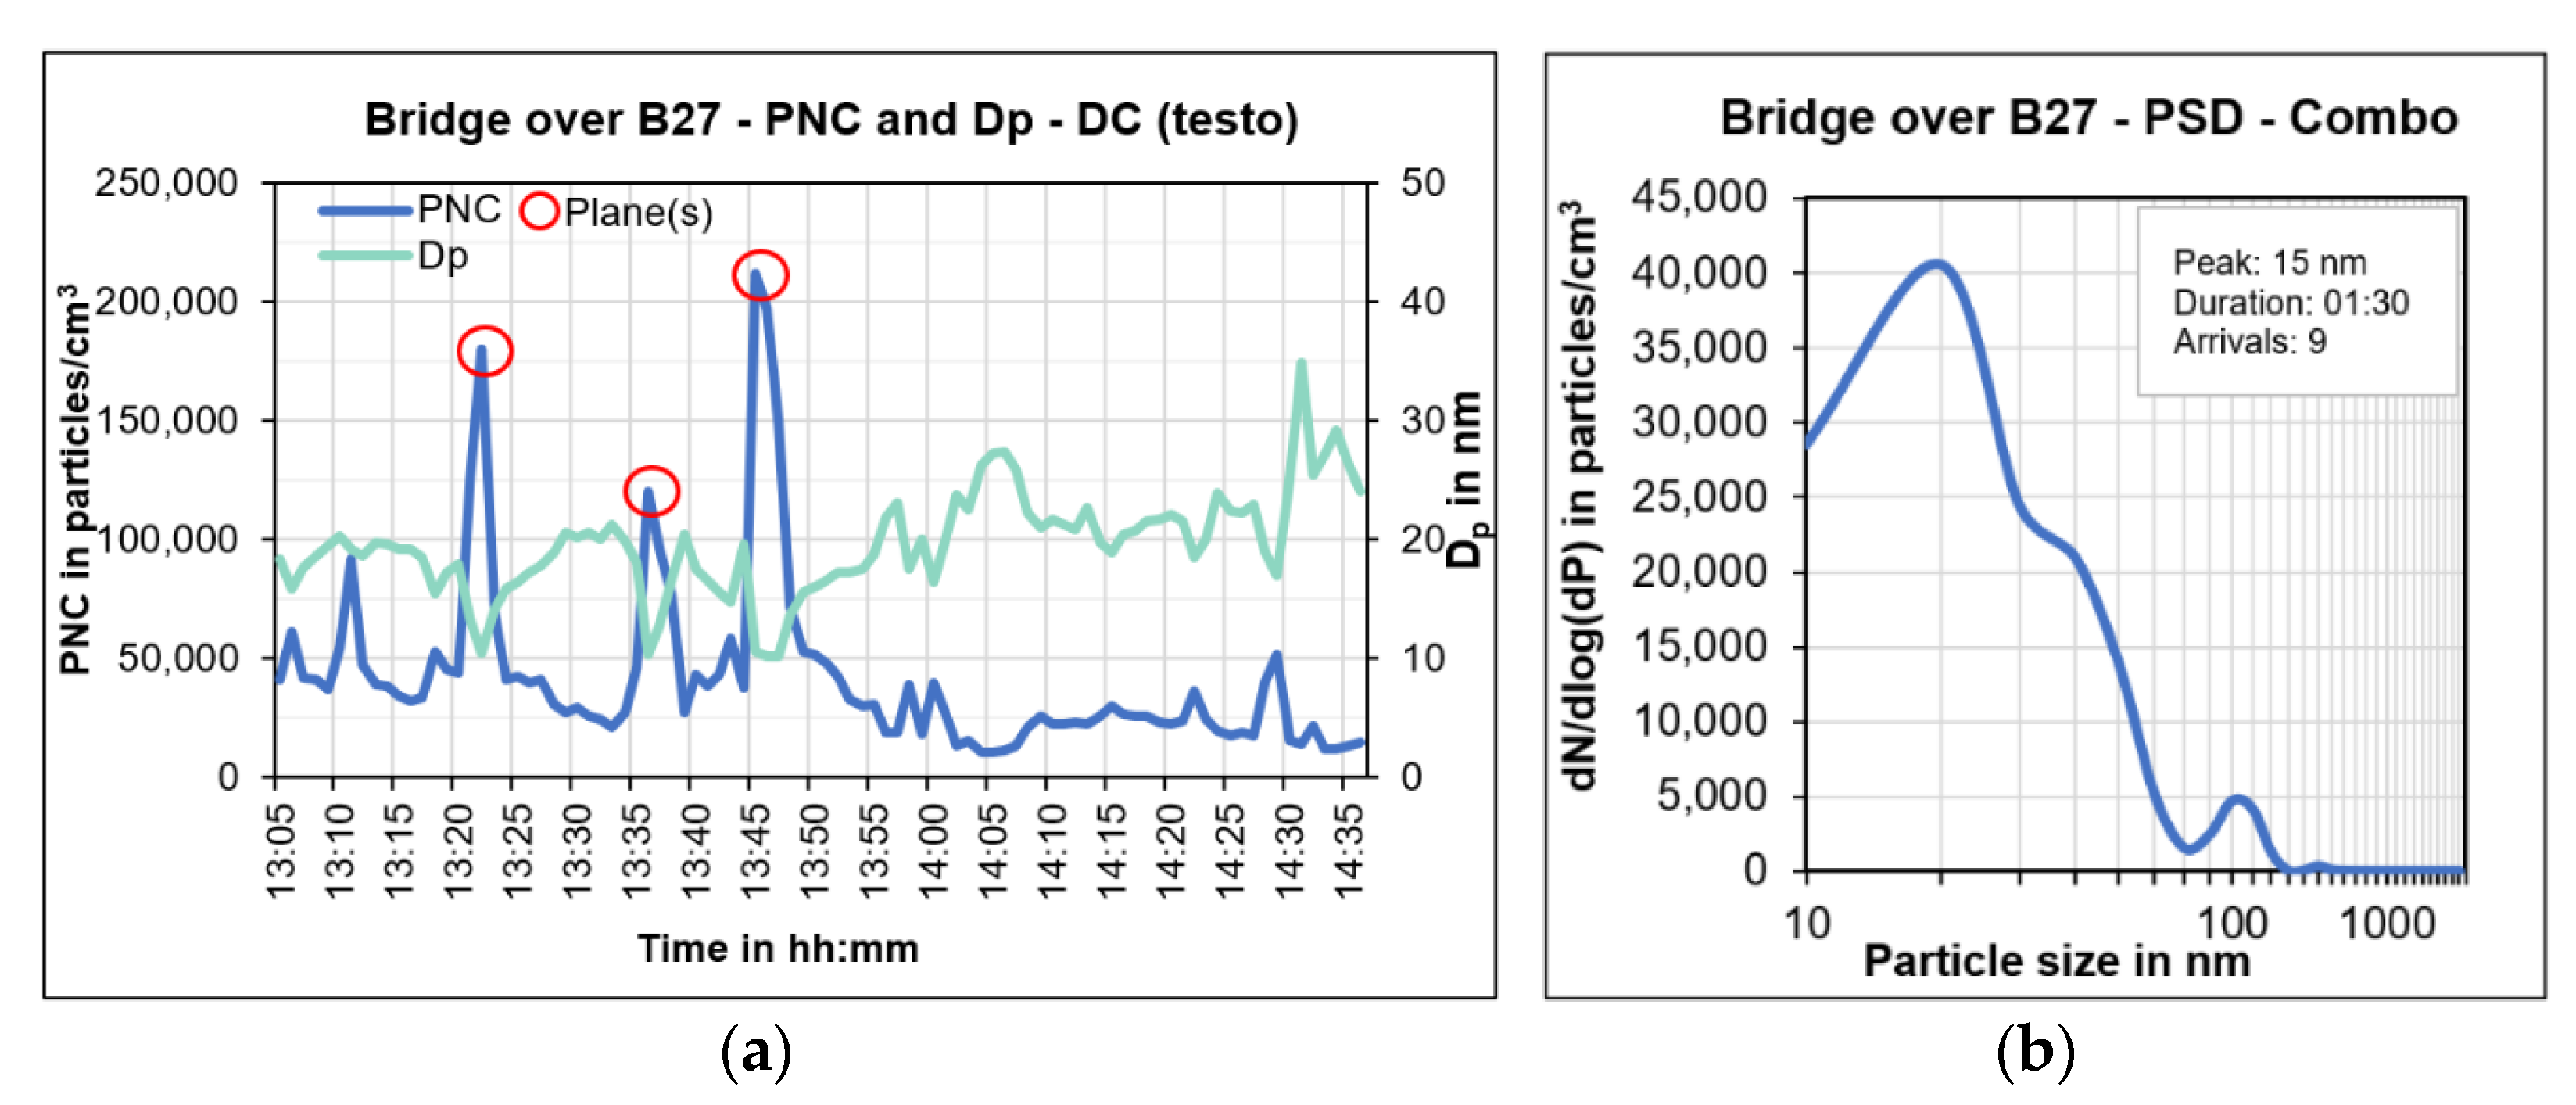
Figure 25a shows the PNC and Dp measured on the bridge over the federal highway B27 while Figure 25b shows the PSD at the same location. Several PNC peaks were measured but the peaks from planes were distinguishable by the corresponding decrease in the Dp to 10 nm (the minimum possible particle size that can be measured by the instrument). Other peaks corresponded to vehicles passing within a close proximity, but the Dp remained above 15 nm. After 13:50 CEST, no more flights arrived, and the PNC decreased and the Dp increased. The PSD peak was 15 nm (Figure 25b), which is greater than those on all airport measurement days in phase 3. This supports the results from Figure 25a which shows that the Dp from passing vehicles is above 15 nm. While other previous studies have stated that the Dp from traffic should be larger than 20 nm [8,33,34], the results were likely influenced by the nearby airport. It would be beneficial to measure a highway some kilometres away from the airport.
The freeway results for PM concentration showed no significant peaks measured corresponding to planes or other sources as presented in Figure 26. After 13:50 CEST, when no further arrivals occurred, there was a slight overall decrease in all PM fractions, i.e., PM1, PM2.5, and PM10.

3.2.2. Tractors

During phase 3 in particular, tractors commonly passed by during measurements. This sometimes resulted in an elevated PNC peak, but the Dp measured was larger than that from aircrafts. On days 11 and 20, as shown in Figure 27a,b, respectively, the Dp from tractors ranged from 20 to 40 nm. The PNC peaks from the majority of the tractors were far less than those from planes and often were too small to be seen on the graphs.
The remainder of the tractor PNC and Dp peaks from phase 3 can be seen in Figure 28. While some peaks were elevated, the majority were under 100,000 particles/cm3 with the Dp levels ranging between 20 to 50 nm. Both factors differentiate the influence from aircrafts and tractors.
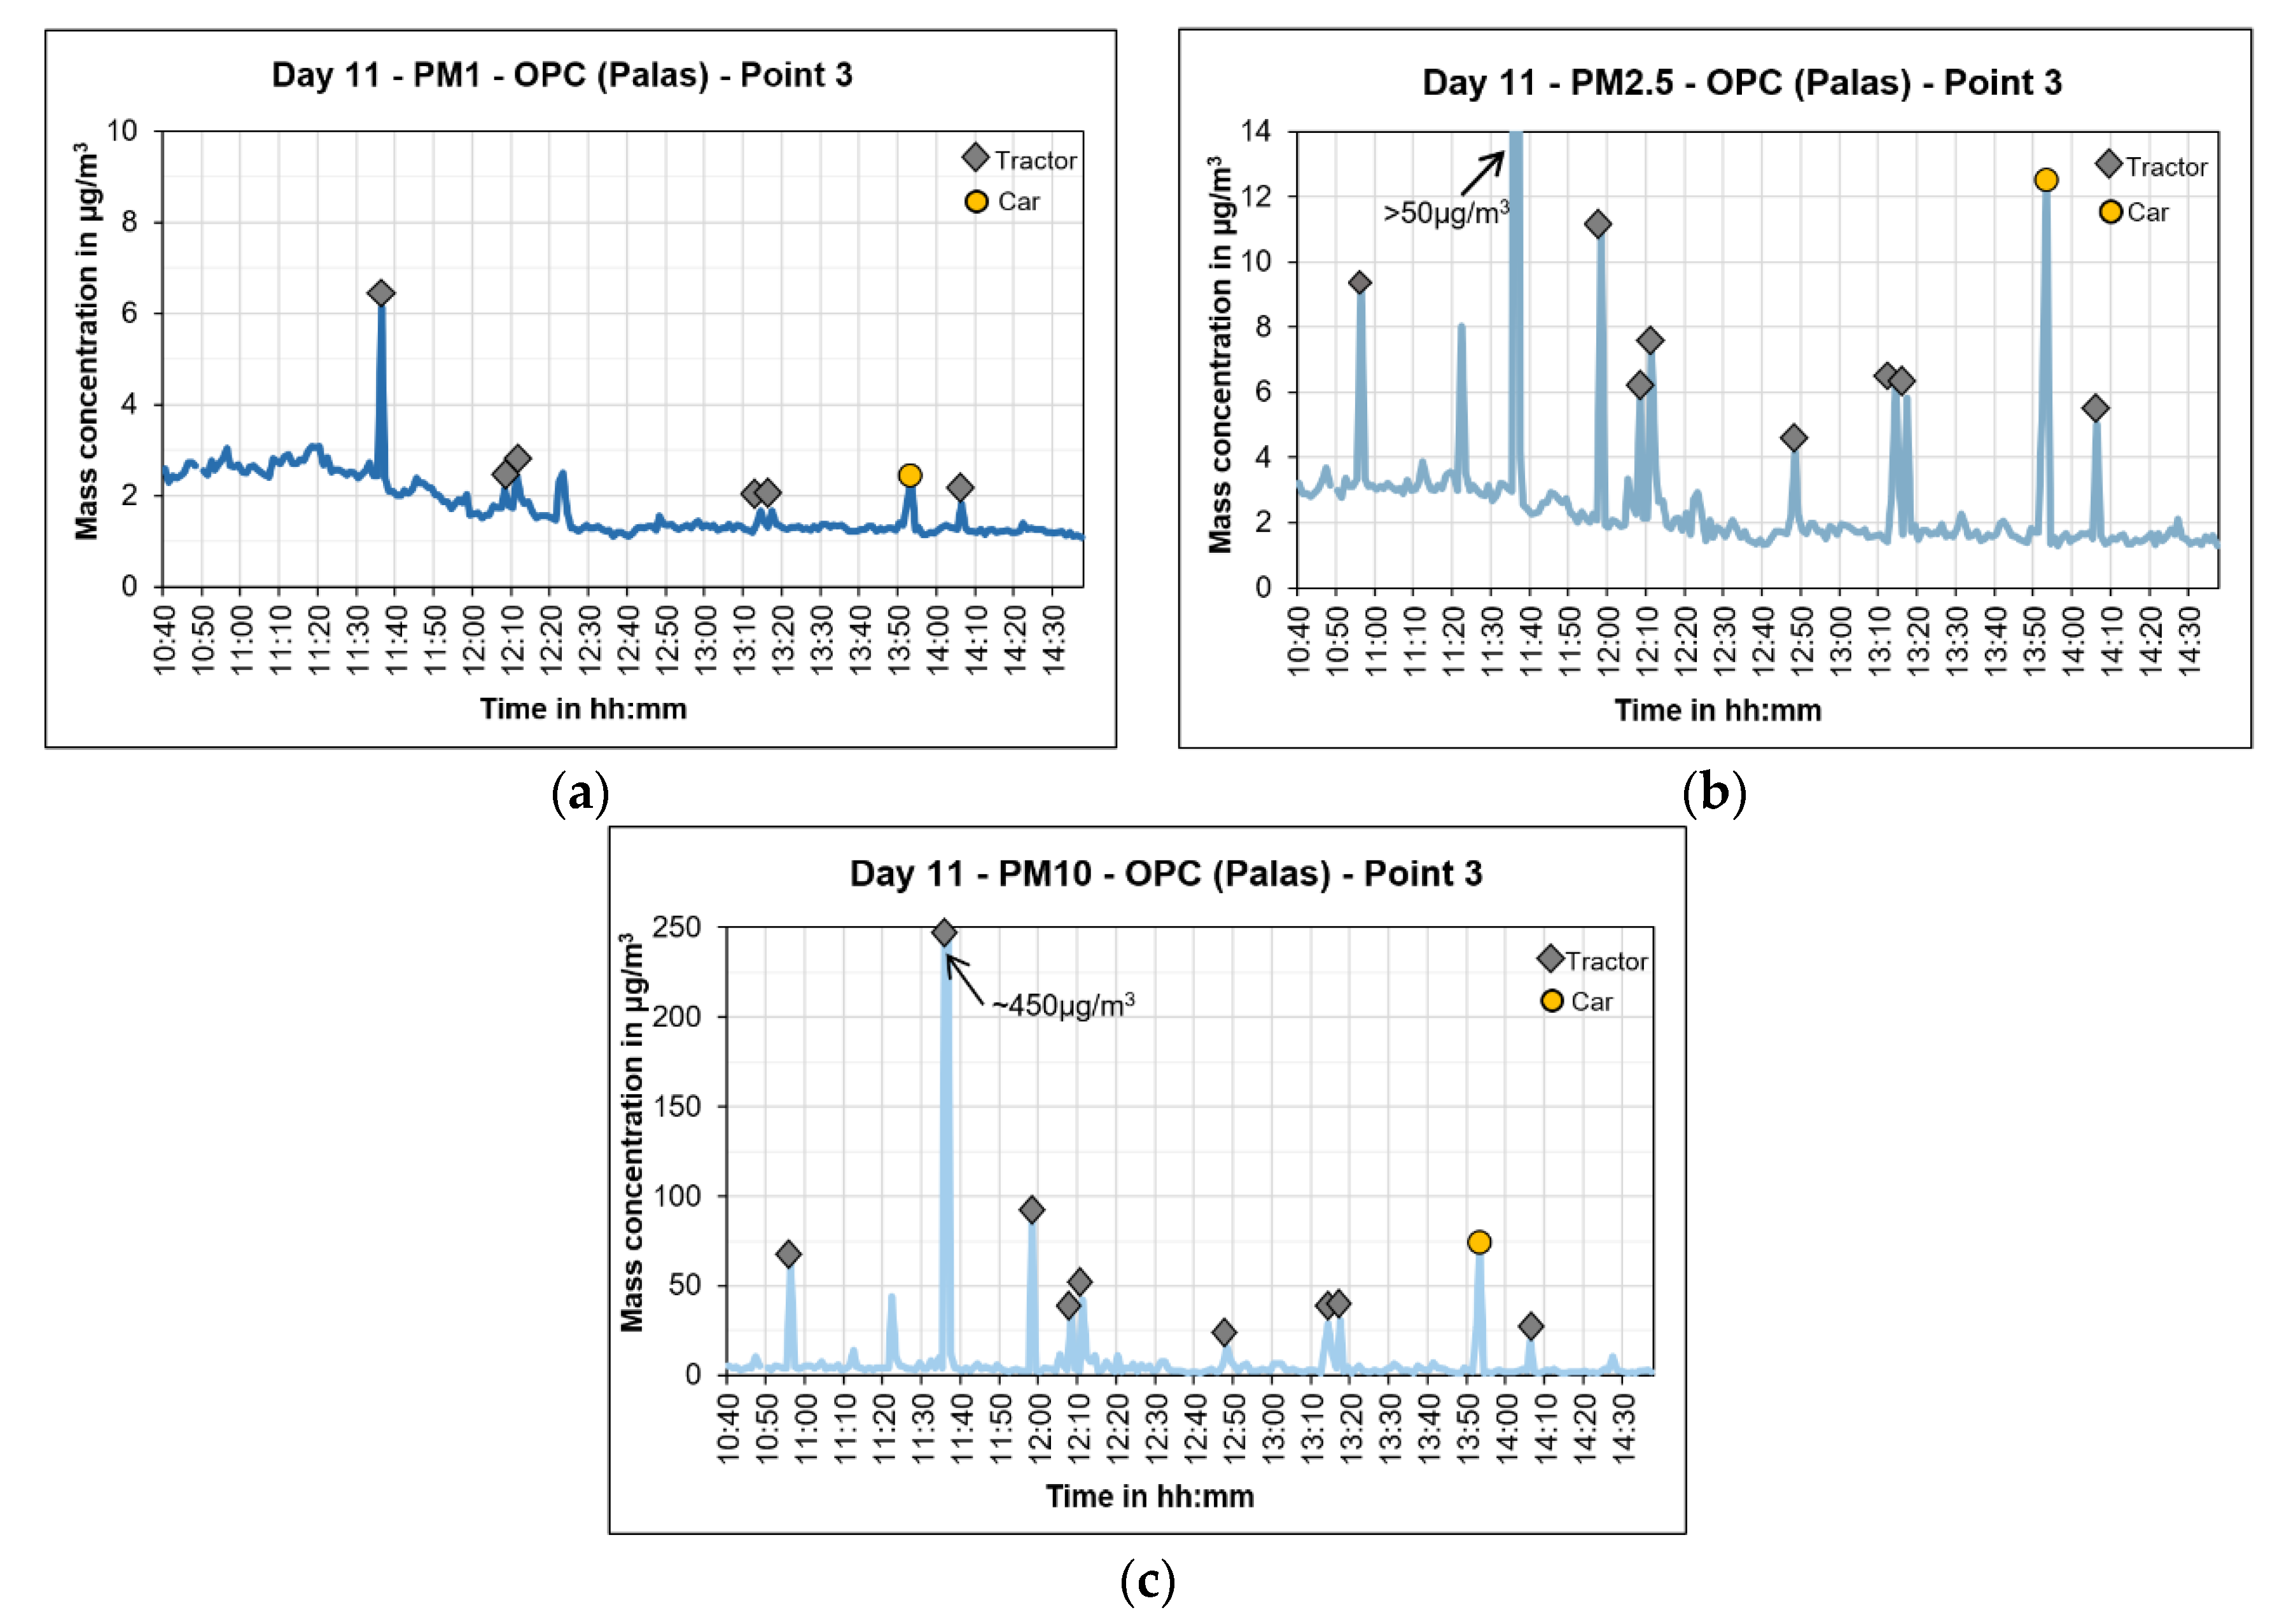
For PM1, PM2.5, and PM10, the majority of the peak concentrations were due to passing tractors (Figure 29). Thus, the PM from tractors consists mainly of the coarser particle fractions.

3.3. Quality Assurance

Quality assurance (QA) measurements were made to ensure the correctness of the measurement results obtained from the instruments. For the two DC DiSCmini (testo) devices in particular, a correction function was to be applied so that the simultaneous measurement results could be compared directly. In addition, correction equations were also determined between the devices and their redundancies to see if the results could be related.

3.3.1. UFP from DC DiSCmini (Testo)

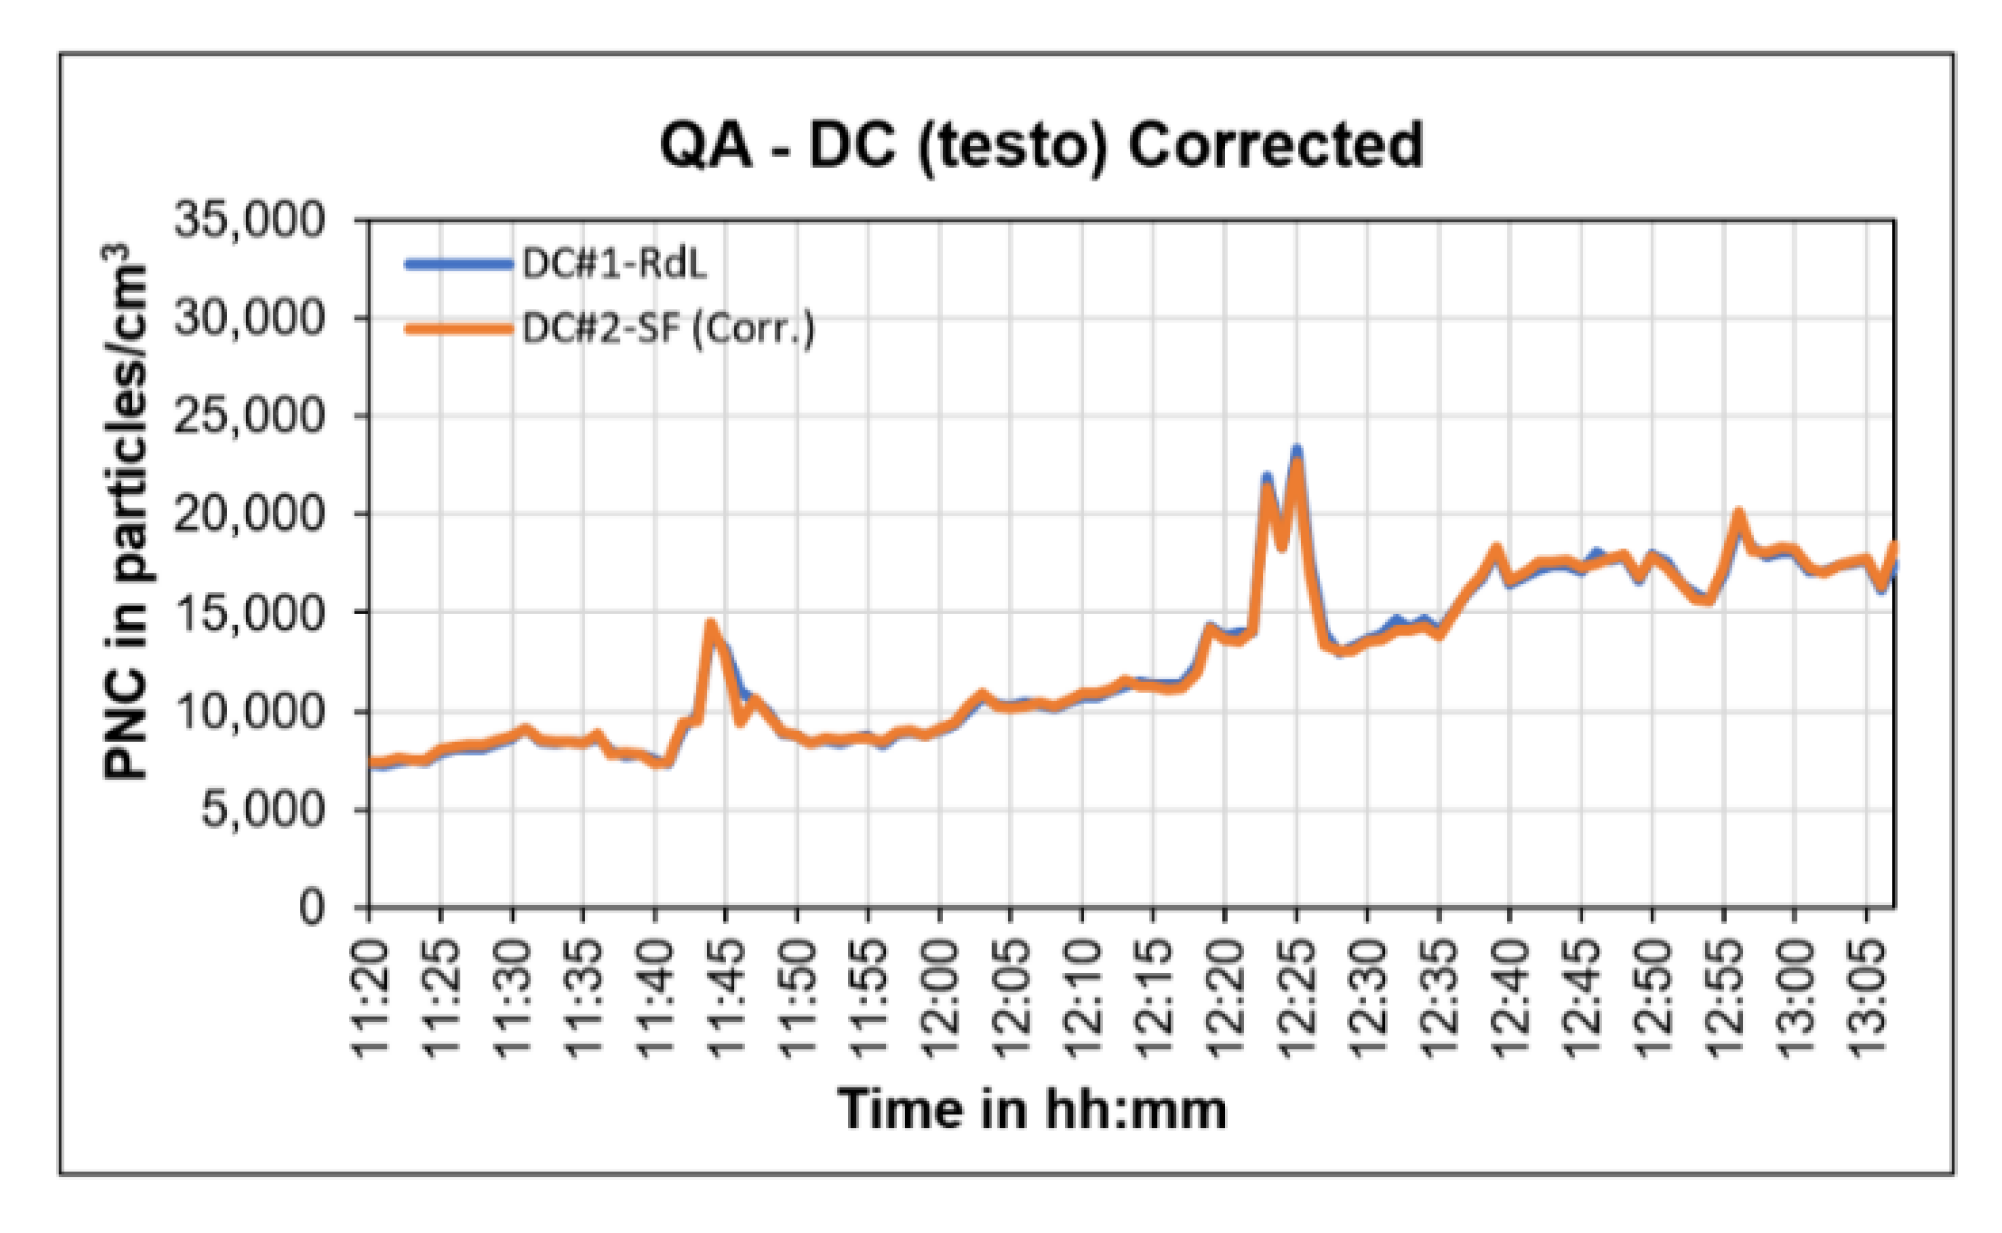
Figure 30 shows the raw data results from the two DC DiSCmini (testo) devices. The two devices are titled “DC#1” and “DC#2”. The raw data from both these devices showed the same trend; however, there was an offset between them that needed to be rectified using a correction equation. The correction equation was determined by making an xy plot between the two devices. The R2 value for these data was around 0.99, which indicated that the two datasets have a high correlation. After applying the correction equation, the corrected data from the DC#2 device were comparable to those of the DC#1 device. Figure 30 shows the corrected DC#2 results graphed together with the original DC#1 results. The graph shows that the data from both devices match closely and the results from the different locations can be compared.

3.3.2. PM from OPC Model 1.108 (Grimm) and OPC Frog (Palas)

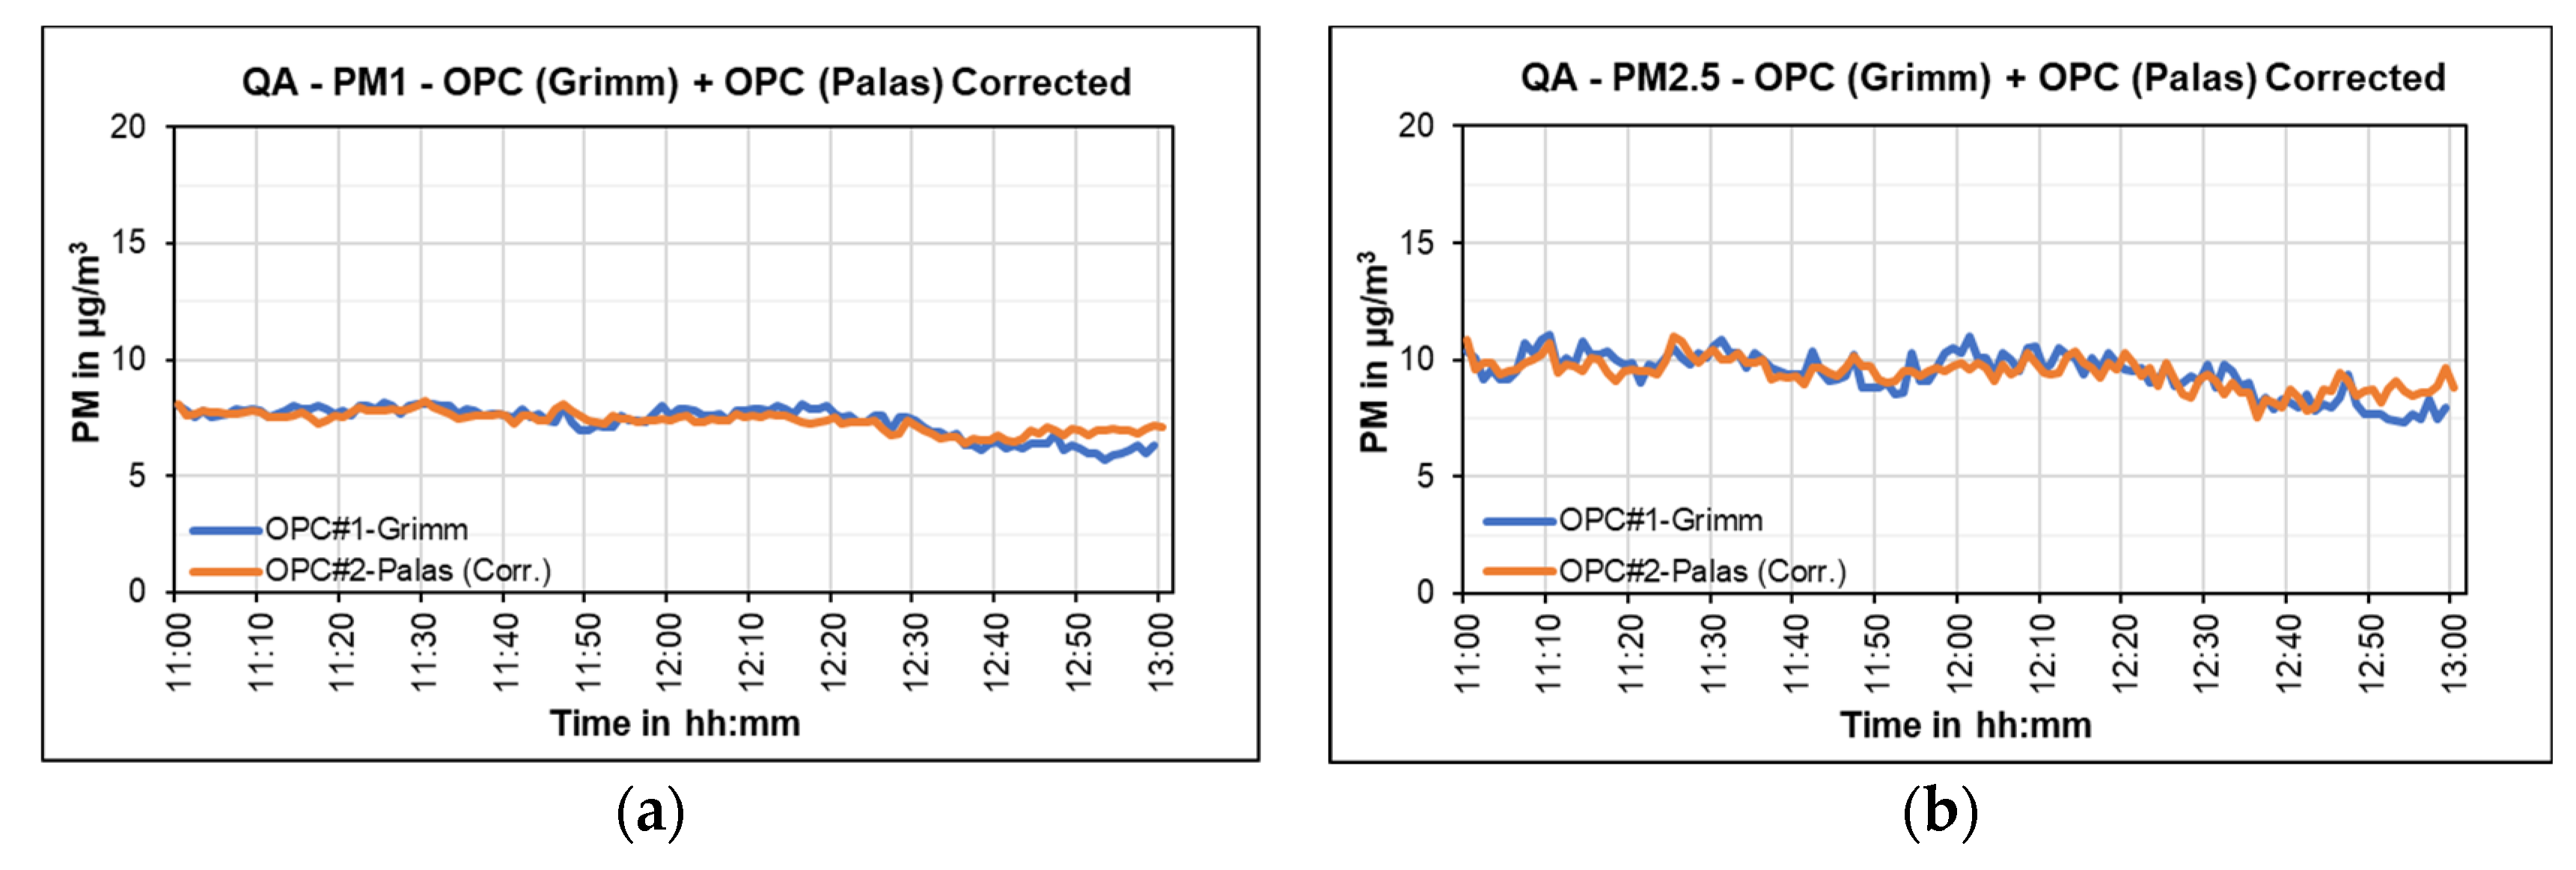
The OPC Model 1.108 (Grimm) was used starting on day 2 and it was designated as the primary device. It was expected that the measurement data from these devices should correlate since they employ the same measurement principle. However, it was observed that a data correction was needed for these devices. Hence, the same correction process was applied to the OPC#2 (Palas) data as was performed for the DC device. In Figure 31a,b, the QA plots from the OPC Model 1.108 (Grimm) and the OPC Frog (Palas) devices are shown for PM1 and PM2.5, respectively.

3.3.3. BC Aethalometers from AethLabs

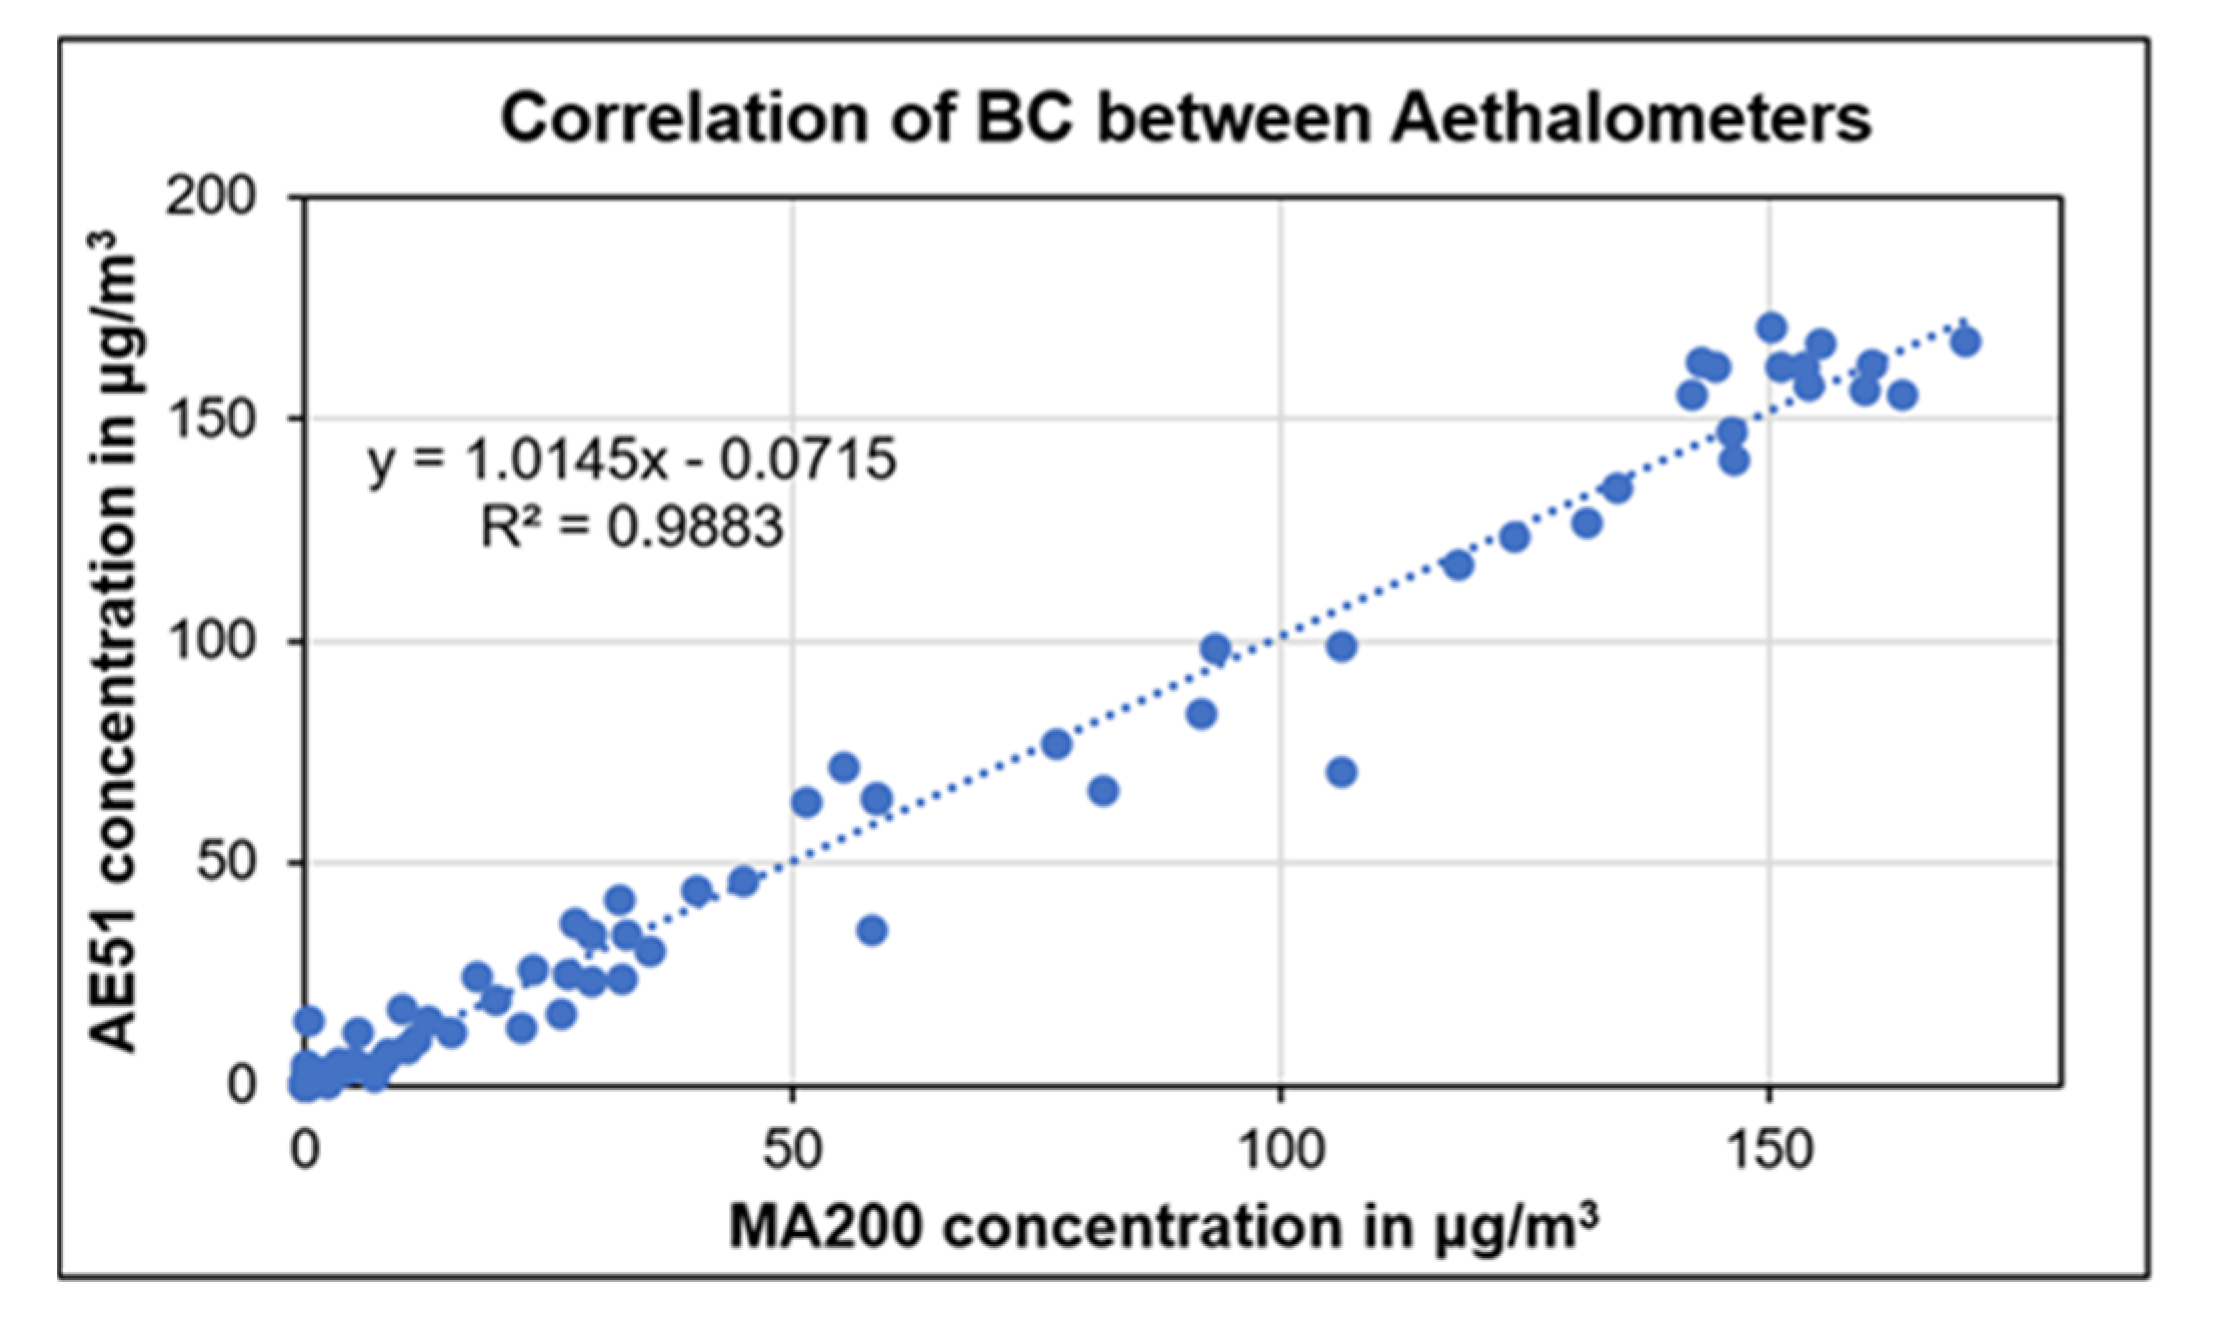
Two AethLabs aethalometer models, MA200 and AE51, were used to measure the BC. The devices have a high correlation, which was expected since they are from the same manufacturer. The correlation of both these devices are shown in Figure 32 as xy plot. The correction equation was used for data correction as it had been performed previously with other devices. The corrected data from both of the devices corresponded significantly.

4. Conclusions and Outlook

Over the course of the three measurement phases, the most notable changes were seen with the UFPs. During phase 1, the particle size ranged between 38 and 65 nm, and the PNC was <10,000 particles/cm3. When a few planes were present during phase 2, the Dp decreased to the 21 to 42 nm range and the particle concentrations ranged between 20,000 and 40,000 particles/cm3. Finally, in phase 3, the period with the most flights, the Dp decreased to the lowest size class measured by the DC DiSCmini (testo) device, ranging between 10 and 22 nm, and the PNC peaks ranged from 30,000 to over 800,000 particles/cm3. Thus, when planes were present, there was an overall increase in the UFP PNCs and a decrease in the particle diameters (Dp).
While such high UFP concentrations were expected to be measured directly at the airport, parallel measurements also showed that elevated concentrations up to 300,000 particles/cm3, with the same Dp of 10 nm, could be measured up to 2.7 kilometres away. Thus, it can be concluded that elevated UFPs are not only measurable directly at the airport but are also dispersed within the airport’s vicinity. Measurements of a nearby highway also substantiated that these UFP concentration peaks were from aircrafts and were not sourced from nearby highways as the Dp from vehicles was found to be larger than those from the aircrafts.
With regard to the coarser particle fractions, PM10 had the most significant peaks while the PM1 and PM2.5 results remained low throughout all three phases. It is also important to note that the majority of step changes in PM10 were due to tractors passing by and not aircrafts. BC was also measured and was found to be low with little variation throughout phases 1 and 2. However, during phase 3, three significant BC peaks were measured. All three were related to large aircrafts landing, followed by a strong smell of kerosene. Finally, several gas analysers were also used to measure NO2, NO, O3, and CO2 during phases 2 and 3. It was expected that the concentrations from all three devices would be higher in phase 3 than in phase 2 due to more aircrafts being present. This was observed in the case of the NO2 results, which were about three times higher during phase 3 than phase 2. The higher level of air traffic also increased the CO2 concentrations in the area surrounding the airport.
Due to the limitations of stationary measurements, it is recommended that mobile platform measurements be made to better understand the spatial distribution of aircraft plumes and also that measurements be made again after travel restrictions have ceased. A summarized conclusion for the whole measurement campaign, including all three phases, is shown in Table 3.
For future research, more measurements need to be performed in residential areas in order to find out how severely the nearby population is affected. Simultaneous measurements at the fence and at an even greater distance, e.g., 5, 10, and 15 km away can be beneficial, since the pollutant concentrations from airport emissions can be widely dispersed. Additionally, mobile measurements across the runway at different distances are needed, which could help in determining the spatial distribution of pollutants in the investigated area.

Author Contributions

Conceptualization, A.S., K.A., I.C. and U.V.; methodology, A.S., K.A., I.C. and U.V.; validation, K.A.; formal analysis, K.A.; investigation, A.S., K.A. and I.C.; resources, U.V.; data curation, A.S. and K.A.; writing—original draft preparation, A.S. and K.A.; writing—review and editing, A.S., I.C. and U.V.; visualization, K.A.; supervision, A.S., I.C. and U.V.; project administration, U.V.; funding acquisition, U.V. All authors have read and agreed to the published version of the manuscript.

Funding

This research received no external funding.

Institutional Review Board Statement

Not applicable.

Informed Consent Statement

Not applicable.

Data Availability Statement

Not applicable.

Conflicts of Interest

The authors declare no conflict of interest.

References

  1. Mazareanu, E. Coronavirus: Impact on the Transportation and Logistics Industry Worldwide. Statista. 10 September 2020. Available online: https://www.statista.com/topics/6350/coronavirus-impact-on-the-transportation-and-logistics-industry-worldwide (accessed on 25 September 2022).
  2. Flughafen Stuttgart GmbH. In Bewegung—Berecht 2018. Inklusive Aktualisierter Umwelterklärung. 2018. Available online: https://www.flughafen-stuttgart.de/media/306484/stuttgart_airport_bericht_2018.pdf (accessed on 22 June 2022).
  3. Gössling, S.; Hanna, P.; Higham, J.; Cohen, S.; Hopkins, D. Can we fly less? Evaluating the ‘necessity’ of air travel. J. Air Transp. Manag. 2019, 81, 101722. [Google Scholar] [CrossRef]
  4. Sullivan, A. To Fly or Not to Fly? The Environmental Cost of Air Travel. DW. 2020. Available online: https://www.dw.com/en/to-fly-or-not-to-fly-the-environmental-cost-of-air-travel/a-42090155 (accessed on 24 January 2022).
  5. Westerdahl, D.; Fruin, S.A.; Fine, P.L.; Sioutas, C. The Los Angeles International Airport as a source of ultrafine particles and other pollutants to nearby communities. Atmos. Environ. 2008, 42, 3143–3155. [Google Scholar] [CrossRef]
  6. Hudda, N.; Gould, T.; Hartin, K.; Larson, T.V.; Fruin, S.A. Emissions from an international airport increase particle number concentrations 4-fold at 10 km downwind. Environ. Sci. Technol. 2014, 48, 6628–6635. [Google Scholar] [CrossRef] [PubMed] [Green Version]
  7. Keuken, M.P.; Moerman, M.; Zandveld, P.; Henzing, J.S.; Hoek, G. Total and size-resolved particle number and black carbon concentrations in urban areas near Schiphol airport (the Netherlands). Atmos. Environ. 2015, 104, 132–142. [Google Scholar] [CrossRef]
  8. Weber, K.; Pohl, T.; Böhlke, C.; Fischer, C.; Kramer, T. Investigation of UFP-Distributions with Stationary and Mobile Measurements at the Düsseldorf Airport. In Proceedings of the 7th International Symposium on Ultrafine Particles, Air Quality and Climate. Institut für Meteorologie und Klimaforschung—Atmosphärische Aerosolforschung (IMK-AAF), Brüssel, Belgien, 15–16 May 2019; Available online: https://publikationen.bibliothek.kit.edu/1000096845 (accessed on 7 August 2020).
  9. EASA—European Union Aviation Safety Agency. Overview of Aviation Sector. Emissions. With assistance of EEA and EUROCONTROL. 2019. Available online: https://www.easa.europa.eu/eaer/topics/overview-aviation-sector (accessed on 24 June 2022).
  10. Penman, J. Good Practice Guidance and Uncertainty Management in National Greenhouse Gas Inventories; Institute for Global Environmental Strategies (IGES): Kanagawa, Japan, 2000. [Google Scholar]
  11. Liu, H.-Y.; Dunea, D.; Iordache, S.; Pohoata, A. A Review of Airborne Particulate Matter Effects on Young Children’s Respiratory Symptoms and Diseases. Atmosphere 2018, 9, 150. [Google Scholar] [CrossRef] [Green Version]
  12. Raaschou-Nielsen, O.; Andersen, Z.J.; Beelen, R.; Samoli, E.; Stafoggia, M.; Weinmayr, G.; Hoffmann, B.; Fischer, P.; Nieuwenhuijsen, M.J.; Brunekreef, B.; et al. Air pollution and lung cancer incidence in 17 European cohorts: Prospective analyses from the European Study of Cohorts for Air Pollution Effects (ESCAPE). Lancet Oncol. 2013, 14, 813–822. [Google Scholar] [CrossRef] [PubMed]
  13. Raaschou-Nielsen, O.; Beelen, R.; Wang, M.; Hoek, G.; Andersen, Z.J.; Hoffmann, B.; Stafoggia, M.; Samoli, E.; Weinmayr, G.; Dimakopoulou, K.; et al. Particulate matter air pollution compo-nents and risk for lung cancer. Environ. Int. 2016, 87, 66–73. [Google Scholar] [CrossRef] [PubMed]
  14. Bentayeb, M.; Wagner, V.; Stempfelet, M.; Zins, M.; Goldberg, M.; Pascal, M.; Larrieu, S.; Beaudeau, P.; Cassadou, S.; Eilstein, D.; et al. Association be-tween long-term exposure to air pollution and mortality in France: A 25-year follow-up study. Environ. Int. 2015, 85, 5–14. [Google Scholar] [CrossRef]
  15. Ohlwein, S.; Kappeler, R.; On behalf of the German Environmental Agency and the Swiss Federal Office for the Environment. Health Effects of Ultrafine Particles. UMWELT & GESUNDHEIT. 2018. Available online: https://www.umweltbundesamt.de/sites/default/files/medien/376/publikationen/uba_ufp_health_effects_haupt_final.pdf (accessed on 20 July 2022).
  16. Kumar, P.; Morawska, L.; Birmili, W.; Paasonen, P.; Hu, M.; Kulmala, M.; Harrison, R.M.; Norford, L.; Britter, R. Ultrafine particles in cities. Environ. Int. 2014, 66, 1–10. [Google Scholar] [CrossRef] [Green Version]
  17. Flughafenverband ADV. Arbeitsgemeinschaft Deutscher Verkehrsflughäfen-Monatsstatistik. 2019. Available online: https://www.adv.aero/service/downloadbibliothek (accessed on 20 July 2022).
  18. Baumüller, J. (Ed.) Klimaatlas Region Stuttgart—Stadtklima 21: Grundlagen zum Stadtklima und zur Planung. 2018, p. 28. Available online: https://www.stadtklima-stuttgart.de/index.php?klima_klimaatlas_region (accessed on 20 July 2022).
  19. Stuttgart Airport. The Project. Stuttgart Flughafen GmbH. 2020. Available online: https://www.stuttgart-airport.com/company-information/runway-renewal/the-project/ (accessed on 4 September 2022).
  20. Schröder, D. Verheerender Waldbrand: Feuerwehr Löscht Weiter Glutnester—Mann Macht Geständnis. WA Medien Gruppe. 2020. Available online: https://www.wa.de/nordrhein-westfalen/gummersbach-grosser-waldbrand-feuerwehr-polizei-gestaendnis-13668308.html (accessed on 8 May 2020).
  21. TSI Incorporated. Nanoscan SMPS Nanoparticle Sizer Model 3910. 2012. Available online: https://tsi.com/getmedia/3188cb1d-2362-44c0-82b4-f2cc60afef17/NanoScan%20SMPS%203910_5001411?ext=.pdf (accessed on 1 September 2022).
  22. TSI Incorporated. Hand-Held Condensation Particle Counter Model 3007. 2022. Available online: https://www.tsi.com/getmedia/8c0677b4-6cda-43b6-9a74-1c96acc30d4e/3007_5001117_A4?ext=.pdf (accessed on 1 September 2022).
  23. Palas GmbH. Fine Dust Measuring Device Operating Manual—Fidas Frog. 2017. Available online: https://www.manualslib.com/manual/2052143/Palas-Fidas-Frog.html (accessed on 1 September 2022).
  24. TSI Incorporated. Model 3330 Optical Particle Sizer Spectrometer Manual. 2013. Available online: https://www.kenelec.com.au/wp-content/uploads/2016/06/TSI_3330_Opticle_Particle_Sizer_Manual.pdf (accessed on 1 September 2022).
  25. Grimm Aerosol Technik GmbH & Co. KG. Portable Laser Aerosolspectrometer and Dust Monitor Model 1.108/1.109. 2010. Available online: https://cires1.colorado.edu/jimenez-group/Manuals/Grimm_OPC_Manual.pdf (accessed on 1 September 2022).
  26. Testo DISCmini. Diffusion Size Classifier Miniature. 2016. Available online: https://static-int.testo.com/media/ae/87/df0045b6f8dd/pb-testo-DiSCmini-Brochure-US.pdf (accessed on 1 September 2022).
  27. AethLabs. microAeth AE51 Operating Manual. Rev 06 Updated July 2016. Available online: https://aethlabs.com/sites/all/content/microaeth/ae51/microAeth%20AE51%20Operating%20Manual%20Rev%2006%20Updated%20Jul%202016.pdf (accessed on 1 September 2022).
  28. AethLabs. MA200 MA300 MA350 Operating Manual. Rev 03 December 2018. Available online: https://aethlabs.com/sites/all/content/microaeth/maX/MA200%20MA300%20MA350%20Operating%20Manual%20Rev%2003%20Dec%202018.pdf (accessed on 1 September 2022).
  29. LI-COR, Inc. Using the LI-830 and LI-850 Gas Analyzers. 2022. Available online: https://www.licor.com/documents/gz8gaf0ls5vhvpl52xtmyr8mfoh5kwe8 (accessed on 1 September 2022).
  30. 2B Technologies, Inc. NO2/NO/NOX Monitor Operation Manual Model 405 nm. 2018. Available online: https://twobtech.com/docs/manuals/model_405nm_revG-5.pdf (accessed on 1 September 2022).
  31. 2B Technologies, Inc. Ozone Monitor Operation Manual Model 202. 2018. Available online: https://twobtech.com/docs/manuals/model_202_revJ-4.pdf (accessed on 1 September 2022).
  32. GILL Instruments Limited. MaxiMet-Manual-Iss-6. Compact Weather Stations. 2017. Available online: https://gillinstruments.com/wp-content/uploads/2022/08/1957-009-Maximet-gmx501-Iss-9.pdf (accessed on 1 September 2022).
  33. Vorage, M.; Madl, P.; Hubmer, A.; Lettner, H. Aerosols at Salzburg Airport: Long-term measurements of ultrafine particles at two locations along the runway. Gefahrst. Reinhalt. Luft 2019, 79, 227–234. [Google Scholar] [CrossRef]
  34. Lammers, A.; Janssen, N.A.H.; Boere, A.J.F.; Berger, M.; Longo, C.; Vijverberg, S.J.H.; Neerincx, A.H.; van der Zee, A.H.M.; Cassee, F.C. Effects of short-term exposures to ultrafine particles near an airport in healthy subjects. Environ. Int. 2020, 141, 105779. [Google Scholar] [CrossRef]
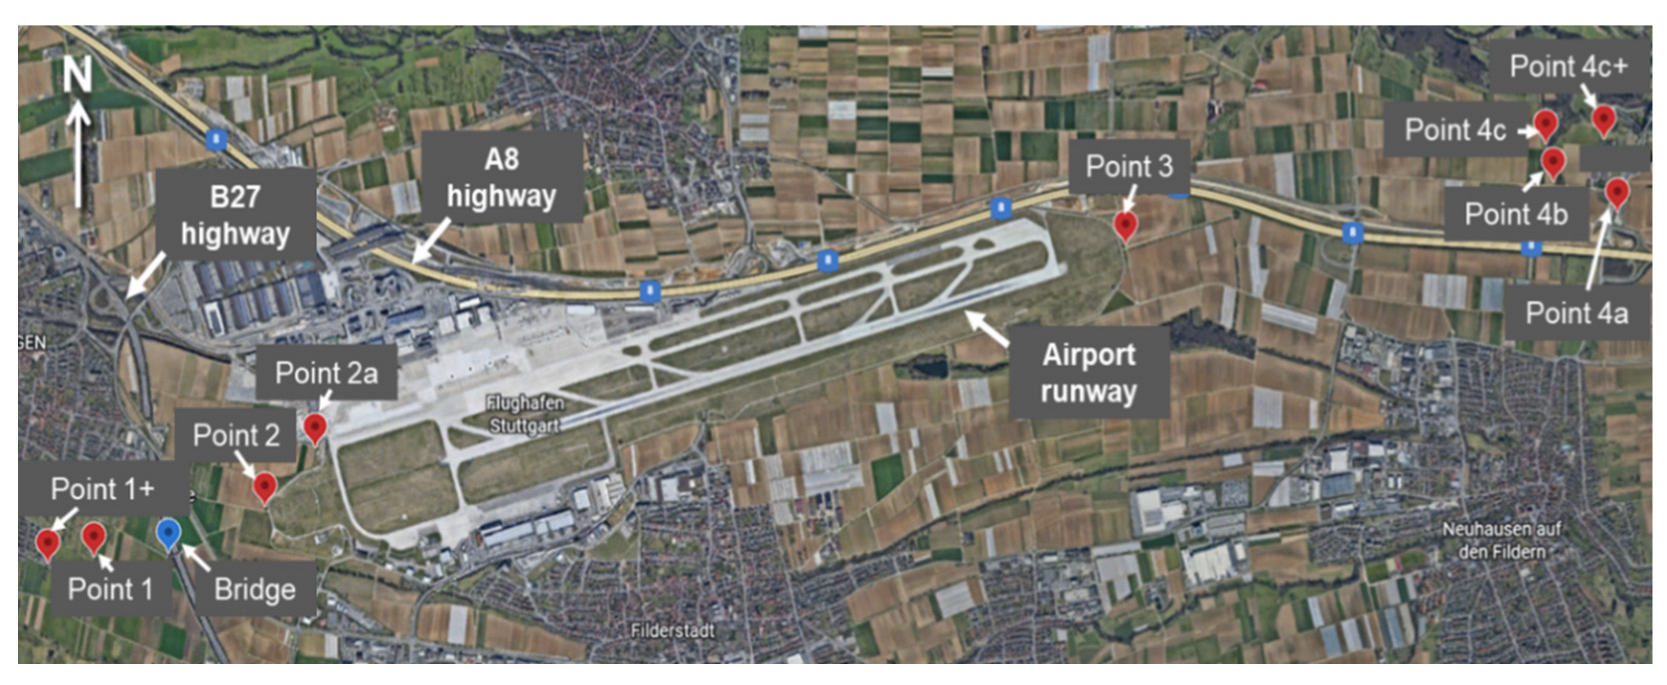
Figure 1. An overview of the measurement locations during the campaign.
Atmosphere 13 02062 g001
Figure 2. Comparison of daily arrivals to those before the COVID-19 pandemic.
Atmosphere 13 02062 g002
Figure 3. Comparison of hourly arrivals to those before the COVID-19 pandemic.
Atmosphere 13 02062 g003
Figure 4. Device setup during (a) phase 1 and (b) phase 2 of measurements.
Atmosphere 13 02062 g004
Figure 5. PSD for (a) day 1, (b) day 2, (c) day 3, and (d,e) day 4 (phase 1).
Atmosphere 13 02062 g005
Figure 6. Particle size distributions on (a) day 9 and (b) day 10 (phase 2).
Atmosphere 13 02062 g006
Figure 7. Daily average PSDs on (a) day 11, (b) day 12, (c) day 13, (d) day 14 (phase 3).
Atmosphere 13 02062 g007
Figure 8. PSDs on day 15 at point 3 of (a) arrivals and (b) departures.
Atmosphere 13 02062 g008
Figure 9. PSD on day 15 at point 1 of (a) arrivals and (b) departures.
Atmosphere 13 02062 g009
Figure 10. PNC box plot and average Dp during phase 1.
Atmosphere 13 02062 g010
Figure 11. Day 8 simultaneous UFP measurements at (a) point 2 and (b) point 1.
Atmosphere 13 02062 g011
Figure 12. Day 9 simultaneous UFP measurements at (a) point 3 and (b) point 4b.
Atmosphere 13 02062 g012
Figure 13. Day 12 PNC and Dp results.
Atmosphere 13 02062 g013
Figure 14. Day 14 PNC and Dp results.
Atmosphere 13 02062 g014
Figure 15. Parallel measurements at points 1 and 2.
Atmosphere 13 02062 g015
Figure 16. Parallel measurements at points 3 and 4c.
Atmosphere 13 02062 g016
Figure 17. Phase 1 (a) PM1, (b) PM2.5, and (c) PM10 concentrations.
Atmosphere 13 02062 g017
Figure 18. Phase 2 Day 9 (a) PM1, (b) PM2.5, and (c) PM10 levels at point 3.
Atmosphere 13 02062 g018
Figure 19. Phase 3 Day 14 OPC (Grimm) values for (a) PM1, (b) PM2.5, and (c) PM10 at point 3.
Atmosphere 13 02062 g019
Figure 20. BC measurements during (a) phase 1 and (b) phase 2 measurements.
Atmosphere 13 02062 g020
Figure 21. BC peaks on (a) day 11 and (b) day 13 at point 3.
Atmosphere 13 02062 g021
Figure 22. NO2 concentration at point 3 on (a) day 9 and (b) day 10.
Atmosphere 13 02062 g022
Figure 23. NO2 and NO concentrations on (a) day 14 and (b) day 18.
Atmosphere 13 02062 g023
Figure 24. Highway measurement location near bridge.
Atmosphere 13 02062 g024
Figure 25. Freeway measurement results for (a) UFP PNC and Dp from DC DiSCmini (testo) and (b) PSD combination.
Atmosphere 13 02062 g025
Figure 26. Freeway measurement results for PM1, PM2.5, and PM10.
Atmosphere 13 02062 g026
Figure 27. DC DiSCmini (testo) levels from tractors on (a) day 11 and (b) day 20.
Atmosphere 13 02062 g027
Figure 28. Tractor PNCs and Dp occurrences during phase 3.
Atmosphere 13 02062 g028
Figure 29. (a) PM1, (b) PM2.5, and (c) PM10 peaks from tractors.
Atmosphere 13 02062 g029
Figure 30. DC#1 and corrected DC#2 graphs.
Atmosphere 13 02062 g030
Figure 31. Comparison of (a) PM1 and (b) PM2.5 after applied correction.
Atmosphere 13 02062 g031
Figure 32. Correlation between BC aethalometers from AethLabs.
Atmosphere 13 02062 g032
Table 1. Information regarding the measurement days and location for all phases.
DateWeekdayMeasurement DayPointTime
Phase 1
16 April 2020Thursday1P115:15
17 April 2020Friday2P114:45
18 April 2020Saturday3P114:40
19 April 2020Sunday4P113:40
P213:05
20 April 2020Monday5P113:05
P213:45
21 April 2020Tuesday6P114:10
22 April 2020Wednesday7P114:55
23 April 2020ThursdayQAP114:00
Phase 2
3 June 2020Wednesday8P114:35
P213:00
18 June 2020Thursday9P315:00
19 June 2020Friday10P314:00
Phase 3
19 August 2020Wednesday11P316:00
20 August 2020Thursday12P114:45
P4b14:00
21 August 2020Friday13P316:00
P4b16:00
25 August 2020Tuesday14P316:00
27 August 2020Thursday15P4b14:50
P113:00
P4b13:30
P212:50
3 September 2020Thursday16P4b14:50
P314:50
4 September 2020Friday17P315:00
P4b/c14:00
7 September 2020Monday18P217:00
P114:30
8 September 2020Thursday19P214:30
P114:20
9 September 2020Wednesday20P314:20
P4c14:00
Table 2. Information regarding air pollutant and meteorological devices.
ParameterMeasurement Technique and PrincipleEquipment ModelMeasurement RangePhase
UFP + size distributionScanning Mobility Particle Sizer (SMPS) + Condensation Particle Counter (CPC) → Particle condensationNanoScan 3910 (TSI)10–420 nm1, 2, 3
UFPDiffusion charger (DC) × 2DiSCmini (testo)10–700 nm1, 2, 3
UFPCondensation Particle Counter (CPC)Model 3007 (TSI)10–1000 nm1, 2, 3
PM2.5, PM10 + size distributionOptical Particle Counter (OPC) → Light scatteringOPS 3330 (TSI)0.3–10 µm1, 2, 3
PM2.5, PM10 + size distributionOptical Particle Counter (OPC) → Light scatteringFidas Frog (Palas)0.15–18 µm1, 2, 3
PM2.5, PM10 + size distributionOptical Particle Counter (OPC) → Light scatteringModel 1.108 (Grimm)0.3–20 µm1, 2, 3
BCAethalometry → IR and visible light absorptionMA200 (AethLabs)0–1 mg BC/m31, 2, 3
BCAethalometry → IR light absorptionAE51 (AethLabs)0–1 mg BC/m31, 2, 3
CO2IR absorptionLI-830 (LI-COR)0–20,000 ppm2, 3
NO2
NO
Light absorption (405 nm)NO/NO2/NOX monitor 405 nm (2B technologies)0–10 ppm
0–2 ppm
2, 3
O3UV absorption (254 nm)Ozone monitor 202 (2B technologies)3 ppb–250 ppm2, 3
Wind speed + directionCompact weather stationMaxiMet GMX501 (Gill)-1, 2, 3
Table 3. Summary of measurements across all three phases.
CharacteristicsPhase 1Phase 2Phase 3
Number of flightsNo flight activitySix flights/hour on averageTen flights/hour on average
Meteorological conditionsPrimarily NE direction, low wind speed, clear weather/no rainN and S winds, low wind speeds, rain between measurement daysVarying wind direction, low wind speeds, rain between measurement days
PNC<10,000 particles/cm3 with little variationPeaks ranged from 20,000 to 40,000 particles/cm3Peaks ranged from 30,000 to 800,000 particles/cm3
PMPM1 and PM2.5 values were low. PM2.5 and PM10 under limit valuesPM1 and PM2.5 values still low. PM2.5 within limit values. Several PM10 peaks > 50 µg/m3 from flightsPM concentrations slightly higher than Phase 2. PM2.5 within limit values. Several PM10 peaks > 50 µg/m3 from flights
Dp, second percentile38 to 65 nm21 to 42 nm10 to 22 nm
PSD peakBetween 27 nm and 86 nmBetween 27 nm and 36 nm10 nm
BC<1 µg/m3
Minimal changes and variation
<1 µg/m3
Minimal changes and variation
Several BC peaks > 1 µg/m3 from aircraft related activity
Gas monitorsNot usedCO2: 433 ppm
NO2: 9 ppb
NO: -
O3: 71 ppb
CO2: 400 ppm
NO2: 16 ppb
NO: 11 ppb
O3: 50 ppb
Publisher’s Note: MDPI stays neutral with regard to jurisdictional claims in published maps and institutional affiliations.