Abstract
The Lidar on the Cloud-Aerosol Lidar and Infrared Pathfinder Satellite Observations (CALIPSO) mission, makes robust measurements of dust and has generated a record that is significant both seasonally and interannually. We exploit this record to determine the properties of dust emanating from different source types during sand and dust storms (SDS). We use the relevant browsed images to describe the characteristics of the SDS layers qualitatively and the average properties quantitatively. In particular, we examine dust optical depths, dust layer frequencies, and layer heights during three sandstorms. The data are screened by using standard CALIPSO quality-assurance flags, cloud aerosol discrimination (CAD) scores, overlying features, and layer properties. To evaluate the effects of the SDS origin, phenomena such as morphology, vertical extent, and size of the dust layers, we compare probability distribution functions of the layer integrated volume depolarization ratios, geometric depths, and integrated attenuated color ratios as a function of source type. This study includes 17 individual dust storm cases observed near the city of Kuwait from three categories of sources: single source, combined sources, and unspecified sources. The strongest dust storms occurred in the summer months. The dust layers reached the highest altitudes for the combined cases. The layer top altitudes were approximately 3 km for the SDS from unspecified and single sources whereas the layer top altitudes averaged 4.1 km for the SDS from combined sources. Particles from single and combined sources recorded depolarization ratios of 0.22 and 0.23, respectively, whereas the depolarization ratios of SDS particles from unspecified sources were noticeably lower at 0.17. SDS from single sources resulted in the highest average AOD (0.66) whereas the SDS from combined sources and unspecified sources resulted in AODs of 0.41 and 0.28, respectively. Winter dust layers were disorganized, especially at night when the boundary layer was weak. The most well-organized layers close to the ground were observed in the daytime during the summer months.
1. Introduction
CALIPSO is a collaboration between NASA and the Centre National d’Études Spatiales (CNES), which was launched in April 2006 to provide vertically resolved measurements of cloud and aerosol distributions [1]. The primary instrument on the CALIPSO satellite is the Cloud-Aerosol Lidar with Orthogonal Polarization (CALIOP), a near-nadir viewing two-wavelength polarization-sensitive instrument [2]. CALIOP is particularly well suited to the identification and observation of mineral dust due to its sensitivity to nonspherical particles, which is manifested in the depolarization measurements. A depolarized profile is returned when light interacts with a nonspherical particle [3,4,5,6,7,8,9,10]. Arabian desert dust shows depolarizations of 15–25% with typical values of 23% during dust storms [11]. CALIPSO uses a 20% threshold to identify pure dust particles and a 7.5% threshold for polluted dust particles [12].
The CALIOP aerosol optical depths used in this study are obtained by integrating the 532-nm aerosol extinction profile, reported in the profile products at both 532- and 1064-nm wavelengths. In addition to the column aerosol optical depth uncertainties, other parameters that may be useful for indicating the quality of column aerosol optical depth retrievals include the extinction quality control (ExtQC) flag, and the cloud fraction. Retrieval uncertainties propagate downward and impact the quality of the column optical depths. Users are referred to the CALIPSO data quality summaries and the CALIPSO user’s guide for a detailed discussion of accuracy, uncertainty, and data-quality flags (http://www-calipso.larc.nasa.gov/resources/calipso_users_guide/) (accessed on 20 November 2022).
Mineral dust affects the Earth’s radiative balance and its distribution, and has important consequences in both past, current, and future climate systems. Dust directly forces the radiative balance by absorbing and scattering radiation, and indirectly by acting as cloud condensation nuclei and ice nuclei. It also alters the atmospheric heating profiles in such a way that it impacts cloud distributions. To effectively study dust and its impact, global distribution of dust and its vertical resolution is needed. An instrument that provides such data is a light detection and ranging (Lidar) profiler based on a free-flying orbiter. The CALIOP instrument on the CALIPSO satellite is just such an instrument.
Lidar is a powerful tool for studying the vertical distribution of aerosols and clouds in the atmosphere. The deployment of CALIPSO has enabled vertically resolved measurements of dust and provides significant insights into properties of dust aerosols [13]. CALIOP is designed to acquire vertical profiles of elastic backscatter at two wavelengths (1064 nm and 532 nm) from a near nadir-viewing geometry during both day and night phases of the orbit. In addition to the total backscatter at the two wavelengths, CALIOP also provides profiles of linear depolarization at 532 nm. Accurate aerosol and cloud heights and retrievals of extinction coefficient profiles are derived from the total backscatter measurements [14]. The depolarization measurements enable the discrimination between ice clouds and water clouds [15]. and the identification of nonspherical aerosol particles [12,16]. Additional information, such as estimates of particle size for the purpose of discriminating between clouds and aerosols, are obtained from the ratios of the signals obtained at the two wavelengths. On 28 April 2006, the CALIPSO satellite was launched into a low Earth–Sun synchronous orbit at a 705-km altitude, and an inclination of 98.2 degrees. CALIPSO’s measurements of dust properties are robust, and the length of the record is significant both seasonally and interannually.
Sustainable development within desert areas such as Kuwait faces many environmental challenges, as it is severely affected by sand and dust storms (SDS) [17]. The sandblasting due to SDS acts as a major factor in shaping desert morphology [18,19]. SDS may cause direct and indirect adverse effects on fauna, flora, and human health on the regional scale [20]. It has a socioeconomic impact on health [20], the oil sector [21], marine biochemistry [22,23,24], and sustainable energy efficiency [25]. Francis et al. [26] found the Arabian dust reaches an altitude of up to 5 km and leads to warming during night and cooling during day. This might explain why the dust formation is consistent with a stable boundary layer in the daytime whereas the nighttime layers are relatively disorganized.
2. Kuwait Dust Distributions—Region of Study
The location where sand and dust storms originate is referred to as an SDS hotspot [27,28]. Two major SDS hotspots were detected in the southern part of the Mesopotamian Flood Plain (Figure 1), where both SDS hotspots encompass roughly 5356 km2 and contribute 11% in 2005 to 85% in 2021, respectively, of the total SDS in the region [27].
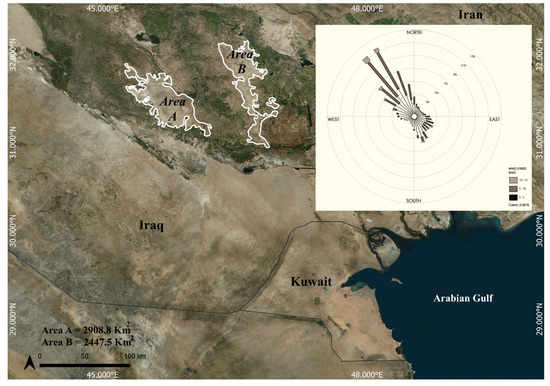
Figure 1.
MODIS image of a typical SDS around Kuwait City. The SDS originated from the hotspots A and B shown in the image. The top right corner shows the mean wind rose for Kuwait City (2000–2020).
For the purpose of this study, the region of regard is a 220-km radius from Kuwait City center. The CALIPSO 16-day repeat ground tracks are shown in Figure 2 below. This region was expanded to 440 km and the analyses repeated to estimate the change in the properties over the larger domain and estimate a scale length of the SDS for this region.
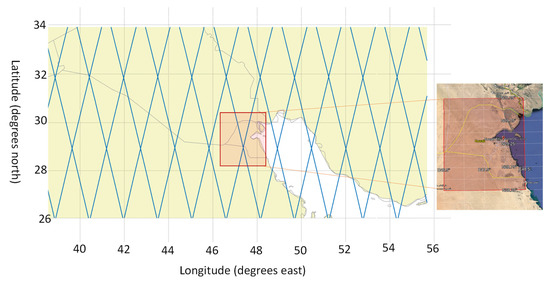
Figure 2.
CALIPSO 16-day repeat ground tracks near Kuwait City. The orange box denotes the region of study centered near Kuwait City center.
In Figure 2, the tracks traversing northwest (top) to southeast (bottom) are the nighttime orbits and the ones from northeast to southwest are daytime orbits. Every 16 days, there is a daytime and nighttime track that passes within 5 km of Kuwait City center. Table 1 shows the average number of SDS days averaged for area for up- and downwind cases with respect to the sources. It shows the SDS days for the region over the period (years) shown in column 2. Most of the SDS days in Kuwait City were in the summer.

Table 1.
The SDS days average number in the study area for up- and downwind cases with respect to the sources.
3. Case Studies—Dust Storm Days Observed by CALIPSO—Browse Images
This study is focused on the two hotspot areas shown in Figure 1. The SDS affecting Kuwait in this study were classified into three forms:
- (a)
- The single source cases in which the SDS originates only from either one/both SDS hotspots in Figure 1.
- (b)
- Combined source SDS cases in which the SDS originates from one or both SDS hotspots, but combined with other sources downwind of the SDS hotspots.
- (c)
- Other sources SDS cases in which the SDS originates from sources different from the ones shown in Figure 1.
Table 2 shows the 17 SDS cases discussed in Section 3. Nine cases are from single or combined sources, and the remainder are from unspecified sources.
Table 2.
The SDS cases studied: dates and their classifications.
The CALIPSO aerosol parameters used for this study include the depolarization ratio used for identifying the dust and the extinction coefficient which provides the optical depth of the layer when integrated from the base to the top of the layer. Figure 3 below shows profiles of these properties for one of the SDS cases studied.
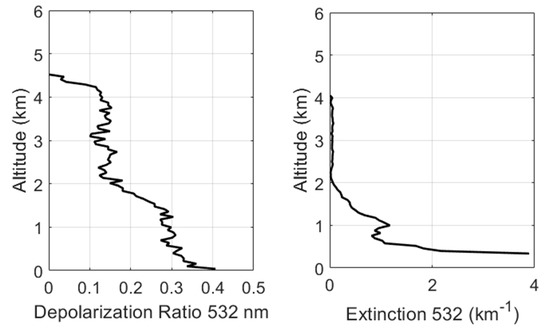
Figure 3.
Depolarization and extinction profiles of the SDS on 2 July 2009 corresponding to the image in Figure 4.
The figure shows the depolarization ratio (left side) and the extinction profile (right side) of the SDS from a single source in the summer of 2009. These are typical profiles of dust layers during these SDS events. The figure to the left shows a large depolarization close to the surface of 25 to 40%, and the layer above it has a depolarization of about 15%. These profiles are for dust features shown in the image in Figure 4. The extinction profile shows a large extinction near the surface influenced by the surface return and an extinction of about 1.0 km−1 at the top of the first layer. The extinction reduces considerably at the top of the layer.
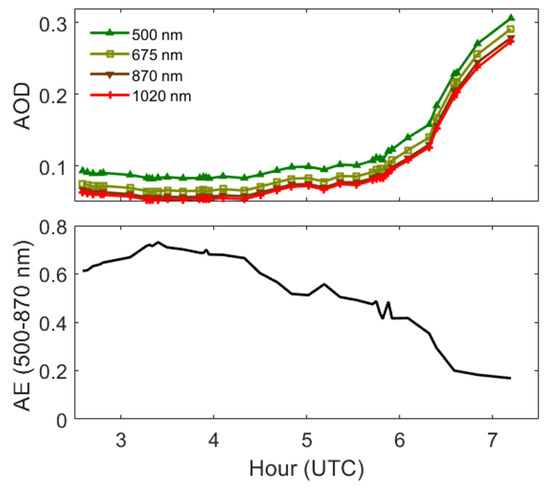
Figure 4.
The aerosol optical depth (AOD) and Ångström Exponent (AE) measured on 22 June 2018 at the AERONET site at Kuwait University. Note the rapid increase (decrease) in the AOD (AE) between 6:00–9:00 UTC corresponding to the onset of the SDS at 9:00 a.m.–10:00 a.m. on Kuwait local time.
The dust storms were also observed by the the aerosol robotic network (AERONET) [29] measurements. AERONET is an automatic robotic Sun- and sky-scanning measurement network that has grown rapidly to over 200 sites worldwide. AERONET uses multiangle radiance measurements to retrieve the discrete aerosol size distributions in 22 size bins ranging from 0.05 to 15 µm and the complex refractive index. AERONET provides a database with a fine temporal resolution, albeit for column rather than vertically resolved measurements The network has the important features of uniform data collection, calibration, and data processing procedures. Figure 4 below shows the onset of the dust storm on 22 June 2018. The aerosol optical depth (AOD) measurements show low optical depths from 3:00 to 6:00 UTC (6:00 a.m. to 9:00 a.m. local time). The AOD measurements increase by a factor of 3 from 0.1 to 0.3 in one hour between 9:00 a.m. and 10:00 a.m. local time. The onset of the SDS is around 10:00 a.m. (6:00 UTC). This is further confirmed by the precipitous drop in the Ångström Exponent (AE), the normalized logarithmic ratio of the optical depths at 500 nm and 870 nm. The AE is small for large particles and large for small particles. Figure 4 shows that there was a rapid increase in the number of large particles (dust) at 9:00 a.m. local time in Kuwait City on 22 June 2018 as will be shown in Section 3 of this paper from CALIPSO observations.
3.1. Single-Source Cases
The images show the days when the dust storms around Kuwait City were caused by transport of dust emanating from a single source. The data used for these studies are the version 4.0 CALIPSO Lidar level 2 attenuated backscatter returns at the 532 nm perpendicular and parallel channels. The volume depolarization ratio is determined from the perpendicular and parallel channels and used to identify dust aerosols [12,16]. In these studies, we examine the location of the dust in the column (how high is the layer), the horizontal extent (the distance over which the layer is stable), and the magnitude of the attenuated backscatter coefficient determined by the color key below Figure 5a. The most intense attenuated backscatter coefficient is about 0.1 m−1 sr−1 corresponding to an opaque dust layer. Attenuated backscatter coefficients ≤ 0.0007 m−1 sr−1 denote clear air molecules. The figures below show CALIPSO plots of the 532-nm attenuated backscatter coefficient profiles for the case study days when Kuwait City (denoted by a vertical white line) was impacted by a single source during a dust storm for dates indicated in plates (a–f). The color key for the magnitude of the backscatter coefficient is shown below plate (a). In the image, colors above the surface denoted by a red line, are coded as follows: blue indicates clear sky, white indicates clouds, and warm colors (green, yellow, orange, and red) indicate aerosols. Blue colors below clouds indicated fully attenuated signal, i.e., the Lidar signal did not penetrate the cloud.
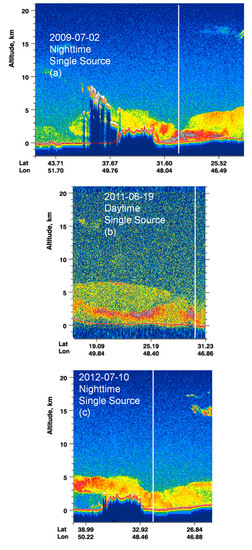
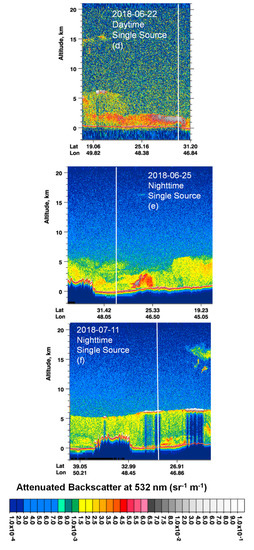
Figure 5.
(a–f) show the effect on Kuwait City of the dust from a single source. (a) A nighttime image of the 532 nm showing an extensive layer of dust right around Kuwait City. (b) A daytime concentration of dust over Kuwait City from a single source at the end of the spring or early summer of 2011. (c) A nighttime orbit that passes over Kuwait City (denoted by the white line) at about midnight in the summer of 2012 observing a layer of dust emanating from a single source. (d) A summer daytime observation of SDS in Kuwait City. (e,f) Nighttime dust distributions in the early and midsummer periods, respectively, both emanating from a single source.
The highest concentration of dust is near the center of the city (denoted by the white line) and extends southward to approximately latitude 25 deg N. It meets another layer that sits on top of this layer that extends up to 5 km just south of the city. To the north of the city, we also see another layer that seems to be descending around an orographic formation with a stable layer of dust just off the elevated region near latitude 31 deg N. There is very little activity above the dust layers at this time, and it is a relatively clear night with no clouds. The layer seems to be quite stable in this region and extends over 1350 km in the horizontal. However, the highest concentration of the dust is around the city as denoted by the gray regions where the attenuated backscatter coefficient is near 0.1 m−1 sr−1.
This is a daytime observation of the dust backscatter. Because of the low SNR at daytime of the CALIPSO Lidar data, the image does not look as sharp as the nighttime image shown in Figure 5a. However, one can still see many features of the dust layer from that daytime pass. Again, there is a very thick layer with high attenuated backscatter coefficient values near Kuwait City denoted by the gray color to the bottom right of the image. This layer is about 3 km above the ground. To the south of this layer is another strong layer also close to the ground. This layer is just below a much thinner layer riding on top of it, which may be an indication of the layers separating after transport from the single source. This daytime pass shows the dust layer is intense enough to result in significant air quality concerns near the ground.
The image shows that the layer reaches a height of about 5 km and stays at this height for approximately 500 km before it starts to descend over the orographic region. By the time the layer is over the city of Kuwait the top height is about 3 km. It holds steady and then gradually rises again as it travels south. The image shows a very stable layer on a relatively clear day. The only clouds visible in the top right-hand corner around an altitude 15 km are high cirrus clouds. Note that the layer is very stable as it is transported over the orographic formation near Kuwait City. It is relatively unchanged as it goes over the southern edge of the formation. The layer extends for about 3 km directly above the city and could potentially pose quite deleterious effects on air quality.
Figure 5d is a daytime image of a dust layer in the early summer that shows the relatively weak system to the south of Kuwait City. The system starts off at about 5 km and extends to the ground interspersed with a few sublayers of high dust concentration shown by the red colors. It descends to about 2 km as it gets closer to the city and does intensify right over the city as shown by the gray color that indicates high attenuated backscatter coefficients of nearly 0.1 m−1 sr−1. This is a daytime image with poor SNR compared to the nighttime image in (c) with very few clouds near and around the city.
Figure 5c,d show interesting contrasts between the daytime and nighttime dust formations near the surface. The nighttime systems seem to be quite well organized and rise to relatively higher altitudes over a longer spatial extent in the horizontal than daytime formations. However, we also see that the daytime dynamics confine the most intense layers with high backscatter coefficients near 0.1 km−1 sr−1 within 1 km of the surface. This may be an effect of a much better organized boundary layer system at daytime than at nighttime.
In Figure 5e, the dust layer is quite intense south of Kuwait as one approaches strong source regions in northern Saudi Arabia. Directly over Kuwait City the dust layer is dispersed to a height of about 5 km. Compared to the case in Figure 5c, the system is not well organized and seems to disintegrate around the orographic formation. Figure 5e shows that the stability of the layer can vary considerably from day to day regardless of surface characteristics.
Figure 5f shows a dust layer capped by strong boundary layer near 5 km altitude and extending for approximately 1500 km in the horizontal. There are two very strong cloud formations, each extending for approximately 200 km. One of these is directly over Kuwait City and strongly attenuates the Lidar signal though the surface is still visible below the cloud. The dust layer cannot be seen below the cloud as most of the signal has been attenuated by the cloud.
3.2. Combined Source SDS Cases
Figure 6a shows a well-organized system that extends for about 1000 km. The top of the layer is at an altitude of nearly 5 km around Kuwait City. As one follows the orbit to the north is a region of high dust intensity with attenuated backscatter coefficient values approaching 0.1 km−1 sr−1. On this day, there is very little cloud activity, and the dust seems to have been trapped in a relatively stable boundary layer. Figure 6b is the daytime image of dust from a combined source in the springtime. Because of the active convective activity shown by the presence of clouds between 5 and 10 km, the dust layer structure is quite disorganized. This may be because of an unstable boundary layer or the nature of the origin of the dust from different sources. However, there is still a quite significant dust layer near and around Kuwait City. The region of intense high attenuated backscatter coefficient values around 5 km is due to clouds mixed with dust particles. To the south is a region of intense dust concentration very close to the surface in northern parts of Saudi Arabia and close to the dust sources.
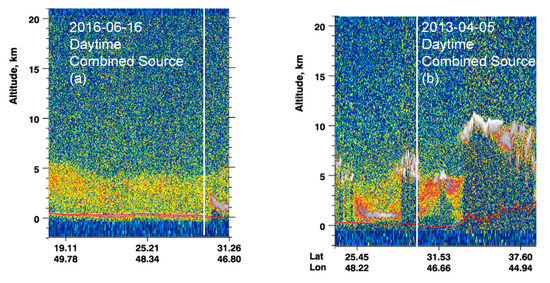
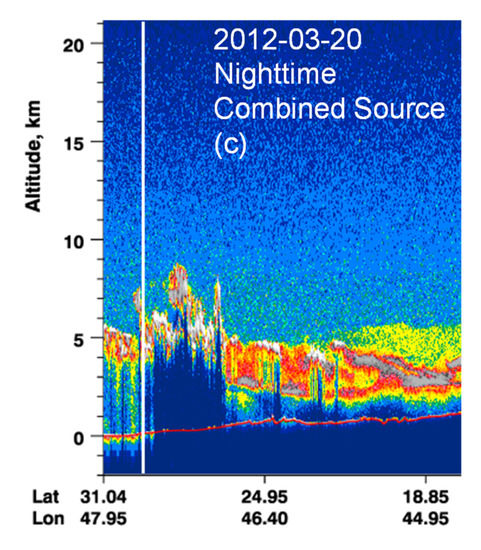
Figure 6.
(a,b) Dust from combined sources at daytime in clear and cloudy sky conditions. In the image on 6 June 2013, clouds, denoted by the white features are prominent. (c) Nighttime image showing significant convective activity near Kuwait City.
The CALIPSO nighttime overpass shows a number of unstable layers lifting the dust around Kuwait City. Just to the south of Kuwait City, the CALIPSO images suggest that the strong features are cloud formations, most likely remnants of convective activity. These have completely attenuated the signal. The CALIPSO subtyping algorithms [12,30] show that a significant portion of these layers are pure dust aerosols with some polluted dust interspersed within the layers. To the south of Kuwait latitude 25 and further southward is another significant dust layer. This is near the main source of dust in this region toward the northeastern corridor of Saudi Arabia. The dust storm on this day is the result of transport from multiple sources which may account for the relatively disorganized nature of the layer. It is very likely that this layer extends to the surface although the images do not show it because the signal is highly attenuated by the large optical depths of the layer. The structure of the layer is consistent with the images we have seen of aerosol layers when the source is more than one.
3.3. Unspecified Source Dust Storm Cases
There are several cases in which the dust source origin is unspecified, but the dust storm effects were manifested as high dust loading over the city. The dust storm shown in Figure 7a is an example showing a daytime image of a dust storm extending from 29 degrees north to about 37 degrees north and at an altitude of about 4.5 km above the ground near Kuwait City. Similarly, Figure 7b is a dust storm observed in the daytime in the autumn over Kuwait City originating from unspecified sources with a peak concentration at 2.5 km but extending above 5 km. The dust storm is not uniform in the vertical or horizontal dimension but is characterized by strong variations in both dimensions. There are interesting features at about 20° N–22° N where there is diagonally sloping region of heavy dust that gets stratified at approximately 3 km as one approaches Kuwait City (white line). The dust layer is extensive and stretches for more than 2000 km horizontally.
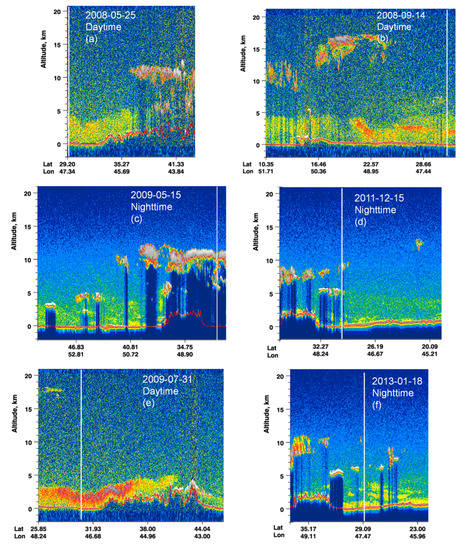
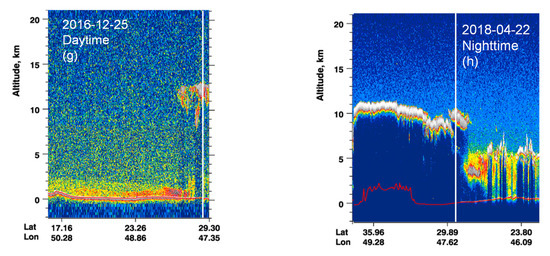
Figure 7.
(a,c) Daytime images of SDS near Kuwait City in late spring and early fall, respectively. (a) Mostly to the north of the city. (b) Mostly to the south of the city. (c,d) Images in the late spring and winter, respectively, of SDS observed in Kuwait City and its surroundings. The images show dust layers in intense convective activity in the springtime image (c) and remnants of convection in the winter (d). (e,f) Backscatter images of dust storms in daytime summer and nighttime winter, respectively. (g,h) Daytime winter and nighttime spring dust storms, respectively, near Kuwait City. On both occasions, there is considerable cloudiness near Kuwait City.
Figure 7c,d are nighttime images of days when there was a dust storm on record from unspecified sources. Because of the active convective storm activity over Kuwait City on 15 May 2009, the opaque clouds completely attenuate the Lidar signal and the dust below the cloud is not visible from above. Similarly, clouds above Kuwait City obscure the thin dust layers resulting from the dust storm recorded on 15 December 2011 (Figure 7d). However, a thin dust layer is visible to the south of Kuwait City. Both images show the limitations of the Lidar in observing thin aerosol layers below strong clouds. However, in each case we can see the aerosol layer extending over cloud free areas.
Figure 7e shows a daytime image of an intense dust storm from an unspecified source observed in the summer of 2009 that is mostly close to the ground at approximately 2.5 km above the city of Kuwait. The layer extends northwards for a horizontal distance of 1500 km. The dust layer breaks up in the mountain ranges in south Iran. The highest optical depths are realized as the dust is lifted over the southernmost mountains shown by the gray color code corresponding to an attenuated backscatter coefficient of 0.1 km−1 sr−1.
Figure 7f is a nighttime image of dust layers of a dust storm from an unspecified source during the winter of 2013. The image shows several small dust layers close to the surface. These layers are fragmented and relatively disorganized. Regions of strong dust optical depth are interspersed with clear air. The layers seem to be more contiguous closer to the surface. Few clouds can be seen throughout the vicinity. Dust storms are less frequent during the winter and do not seem to be as organized as summer dust storms. The dispersion of the dust could also be explained by the lack of a stable boundary layer at night. A similarly weak dust formation was also observed in Figure 7d, another winter storm case.
Figure 7g shows a daytime distribution of dust from a dust storm emanating from an unspecified source. This case has a strong boundary layer close to the surface that confines the bulk of the dust below 2 km. The vicinity of Kuwait City, depicted by the white line, is under a strong high cloud at about 12 km that obscures the signal such that the dust layer is not visible. This is a wintertime layer, but the difference between this layer and the previously observed wintertime layers is that this layer is confined close to the surface and seems to be quite well organized because of the strong daytime boundary layer.
Figure 7h is a nighttime image of a dust layer resulting from a dust storm originating from unspecified sources. This dust storm is transported across very strong convective systems on this spring night. There are high clouds to the north obscuring the dust layer near the city. Some dust is visible south of Kuwait City, but these are interspersed with low clouds, and the dust system does not seem to be organized at all.
Table 3 shows the volume depolarization ratios of the dust storms from the three sources. The dust storms from unspecified sources show the lowest depolarization ratios (0.17), which is expected because these dust storms are likely mixed with different aerosol types including pollution particles which tend to be spherical and therefore depress the overall volume depolarization ratio. The depolarization ratios from single and combined sources are comparable (0.22 and 0.23, respectively) and suggest layers with significant fractions of nonspherical particles. The color ratio, defined as the ratio of the backscatter at 1064 nm (red channel) to the backscatter at 532 nm (green channel) can be used to infer the size. Small color ratios (0–0.7) denote small particles (<1.0 µm), whereas color ratios of closer to 1 are associated with larger particles (˃1.0 µm in diameter) The color ratio is quite similar between the three dust types indicating that the particle sizes do not vary with the source of the dust. The aerosol optical depths show that the highest values are associated with dust layers originating from a single source. The aerosol optical depths of layers from unspecified sources are the smallest (0.3) compared to the specified sources and combined sources with AODs of 0.63 and 0.47, respectively. The layers from unspecified sources lack organization, are relatively dispersed in the column and are characterized by lower aerosol loading. Aerosols from a single source and those from unspecified sources are generally lower in altitude by almost 1 km compared to aerosols from combined sources. Table 4 shows the same characteristics centered around Kuwait City but averaged for 440 km from the city center. These two tables compare the dust properties (depolarization ratio, color ratio, AOD, and layer height) in two concentric areas with radii of 220 km and 440 km centered at Kuwait City. Notice how similar the properties are, which indicates that the dust does not change appreciably over the wider area, and is consistent for up to 440 km.
Table 3.
Characteristics of dust layers observed within 220 km of Kuwait City analyzed from the CALIPSO images.
Table 4.
Characteristics of dust layers observed within 440 km of Kuwait City analyzed from the CALIPSO images.
4. Conclusions
CALIPSO data has been used to study 17 individual dust storm cases observed near the city of Kuwait occurring during all seasons. The sources were classified as single source, combined sources, or unspecified sources. The largest number of cases were from unspecified sources, and the smallest number were from combined sources. The strongest dust storms occurred in the summer months, and the aerosol layers seem to be well organized for the daytime cases. The dust layers reached the highest altitudes (3.67 km) for the combined cases. In many cases, the winter dust layers are relatively more disorganized, especially at night when the boundary layer was weak. The most well-organized layers close to the ground were observed at daytime during the summer months. Dust layers from unspecified sources had lower volume depolarization ratios. This is most likely due to mixing with other aerosol types, thereby reducing the fraction of nonspherical particles. In general aerosols from single sources exhibited the highest aerosol optical depth ratios. The lowest aerosol optical depth ratios were associated with dust storms from unspecified sources. The color ratios of the aerosols from the three sources do not show significant variation, suggesting that the dust particles from these dust sources are similar in size.
The dust storms observed in this region are extensive and can be contiguous for hundreds of kilometers. The daytime system seemed to be well organized, and the dust layer top altitudes are seldom higher than 5 km. The characteristics of the data of the dust layers were determined by analyzing the averages in a region of a 220-km radius around the city center of Kuwait. Of the characteristics studied, the clearest differences are recorded for the aerosol optical depths and the layer top altitude. The highest optical depths are about 0.7, and the highest layer top altitudes are on average 4 km. These two characteristics are important for estimating the impact of the dust layers on air quality around Kuwait City. The largest impact on air quality is likely to be from aerosols originating from a single source because of the high optical depths and low layer top altitudes which means the dust is closer to the ground while at the same time of higher aerosol loading. Finally, the dust layer properties of depolarization, color ratio, optical depth, and layer height are consistent for up to 440 km for these SDS events.
Author Contributions
Conceptualization, A.H.O. and A.A.-D.; methodology, J.T. and A.H.O.; software, J.T.; validation, A.H.O., J.T. and A.H.O.; formal analysis, A.H.O., J.T. and A.A.-D.; investigation, A.H.O., J.T. and A.A.-D.; resources, A.H.O., J.T. and A.A.-D.; data curation, J.T.; writing—original draft preparation, A.H.O., J.T. and A.A.-D.; project administration, A.H.O.; funding acquisition, A.H.O. All authors have read and agreed to the published version of the manuscript.
Funding
This research received no external funding.
Institutional Review Board Statement
Not Applicable.
Informed Consent Statement
Not Applicable.
Data Availability Statement
Data is available at https://asdc.larc.nasa.gov/project/CALIPSO (accessed on 20 November 2022). The AERONET data were obtained from the AERONET site https://aeronet.gsfc.nasa.gov/ (accessed on 20 November 2022).
Acknowledgments
The CALIPSO data were obtained from the NASA Langley Research Center Atmospheric Science Data Center. We thank the PI(s) and Co-I(s) of the Kuwait University AERONET site and their staff for establishing and maintaining the site used in this investigation.
Conflicts of Interest
The authors declare no conflict of interest.
References
- Winker, D.M.; Vaughan, M.A.; Omar, A.; Hu, Y.; Powell, K.A.; Liu, Z.; Hunt, W.H.; Young, S.A. Overview of the CALIPSO Mission and CALIOP Data Processing Algorithms. J. Atmos. Ocean. Technol. 2009, 26, 2310–2323. [Google Scholar] [CrossRef]
- Winker, D.M.; Hunt, W.H.; Hostetler, C.A. Status and Performance of the CALIOP Lidar. SPIE Int. Soc. Opt. Eng. 2004, 5575, 8–15. [Google Scholar]
- Murayama, T.; Okamoto, H.; Kaneyasu, N.; Kamataki, H.; Miura, K. Application of lidar depolarization measurement in the atmospheric boundary layer: Effects of dust and sea-salt particles. J. Geophys. Res. 1999, 104, 31781–31792. [Google Scholar] [CrossRef]
- Gobbi, G.P.; Barnaba, F.; Giorgi, R.; Santacasa, A. Altitude-resolved properties of a Saharan dust event over the Mediterranean. Atmos. Environ. 2000, 34, 5119–5127. [Google Scholar] [CrossRef]
- Reagan, J.A.; Thome, K.J.; Powell, D.M. Lidar Aerosol Ratio: Measurements and Models. In Proceedings of the International Geosciences and Remote Sensing Symposium (IGARSS), Sidney, Australia, 9–13 July 2001. [Google Scholar]
- Sakai, T.; Shibata, T.; Hara, K.; Kido, M.; Osada, K.; Hayashi, M.; Matsunaga, K.; Iwasaka, Y. Raman lidar and aircraft measurements of tropospheric aerosol particles during the Asian dust event over central Japan: Case study on 23 April 1996. J. Geophys. Res. 2003, 108, 4349. [Google Scholar] [CrossRef]
- Barnaba, F.; Gobbi, G.P. Modeling the aerosol extinction versus backscatter relationship for lidar applications: Maritime and continental conditions. J. Atmos. Ocean Tech. 2004, 21, 428–442. [Google Scholar] [CrossRef]
- Sugimoto, N.; Lee, C.H. Characteristics of dust aerosols inferred from lidar depolarization measurements at two wavelengths. Appl. Optics 2006, 45, 7468–7474. [Google Scholar] [CrossRef] [PubMed]
- Ansmann, A.; Baars, H.; Tesche, M.; Muller, D.; Althausen, D.; Engelmann, R.; Pauliquevis, T.; Artaxo, P. Dust and smoke transport from Africa to South America: Lidar profiling over Cape Verde and the Amazon rainforest. Geophys. Res. Letts. 2009, 36, 5. [Google Scholar] [CrossRef]
- Ansmann, A.; Petzold, A.; Kandler, K.; Tegen, I.N.A.; Wendisch, M.; Mueller, D.; Weinzierl, B.; Muelller, T.; Heintzenberg, J. Saharan Mineral Dust Experiments SAMUM–1 and SAMUM–2: What have we learned? Tellus B 2011, 63, 403–429. [Google Scholar] [CrossRef]
- Kai, K.; Nagata, Y.; Tsunematsu, N.; Matsumura, T.; Kim, H.S.; Matsumoto, T.; Hu, S.J.; Zhou, H.F.; Abo, M.; Nagai, T. The structure of the dust layer over the Taklimakan desert during the dust storm in April 2002 as observed using a depolarization lidar. J. Meteorol. Soc. Japan 2008, 86, 1–16. [Google Scholar] [CrossRef][Green Version]
- Omar, A.H.; Winker, D.M.; Kittaka, C.; Vaughan, M.A.; Liu, Z.; Hu, Y.; Rogers, R.R.; Ferrare, R.A.; Lee, K.-P.; Kuehn, R.E.; et al. The CALIPSO automated aerosol classification and lidar ratio selection algorithm. J. Atmos. Ocean. Technol. 2009, 26, 1994–2014. [Google Scholar] [CrossRef]
- Omar, A.; Liu, Z.; Vaughan, M.; Thornhill, K.; Kittaka, C.; Ismail, S.; Anderson, B. Extinction-to-backscatter ratios of Saharan dust layers derived from in situ measurements and CALIPSO overflights during NAMMA. J. Geophys. Res. 2010, 115, D24217. [Google Scholar] [CrossRef]
- Vaughan, M.A.; Powell, K.A.; Kuehn, R.E.; Young, S.A.; Winker, D.M.; Hostetler, C.A.; Hunt, W.H.; Liu, Z.Y.; McGill, M.J.; Getzewich, B.J. Fully Automated Detection of Cloud and Aerosol Layers in the CALIPSO Lidar Measurements. J. Atmos. Ocean. Technol. 2009, 26, 2034–2050. [Google Scholar] [CrossRef]
- Hu, Y.; Winker, D.; Vaughan, M.; Lin, B.; Omar, A.; Trepte, C.; Flittner, D.; Yang, P.; Nasiri, S.L.; Baum, B.; et al. CALIPSO/CALIOP Cloud Phase Discrimination Algorithm. J. Atmos. Oceanic Technol. 2009, 26, 2293–2309. [Google Scholar] [CrossRef]
- Liu, Z.Y.; Vaughan, M.; Winker, D.; Kittaka, C.; Getzewich, B.; Kuehn, R.; Omar, A.; Powell, K.; Trepte, C.; Hostetler, C. The CALIPSO Lidar Cloud and Aerosol Discrimination: Version 2 Algorithm and Initial Assessment of Performance. J. Atmos. Oceanic Technol. 2009, 26, 1198–1213. [Google Scholar] [CrossRef]
- Al-Dousari, A.; Ramadan, A.; Al-Qattan, A.; Al-Ateeqi, S.; Dashti, H.; Ahmed MAl-Dousari, N.; Al-Hashash, N.; Othman, A. Cost and effect of native vegetation change on aeolian sand, dust, microclimate and sustainable energy in Kuwait. J. Taibah Univ. Sci. 2020, 14, 628–639. [Google Scholar] [CrossRef]
- Al-Awadhi, J.M.; Al-Dousari, A.; Al-Enezi, A. Barchan dunes in northern Kuwait. Arab. Gulf J. Sci. Res. 2000, 18, 32–40. [Google Scholar]
- Al-Dousari, A.M. Causes and indicators of land degradation in northwestern part of Kuwait. Arab Gulf J. Sci. Res. 2005, 23, 69–79. [Google Scholar]
- Al-Dousari, A.M.; Ibrahim, M.I.; Al-Dousari, N.; Ahmed, M.; Al-Awadhi, S. Pollen in aeolian dust with relation to allergy and asthma in Kuwait. Aerobiologia 2018, 34, 325–336. [Google Scholar] [CrossRef]
- Al-Dousari, A.; Pye, K.; Al-Hazza, A.; Al-Shatti, F.; Ahmed, M.; Al-Dousari, N.; Rajab, M. Nanosize inclusions as a fingerprint for aeolian sediments. J. Nanoparticle Res. 2020, 22, 1–15. [Google Scholar] [CrossRef]
- Al-Ghadban, A.N.; Saeed, T.; Al-Dousari, A.M.; Al-Shemmari, H.; Al-Mutairi, M. Preliminary assessment of the impact of draining of Iraqi marshes on kuwait’s northern marine environment. parti. physical manipulation. Water Sci. Technol. 1999, 40, 75–87. [Google Scholar] [CrossRef]
- Subramaniam, N.; Al-Sudairawi, M.; Al-Dousari, A.; Al-Dousari, N. Probability distribution and extreme value analysis of total suspended particulate matter in Kuwait. Arab. J. Geosci. 2015, 8, 11329–11344. [Google Scholar] [CrossRef]
- Neelamani, S.; Al-Dousari, A. A study on the annual fallout of the dust and the associated elements into the Kuwait Bay, Kuwait. Arab. J. Geosci. 2016, 9, 210. [Google Scholar] [CrossRef]
- Ahmed, M.; Al-Dousari, A. Rehabilitation of Artificial Degraded Playa Using Palm Mat Water Conservation Techniques. J. Agri. Sci. Tech. 2015, 5, 90–98. [Google Scholar] [CrossRef][Green Version]
- Francis, D.; Chaboureau, J.-P.; Nelli, N.; Cuesta, J.; Alshamsi, N.; Temimi, M.; Pauluis, O.; Xue, L. Summertime dust storms over the Arabian Peninsula and impacts on radiation, circulation, cloud development and rain. Atmos. Res. 2021, 250, 105364. [Google Scholar] [CrossRef]
- Al-Dousari, A.; Omar, A.; Al-Hemoud, A.; Aba, A.; Alrashedi, M.; Alrawi, M.; Rashki, A.; Petrov, P.; Ahmed, M.; Al-Dousari, N.; et al. A Success Story in Controlling Sand and Dust Storms Hotspots in the Middle East. Atmosphere 2022, 13, 1335. [Google Scholar] [CrossRef]
- Doronzo, D.M.; Al-Dousari, A.; Folch, A.; Dagsson-Waldhauserova, P. Preface to the dust topical collection. Arab. J. Geosci. 2016, 9, 1. [Google Scholar] [CrossRef]
- Holben, N.B.; Eck, T.F.; Slutsker, I.; Tanre, D.; Buis, J.P.; Setzer, A.; Vermote, E.; Reagan, J.A.; Kaufman, Y.; Nakajima, T.; et al. AERONET—A federated instrument network and data archive for aerosol characterization. Rem. Sens. Env. 1998, 66, 1–16. [Google Scholar] [CrossRef]
- Kim, M.-H.; Omar, A.H.; Tackett, J.L.; Vaughan, M.A.; Winker, D.M.; Trepte, C.R.; Hu, Y.; Liu, Z.; Poole, L.R.; Pitts, M.C.; et al. The CALIPSO version 4 automated aerosol classification and lidar ratio selection algorithm. Atmos. Meas. Tech. 2018, 11, 6107–6135. [Google Scholar] [CrossRef]
Publisher’s Note: MDPI stays neutral with regard to jurisdictional claims in published maps and institutional affiliations. |
© 2022 by the authors. Licensee MDPI, Basel, Switzerland. This article is an open access article distributed under the terms and conditions of the Creative Commons Attribution (CC BY) license (https://creativecommons.org/licenses/by/4.0/).