Article

Spatial-Temporal Variation in Health Impact Attributable to PM2.5 and Ozone Pollution in the Beijing Metropolitan Region of China

1
Asia Center for Air Pollution Research (ACAP), Niigata 950-2144, Japan
2
Graduate School of Science and Technology, Niigata University, Niigata 950-2181, Japan
*
Author to whom correspondence should be addressed.
Atmosphere 2022, 13(11), 1813; https://doi.org/10.3390/atmos13111813
Submission received: 23 September 2022 / Revised: 21 October 2022 / Accepted: 25 October 2022 / Published: 31 October 2022
(This article belongs to the Special Issue Air Quality Assessments and Management)

Abstract

:
This study aimed to estimate and compare the spatial-temporal variation in health impact attributable to PM2.5, including the major particulate constituents and anthropogenic emission sectors of PM2.5, and ozone in the Beijing–Tianjin–Hebei (BTH) region using monitoring data from 2013 to 2020. The liquid phase reaction may play an important role in PM2.5 formation in winter. We estimated that 110,613 [(95% CI): 91,913, 128,615] and 9921 (95% CI: 3325, 13,191) cases of all-cause mortality in 2020 were attributable to exposure to PM2.5 and ozone in the BTH region, respectively. The control of PM2.5 pollution is currently a priority over that of ozone. An appropriate co-control policy for PM2.5 and ozone pollution is necessary for the surrounding areas of Beijing City to protect public health. From 2013 to 2020, the mortality owing to exposure to PM2.5 dropped significantly. The reduction in carbonaceous components in PM2.5 can have the most effective health benefits. The top two contributing emission sectors to the mortality from PM2.5 in Beijing were regional transportation and vehicles which could explain approximately 6.5% and 5.1% of the total mortality, respectively. The mortality owing to PM2.5 was higher in Beijing than in Tokyo and Bangkok in East Asia.

1. Introduction

Ambient air pollution is a serious environmental risk factor and a leading contributor to mortality. In this study, we focused on two key indicators of ambient air pollution, namely PM2.5 and ozone, as these are considered to be the most consistent and independent predictors of the health effects of ambient air pollution [1,2]. In 2015, ambient PM2.5 and ozone were ranked 5th and 34th among risk factors for global deaths, respectively [2]. PM2.5 has several adverse effects on human health, such as early death from heart or lung disease, non-fatal heart attack, arrhythmia, exacerbation of asthma, lung dysfunction, and increased respiratory symptoms. Ozone is a powerful oxidizing substance that stimulates the respiratory system. Ozone traps air in the alveoli, causing airway muscles to contract. This can lead to wheezing and shortness of breath. PM2.5 consists of complex compositions, with the health risks varying among constituents, and different proportions of them in PM2.5 may induce more or less PM2.5-related effects. It has been reported that the anthropogenic compositions which mainly account for the mass concentration of PM2.5 including organic carbon (OC) and elemental carbon (EC) and secondary aerosol constituents (SO42− and NO3, etc.) have a positive association with human mortality [3]. The emitted amounts of PM2.5 and its composition are different among various emission sectors. The magnitudes of the health risk effect largely vary by location due to the difference in the emission sources of PM2.5 across regions. For policymakers, understanding the contribution of different emission sectors to health effects is needed for effective pollution mitigation efforts.
As reported before, premature mortality owing to PM2.5 and ozone grew rapidly in Asia in recent years [4,5]. With rapid economic development and the increasing use of fossil fuels, China is facing serious air pollution, accompanied by severe health problems. In China, more than 1.3 billion people are at high risk attributable to PM2.5, which exceeds the air quality guidelines of the World Health Organization [6]. The Global Burden of Disease (GBD) 2015 estimated that the number of deaths attributable to PM2.5 exposure (57 µg/m3) in China was 1,139,724 in 2013 [7]. In early 2013, Beijing, Hebei, and other regions in China suffered from persistent haze, which had a serious effect on people’s health and on economic and social development. Public concern plays an important role in regulating social behavior by putting pressure on the government [8]. The same year, the Chinese government released the Action Plan for the Prevention and Control of Air Pollution to resolve this problem. Because of the control policy of PM2.5 in recent years and also the influence of the COVID-19 pandemic since 2020, the emission from anthropogenic sectors of PM2.5 is expected to be changed.
Most current studies on health impacts have focused on particulate matter pollution or ozone pollution at the national level [6,9], but limited studies have investigated the spatial distribution of air pollutant concentrations and their corresponding health effects at a regional level which limits the essential information available to local policymakers. In particular, few studies have presented the regional characteristics and driving factors of the spatial distribution of health impacts in China, such as meteorological conditions and population density distribution. Meteorological conditions play essential roles in modulating the atmospheric processes leading to distinct daily, seasonal, and inter-annual variations in air pollution. The changes in local meteorological conditions, such as temperature, humidity, wind, precipitation, radiation intensity, and so on, may serve as indispensable factors associated with the production and removal of pollutants from the atmosphere [10]. Zhang et al. reported that meteorological conditions will favor winter PM2.5 and summer O3 extremes under a high emission scenario in the North China Plain [11]. It has been reported that the severe winter haze during the 2013 winter in the Beijing area was driven by stable synoptic meteorological conditions over northeastern China and not by an abrupt increase in anthropogenic emissions [12]. It is important to analyze the effect of meteorological parameters on the time variation and spatial distribution of air pollutants. The particulate matter comes from both primary sources, such as combustion and dust-related sources, and also atmospheric reactions, namely secondary inorganic/organic particles. On the contrary, ozone is typically a secondary pollutant. The trend analysis and comparison of health impact attributable to PM2.5 and ozone could provide essential information for co-control policy, which has not been studied sufficiently in East Asia. To date, there have been few studies of the links between compositions and source sectors of particulate matter and mortality in developing countries in Asia. In light of the severe pollution and the knowledge gaps mentioned above, in this study, we investigated and compared the annual trend of health impact attributable to the compositions and emission sectors of PM2.5 in the representative cities in China; this scientific finding has not been achieved at the regional level in the Asian developing countries yet.
In view of the important role of prioritized control policy in mitigating the health risk related to PM2.5 and ozone, we explored the temporal-spatial variation in PM2.5 and ozone from 2013 to 2020 in the BTH region including Beijing City, Tianjin City, and Hebei Province using monitoring data to understand the status of regional air pollution and the influence of meteorological conditions and estimate the health impact attributable to PM2.5 and ozone, also compared with that in the other representative regions in East Asia.

2. Materials and Methods

2.1. Study Area

The most polluted area with PM2.5 in 2015 was located in northern China (Figure 1), where the BTH region is located in the capital metropolitan region of the country. The BTH region covers an area of 216,000 km2 and had a population of 110 million in 2020. The BTH region is surrounded by mountains to the west (Taihang Mountains) and north (Yanshan Mountains), the Sea of Bohai to the east, and the Heibei Plain to the south. The BTH region has a typical continental climate with hot and rainy summers, cold and dry winters, and short springs and autumns.
The BTH region was designated as one of the key areas for air pollution prevention and control since the severe haze pollution occurred in early 2013 [13]. Diseases related to air pollution, including heart, cerebrovascular, and respiratory system diseases, were ranked second to fourth in death rate and composition from 10 major diseases in recent years [14].

2.2. Data Collection

PM2.5, ozone exposure levels, and the number of premature deaths in the BTH metropolitan region were assessed from 2015 to 2020. The daily monitoring data of PM2.5 and ozone were obtained from the website of the China Ministry of Ecology and Environment (http://datacenter.mee.gov.cn, accessed on 5 April 2021). There are 35, 15, and 53 monitoring sites in Beijing, Tianjin City, and Hebei Province, respectively. Significant agreement was obtained between daily PM2.5 concentration data from the US Embassy in Beijing and the nearest monitoring site within the study periods (Figure S1). The methodology and QA/QC process for PM2.5 and ozone measurement in the national monitoring sites are described in the technical manuals of PM2.5 and ozone monitoring, respectively [15,16,17]. Data on population and local death rate (Table S1) were collected from the Statistical Year Book of China. Local baseline incidences (BIs) in the BTH region were used to reveal the health effects associated with PM2.5 and ozone pollution. The incidence of mortality was collected from the 2019 Year Book of Health in the People’s Republic of China.
The daily data on temperature, relative humidity, wind direction, wind speed, air pressure, and sunshine hours from meteorological stations in the BTH region from 2015 to 2018 (the meteorological data in this period are available for this study) were collected from the China Meteorological Data Service Center (http://data.cma.cn, accessed on 6 April 2020). Only the dataset of air concentration and meteorological parameters during the simultaneous period (from 2015 to 2018) was used for the meteorological effect discussion based on the seasonal variation and correlation analysis in Section 3.2.
The results of main anthropogenic compositions (OC, EC, SO42−, and NO3) (Table S2) and source appointments of PM2.5 in Beijing (Figure S3) were obtained from the published papers [18,19,20,21,22,23] and the report of Beijing Municipal Ecology and Environment Bureau (BMEEB), respectively. BMEEB conducted the project on source appointments of PM2.5 in 2012–2013, 2017–2018, and 2020–2021. The results (Figure S3) present the change in emission amounts of source sectors of PM2.5 in Beijing between 2017 and 2020.
For comparison with the results evaluated in the BTH region, this study also estimated the all-cause mortality in Tokyo, Japan, in 2015 and Bangkok, Thailand, in 2016 attributable to PM2.5 including particulate compositions and emission sectors. Tokyo is a representative metropolitan city in a developed country in East Asia, and Bangkok is a typical metropolitan city in a developing country in Southeast Asia. The dataset of particulate compositions (OC, EC, SO42−, and NO3) and results of appointments in Tokyo and Bangkok were obtained from the report of the Ministry of Environment Japan and the report on “A Study in Urban Air Pollution Improvement in Asia” by the Japan International Cooperation Agency (JICA) Ogata Research Institute [24] and a related paper [25], respectively. The baseline incidence and population data, data source of particulate compositions, and emission sectors are shown in Tables S1 and S2, and Figure S3, respectively.

2.3. Health Impact Assessment

As recommended by the WHO and other studies [26,27,28,29], the linear-log function was used to estimate the all-cause mortality attributable to exposure to PM2.5 using the following equation:
I = I0 × exp {β × (C − C0)}
where I is the mortality rate and I0 is the mortality at C0, C is the annual mean concentration of PM2.5 and particulate constituents, and C0 is the threshold concentration. Threshold concentration refers to that below which PM2.5 had no adverse effect on mortality (in this study, we assumed no threshold for the health impact from PM2.5 or particulate compositions). The unit-less exposure–response coefficient β is derived from the relative risk (RR) value reported in epidemiological studies, which indicates the proportion of the health effects of change per unit of PM2.5 [28,29] (Table S3). The annual mean concentration of PM2.5 was selected as the reference concentration.
The number of all-cause mortality was calculated using the following equation:
Y = E0 × {(I − I0)/I} × P = E0 × {1 − exp [−β × (C − C0)]} × P
where Y is the number of deaths caused by PM2.5, E0 (‰) is the baseline incidence rate, and P is the population.
By eliminating (or restricting) the emission sectors, many deaths could be avoided [9]. In this study, sector-specific mortality is used to estimate the human health benefit. The sector-specific mortality method first calculates the fractional PM2.5 concentrations from an emission sector (CSECTOR), which is equal to the fraction contribution of this sector (Figure S3) multiplied by the PM2.5 concentration, and then uses this fraction to scale the total mortality estimate.
CSECTOR = C × Fraction of an emission sector (%)
YSECTOR = E0 × {1 − exp [−β × (CSECTOR − C0)]} × P
YSECTOR is the mortality owing to a specific sector, and CSECTOR is the concentration of PM2.5 emitted from a specific emission sector.
To estimate the number of deaths attributable to annual ozone levels exceeding the reference level, we used the following equation:
M o r t a l i t y O 3 ( i , j , n ) = Y 0 ( i , j , n ) { 1 e x p [ β O 3 Δ O 3 ( i , j , n ) ] }
Δ O 3 ( i , j , n ) = [ max 8   h   m e a n 35 ] n
where n is the calculation day, Y0 is the daily incidence of premature mortality at a certain ozone level where there is no clear health effect likely to occur (in this study, it is estimated by multiplying the population by the daily baseline mortality), β is estimated based on an RR value, and ΔO3 is the change in ozone concentration calculated based on the daily maximum 8 h mean concentrations above 35 ppb [30].
The annual average concentration of PM2.5 and the 8 h maximum mean concentration of ozone were input into the ArcGIS system to generate health risk values using the Kriging method and then illustrate the geographical distribution of mortality. The ArcGIS was used to generate the spatial distribution of the concentration of PM2.5 in China, the concentration of PM2.5 and ozone in the BTH region, and the all-cause mortality attributable to PM2.5 and ozone in the BTH region. The population distribution in the BTH region was obtained from the Gridded Population of the World (https://sedac.ciesin.columbia.edu/data/set/gpw-v4-admin-unit-center-points-population-estimates-rev11, accessed on 1 June 2020) [31]; the size of the population grid cell was approximately 0.04167 [4,5].
Uncertainty in the assessment of the mortality effects of ambient air pollutants often lies in the exposure assessment and mortality baseline [6]. Because there is no full geographical coverage of the ground monitors, it is impossible to be certain that the estimated exposure coincides with the actual ambient concentrations in a given location. Gridded population data were used in this study, and a lack of discussion on the dynamic changes in population distribution may lead to low assessment accuracy [26]. Even if population exposure is well estimated, individual exposure can vary substantially as a result of differences in concentrations at different places as well as individual activity patterns. Personal monitoring is generally necessary to assess individual-level risk. Additionally, most CR functions do not consider the influence of co-existing air pollutants such as PM2.5 and ozone. There is a lack of direct epidemiological evidence in China. Studies are urgently needed in heavy pollution regions because the health response per unit change in air pollution at such high levels may differ from that seen in countries with lower pollution levels.

3. Results and Discussion

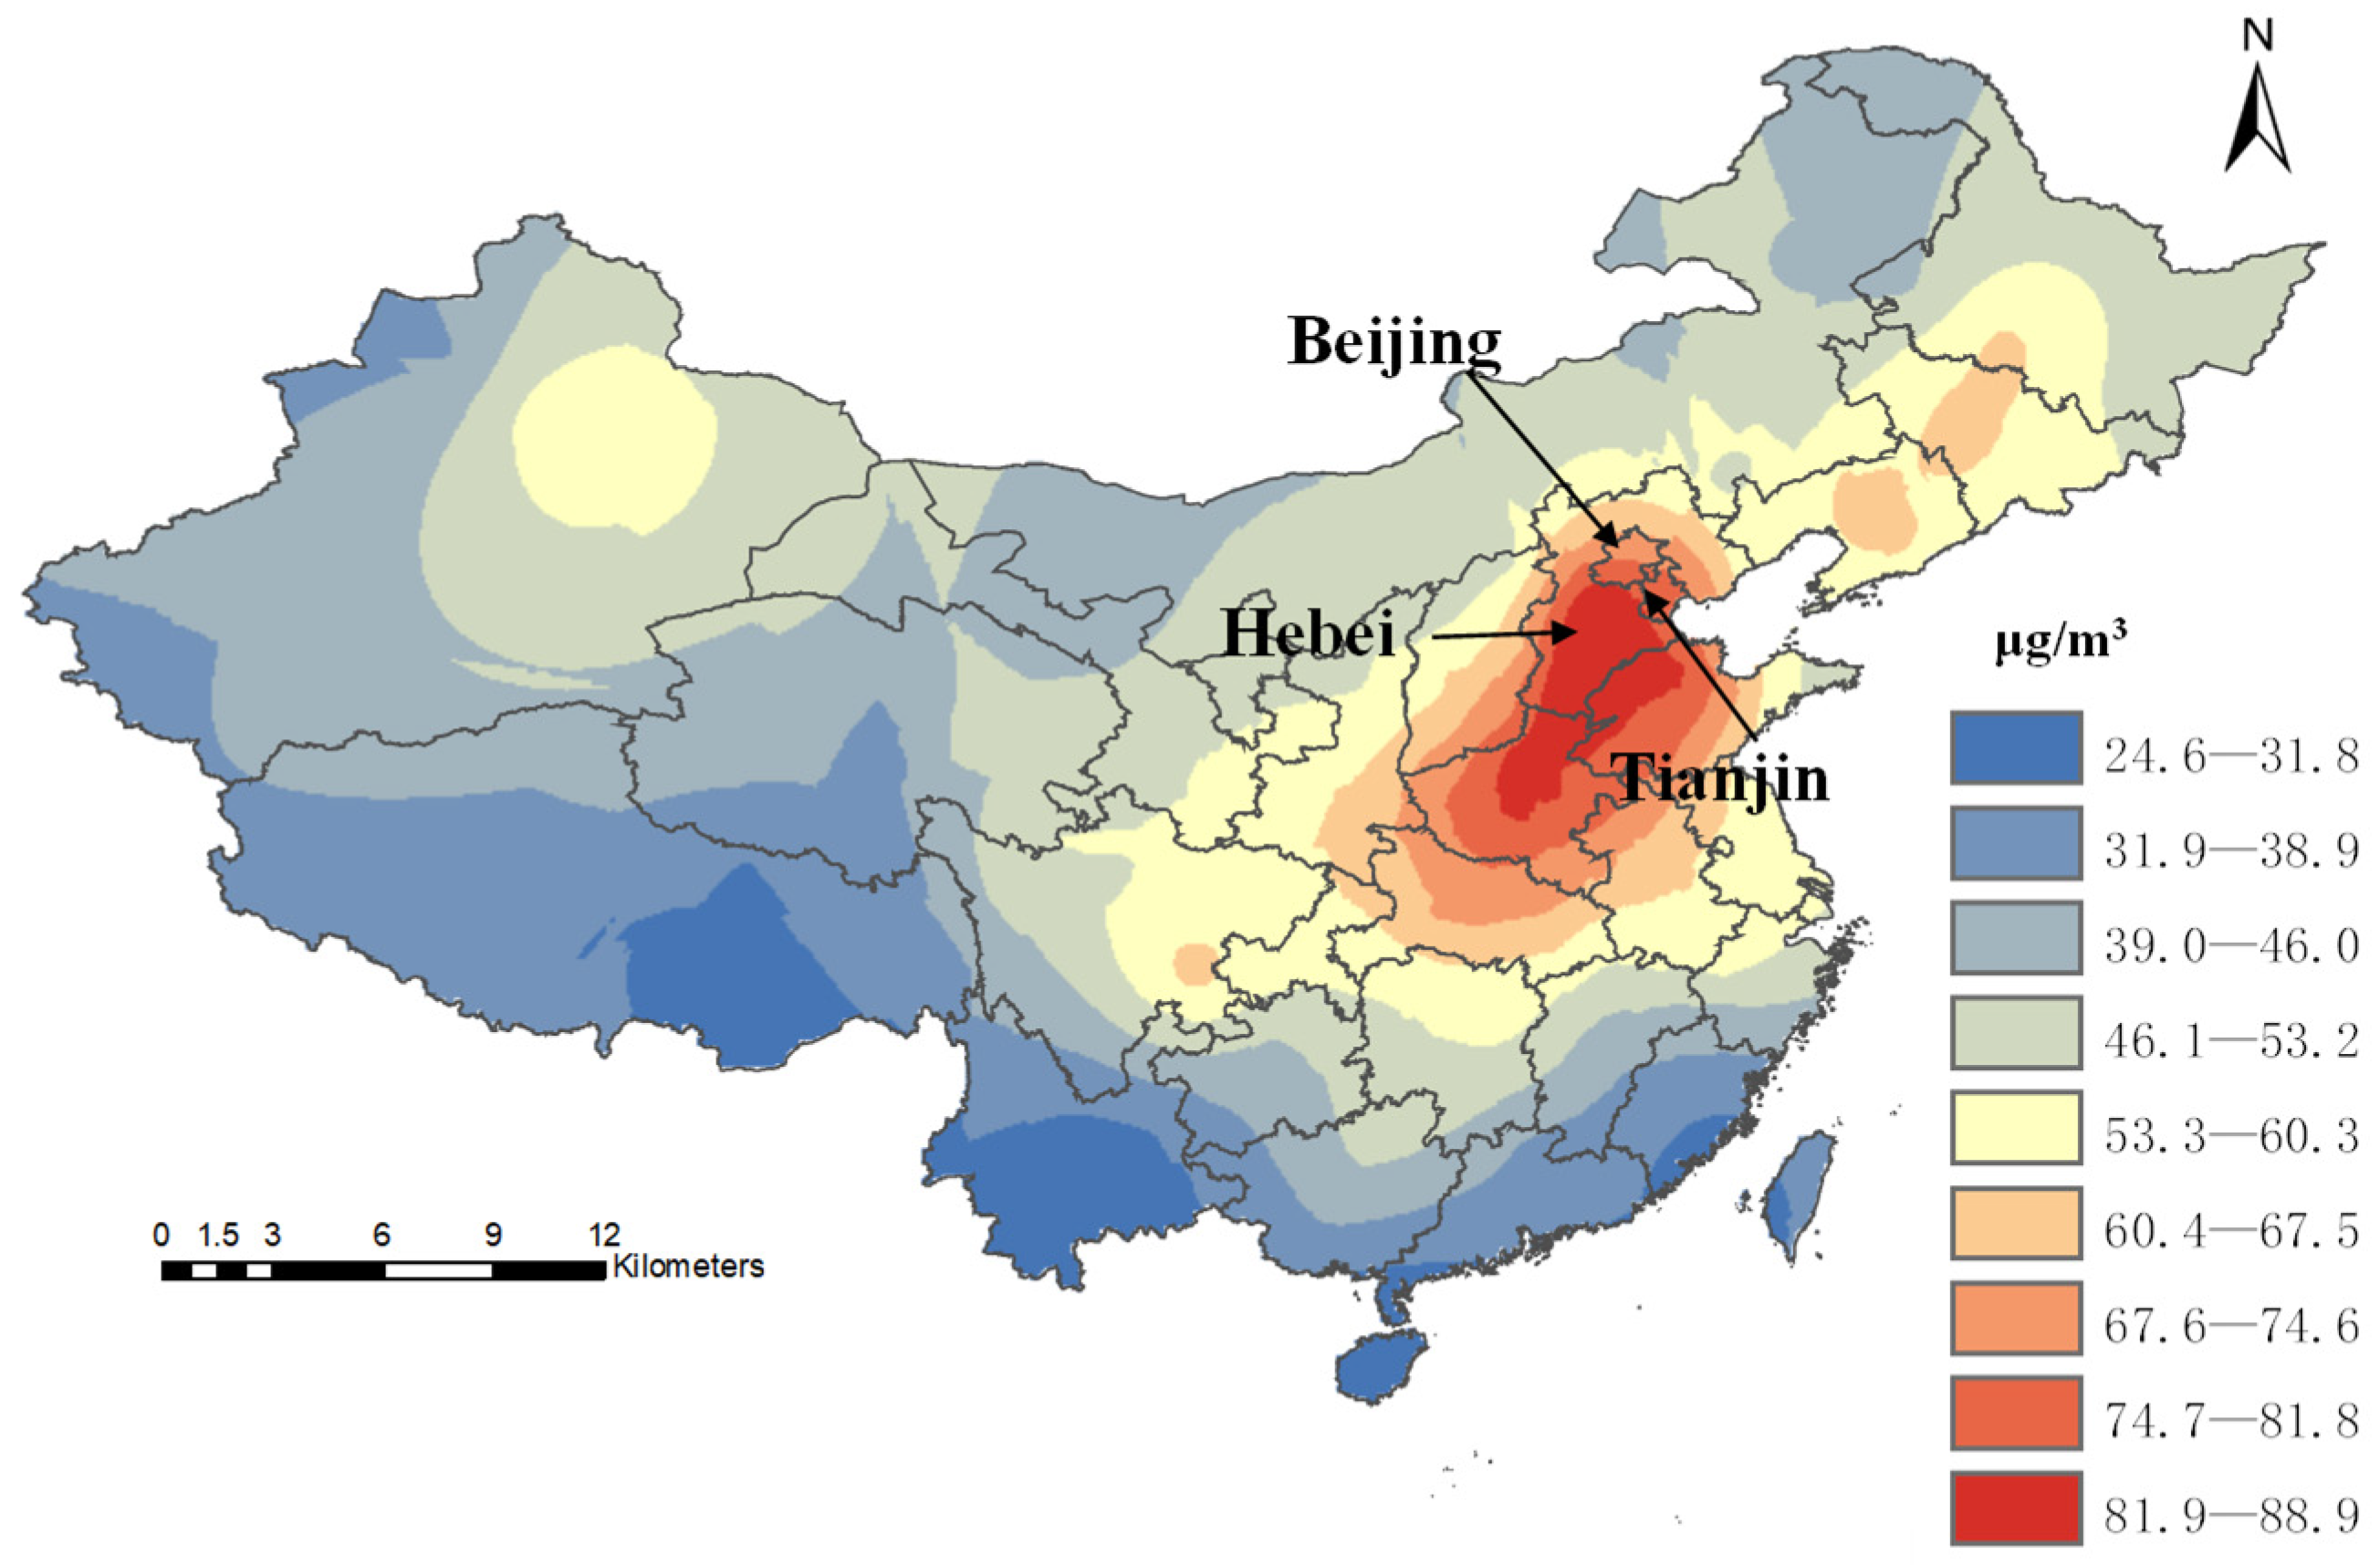
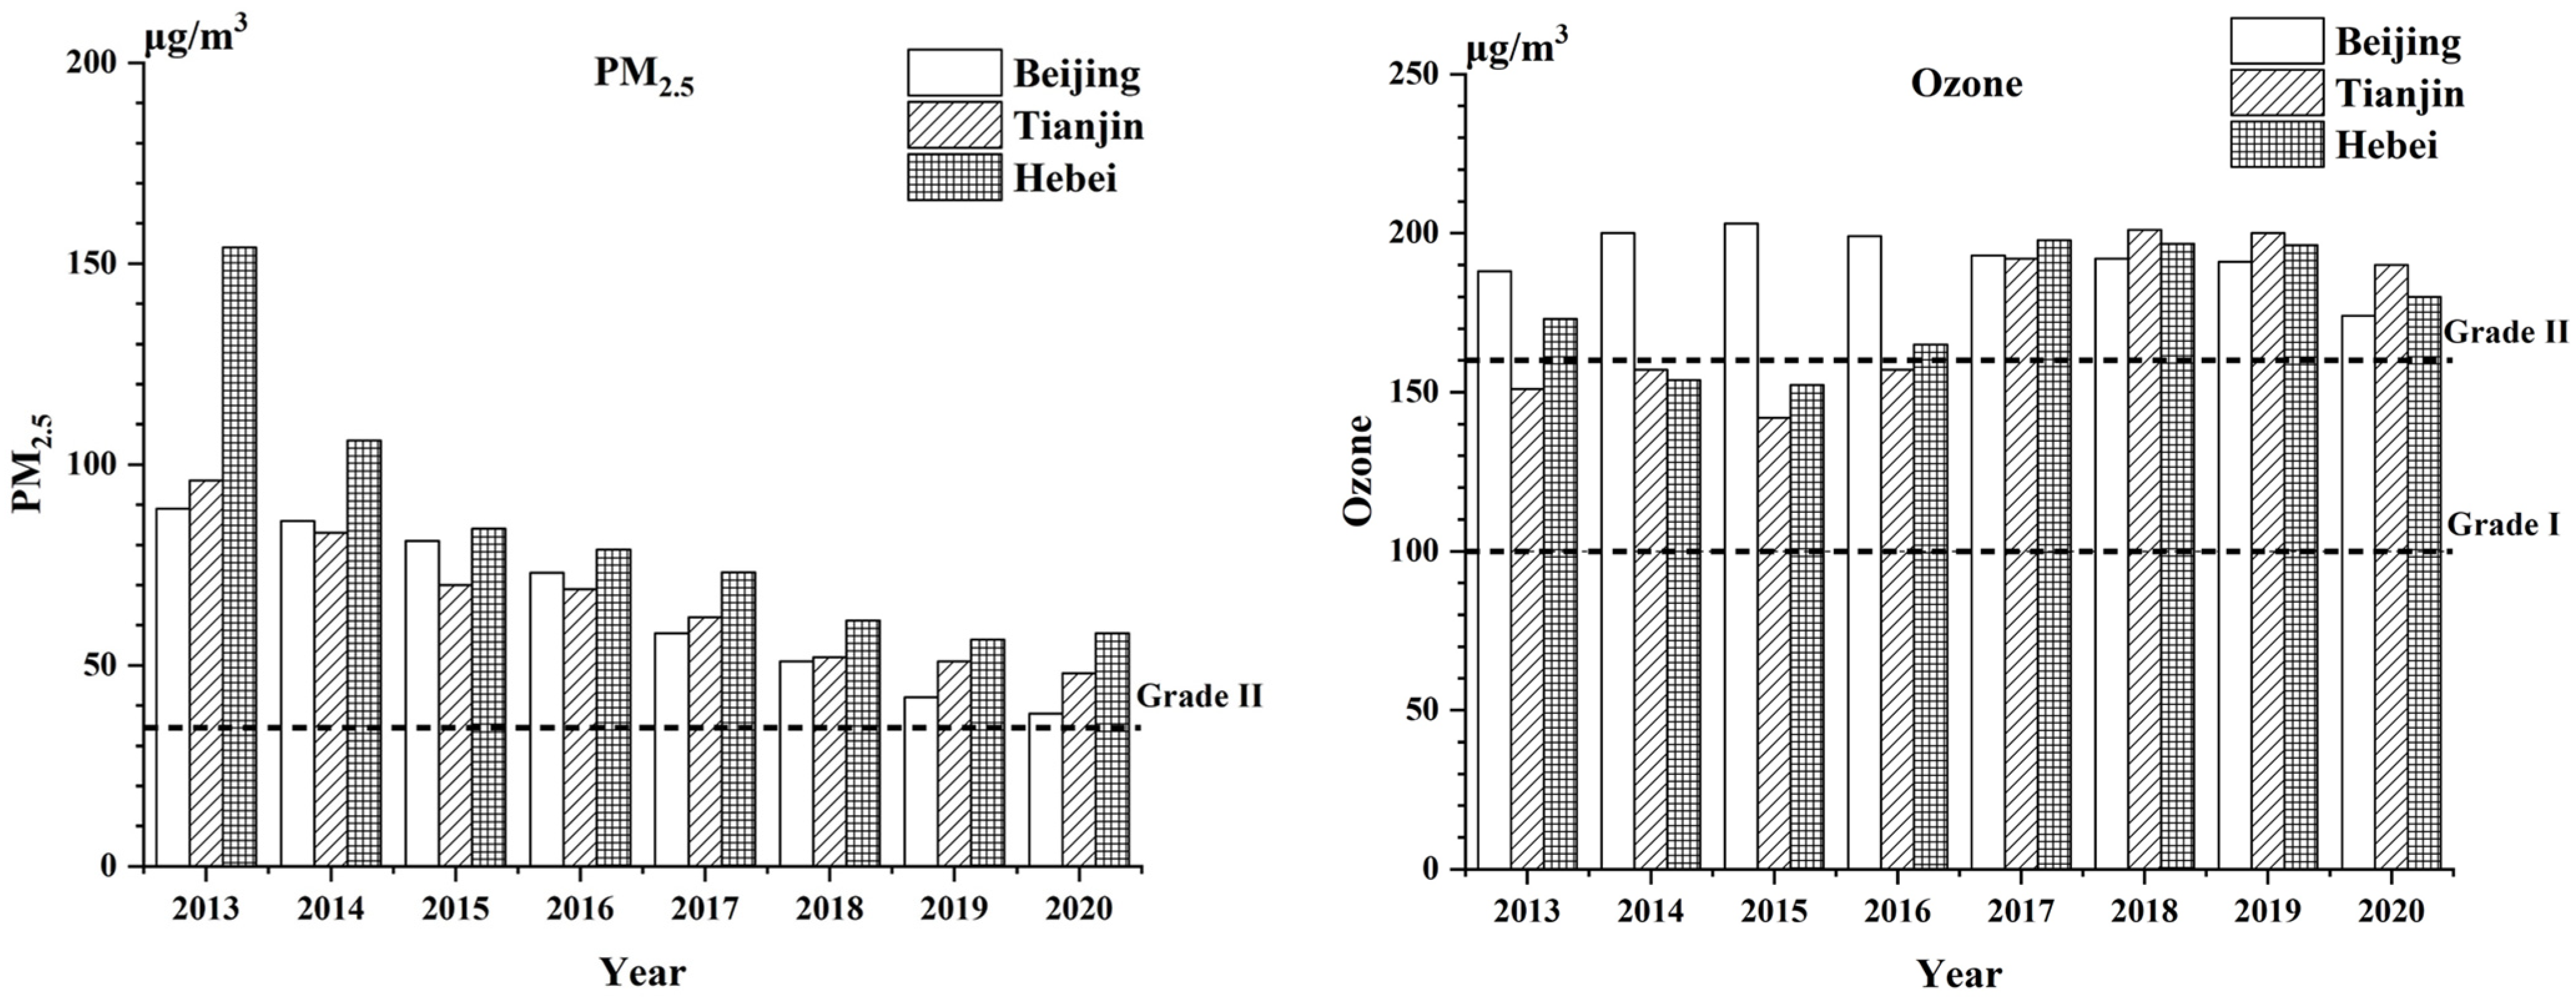
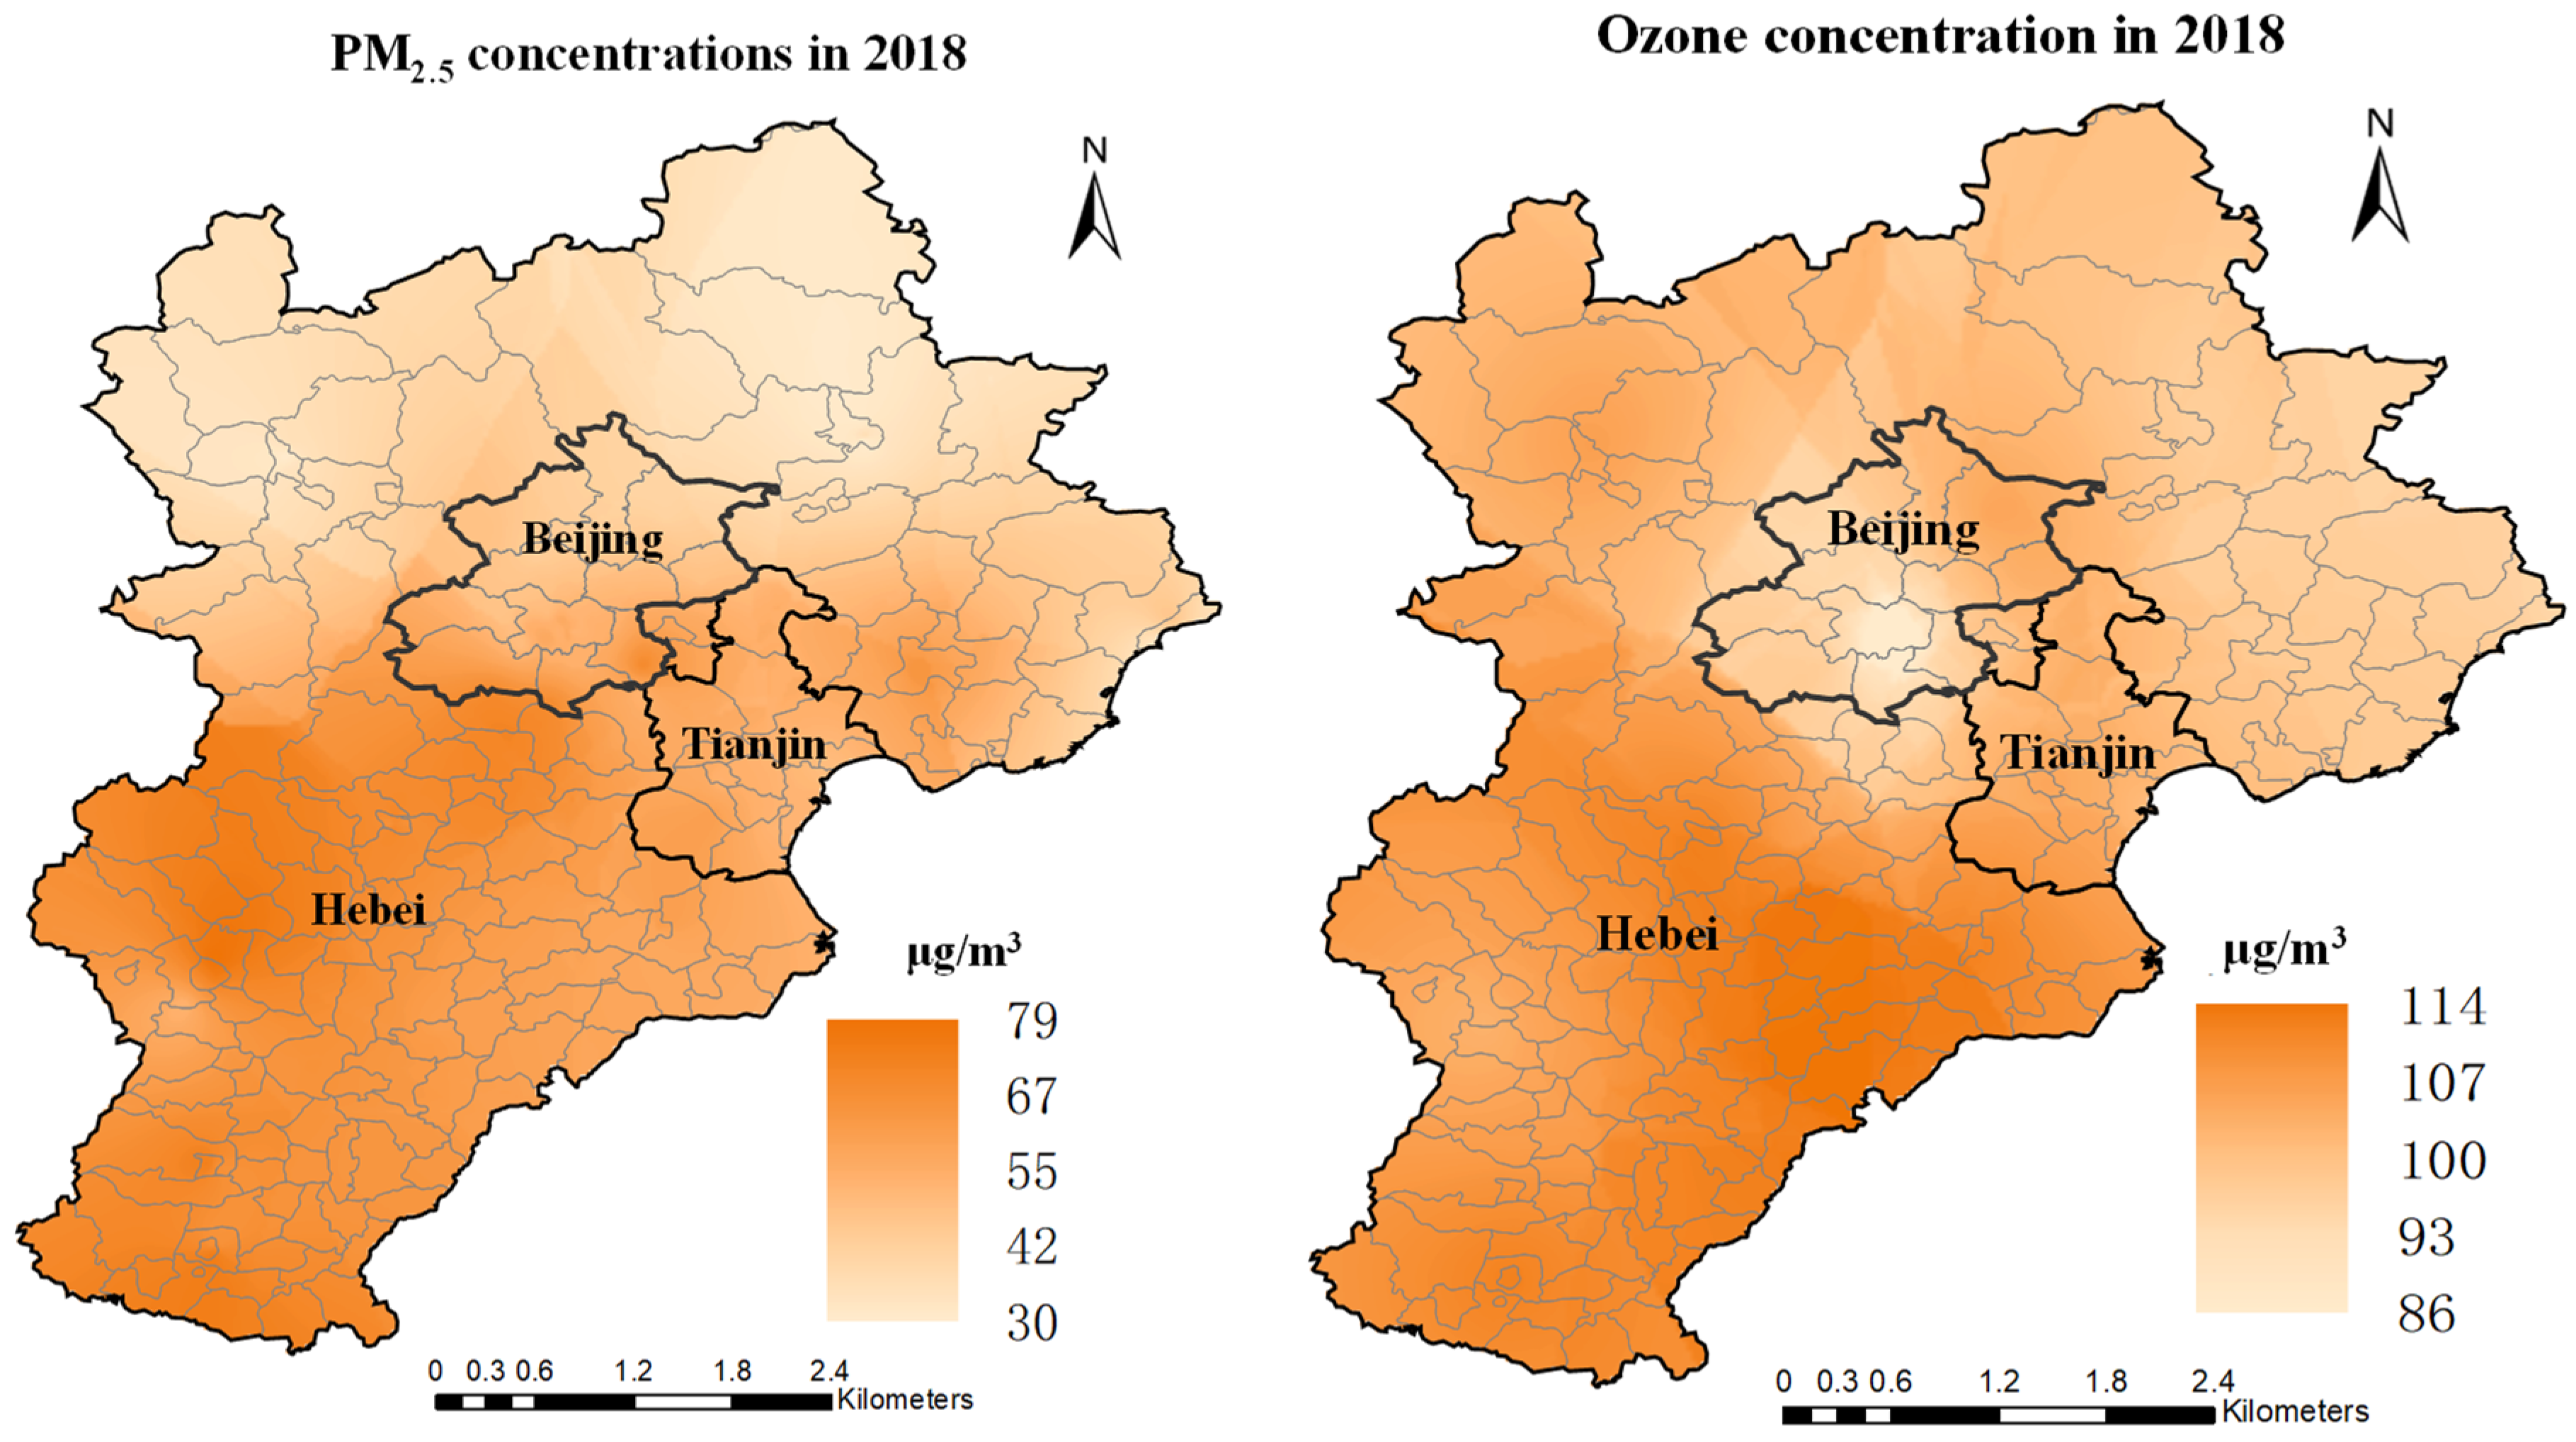
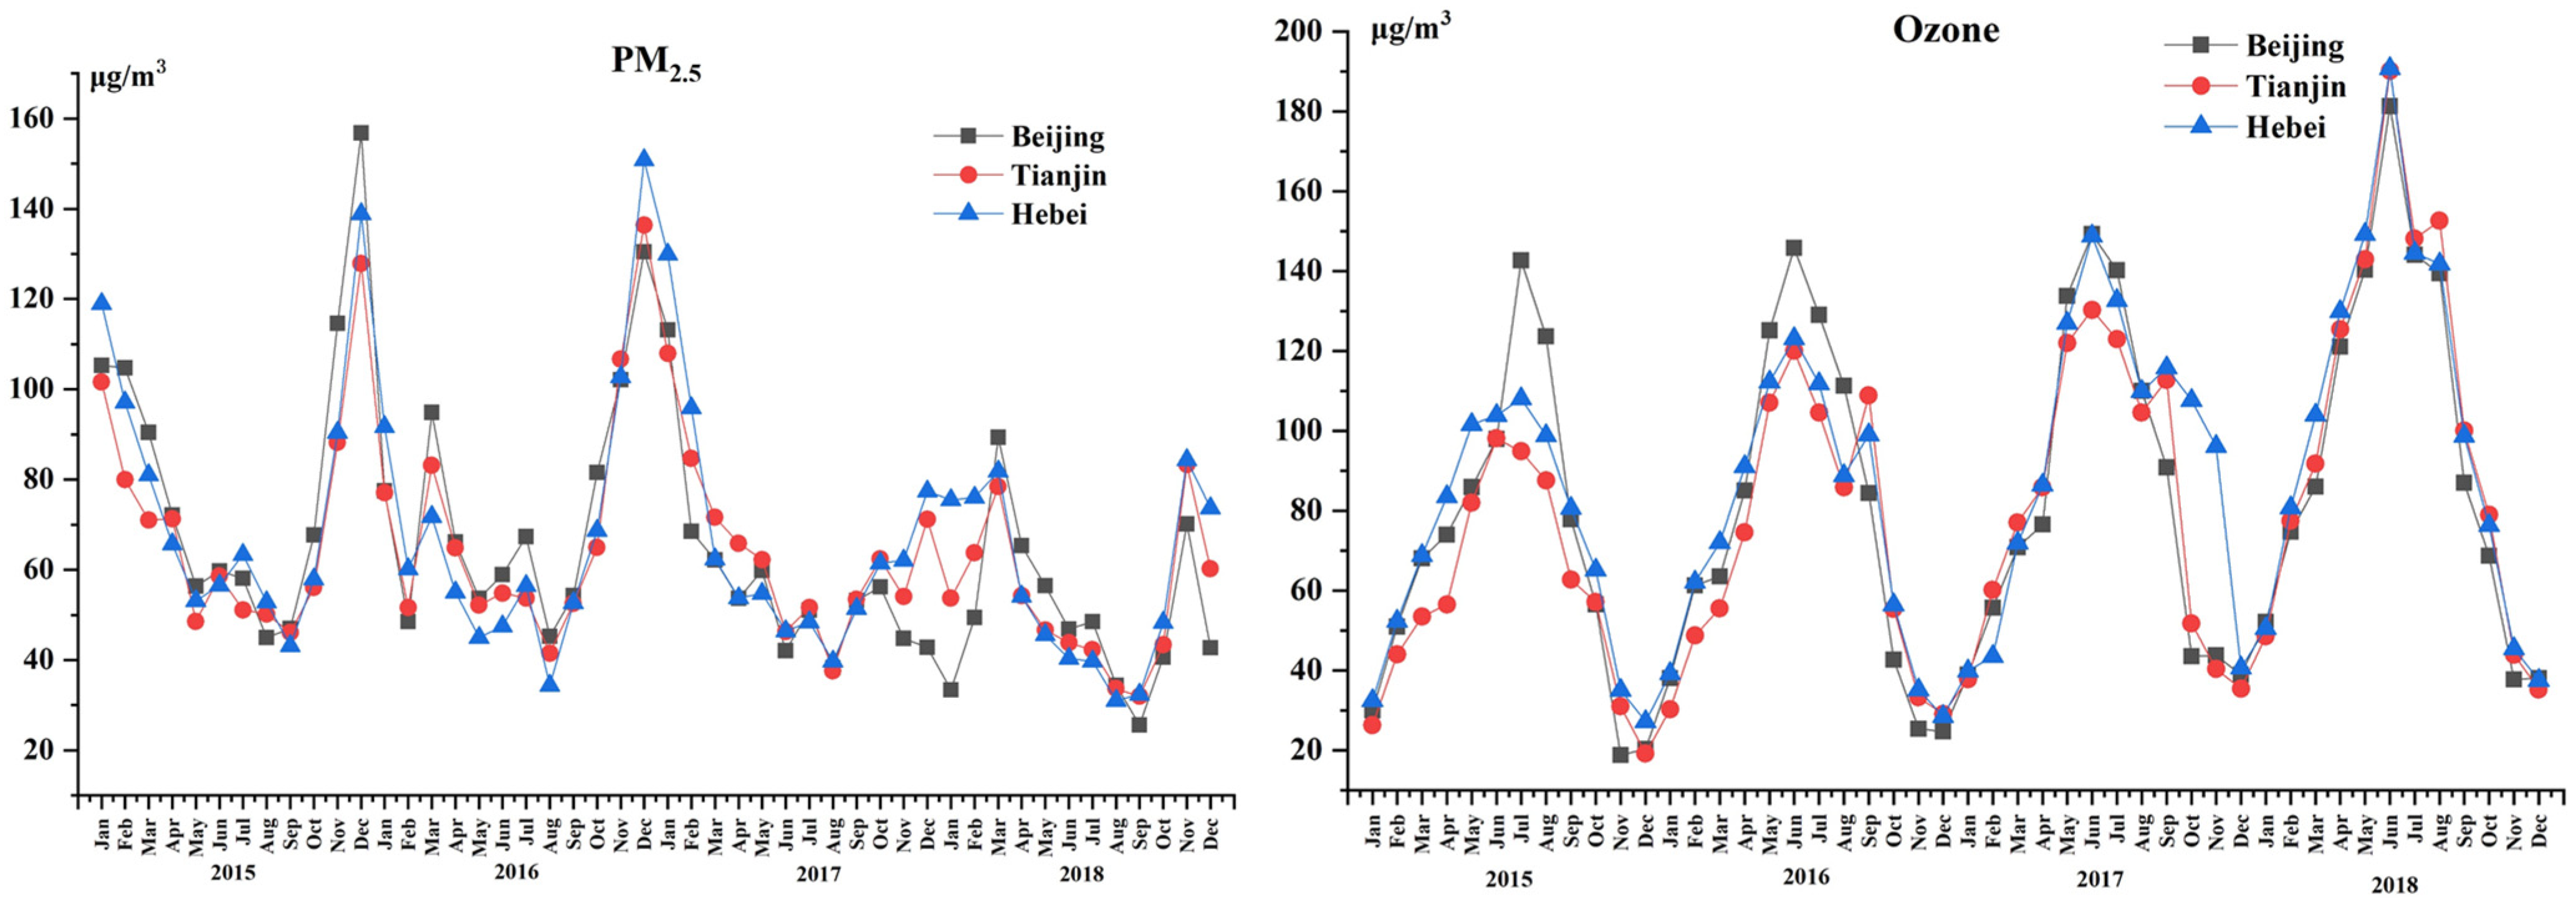
3.1. Spatial and Temporal Variation in PM2.5 and Ozone Concentrations

The temporal trends of PM2.5 and ozone in the BTH region were analyzed using the Mann–Kendall method. From 2013 to 2020, the PM2.5 concentration shows a significant declining trend in Beijing City (S = −8.0 μg/m3/yr, p < 0.005), Tianjin City (S = −6.6 μg/m3/yr, p < 0.005), and Hebei Province (S = −8.6 μg/m3/yr, p < 0.01) and almost achieved the National Standard Grade II in 2020. From 2013 to 2020, the concentration of PM2.5 dropped by 57% from 89 to 38 μg/m3. It has been reported that the concentration of PM2.5 in the whole of China decreased by 32% from 2013 to 2017 [26]. From 2013 to 2015, the ozone concentration increased in Beijing and then showed a slightly decreasing trend (S = −4.0 μg/m3/yr, p < 0.01). From 2013 to 2020, the ozone concentration decreased by 7% in Beijing City; on the contrary, the ozone concentration increased by 26% and 4% in Tianjin City and Hebei Province, respectively. The ozone concentration was higher than the standard grade II from 2017 onward in the BTH region (Figure 2).
The spatial distributions of PM2.5 and ozone in the BTH region in 2018 are shown in Figure 3. More serious PM2.5 pollution was observed in the southern areas of the BTH region. The distribution of PM2.5 concentration was consistent with that of a recent study [26]. Using the national monitoring data, this study presented the spatial distribution of PM2.5 concentration in China in 2015 (Figure 1), which shows the most severe PM2.5 pollution was observed in the Center-East region. In this region, the PM2.5 pollution was higher in Henan, Shanxi, Shandong, and Hebei Provinces than in Beijing–Tianjin City. Due to the industrial and energy structures, the emissions of different air pollutants vary very much among cities. Figure S2 shows the amount of PM2.5 emissions in the Center-East region in China [32]. Beijing and Tianjin are the largest metropolitan cities, where heavy industries are no more the major sectors of the economy. The PM2.5 emissions were lower in both cities than in other cities. Tangshan City of Hebei Province, the largest heavy industrial city in the region, has the country’s largest iron and steel production capacity and the largest PM2.5 emissions (208,463 t/yr), which were significantly higher than the emissions of other cities in the region [32]. Cangzhou City of Hebei Province also has high PM2.5 emissions of 85,407 t/yr [32]. The much larger emissions of major air pollutants in Hebei Province can result in higher PM2.5 concentrations observed in Hebei Province than in Beijing and Tianjin City.
A high concentration of ozone was also found in the southern area of Hebei Province and Tianjin City. In contrast, the ozone concentration in downtown Beijing was lower than that in the surrounding suburban areas, such as the western area of Hebei Province and Tianjin City. In the atmosphere, ozone can oxidize NO into NO2 (O3 + NO→O2 + NO2), and the low concentration of ozone in the urban area of Beijing City could result from significant NO emissions from vehicle exhaust.

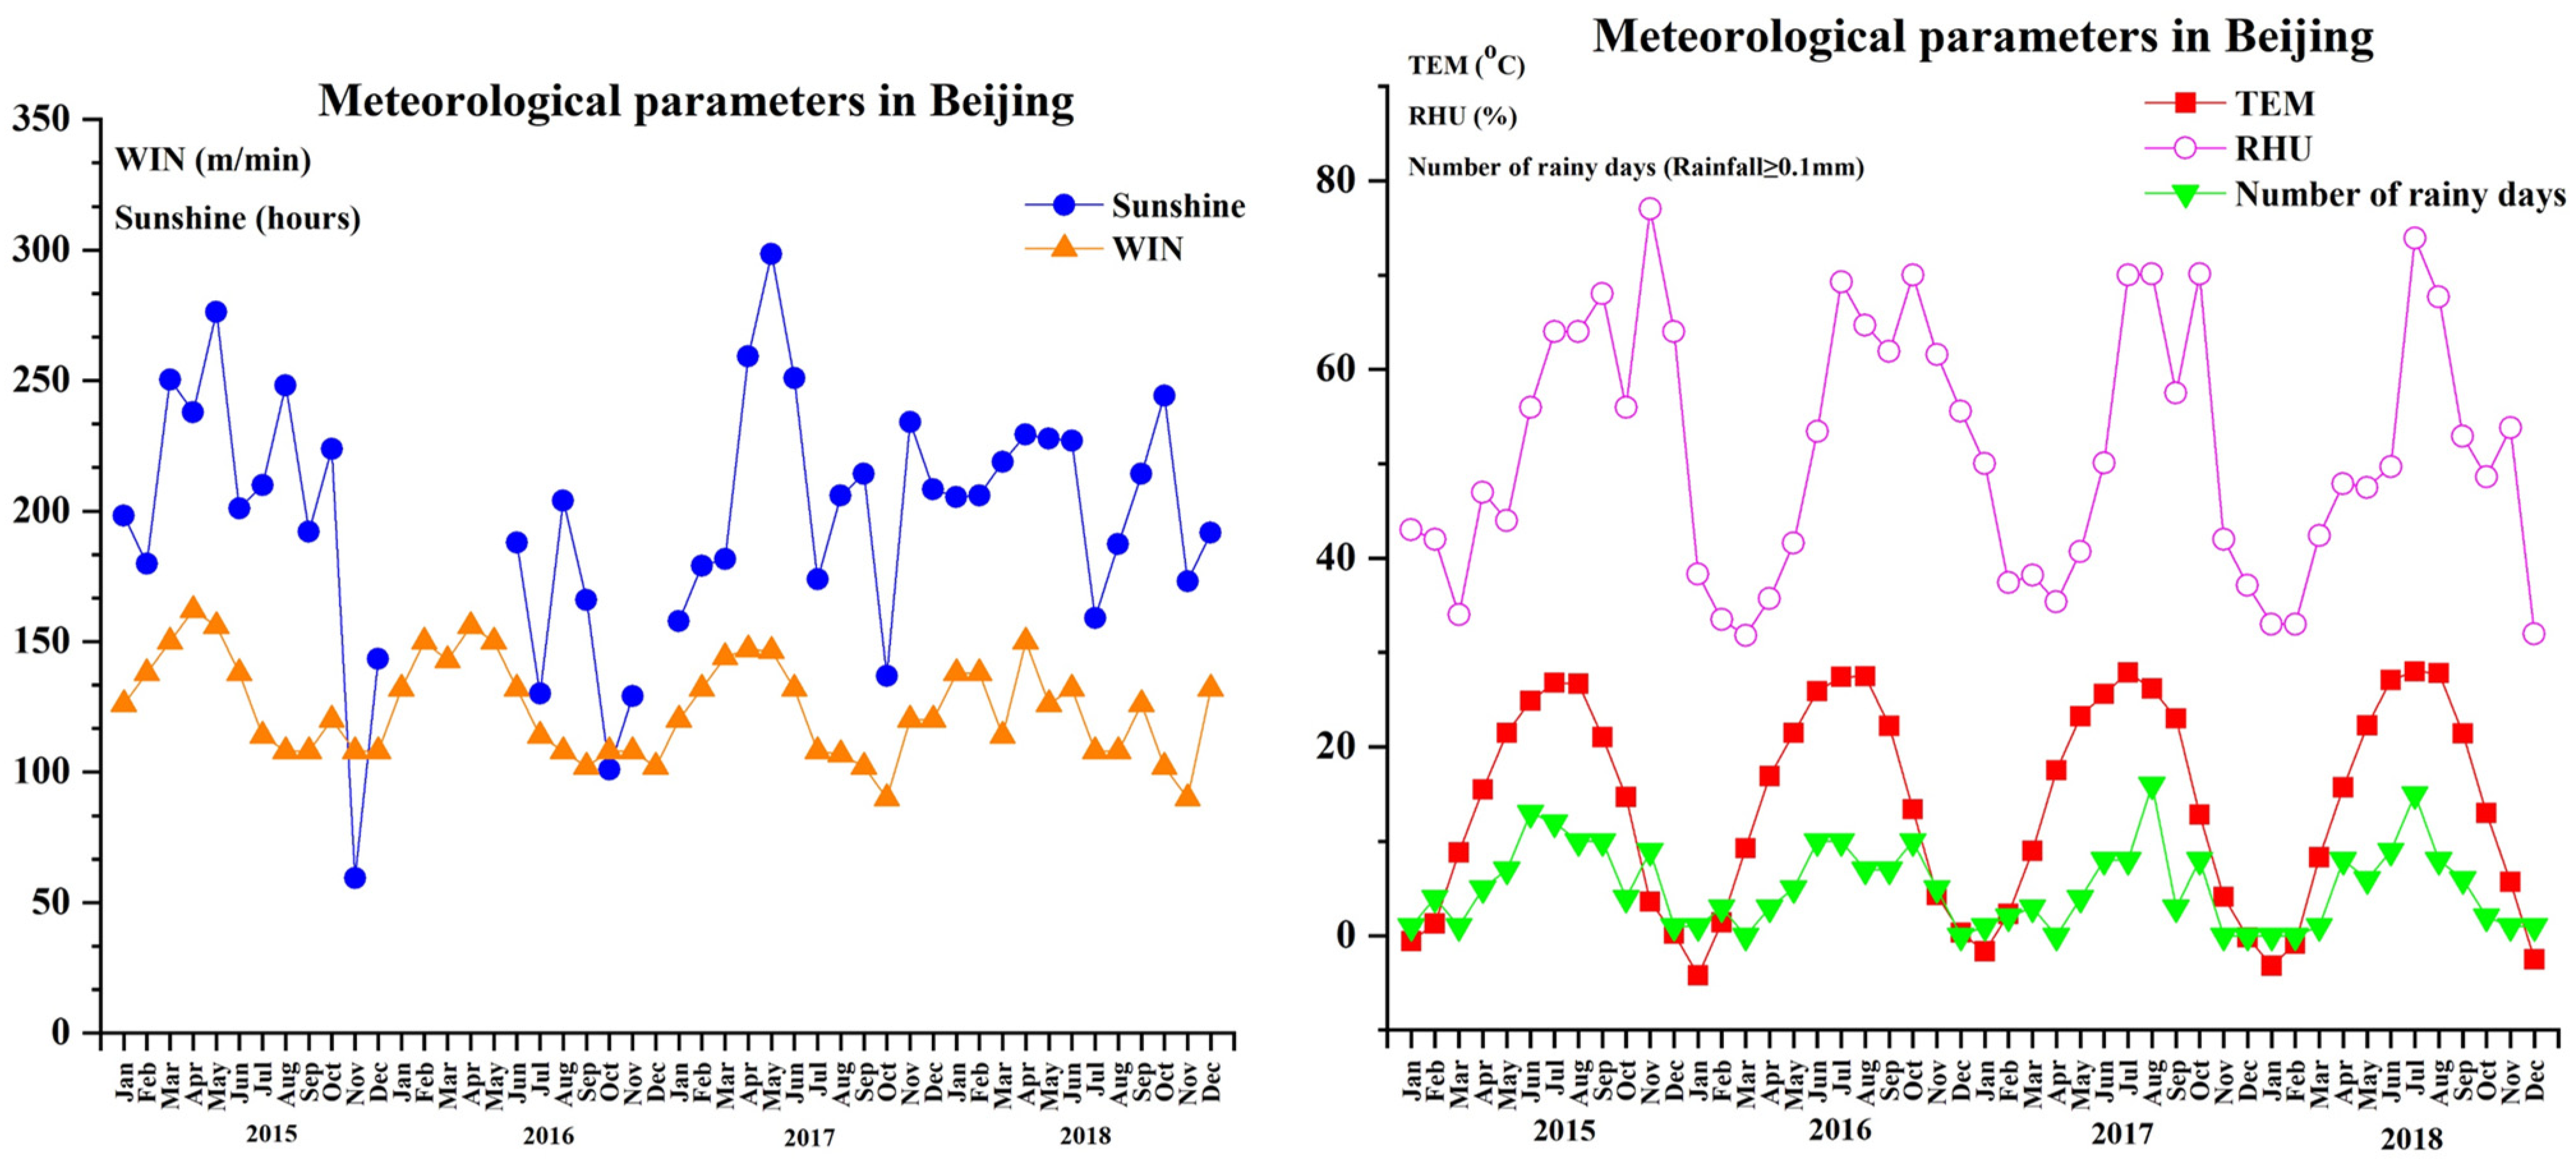
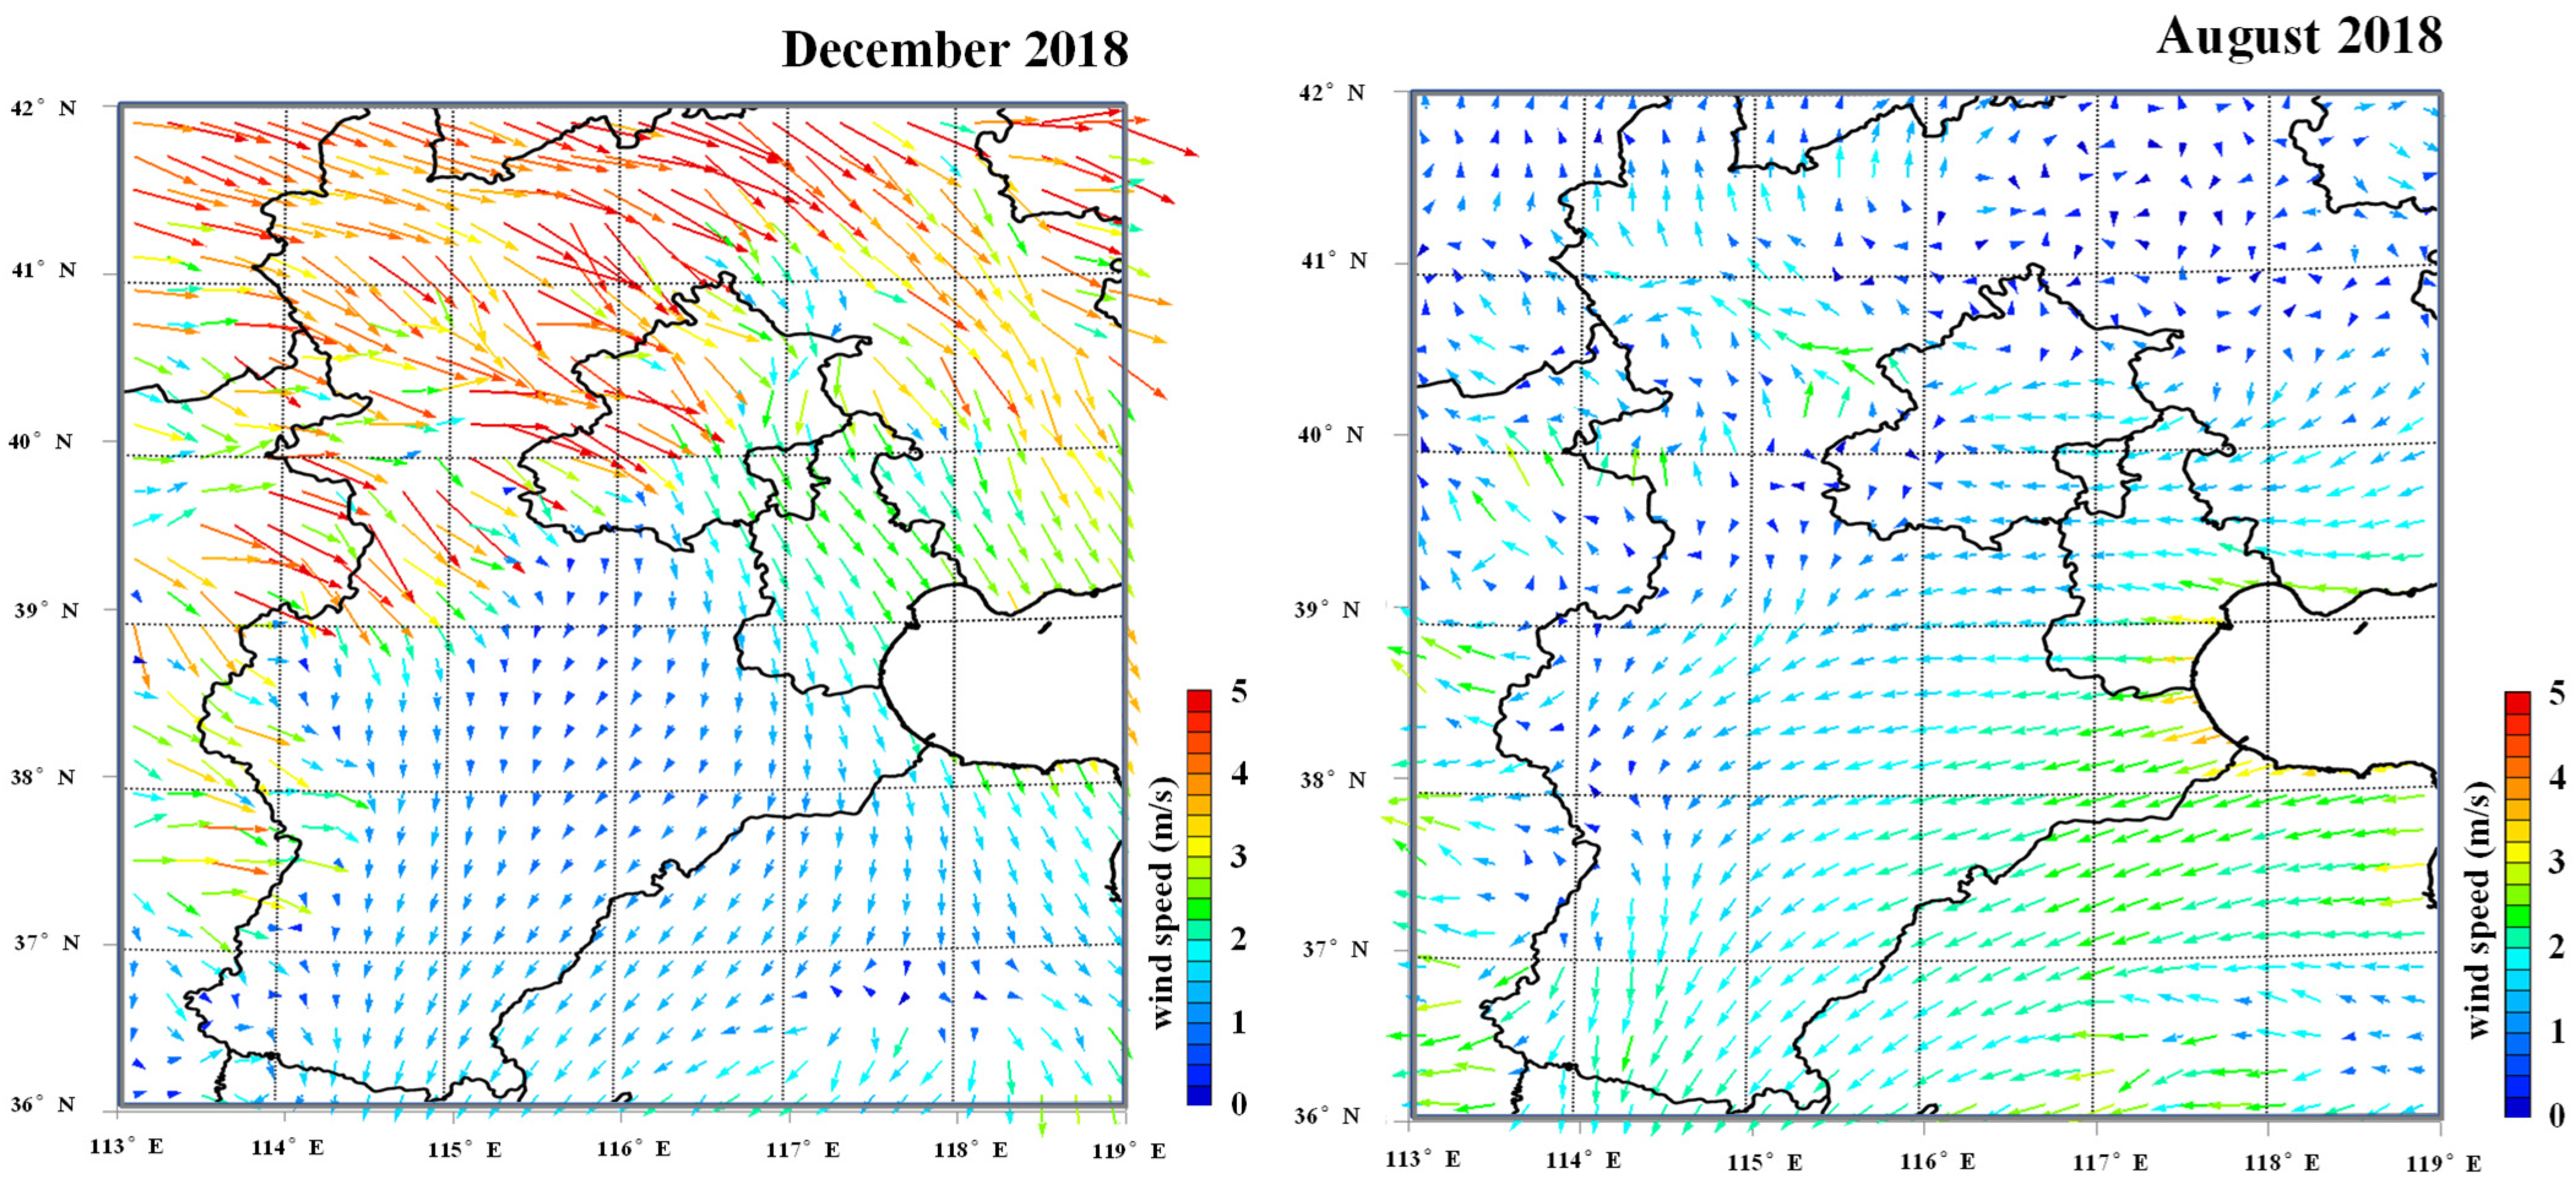
3.2. Relationship between Air Pollutants and Meteorological Parameters

The PM2.5 concentration was higher in winter and lower in summer in the BTH region (Figure 4). Overall, the PM2.5 concentrations showed inverse variation with temporal changes in wind speed, ambient temperature, sunshine hours, and precipitation. However, ozone seasonal variation showed higher concentrations during summer when the temperature, humidity, rainfall, and wind speed were higher than in winter, probably because of the more intensive photochemical reactions in summer than in other months.
As shown above, the highest concentrations of PM2.5 and ozone were observed in winter and summer, respectively; therefore, the effects of meteorological parameters on PM2.5 and ozone pollution in December (Table 1) and August (Table 2) are discussed in more detail as follows. The distributions of the wind direction and speed in December and August 2018 are shown in Figure 5. In December, the highest correlation was observed between the PM2.5 concentrations and relative humidity, with a correlation coefficient of 0.83 (p < 0.01), whereas it was negatively associated with wind speed and sunshine hours, with a correlation coefficient of −0.45 (p < 0.01) and −0.58 (p < 0.01), respectively (Table 2). This suggests that higher humidity may play an important role in PM2.5 formation (haze pollution) during winter in Beijing, and the wind has a significant dilution effect on PM2.5. The severe air pollution in the winter season was due to the high emission of PM2.5 from coal combustion for heating and unfavorable meteorological conditions. It is easy to cause accumulation of local primary pollutants and chemical formation of secondary pollutants in winter under unfavorable meteorological conditions such as small near-surface wind speed, higher relative humidity, near-surface inversion, and lower boundary layer height. It has been reported that the occurrence of the severe winter haze during 2012–2013 resulted from stable synoptic meteorological conditions over a large area of northeastern China [12]. In contrast, the ozone concentrations in December were positively associated with wind speed and sunshine hours, with correlation coefficients of 0.70 (p < 0.01) and 0.62 (p < 0.01), respectively, but negatively associated with relative humidity (correlation coefficient, −0.65 (p < 0.01)). The inverse correlation of PM2.5 and ozone with relative humidity, wind speed, and sunshine hours suggests different effects of atmospheric reaction and transportation on PM2.5 and ozone pollution. Atmospheric gaseous reactions, which account for the secondary formation of ozone, are positively affected by longer sunshine hours (higher air temperatures) and lower humidity. Contrarily, higher humidity plays a more important role in the liquid phase reaction for the formation of PM2.5 (haze pollution) in winter. Song et al. [33] reported that the heterogeneous production of hydroxymethanesulfonate (HMS) by SO2 and formaldehyde is favored under winter haze conditions in northern China owing to high aerosol water content. The wind had a clear dilution effect on PM2.5 but resulted in an increase in the ozone concentration in winter. In December, the predominant wind direction at high speeds in the BTH region was from north to south (Figure 5). This indicates that the wind in winter diluted the PM2.5 concentration in Beijing but transported the PM2.5 pollution to the southern area of Hebei Province, where the PM2.5 concentration was highest in the BTH region.
In August, the highest correlation was observed between ozone and ambient air temperature and sunshine hours with correlation coefficients of 0.52 (p < 0.01) and 0.47 (p < 0.01), respectively. This indicates an enhanced contribution of photochemical reactions to ozone formation in the summer. Overall, PM2.5 concentrations were weakly correlated with meteorological parameters in August. In this month, the wind speed was low, and the main wind direction was from east to west in the southern area of the BTH region (Figure 5). Wind did not cause ozone pollution from Beijing and Tianjin to the southern area of Hebei, and the high concentration of ozone in the southern area of BTH mainly resulted from local contributions.

3.3. Health Impact Attributable to PM2.5 and Ozone in the BTH Region

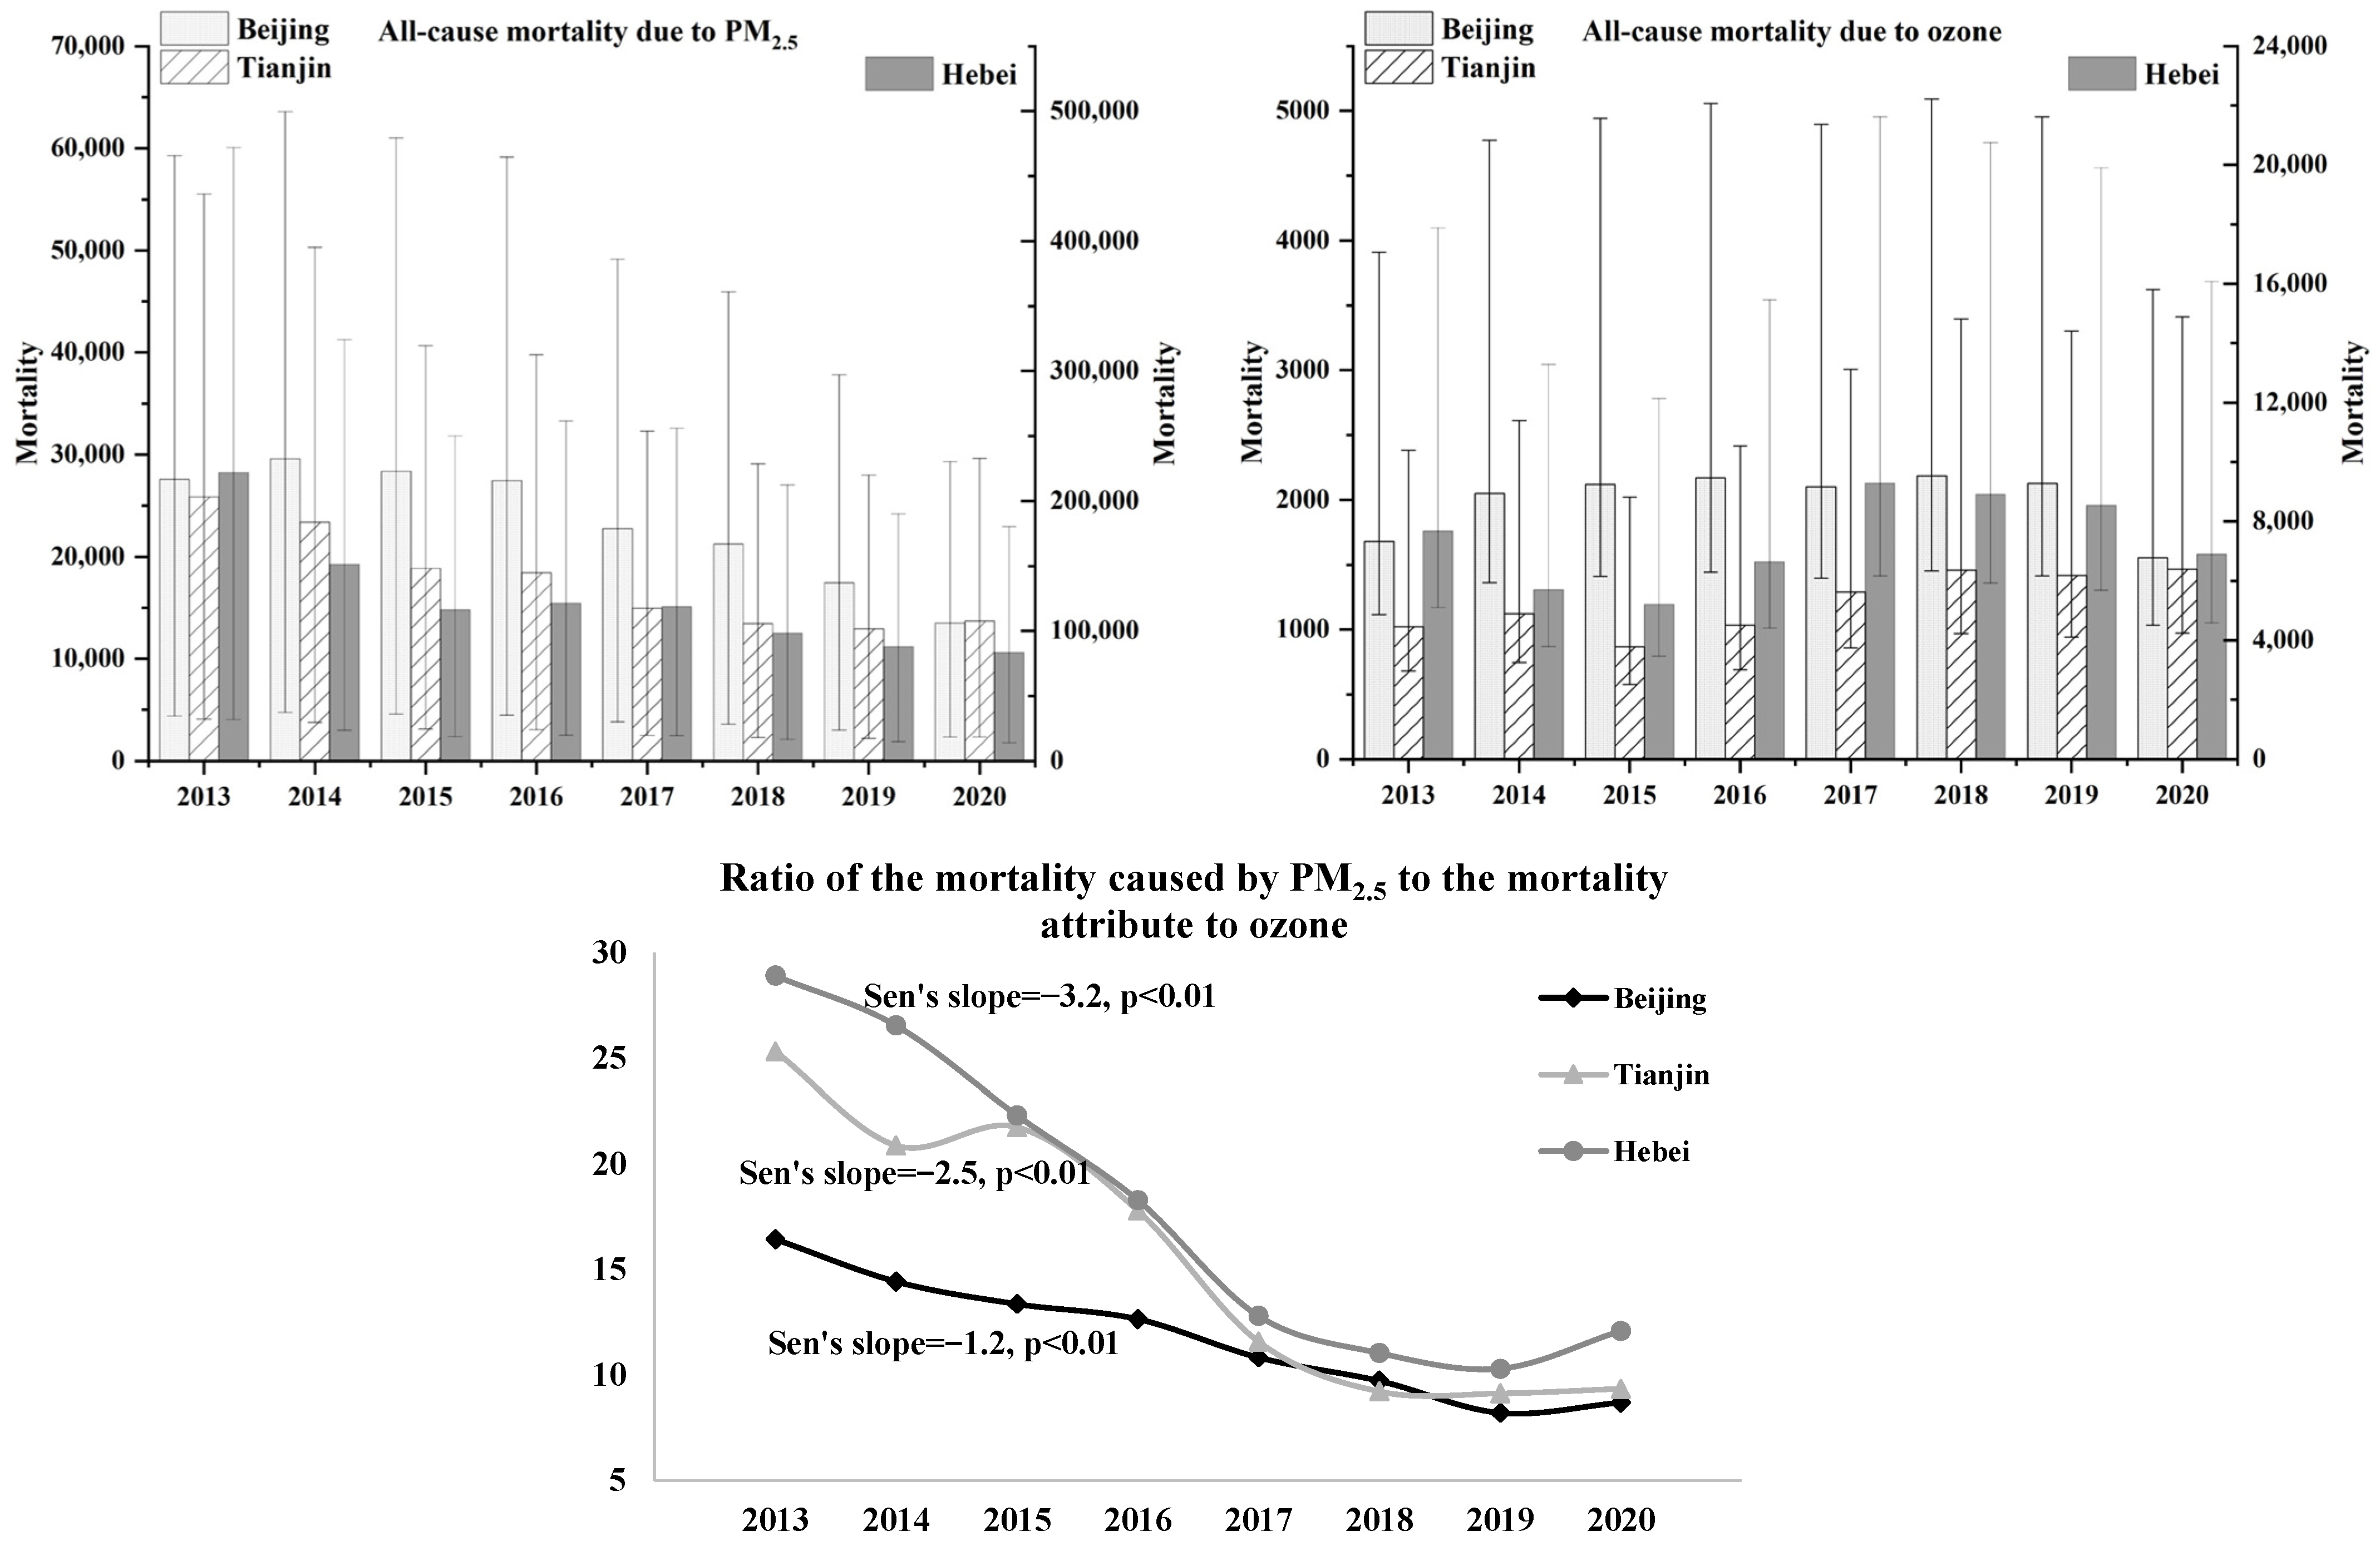
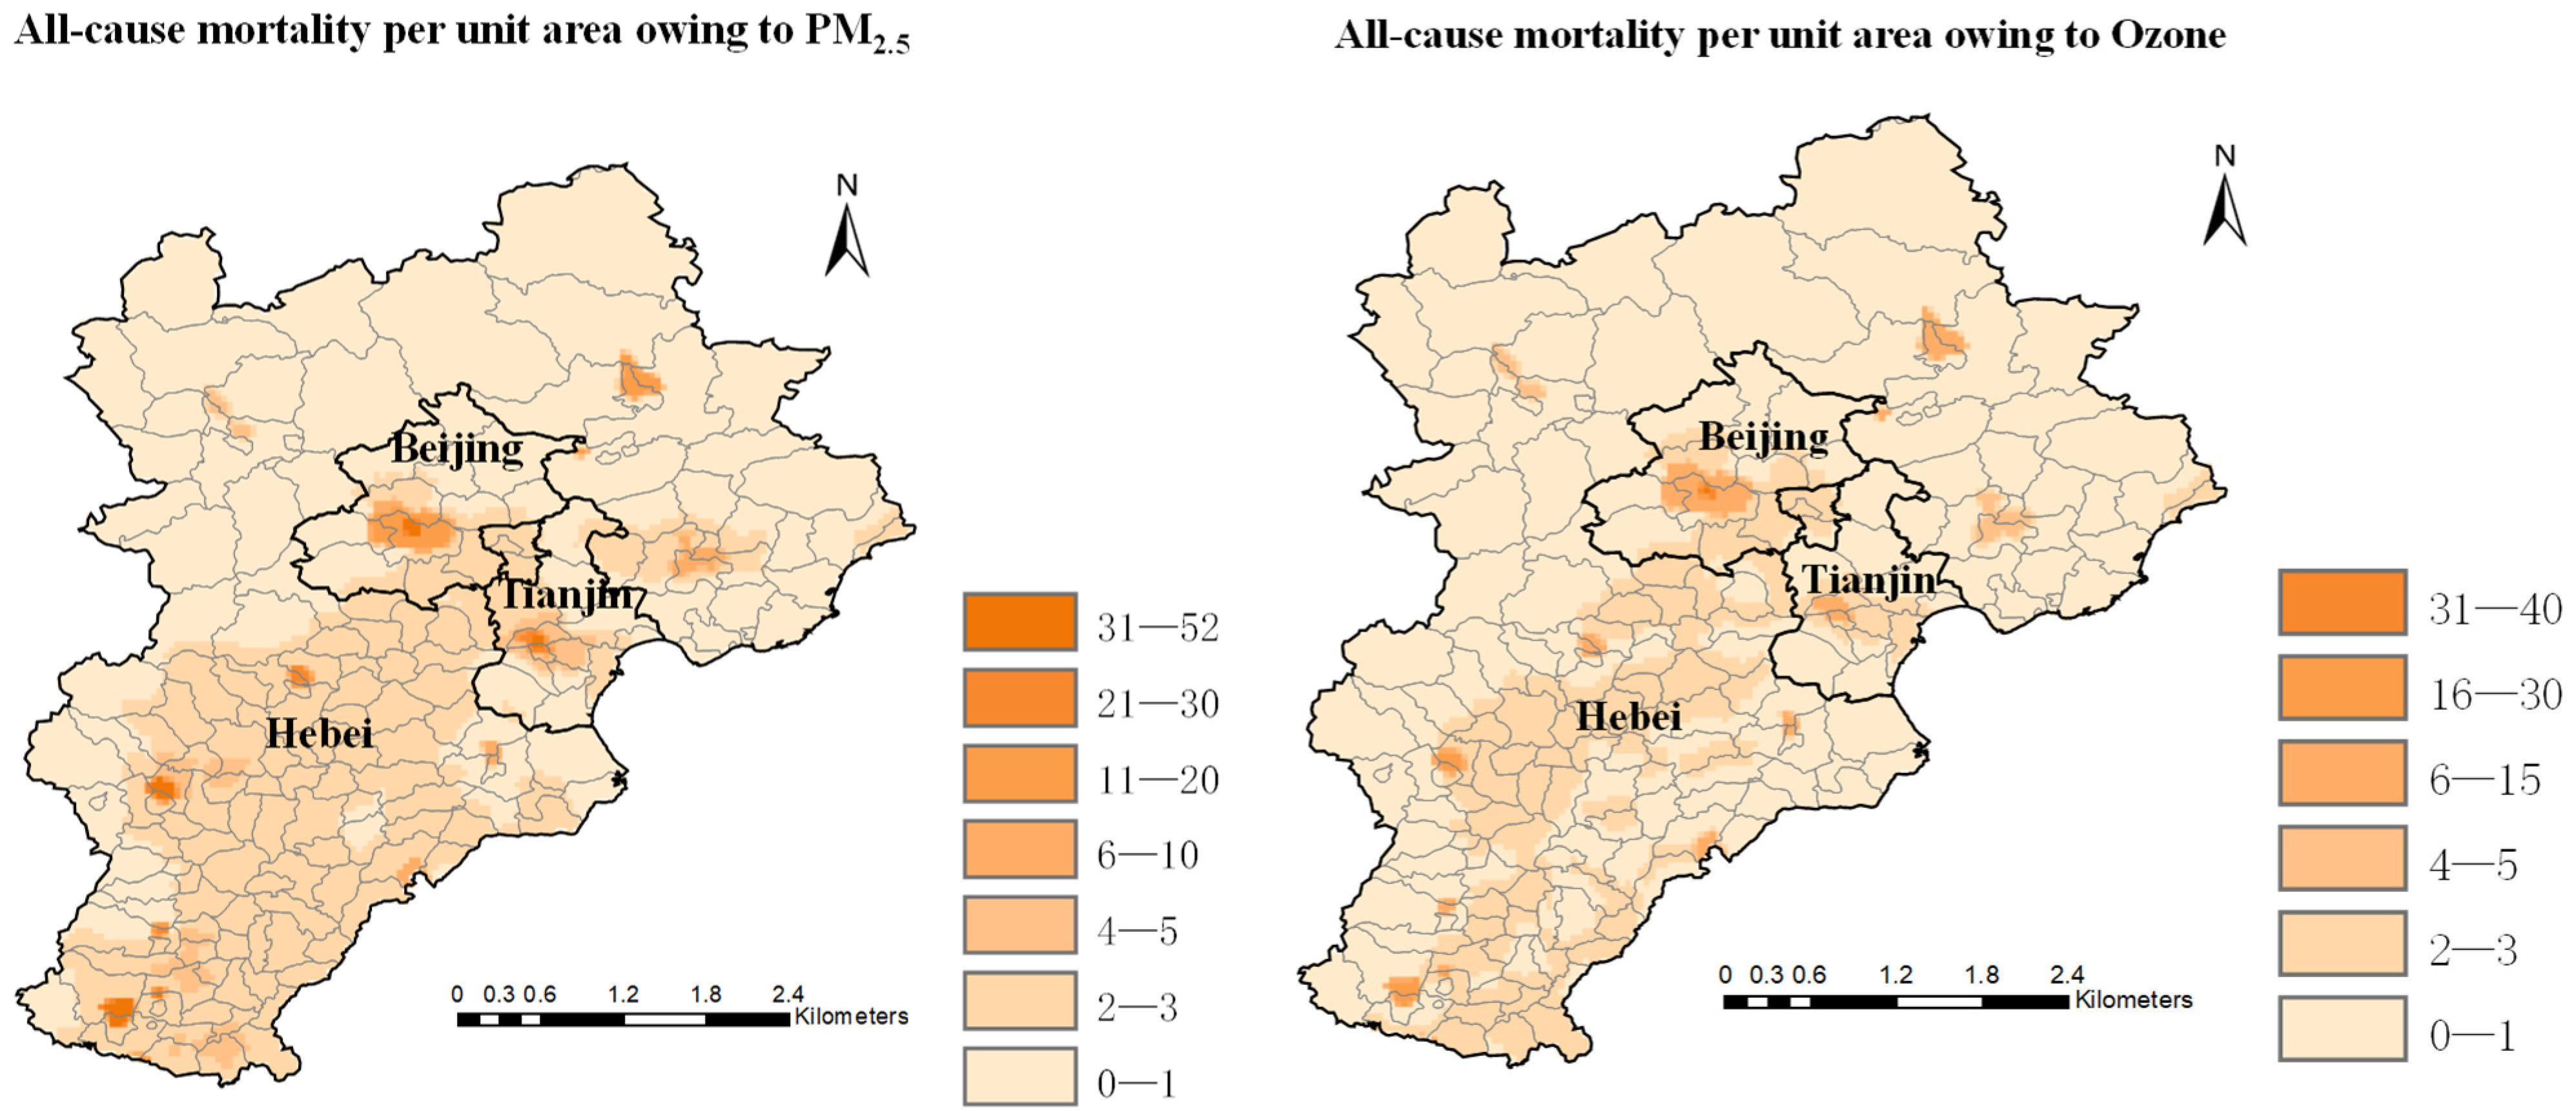
3.3.1. Heath Impact Attributable to the Concentration of PM2.5 and Ozone

The estimated number of all-cause deaths associated with exposure to PM2.5 and ozone and the corresponding confidence interval from 2013 to 2020 in the BTH region are shown in Figure 6. From 2013 to 2020, a significant declining trend of mortality due to PM2.5 was observed in Beijing City (Sen’s Slop = −2397, p < 0.01), Tianjin City (Sen’s Slop = −1895, p < 0.01), and Hebei Province (Sen’s Slop = −11,653, p < 0.01). In the BTH region, a significant increasing trend of mortality attributed to ozone was found in Tianjin City (Sen’s Slop = 67 p < 0.05). The trend of mortality attributable to ozone in Beijing City and Hebei Province was not clear.
We estimated that 110,613 [(95% CI): 91,913, 128,615] and 9921 (95% CI: 3325, 13,191) cases of all-cause mortality in 2020 were attributable to exposure to PM2.5 and ozone, respectively, in the whole BTH region. Although the health effect owing to PM2.5 exposure decreased significantly from 2013 to 2020, it was still more serious than that of ozone. As seen in other health impact assessments in China [34], the present study also shows that the effect of PM2.5 on human health was more than 10 times higher than the effect of ozone, and thus the control of PM2.5 pollution is still a priority over ozone in the BTH region. As discussed before, it is worth noting that the PM2.5 concentration in winter mainly accounted for the annual PM2.5 pollution, and thus the control of PM2.5 in Beijing during winter has a significant effect on mitigating the corresponding health risk. Our results show that the number of all-cause deaths from 2013 to 2020 owing to exposure to PM2.5 dropped by 51%, 47%, and 62% in Beijing, Tianjin, and Hebei Province, respectively. The all-cause mortality attributable to ozone exposure decreased by 7% and 10% from 2013 to 2020 in Beijing City and Hebei Province, respectively, but increased by 43% in Tianjin City (Figure 6). The increase in mortality owing to ozone in Tianjin city is probably due to the increase in ozone concentrations during the study period. The ratio of mortality caused by PM2.5 to the mortality attributable to ozone shows a significant declining trend in the BTH region (Figure 6). In 2013, this ratio observed in Tianjin City and Hebei Province was approximately 1.7 times higher than the ratio observed in Beijing. On the contrary, from 2017, the relative stranded deviation of this ratio in the BTH region became smaller to approximately 9%. This suggests that the relative contribution to health risks owing to ozone pollution becomes more significant and especially more attention is required in Tianjin City and Hebei Province. An appropriate co-control policy for PM2.5 and ozone pollution in the surrounding area of Beijing is necessary to protect public health. From the perspective of health impact, the policy of emission control has different effects on the mitigation of health risks owing to PM2.5 and ozone pollution, because the sources and atmospheric behavior of each are quite different.
The relative contribution of mortality owing to PM2.5 and ozone exposure was estimated based on the number of deaths in the BTH region as follows. On average, between 2013 and 2020, the fraction of all-cause mortality owing to PM2.5 exposure contributed to the number of deaths in Beijing City, Tianjin City, and Hebei Province was 21.7%, 22.2%, and 26.8%, respectively. The proportions of total mortality attributable to ozone pollution in Beijing City, Tianjin City, and Hebei Province were 1.8%, 1.5%, and 1.6%, respectively. From 2013 to 2020, the proportion of all-cause mortality owing to PM2.5 exposure decreased from 28.8% to 13.5% in Beijing City, from 30.6% to 16.7% in Tianjin City, and from 44.3% to 19.8% in Hebei Province. From 2013 to 2020, the proportion of all-cause mortality attributable to ozone exposure changed from 1.8% to 1.5%, 1.2% to 1.8%, and 1.5% to 1.6% in Beijing City, Tianjin City, and Hebei Province, respectively.
To compare with the health impact owing to PM2.5 in Beijing City, this study also estimated the mortality due to PM2.5 was 6612 (95% CI: 5423–7788) in Tokyo, Japan, in 2015 and 3649 (95% CI: 3000–4287) in Bangkok, Thailand, in 2016. The contribution of the all-cause mortality owing to PM2.5 to the total death number was 5.9% in Tokyo and 8.3% in Bangkok, and those ratios were approximately four to three times lower than the ratios observed in Beijing. The control of PM2.5 has important meaning for human health benefit in China.
The spatial distribution shows that the all-cause mortality owing to exposure to both PM2.5 and ozone was higher in the urban areas of Beijing City and Tianjin City and the southern area of Hebei Province (Figure 7). The all-cause mortality from PM2.5 and ozone in Tianjin City and Hebei Province showed similar spatial distributions compared with the pattern of PM2.5 and ozone concentrations. The high all-cause mortality in Tianjin City and Hebei Province was dependent on both the high population density and higher concentrations of PM2.5 and ozone. Although lower concentrations of both PM2.5 and ozone were observed in the downtown area of Beijing City (Figure 3), higher all-cause mortality owing to both PM2.5 and ozone was found in the downtown area of Beijing (Figure 7), where the population density was also high. The spatial distribution of all-cause mortality caused by exposure to both PM2.5 and ozone in Beijing City was more influenced by the distribution of population density. Because the predominant wind direction during winter was from north to south, the control of PM2.5 pollution in Beijing City during winter has an important effect on the mitigation of pollution and corresponding health risks in Hebei Province.

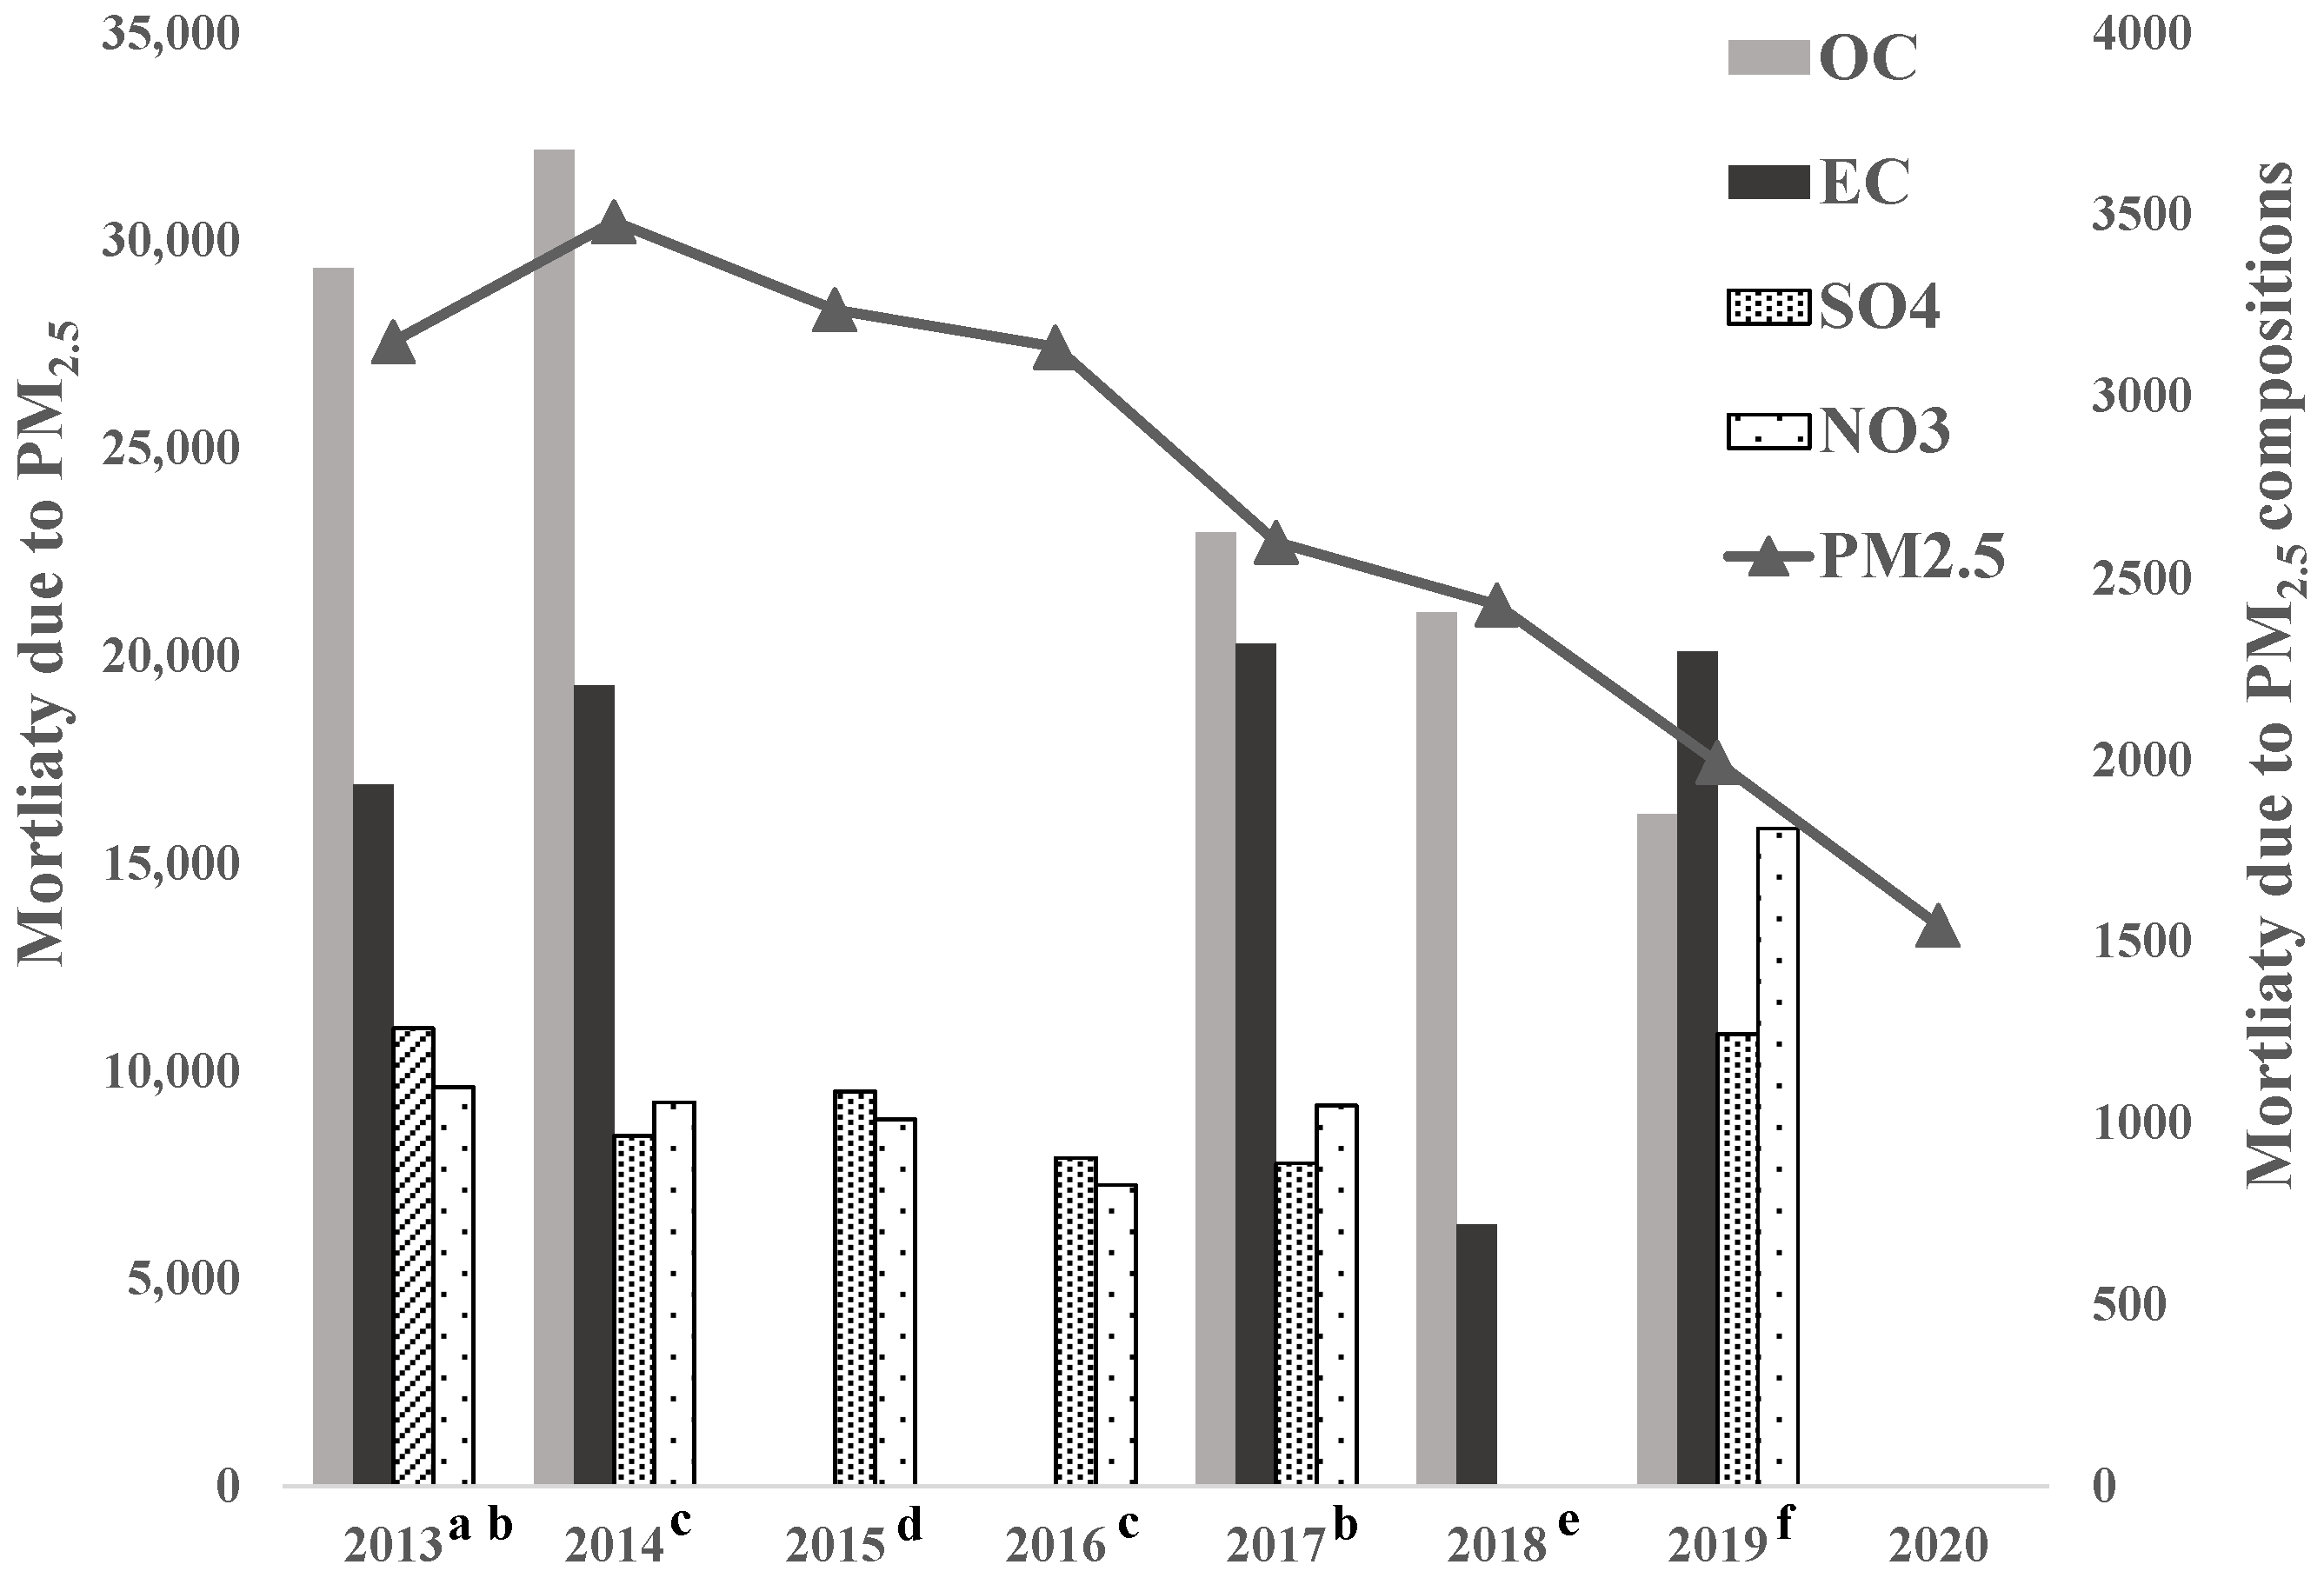
3.3.2. Health Effect Attributable to Main Compositions in PM2.5

The mortality attributable to PM2.5 compositions is shown in Figure 8. Although the mortality due to PM2.5 in Beijing decreased significantly from 2013 to 2020, the mortality due to compositions in PM2.5 showed a different change. The mortality due to OC in PM2.5 decreased from 2014, and the trend of mortality attributable to OC was comparable to that of PM2.5. On the contrary, the mortality due to EC in PM2.5 did not show a clear trend. The mortality due to SO42− and NO3 in PM2.5 increased from 2016.
In estimating organic matter (OM), an OC to OM conversion factor of 1.6 was adopted for the aerosols [35]. On average, from 2016 to 2019, the fractional contribution of main components to PM2.5 mass gave the order of OCM (28%, OCM = OC × 1.6), NO3 (30%), SO42− (21%), and EC (5%). On the contrary, the ratio of mortality due to PM2.5 compositions to the mortality owing to PM2.5 showed the ranking of OC (10.4%), EC (8.7%), NO3 (6.0%), and SO42− (4.8%). The mortality due to EC (1780, 95% CI: 680–2868) was 76% of that of OC (2294, 95% CI: 803–3766) and 1.4–1.8 times higher than that due to NO3 (1230, 95% CI: 148–2583) and SO42− (1012, 95% CI: 517–1502). Although the fractional contribution of EC to mass was the smallest, the contribution of EC to the mortality was second highest. The human health effect attributable to EC in PM2.5 is much more sensitive than OC, SO42−, and NO3 in PM2.5; therefore, the regulations on the reduction of EC emission have the most significant effect on mitigating the health risk.
For comparison, this study estimated that the number of mortality cases due to OC, EC, SO42−, and NO3 was 556 (95% CI: 193–916), 796 (95% CI: 303–1287), 281 (95% CI: 143–418), and 152 (95% CI: 18–323), respectively, in Tokyo in 2015. The mortality due to EC was 1.4 times higher than that due to OC and three to five times higher than that of SO42− and NO3 in Tokyo. This study estimated that the mortality due to EC (870, 95% CI: 332–1400) in Bangkok was nearly two times higher than that of OC (465, 95% CI: 162–765), followed by SO42− (67, 95% CI: 34–100) and NO3 (11, 95% CI: 1–22). These results indicate that the particulate EC has a more important health effect than OC, SO42−, and NO3 in Tokyo and Bangkok, and on the contrary, OC has the highest contribution to mortality in Beijing. The ratio of mortality due to OC to the total mortality showed the ranking of Beijing (2.3%), Bangkok (1.1%), and Tokyo (0.5%). The ratio of EC gave the order of Beijing (2.0%), Bangkok (2.0%), and Tokyo (0.7%). The ratio of SO42− followed the ranking of Beijing (0.8%), Tokyo (0.3%), and Bangkok (0.2%). The ratio of NO3 followed the rank of Beijing (0.9%), Tokyo (0.1%), and Bangkok (0.02%). The relative contribution of mortality due to the main particulate constituents to the total death number in Beijing was higher than in the other metropolitan regions in East Asia (Figure S4).
In this study, the all-cause mortality attributable to the sum of major compositions in PM2.5 was smaller than the mortality attributable to PM2.5 mass. One possible reason is that there might be other compositions whose health impact was not included such as PAHs which are typical carcinogenic substances. Another possible reason might be the underestimate of relative risk values of particulate components which may also result in the smaller values of mortality attributable to compositions in PM2.5. This should be investigated in future studies.

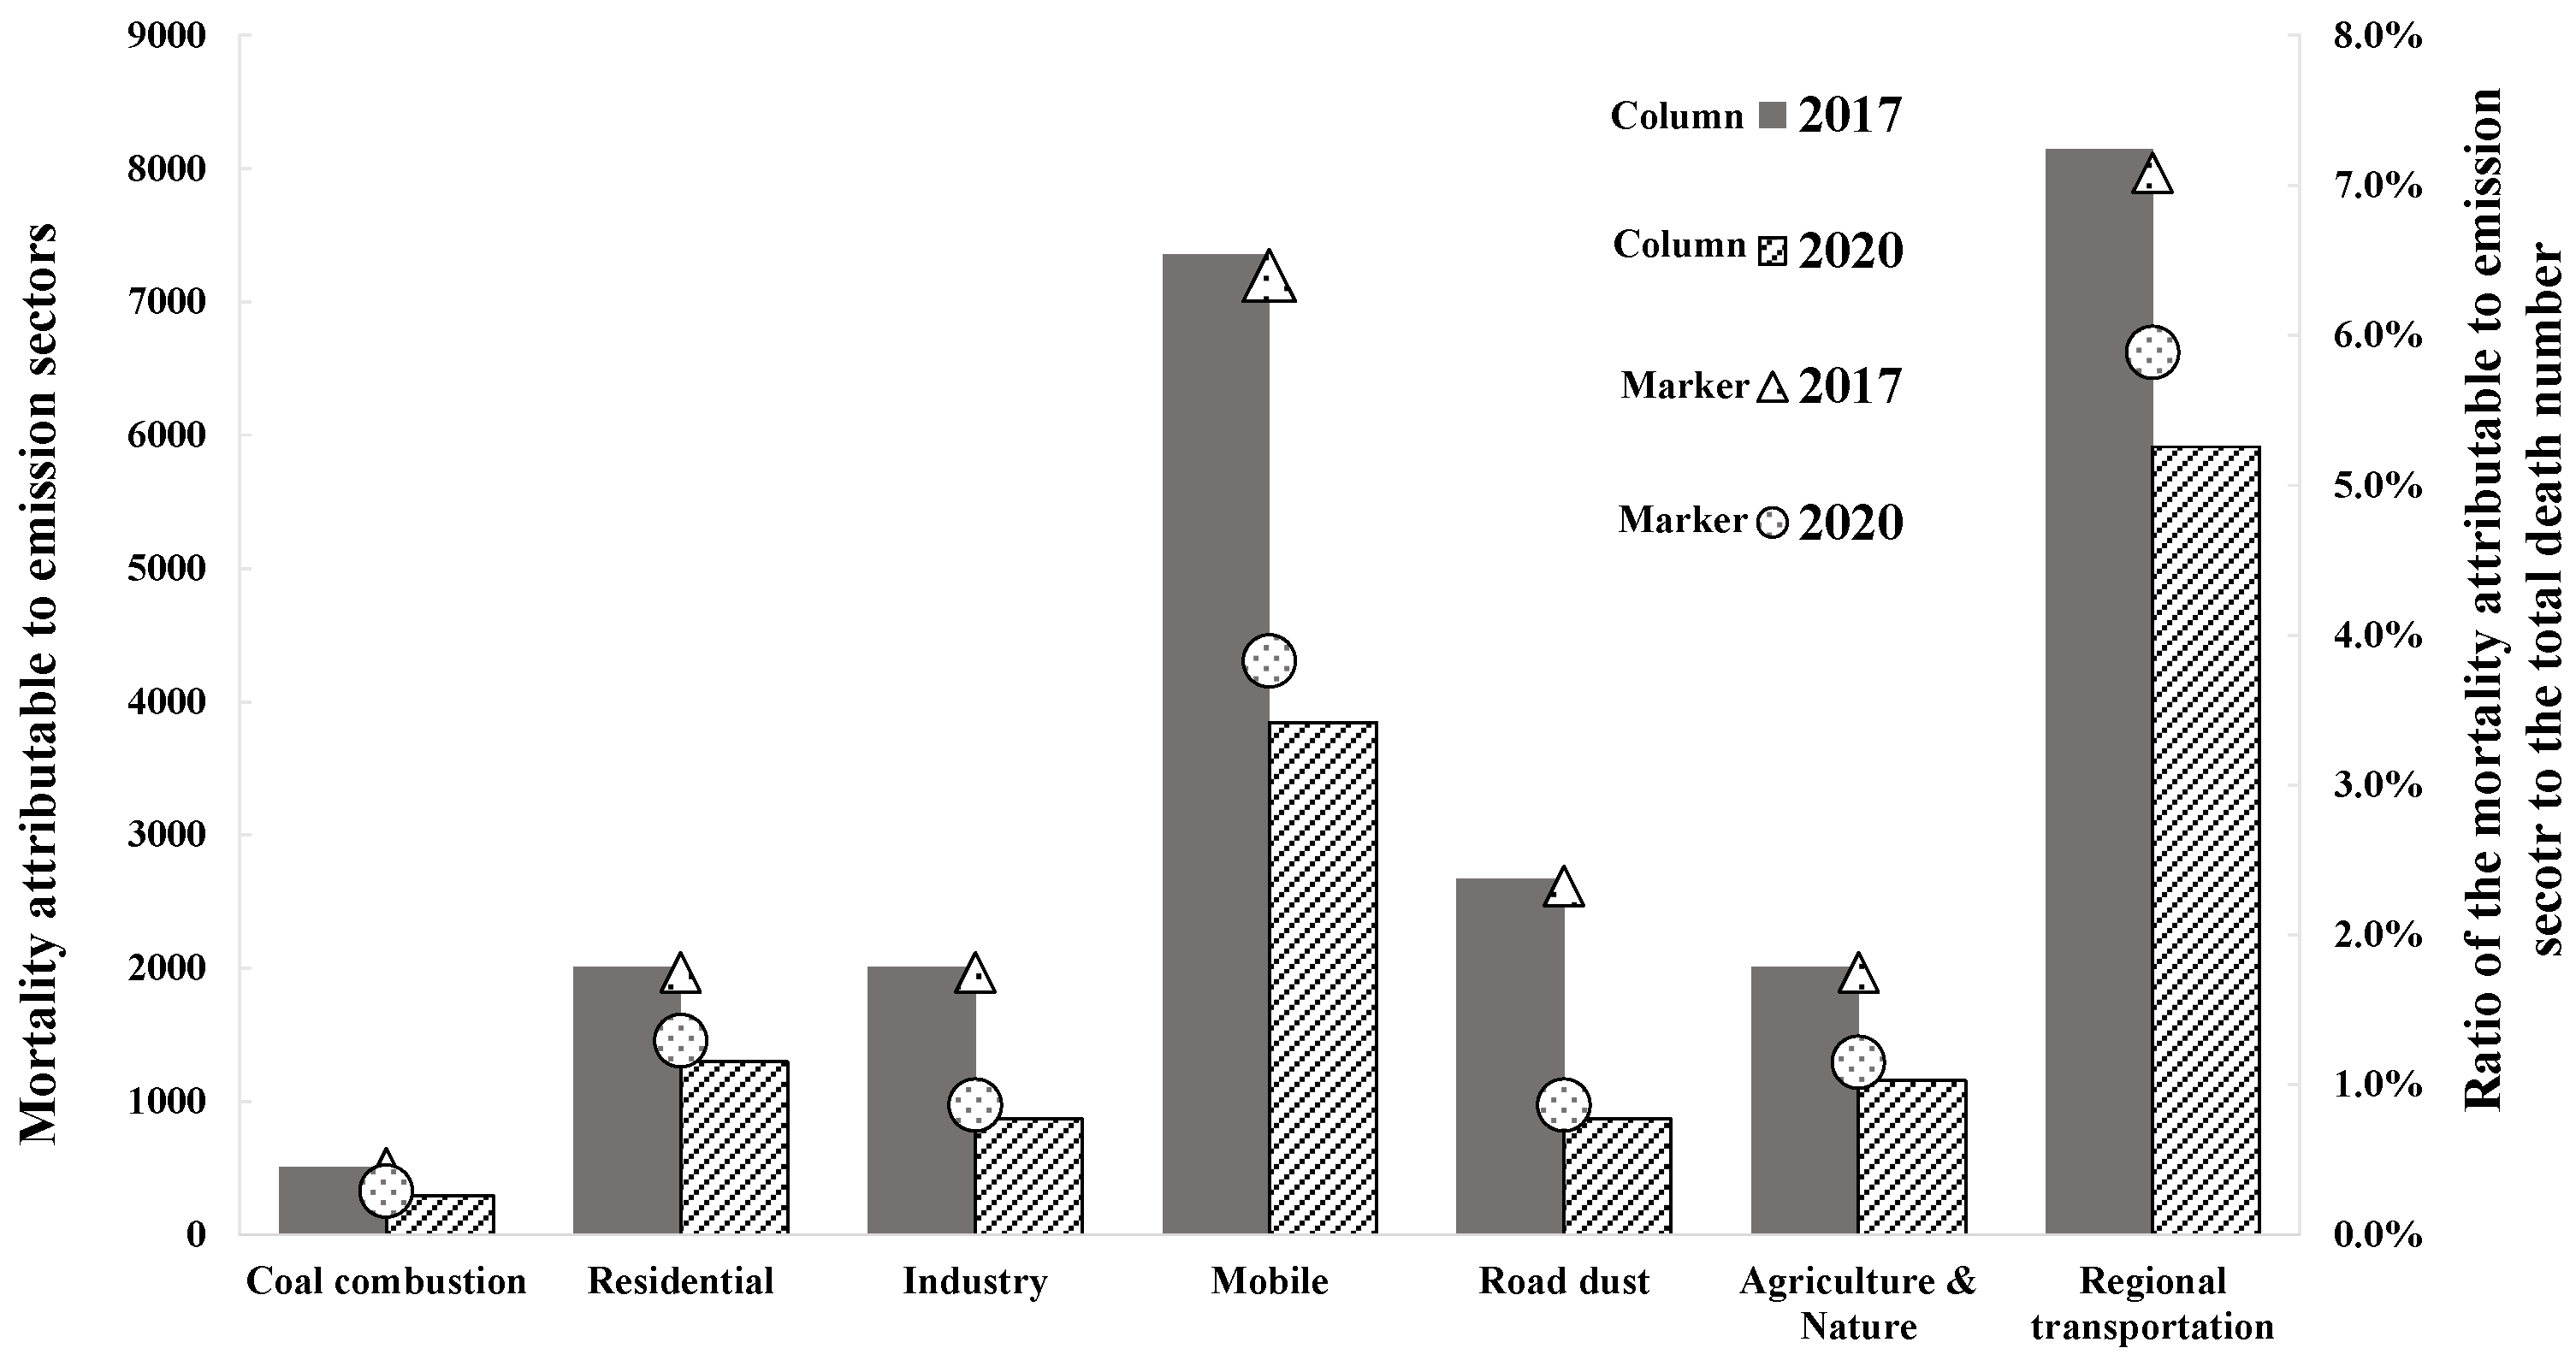
3.3.3. Health Effect Owing to Emission Sectors of PM2.5 in Beijing

There are many complex sources of particulate air pollution including human activities (transportation, biomass open burning, fossil fuel combustion, industrial activity and residential combustion, etc.) and natural sources (forest fire, sea salt, etc.). Figure 9 shows the comparison of the mortality owing to PM2.5 (left axis, column) and the ratio of the mortality owing to each source sector of PM2.5 to the total death number (right y-axis, symbol) in 2017 and 2020. The mortality attributable to PM2.5 from each sector clearly decreased, especially from the combustion source. All of the ratios from each sector decreased significantly from 2017 to 2020.
The most important source sectors that contributed to the mortality owing to PM2.5 were regional transportation, vehicles, and dust-related, so the control of regional PM2.5 has important meaning for human health in Beijing. Regarding the average of results in 2017 and 2020, around 6.5% of total mortality in Beijing was from regional transportation (7029, 95% CI: 5770–8272). If the vehicles and dust-related sectors are removed, the number of averted average all-cause deaths is estimated as 5599 (95% CI: 4592–6597) from vehicles and 1769 (95% CI: 1446–2091) from the dust-related sector, respectively. The numbers of the averted vehicle sector and coal combustion could account for 5.1% and 0.4% of the total death number in Beijing. Considering the local emission, control of vehicles has the most important effect on the mortality attributable to PM2.5 in Beijing. Because of the strict control of coal combustion for heating in the north of China, the contribution of coal combustion becomes less important to the mortality due to PM2.5. This study also reported the number of deaths attributable to PM2.5 from vehicles was 664 (95% CI: 542–786) in Tokyo in 2015 and 1061 (95% CI: 867–1253) in Bangkok in 2016. Compared with Tokyo and Bangkok, the ratio of mortality due to PM2.5 from vehicle exhaust to the total death number was highest in Beijing (5.1%), followed by Bangkok (2.4%) and Tokyo (0.6%). The PM2.5 from vehicle exhaust resulted in higher mortality in Beijing than in the other two metropolitan regions in East Asia.

4. Conclusions and Policy Implications

In summary, we analyzed the temporal trends of PM2.5 and ozone in the BTH region in northeast China using monitoring data from 2013 to 2020. The concentration of PM2.5, decreased by approximately 57% in the BTH region from 2013 to 2020, and the concentration of PM2.5 in Beijing almost achieved the national Standard Grade II in 2020. However, the ozone concentration did not show a clear trend in this region and was higher than the standard grade II since 2017.
More serious PM2.5 and ozone pollution was observed in the southern area of Hebei Province. In winter, the predominant wind direction from north to south in the BTH region with high wind speed diluted the PM2.5 concentration in Beijing City but transported PM2.5 pollution to the southern area of the BTH region. In winter, the control of PM2.5, emission sources in the urban area of Beijing City may have a significant effect on the reduction in PM2.5 pollution in the southern suburb region of BTH, consequently mitigating the corresponding health risks. The inverse correlation of PM2.5 and ozone with meteorological parameters suggest that atmospheric gaseous reactions, which mainly account for the secondary formation of ozone in summer and the liquid phase reaction owing to higher humidity, play an important role in the formation of PM2.5 or named haze pollution in winter.
The all-cause mortality owing to exposure to PM2.5 and ozone showed a similar pattern of spatial distribution in the BTH region. Higher all-cause mortality owing to both PM2.5 and ozone was found in the downtown area of Beijing City, where the population density was also high. The spatial distribution of all-cause mortality caused by exposure to both PM2.5, and ozone in Beijing City was more significantly affected by the distribution of population density. In contrast, the spatial distribution of all-cause mortality in Tianjin City and Hebei Province was affected by the distribution of both population and atmospheric concentrations of PM2.5 and ozone.
Overall, all-cause mortality owing to PM2.5 was significantly higher than that owing to ozone. On average, from 2013 to 2020, all-cause mortality owing to PM2.5 and ozone exposure accounted for 23.6% and 1.6% of the total number of deaths, respectively, in the BTH region. In view of the health impact, the control of PM2.5 pollution still has priority over ozone in the present situation. The proportion of all-cause mortality owing to PM2.5 exposure to the number of deaths was highest in Hebei Province (26.8%) and the proportion of ozone was highest in Beijing City (1.8%). Our results show that the number of all-cause deaths from 2013 to 2020 owing to PM2.5 dropped by 51%, 47%, and 62% in Beijing City, Tianjin City, and Hebei Province, respectively. On the contrary, from 2013 to 2020 the all-cause mortality attributable to ozone only slightly decreased by 7% in Beijing City and 10% in Hebei Province but increased by 43% in Tianjin City. Although the mortality owing to PM2.5 exposure decreased significantly during the study period, it was still more serious than that of ozone. The proportion of all-cause mortality owing to ozone pollution in the BTH region has not decreased significantly in recent years. The average ratio of mortality caused by PM2.5 to the mortality attributable to ozone from 2013 to 2020 was 11.8, 15.6, and 17.8 in Beijing City, Tianjin City, and Hebei Province, respectively, and the ratios show a significant declining trend in the BTH region. This suggests that the health risks owing to ozone pollution, especially in Tianjin City and Hebei Province, need to gain more attention. An appropriate co-control policy for PM2.5 and ozone pollution is necessary for the surrounding areas of Beijing City to protect public health.
The control of the carbonaceous components in PM2.5 has important meaning for human health benefit. Although the contribution of EC to the particulate mass was much smaller than that of ions, the mortality due to EC was much higher than ions. The human health effect attributable to EC in PM2.5 is more sensitive than OC, SO42−, and NO3 in PM2.5, and, therefore, the control policy of EC emission has the most significant effect on mitigating the health risk. The major contributing emission sector to the mortality of PM2.5 in Beijing was regional transportation which could explain approximately 6.5% of the total mortality in Beijing. The vehicle sector was the most important local source which accounted for 5.1% of total mortality in Beijing. The contribution of coal combustion becomes less important to the mortality due to PM2.5 in Beijing. The relative contribution from mortality due to PM2.5 and the main particulate constituents to the total death number in Beijing was higher than in Tokyo and Bangkok, and the PM2.5 from vehicle exhaust resulted in higher mortality in Beijing than in the above two metropolitan regions in East Asia.

Supplementary Materials

The following supporting information can be downloaded at: https://www.mdpi.com/article/10.3390/atmos13111813/s1, Figure S1. The correlation analysis between daily PM2.5 concentration observed from US embassy and the nearest monitoring site (Nongzhanguan site) in Beijing from 2015 to 2017; Figure S2. Emissions of major air pollutants in the study area. Note: The city in the rectangle is included the Beijing-Tianjin-Hebei region; Figure S3. The source appointments results from the cities in East Asia. Source: (a) Report of PM2.5 source appointment project by Beijing Municipal Ecology and Environment Bureau; (b) Report of results of PM2.5 source appointments in Tokyo by Ministry of Environment Japan; (c) Final report on “A Study in Urban Air Pollution Improvement in Asia” by the Japan International Cooperation Agency (JICA); Figure S4. Mortality attributable to PM2.5 compositions (left axis) and the ratio of morality attributable to PM2.5 compositions to the mortality attributable to PM2.5 (right axis) among Beijing, Tokyo and Bangkok; Table S1. Population (104) and Death rate (‰) at Beijing City, Tianjin City, and Hebei Province; Table S2. Data sources of PM2.5 compositions (particulate OC, EC, SO42− and NO3) at Beijing since 2013 to 2020; Table S3. Estimates for extra risk values (ER) and 95% confidence intervals (95% CI) of all-cause mortality attribute to PM2.5 and ozone.

Author Contributions

Conceptualization, M.H. and K.Y.; Data curation, M.H. and F.C.; Formal analysis, M.H. and F.C.; Funding acquisition, M.H., K.Y. and K.S.; Investigation, M.H.; Methodology, M.H., K.Y. and F.C.; Project administration, K.Y. and K.S.; Resources, M.H.; Software, M.H. and F.C.; Supervision, K.Y. and K.S.; Validation, M.H.; Writing—original draft, M.H.; Writing—review and editing, M.H., K.Y. and K.S. All authors have read and agreed to the published version of the manuscript.

Funding

This study was supported by the ACAP Fund for Enhancement of Research Activity (ACAP202101) from the Asia Center for Air Pollution Research.

Institutional Review Board Statement

Not applicable.

Informed Consent Statement

Not applicable.

Data Availability Statement

Raw data were obtained from publicly available online sources. The datasets generated and analyzed during the current study are available from the corresponding author upon reasonable request.

Acknowledgments

The authors thank the committee members of the Enhancement of Research Activity Fund from the Asia Center for Air Pollution Research (ACAP) for their support and supervision in this study. We also sincerely appreciate Hiroaki Minoura from the Nagoya University of Commerce and Business for his kind contribution to the analysis of meteorological parameters, and Qinghua Sun from the Chinese Center for Disease Control and Prevention for her kind advice on the methodology of health risk assessment. The authors would also like to thank all reviewers for their valuable comments and suggestions to improve this paper.

Conflicts of Interest

The authors declare no competing interests.

References

  1. Faridi, S.; Shamsipour, M.; Krzyzanowski, M.; Künzli, N.; Amini, H.; Azimi, F.; Malkawi, M.; Momeniha, F.; Gholampour, A.; Hassanvand, M.S.; et al. Long-term trends and health impact of PM2.5 and O3 in Tehran, Iran, 2006–2015. Environ. Int. 2018, 114, 37–49. [Google Scholar] [CrossRef] [PubMed]
  2. Cohen, A.J.; Brauer, M.; Burnett, R.; Anderson, H.R.; Frostad, J.; Estep, K.; Balakrishnan, K.; Brunekreef, B.; Dandona, L.; Dandona, R.; et al. Estimates and 25-year trends of the global burden of disease attributable to ambient air pollution: An analysis of data from the Global Burden of Diseases Study 2015. Lancet 2017, 389, 1907–1918. [Google Scholar] [CrossRef] [Green Version]
  3. Atkinson, R.W.; Mills, I.C.; Walton, H.A.; Anderson, H.R. Fine particle components and health—A systematic review and meta-analysis of epidemiological time series studies of daily mortality and hospital admissions. J. Expo. Sci. Environ. Epidemiol. 2015, 25, 208–214. [Google Scholar] [CrossRef] [PubMed] [Green Version]
  4. Nawahda, A.; Yamashita, K.; Ohara, T.; Kurokawa, J.; Yamaji, K. Evaluation of premature mortality caused by exposure to PM2.5 and ozone in East Asia: 2000, 2005, 2020. Water Air Soil Pollut. 2012, 223, 3445–3459. [Google Scholar] [CrossRef]
  5. Chen, F.; Yamashita, K.; Kurokawa, J.; Klimont, Z. Cost-benefit analysis of reducing premature mortality caused by exposure to ozone and PM2.5 in East Asia in 2020. Water Air Soil Pollut. 2015, 226, 1–17. [Google Scholar] [CrossRef]
  6. Song, C.; He, J.; Wu, L.; Jin, T.; Chen, X.; Li, R.; Ren, P.; Zhang, L.; Mao, H. Health burden attributable to ambient PM2.5 in China. Env. Pollut. 2017, 223, 575–586. [Google Scholar] [CrossRef]
  7. Ostro, B.; Spadaro, J.V.; Gumy, S.; Mudu, P.; Awe, Y.; Forastiere, F.; Peters, A. Assessing the recent estimates of the global burden of disease for ambient air pollution: Methodological changes and implications for low- and middle-income countries. Environ. Res. 2018, 166, 713–725. [Google Scholar] [CrossRef]
  8. Li, C.; Ma, X.; Fu, T.; Guan, S. Does public concern over haze pollution matter—Evidence from Beijing-Tianjin-Hebei region, China. Sci. Total Environ. 2021, 755, 142–397. [Google Scholar] [CrossRef]
  9. Conibear, L.; Butt, E.W.; Knote, C.; Arnold, S.R.; Spracklen, D.V. Residential energy use emissions dominate health impacts from exposure to ambient particulate matter in India. Nat. Commun. 2018, 9, 1–9. [Google Scholar] [CrossRef] [Green Version]
  10. Zhou, Q.; Cheng, L.; Zhang, Y.; Wang, Z.; Yang, S. Relationships between Springtime PM2.5, PM10, and O3 Pollution and the Boundary Layer Structure in Beijing, China. Sustainability 2022, 14, 9041. [Google Scholar] [CrossRef]
  11. Zhang, X.; Xiao, X.; Wang, F.; Brasseur, G.; Chen, S.; Wang, J.; Gao, M. Observed sensitivities of PM2.5 and O3 extremes to meteorological conditions in China and implications for the future. Environ. Int. 2022, 168, 107428. [Google Scholar] [CrossRef] [PubMed]
  12. Zheng, G.J.; Duan, F.K.; Su, H.; Ma, Y.L.; Cheng, Y.; Zheng, B.; Zhang, Q.; Huang, T.; Kimoto, T.; Chang, D.; et al. Exploring the severe winter haze in Beijing: The impact of synoptic weather, regional transport and heterogeneous reactions. Atmos. Chem. Phys. 2015, 15, 2969–2983. [Google Scholar] [CrossRef] [Green Version]
  13. Zheng, Y.; Xue, T.; Zhang, Q.; Geng, G.; Tong, D.; Xin, L.; He, K. Air quality improvements and health benefits from China’s clean air action since 2013. Environ. Res. Lett. 2017, 12, 114020. [Google Scholar] [CrossRef]
  14. China Statics Year Book 2014–2021. Available online: http://www.stats.gov.cn/english/ (accessed on 1 June 2022).
  15. Specifications and Test Procedures for Ambient Air Quality Continuous Monitoring System for PM10 and PM2.5; Ministry of Ecology and Environment the People’s Republic of China: Beijing, China, 2020. Available online: https://www.mee.gov.cn/xxgk2018/xxgk/xxgk06/202006/t20200630_786469.html (accessed on 1 June 2021).
  16. Ambient Air—Determination of Ozone—Ultraviolet Photometric Method; Ministry of Ecology and Environment the People’s Republic of China: Beijing, China, 2010. Available online: https://www.mee.gov.cn/ywgz/fgbz/bz/bzwb/jcffbz/201010/t20101026_196663.shtml (accessed on 1 June 2021).
  17. Calibration of Ambient Air Ozone Transfer Standard; Ministry of Ecology and Environment the People’s Republic of China: Beijing, China, 2020. Available online: https://www.mee.gov.cn/xxgk2018/xxgk/xxgk06/202006/t20200630_786469.html (accessed on 1 June 2021).
  18. Ji, D.; Gao, M.; Maenhaut, W.; He, J.; Wu, C.; Cheng, L.; Gao, W.; Sun, Y.; Sun, J.; Xin, J.; et al. The carbonaceous aerosol levels still remain a challenge in the Beijing-Tianjin-Hebei region of China: Insights from continuous high temporal resolution measurements in multiple cities. Environ. Int. 2019, 126, 171–183. [Google Scholar] [CrossRef] [PubMed]
  19. Wang, X.; Wei, W.; Cheng, S.; Yao, S.; Zhang, H.; Zhang, C. Characteristics of PM2.5 and SNA components and meteorological factors impact on air pollution through 2013–2017 in Beijing, China. Atmos. Pollut. Res. 2019, 10, 1976–1984. [Google Scholar] [CrossRef]
  20. Jia, J.; Han, L.; Cheng, S.; Zhang, H.; Lv, Z. Pollution characteristic of PM2.5 and secondary inorganic ions in Beijing-Tianjin-Hebei region. China Environ. Sci. 2018, 38, 801–811. [Google Scholar]
  21. Ding, M.; Zhou, J.; Liu, B.; Wang, Y.; Zhang, B.; Shi, A.; Yang, D.; Chang, M. Pollution Characteristics of NH4+, NO3, SO42− in PM2.5 and Their Precursor Gases During 2015 in an Urban Area of Beijing. Environ. Sci. 2017, 38, 1307–1315. [Google Scholar]
  22. Huang, X.; Tang, G.; Zhang, J.; Liu, B.; Liu, C.; Zhang, J.; Cong, L.; Cheng, M.; Yan, G.; Gao, W.; et al. Characteristics of PM2.5 pollution in Beijing after the improvement of air quality. J. Environ. Sci. 2021, 100, 1–10. [Google Scholar] [CrossRef]
  23. Luo, L.; Bai, X.; Liu, S.; Wu, B.; Liu, W.; Lv, Y.; Guo, Z.; Lin, S.; Zhao, S.; Hao, Y.; et al. Fine particulate matter (PM2.5/PM1.0) in Beijing, China: Variations and chemical compositions as well as sources. J. Environ. Sci. 2022, 121, 187–198. [Google Scholar] [CrossRef]
  24. Final Report Research Project on “A Study in Urban Air Pollution Improvement in Asia”; Japan International Cooperation Agency (JICA): Tokyo, Japan, 2017.
  25. Narita, D.; Oanh, N.T.K.; Sato, K.; Huo, M.; Permadi, D.A.; Chi, N.N.H.; Ratanajaratroj, T.; Pawarmart, I. Pollution characteristics and policy actions on fine particulate matter in a growing Asian economy: The case of Bangkok Metropolitan Region. Atmosphere 2019, 10, 227. [Google Scholar] [CrossRef] [Green Version]
  26. Song, Y.; Huang, B.; He, Q.; Chen, B.; Wei, J.; Mahmood, R. Dynamic assessment of PM2.5 exposure and health risk using remote sensing and geo-spatial big data. Env. Pollut. 2019, 253, 288–296. [Google Scholar] [CrossRef] [PubMed]
  27. Lu, X.; Yao, T.; Fung, J.C.H.; Lin, C. Estimation of health and economic costs of air pollution over the Pearl River Delta region in China. Sci. Total Environ. 2016, 566–567, 134–143. [Google Scholar] [CrossRef] [PubMed]
  28. Shang, Y.; Sun, Z.; Cao, J.; Wang, X.; Zhong, L.; Bi, X.; Li, H.; Liu, W.; Zhu, T.; Huang, W. Systematic review of Chinese studies of short-term exposure to air pollution and daily mortality. Environ. Int. 2013, 54, 100–111. [Google Scholar] [CrossRef] [PubMed]
  29. Achilleos, S.; Kioumourtzoglou, M.A.; Wu, C.D.; Schwartz, J.D.; Koutrakis, P.; Papatheodorou, S.I. Acute effects of fine particulate matter constituents on mortality: A systematic review and meta-regression analysis. Environ. Int. 2017, 109, 89–100. [Google Scholar] [CrossRef]
  30. World Health Organization. Health Risks of Ozone from Long-Range Transboundary Air Pollution; WHO Regional Office for Europe: Copenhagen, Denmark, 2008. [Google Scholar]
  31. Center for International Earth Science Information Network—CIESIN—Columbia University (2018). Gridded Population of the World, Version 4 (GPWv4): Administrative Unit Center Points with Population Estimates; Revision 11; NASA Socioeconomic Data and Applications Center (SEDAC): Palisades, NY, USA, 2021. [Google Scholar] [CrossRef]
  32. China Air Quality Improvement Report (2013–2018); Ministry of Ecology and Environment of the People’s Republic of China: Beijing, China, 2019.
  33. Song, S.; Gao, M.; Xu, W.; Sun, Y.; Worsnop, D.R.; Jayne, J.T.; Zhang, Y.; Zhu, L.; Zhou, Z.; Cheng, C.; et al. Possible heterogeneous hydroxymethanesulfonate (HMS) chemistry in northern China winter haze. Atmos. Chem. Phys. 2019, 1357–1371. [Google Scholar] [CrossRef] [Green Version]
  34. Xue, T.; Liu, J.; Zhang, Q.; Geng, G.; Zheng, Y.; Tong, D.; Liu, Z.; Guan, D.; Bo, Y.; Zhu, T.; et al. Rapid improvement of PM2.5 pollution and associated health benefits in China during 2013–2017. Sci. China Earth Sci. 2019, 62, 1847–1856. [Google Scholar] [CrossRef]
  35. Huang, X.; Liu, Z.; Liu, J.; Hu, B.; Wen, T.; Tang, G.; Zhang, J.; Wu, F.; Ji, D.; Wang, L.; et al. Chemical characterization and source identification of PM2.5 at multiple sites in the Beijing–Tianjin–Hebei region, China. Atmos. Chem. Phys. 2017, 17, 12941–12962. [Google Scholar] [CrossRef]
Figure 1. Spatial distribution of annual average concentration of PM2.5 in China in 2015 and target study area (Beijing City, Tianjin City, and Hebei Province).
Atmosphere 13 01813 g001
Figure 2. Annual average concentration of PM2.5 (left) and average top consecutive 8 h concentration of ozone (right) in the Beijing–Tianjin–Hebei region from 2013 to 2020.
Atmosphere 13 01813 g002
Figure 3. Spatial distribution of annual concentrations of PM2.5 (left) and average top consecutive 8 h concentration of ozone (right) in the Beijing–Tianjin–Hebei region in 2018.
Atmosphere 13 01813 g003
Figure 4. Variation in monthly average concentrations of PM2.5 and ozone in the Beijing–Tianjin–Hebei region and meteorological parameters in Beijing City from 2015 to 2018. Sunshine, sunshine hours; WIN, wind speed (m/min); TEM, ambient temperature (°C); RHU, relative humidity (%).
Atmosphere 13 01813 g004aAtmosphere 13 01813 g004b
Figure 5. Distribution of wind direction in December (left) and August (right) over the Beijing–Tianjin–Hebei region.
Atmosphere 13 01813 g005
Figure 6. All-cause mortality owing to exposure to PM2.5 (upper left), ozone (upper right), and ratio of the mortality attributable to PM2.5 to the mortality attributable to ozone (lower) in the Beijing–Tianjin–Hebei region. Note: Error bar in the upper images means the 95% confidence interval.
Atmosphere 13 01813 g006
Figure 7. All-cause mortality per unit area owing to exposure to PM2.5 (left) and ozone (right) in 2018 in the Beijing–Tianjin–Hebei region.
Atmosphere 13 01813 g007
Figure 8. The annual change in mortality due to PM2.5 (left axis) and the major compositions of PM2.5 (right axis) in Beijing. Note: a: Ji et al., 2019 [18]. b: Want et al., 2019 [19]. c: Jia et al., 2018 [20]. d: Ding et al., 2017 [21]. e: Huang et al., 2021 [22]. f: Luo et al., 2021 [23].
Atmosphere 13 01813 g008
Figure 9. Comparison of the mortality attributable to each emission sector of PM2.5 (left axis) and the ratio of the mortality attributable to emission sectors to the total number of deaths in Beijing (right axis) between 2017 and 2020.
Atmosphere 13 01813 g009
Table 1. Spearman correlation among daily means of PM2.5, ozone, and meteorological parameters in December from 2015 to 2018.
PM2.5Wind SpeedRelative HumidityAir TemperatureSunshine HoursAir PressureOzone
PM2.51−0.578 **0.823 **0.255 **−0.560 **−0.402 **−0.538 **
Wind speed 1−0.620 **0.0510.462 **0.1720.713 **
Relative humidity 10.17−0.672 **−0.366 **−0.672 **
Air temperature 10.013−0.641 **0.119
Sunshine hours 10.218 *0.655 **
Air pressure 10.195 *
Ozone 1
** p < 0.01; * p < 0.05.
Table 2. Spearman correlation among daily means of PM2.5, ozone, and meteorological parameters in August from 2015 to 2018.
PM2.5Wind SpeedRelative HumidityAir TemperatureSunshine HoursAir PressureOzone
PM2.51−0.245 **0.424 **0.235 **−0.236 **−0.196 *0.474 **
Wind speed 1−0.1340.0150.079−0.003−0.161
Relative humidity 1−0.243 **−0.676 **−0.124−0.189 *
Air temperature 10.314 **−0.461 **0.549 **
Sunshine hours 1−0.0170.449 **
Air pressure 1−0.155
Ozone 1
** p < 0.01; * p < 0.05.
Publisher’s Note: MDPI stays neutral with regard to jurisdictional claims in published maps and institutional affiliations.

