Article

GOSAT Mapping of Global Greenhouse Gas in 2020 and 2021

1
Satellite Application Center for Ecology and Environment, Ministry of Ecology and Environment/State Environmental Protection Key Laboratory of Satellite Remote Sensing, Beijing 100094, China
2
Jinan Environmental Monitoring Center of Shandong Province, Jinan 250101, China
*
Author to whom correspondence should be addressed.
Atmosphere 2022, 13(11), 1814; https://doi.org/10.3390/atmos13111814
Submission received: 9 October 2022 / Revised: 28 October 2022 / Accepted: 29 October 2022 / Published: 31 October 2022

Abstract

:
Carbon dioxide and methane are the two most important greenhouse gases and are closely related to global warming and extreme weather events. To master their spatial and temporal variations, the CO2 and CH4 concentration data monitored by the GOSAT satellite in 2020 and 2021 were used to map and analyse the annual, seasonal and monthly changes in CO2 and CH4 concentrations in the world and major countries/regions. The results demonstrate that (1) in 2021, the average annual CO2 concentration over the global land area was 412.74 ppm, an increase in 0.64% compared with the same period last year, and there were spatial differences in the distribution of CO2 concentration, with high values mostly concentrated in the middle latitudes of the Northern Hemisphere; (2) compared with 2020, the CO2 concentration in China, the United States, India, the European Union and other countries/regions increased significantly; (3) in 2020 and 2021, the quarterly CO2 trend of the global and major countries/regions was the same, which was higher in the first (January, February, March) and second (April, May, June) quarters, significantly lower in the third (July, August, September) quarter, and gradually increased in the fourth (October, November, December) quarter. Further work on long time series and validation needs to be conducted.

1. Introduction

In 2020, greenhouse gas (GHG) mole fractions reached new highs, with globally average surface mole fractions of carbon dioxide (CO2) of 413.2 ± 0.2 ppm and methane (CH4) of 1889 ± 2 ppb that are 149% and 262% of preindustrial levels, respectively. In addition, real-time data from specific locations indicate that their levels continued to increase in 2021 [1]. CO2 and CH4, as the two key greenhouse gases leading to global warming and extreme climate events, have attracted increasing global attention in recent decades, especially after the carbon peak and neutrality proposed by the Chinese leader at the General Debate of the 75th Session of The United Nations General Assembly, September 2020. Reducing carbon emissions and conducting a carbon inventory has become a global consensus, and the monitoring of CO2 and CH4 concentration information is the key for conducting a carbon inventory and maintaining the carbon budget balance. Satellites, such as GOSAT, OCO-2, Envisat, TANSAT, and GF-5-01/02, play an important role in detecting GHG concentrations in large areas, and many studies have documented the technology widely used worldwide [2,3,4,5,6,7,8,9,10].
The detection principle of CO2 and CH4 concentrations by satellite remote sensing is their atmospheric absorption characteristics. GHG has absorption capacity in near-infrared and shortwave infrared bands. The solar radiation in the near infrared and shortwave infrared bands is absorbed by CO2 or CH4 molecules in the atmosphere, which are received and recorded by satellite sensors. According to the depth and shape of the spectrum, combined with high-precision radiative transfer simulation calculations, the quantitative inversion of atmospheric GHG concentrations is processed. However, here, the atmospheric CO2 or CH4 concentration monitored by satellite remote sensing refers to the average dry-air mixing ratio concentration of the atmospheric CO2 column (XCO2) or CH4 column (XCH4), which represents the CO2 concentration under standard atmospheric pressure.
Satellite remote sensing observations provide estimates of GHG at relatively high spatial and temporal resolutions at global or regional scales [10]. Satellite projects such as ENVISAT/SCIAMACHY, GOSAT/TANSO and OCO-2 usually develop and provide GHG products freely to all users in the world. For example, Butz et al. [11] proposed and evaluated a method with Sentinel-5P-TROPOMI to accurately monitor XCH4. Prasad et al. [12] used SCIAMACHY and GOSAT data to study the variation in XCO2 and XCH4 over India and tested it well with ground data. Wang et al. [6] discussed the seasonal variation and long-term trend of low-tropospheric CO2 in China, observed by SCIAMACHY XCO2 data. Hakkarainen et al. [13] and Crowell et al. [14] estimated XCO2 using OCO-2 satellite data. Buchwitz et al. [15] produced a column average XCO2 and XCH4 dataset using SCIAMACHY and GOSAT between 2002 and 2014 and validated it with TCCON ground-based observations. Uspensky et al. [16] used the AIRS (EOS/Aqua) and IASI (MetOp) satellites to monitor the average tropospheric carbon dioxide concentration and total methane content over Siberia, and their standard deviations were not more than 3%. Parker et al. [17] adopted atmospheric methane observations from GOSAT to evaluate methane wetland emission estimates, which showed the utility of satellite data for evaluating wetland extent. Kong et al. [9] carried out a spatiotemporal consistency evaluation of XCO2 retrievals from GOSAT and OCO-2 based on TCCON validation. Nyasulu et al. [18] analysed the temporal pattern of tropospheric CO2 and CH4 between 2004 and 2016 over an urban site in Malawi, Southeast Africa, by Terra-Atmospheric Infrared Sounding (AIRS) data and found annual increasing concentrations of CO2 and CH4, with rates of 7.08% and 1.66%, respectively. Adiya et al. [19] assessed the spatial and temporal patterns of near-surface CO2 and CH4 concentrations in different permafrost regions on the Mongolian Plateau from 2010 to 2017 and found that they increased remarkably. As a widely used satellite for monitoring global or regional GHGs, GOSAT has been proven to be an effective and highly accurate dataset for estimating CO2 and CH4 by the above studies. Although many cases of GHG estimation with GOSAT have been studied for different periods and regions, there has been a lack of reports in the last two years. On the other hand, although GOSAT-2 was launched on October 29, 2018, and its Level 2 product is released after March 2019. The goals for the GOSAT-2 are to measure carbon dioxide with an accuracy of 0.5 ppm and methane with an accuracy of 5 ppb. Developers have also enhanced the satellite’s focused, target-point observation capabilities, enabling the device to gather more available data. Due to the short launch time of GOSAT-2, considering the stability and consistency of observing data, we only used GOSAT data for analysis, and we will add GOSAT-2 data in the future work.
In this work, to determine the latest status of global GHGs, we investigated the interannual, seasonal and monthly variations in global GHGs by GOSAT observations between 2020 and 2021; furthermore, the case of key carbon emitting countries and the possible causes of distribution patterns are also explored.

2. Data and Study Area

2.1. Data Collection

GOSAT was launched in 2009, and the Thermal and Near-Infrared Sensor for Carbon Observation (TANSO) is its observation instrument, in which the Fourier Transform Spectrometer (FTS) is the major unit. Due to its excellent observation capacity for CO2 detection, the L3 global CO2 distribution (SWIR) monthly average data and CO2 column average mixing ratio data projected on a global map in 2020 and 2021 were downloaded from the website of http://www.gosat.nies.go.jp/index_e.html (accessed on 8 October 2022) to conduct the study.

2.2. Study Area

The global land and key carbon emission countries were chosen as the study area. Key carbon emission countries refer to the top four countries in terms of anthropogenic carbon emissions. According to the Global Carbon Budget 2020, China accounted for 28% of global carbon emissions in 2019, the US accounted for 14%; the EU accounted for 8%; and India accounted for 7%; all accounting for 57% of the global total.

3. Results and Discussion

3.1. The Monitoring of CO2

3.1.1. Monitoring of Global Annual Average CO2 Concentration

A distribution map and table of global annual CO2 concentrations in 2020 and 2021 monitored with GOSAT were created (Table 1 and Figure 1).
In 2021, the average annual CO2 concentration over the global land area was 412.74 ppm, and its distribution was spatially different. The high-value areas were mainly concentrated in the Northern Hemisphere and distributed in parts of Asia, North America, South America and Africa. The global land area CO2 concentration increased as a whole in 2021, with growth rates in the United States, China, the European Union and other countries/regions above 0.6%. Among them, the European Union increased more: the increase was 2.71 ppm, representing 0.66%.
The high-value area of global CO2 concentration in 2021 was focused on Japan, southeastern China, the Korean Peninsula, the east and west coasts of the United States, etc. In addition, there were also small areas of high values in central and eastern Iran, the west coast of Canada, and the west coast of Saudi Arabia.

3.1.2. Monitoring of Quarterly Average CO2 Concentrations in the World and Major Countries/Regions

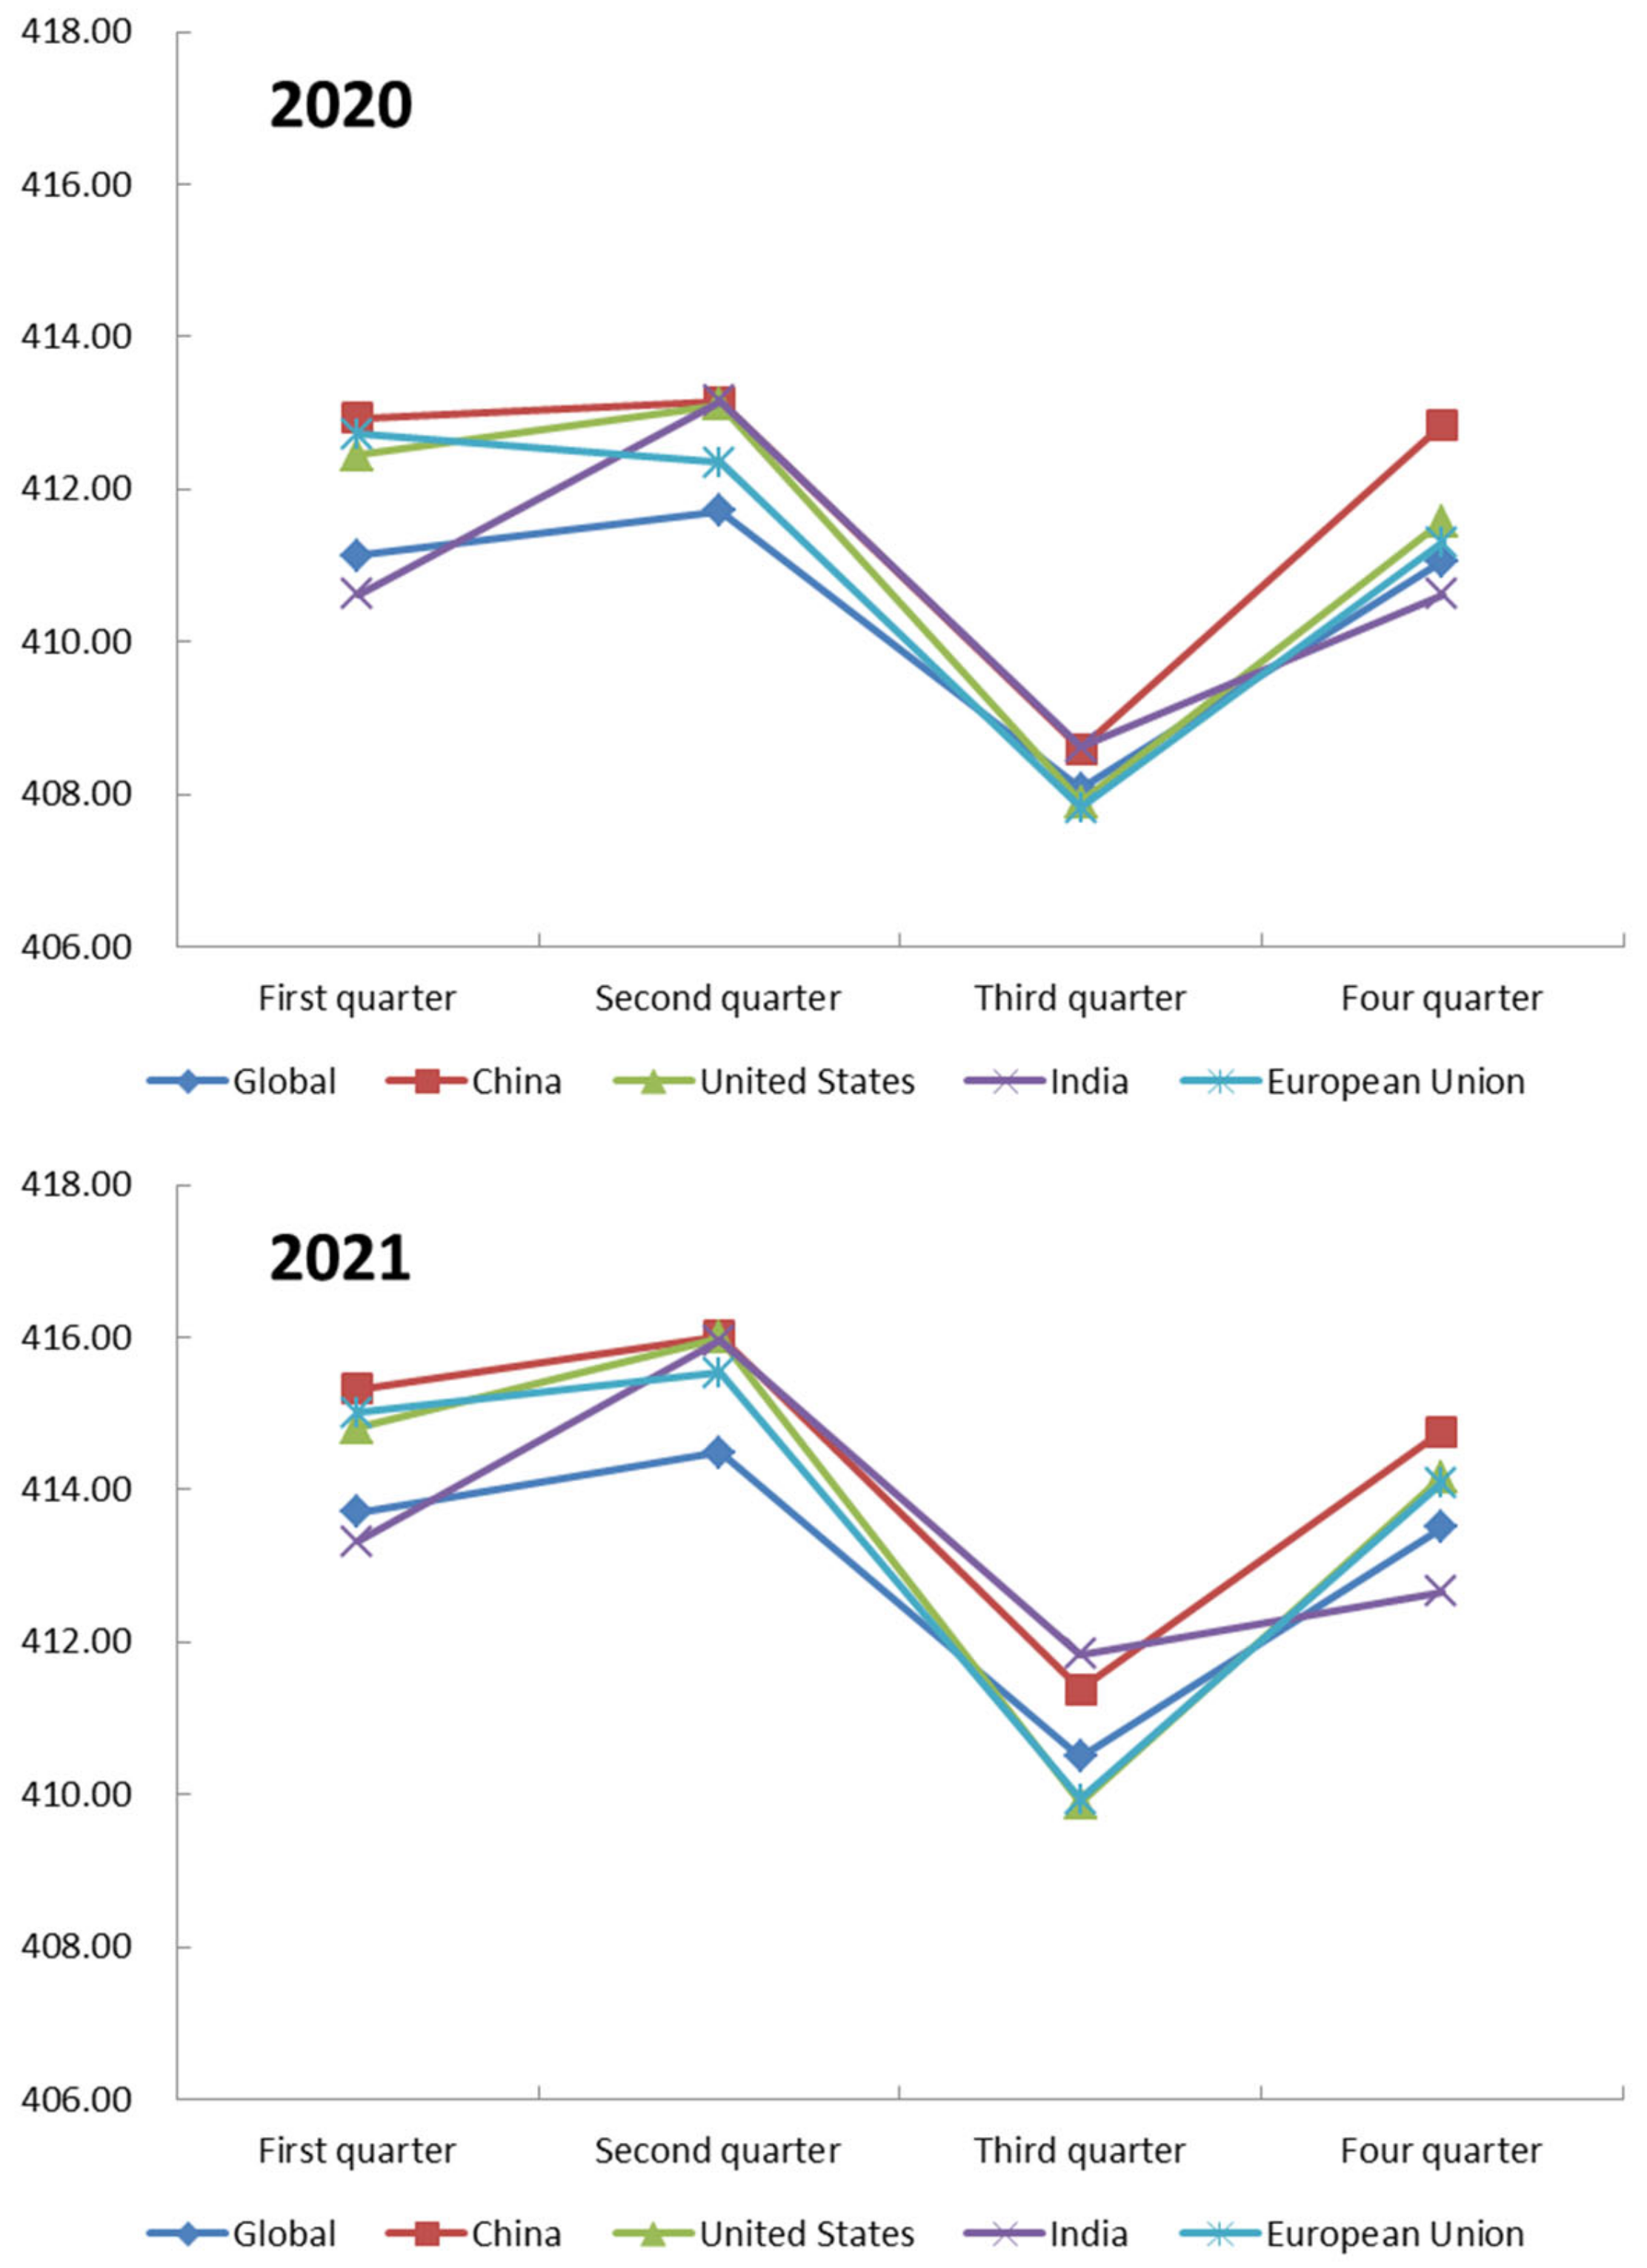
Quarterly average CO2 concentration changes in the world and major countries/regions monitored by GOSAT (Figure 2) show that the changing trend of quarterly average CO2 values in the world and major countries/regions in 2021 and 2020 was basically the same, with higher values in the first and second quarters, a significant decline in the third quarter, and a gradual recovery in the fourth quarter. The lowest quarterly average CO2 in 2021 was 409.89 ppm, which was higher than the lowest quarterly average CO2 in 2020 (407.89 ppm). The highest level of quarterly average CO2 in 2021 was 416.02 ppm, which was higher than the highest level of quarterly average CO2 in 2020 (413.16 ppm).
In 2021, the CO2 concentrations in the first, second and fourth quarters of China, the United States and the European Union were above the global average level (413.70 ppm, 414.49 ppm, and 413.50 ppm, respectively). In the third quarter, China and India were above the global level, while the US and EU were below the global level.

3.1.3. Monitoring of Monthly Average CO2 Concentrations in the World and Major Countries/Regions

The monthly changes in the global CO2 concentration and the major countries/regions monitored by satellite remote sensing are shown in Figure 3.
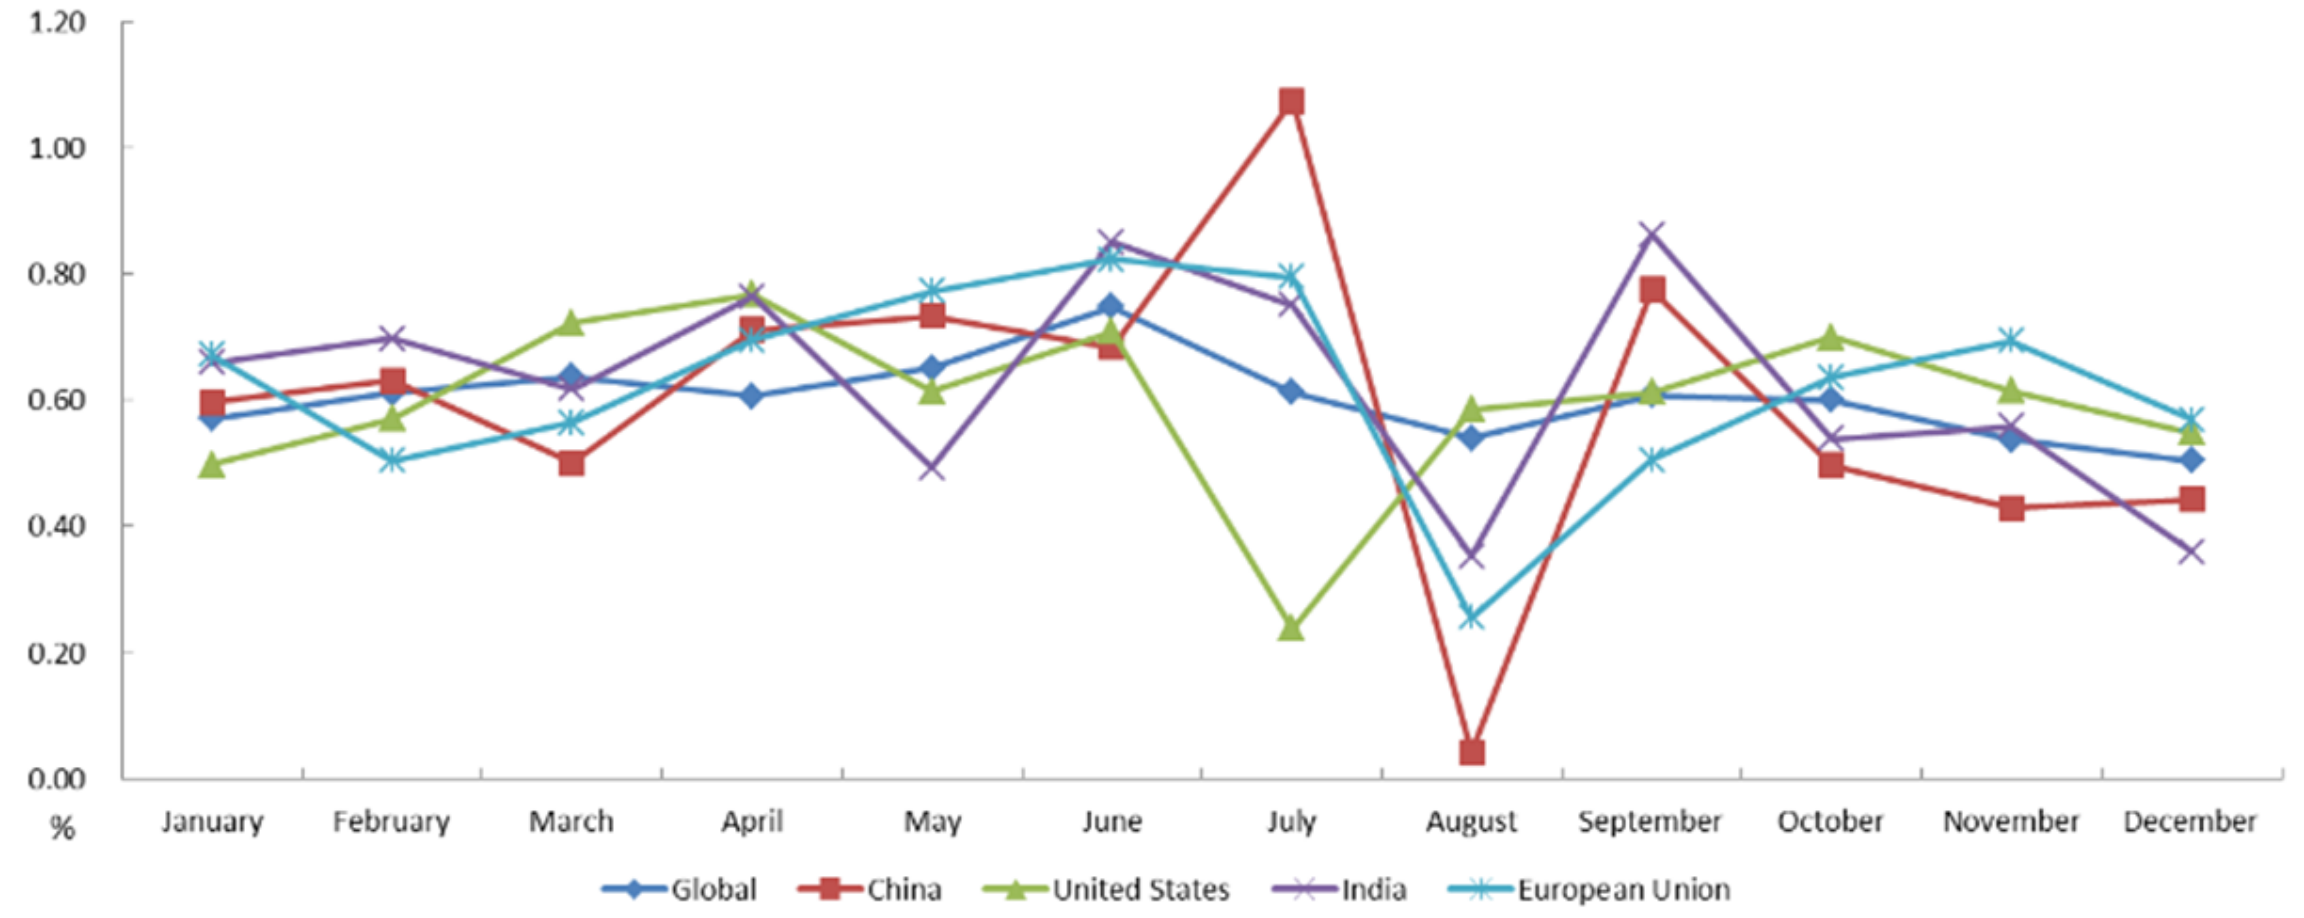
The global monthly average CO2 concentration in August was the lowest, which was 407.53 ppm and 409.73 ppm in 2020 and 2021, respectively. In 2020, the global monthly average CO2 concentration was the highest in December, which was 412.65 ppm. In 2021, the global monthly average CO2 concentration was the highest in May, at 415.23 ppm. Compared with 2020 (Figure 3), CO2 in major global countries/regions, such as China, India, the EU and the United States, increased month by month in 2021, and China, India and the EU all had months with an increase in more than 0.80%: China increased by 1.07% in July, India increased by 0.86% in September, and the EU increased by 0.82% in June.
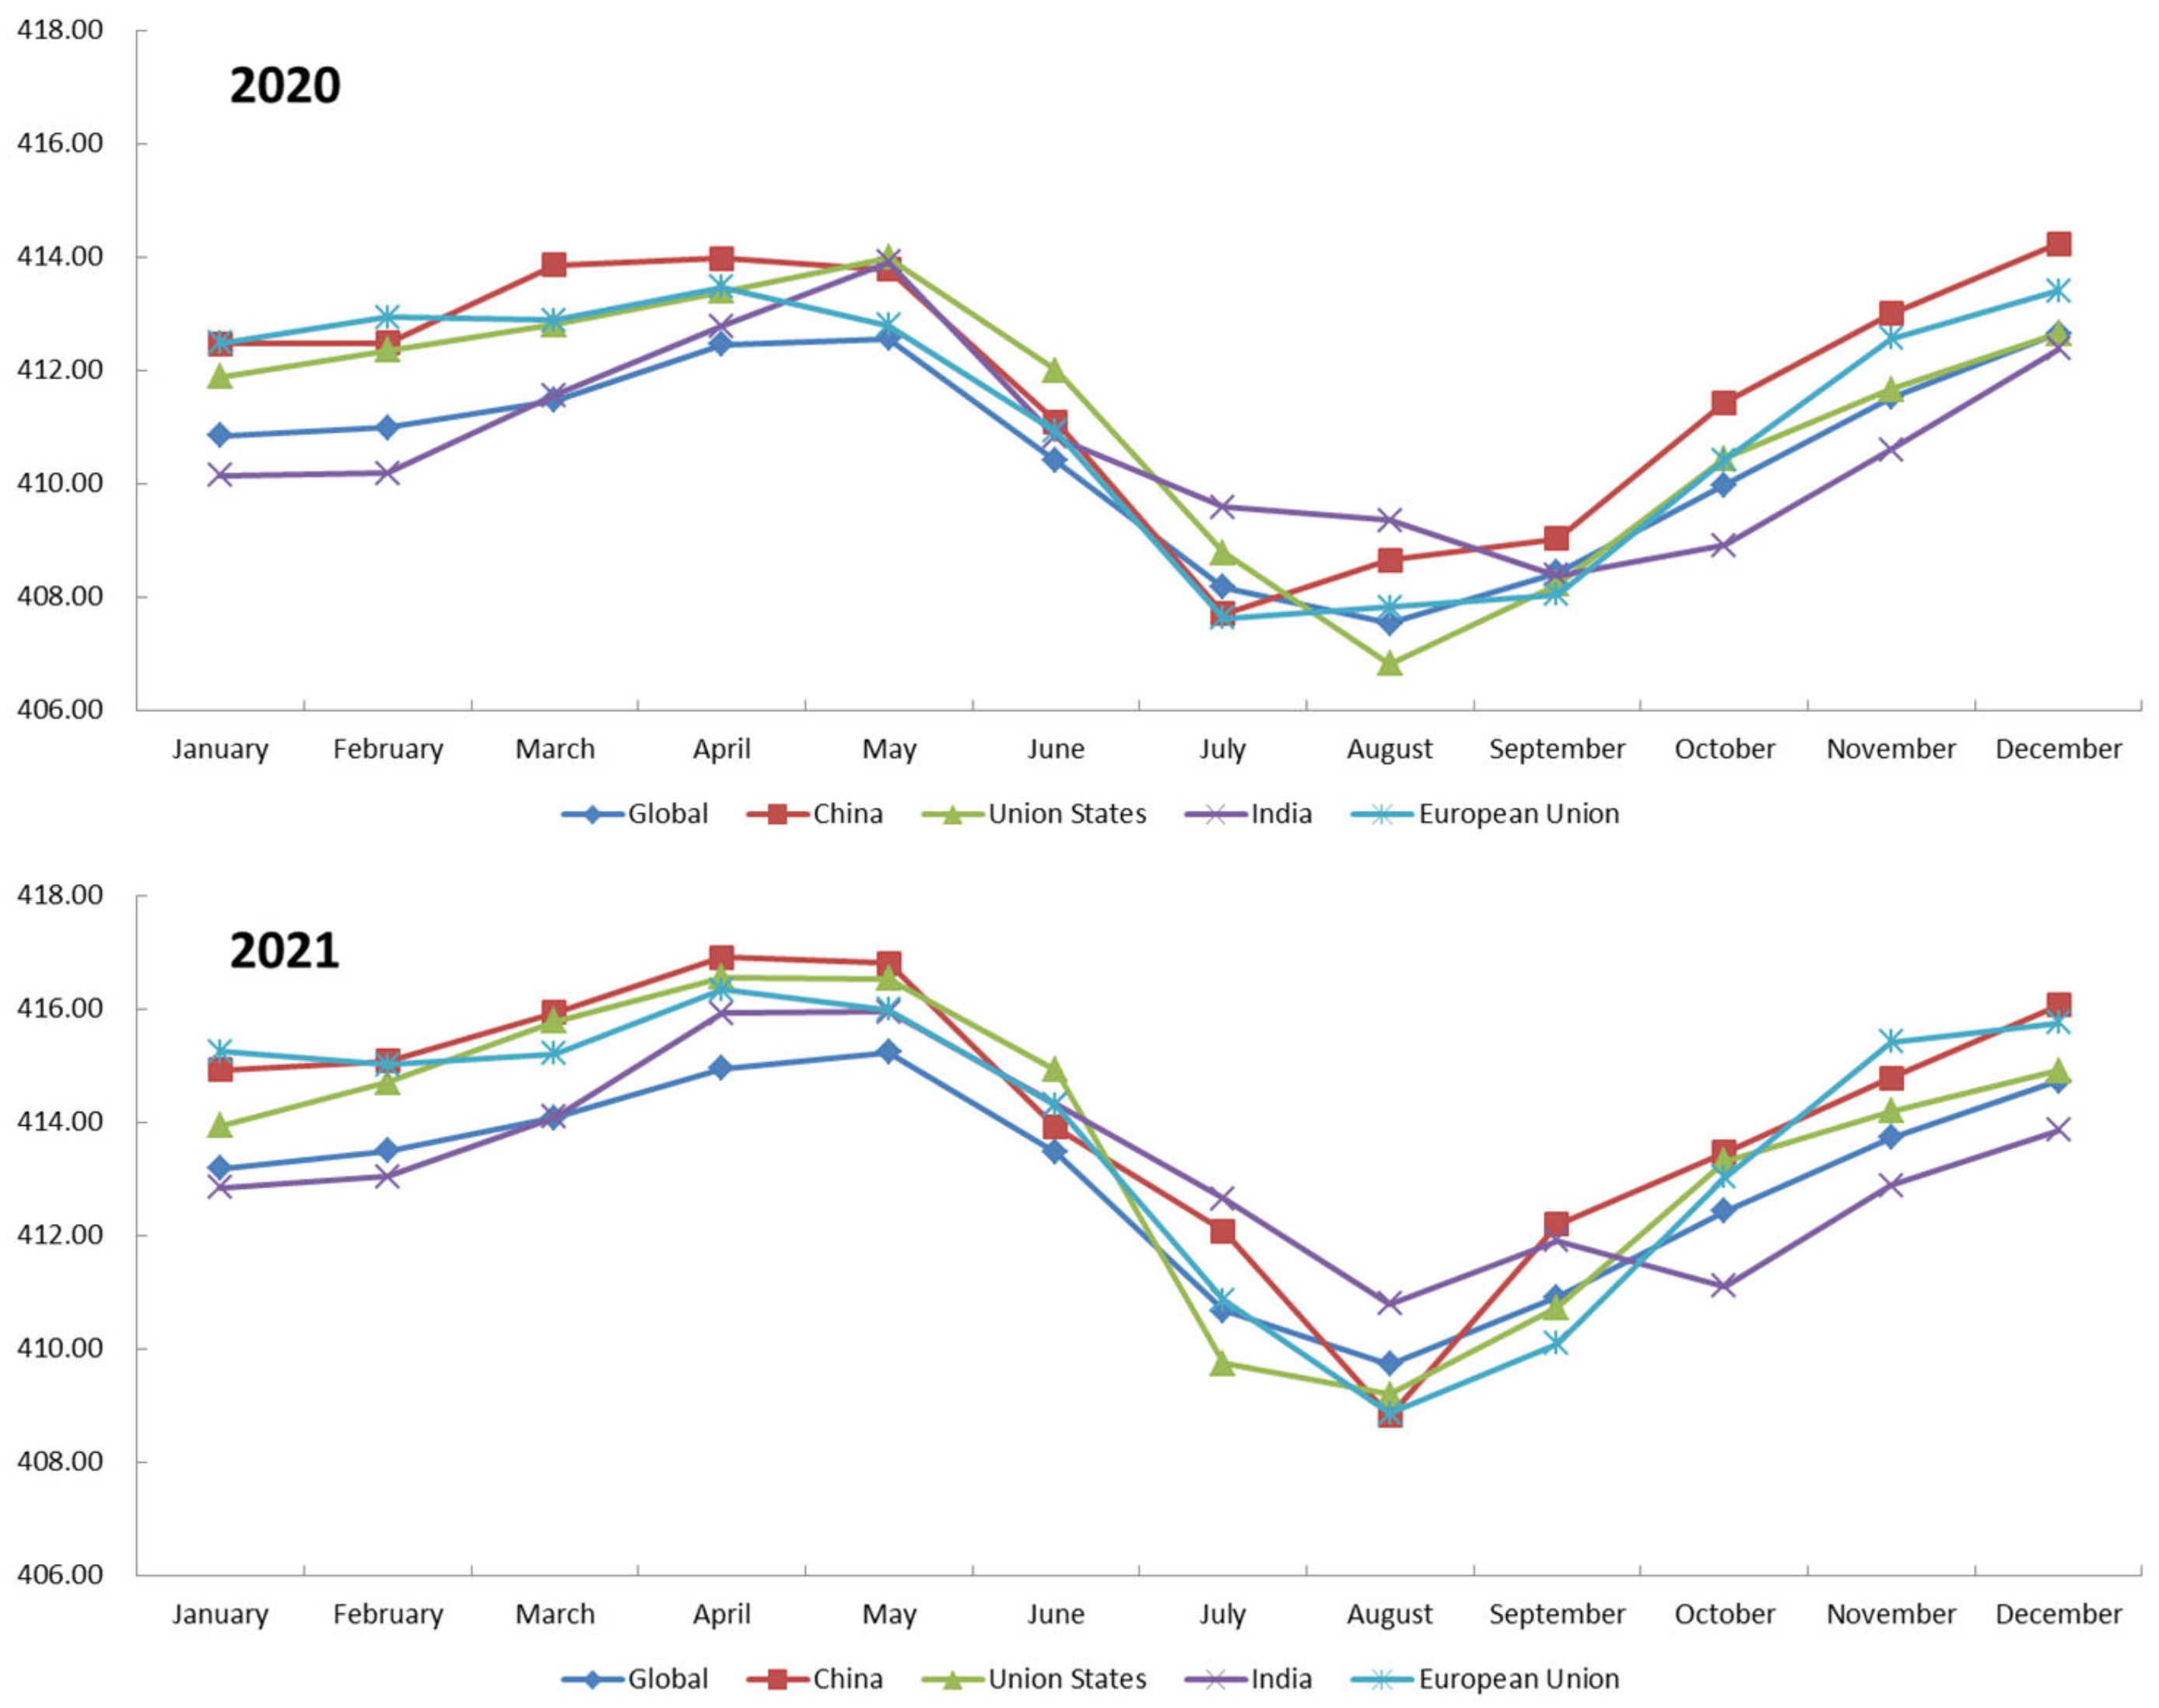
In 2021 (Figure 4), the monthly average CO2 concentrations in China, the United States and the European Union all reached their highest values in April (416.91, 416.56, and 416.34 ppm, respectively) and their lowest values in August. The monthly average CO2 concentration in India reached the highest value in May (415.94 ppm) and the lowest value in August.
Industrial activities in most countries/regions decreased significantly due to the COVID-19 pandemic in 2021, but CO2 concentrations continued to rise globally and in major countries/regions. Spatially, its highest value was mainly in the Northern Hemisphere, where anthropogenic activities are concentrated. The CO2 concentrations in southeastern China, the Korean Peninsula, and the east and west coasts of the United States were significantly higher than those in other countries/regions. The growth rates of the European Union and the United States cannot be ignored. In terms of time, their highest values were mostly concentrated in April and May. This may be related to carbon emissions from burning fossil fuels, seasonal differences in the carbon sink capacity of ecosystems, winter heating and other factors. We suggest combining ground monitoring results and carbon emission source data to continuously carry out spatiotemporal variation analysis of CO2 emissions.
According to the Statistical Review of World Energy 2020 [20], in 2020, the fossil energy consumption of most countries and regions in the world decreased to varying degrees due to the influence of COVID-19 and other factors, and the overall global carbon emissions decreased by 6.2%. However, China’s fossil energy consumption is still increasing, and carbon emissions are still rising by 0.6%. We suggest that "top-down" satellite remote sensing inversion technology should be improved to provide technical support for improving energy utilization efficiency and adjusting energy structure to achieve the goal of carbon peaking and carbon neutrality as soon as possible.

3.2. Monitoring of CH4

3.2.1. Monitoring of Global Annual Average CH4 Concentrations

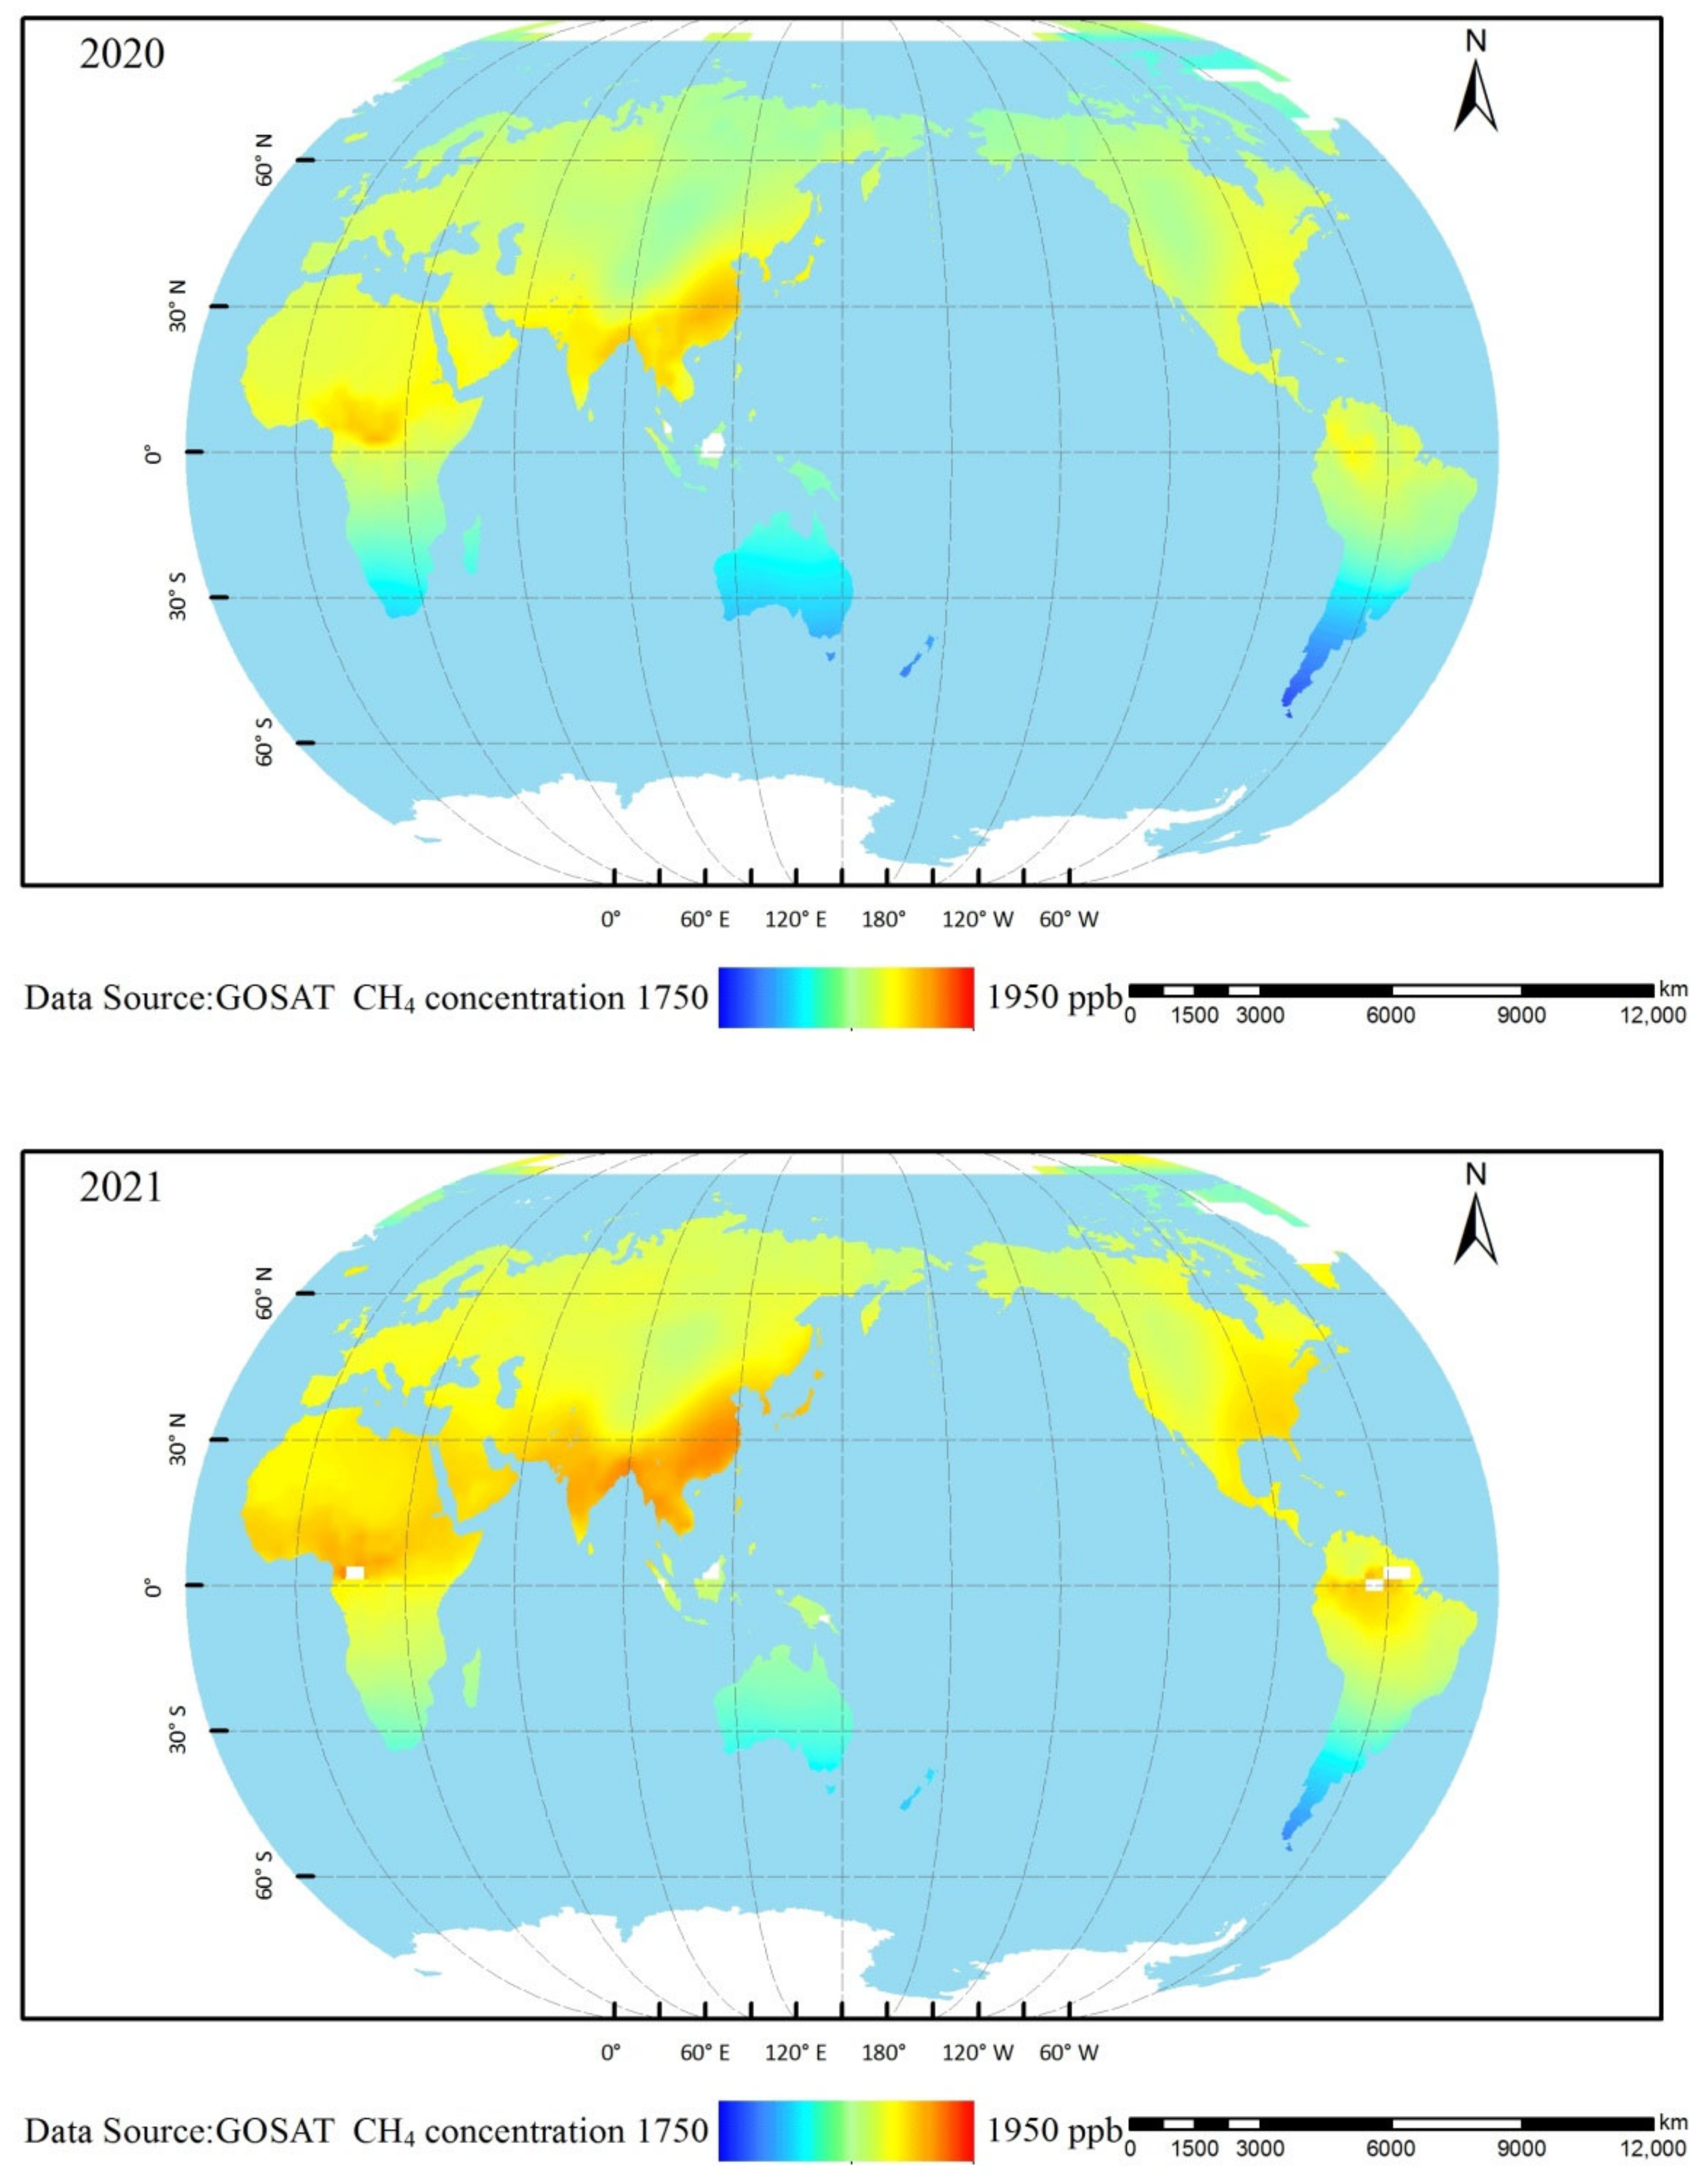
According to Table 2 and Figure 5, in 2021, the annual average concentration of CH4 over the global land area was 1853.00 ppb, with high values mainly concentrated in central Africa, South Asia, Indochina Peninsula, eastern East Asia, eastern United States and northwestern Brazil. In 2021, the concentration of CH4 in the global land area showed an overall upwards trend, rising by 0.87%, while the European Union, China, the United States and India increased by 0.80%, 0.85%, 0.86% and 0.95%, respectively.

3.2.2. Monitoring of Quarterly Average CH4 Concentrations on Global Land and in Major Countries/Regions

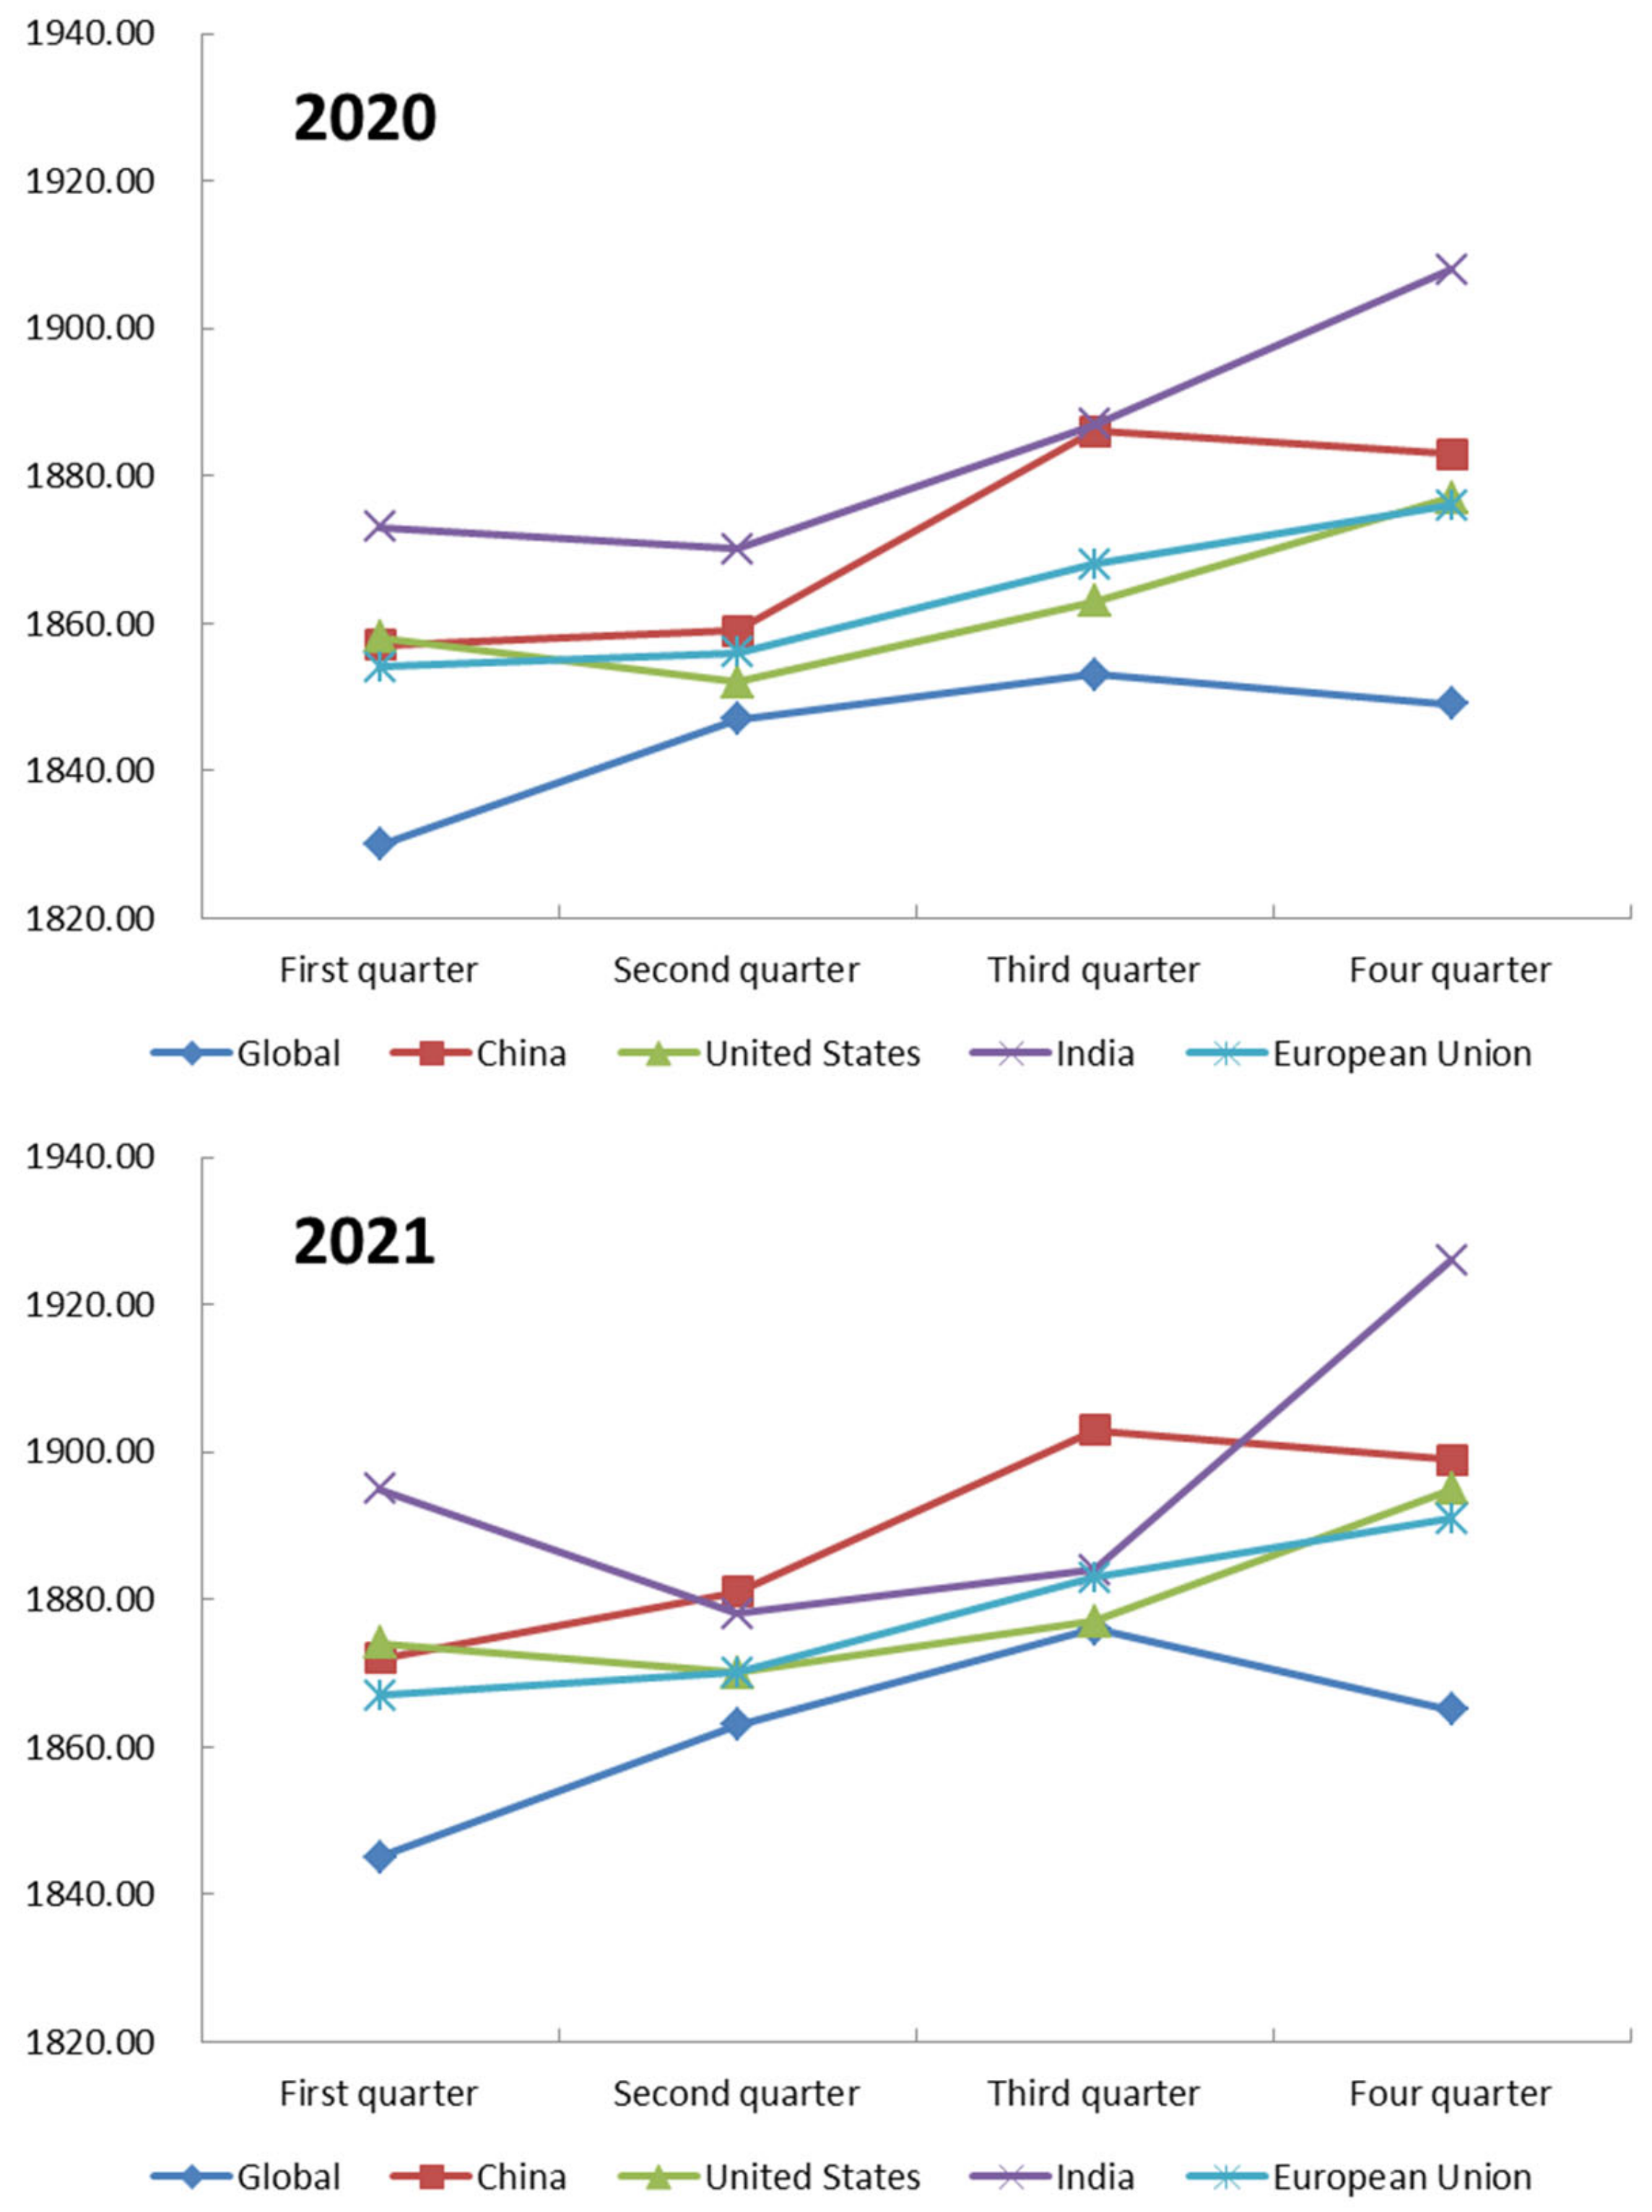
According to Figure 6, it can be seen that the trend of global land and Chinese CH4 quarterly mean values was the same, which gradually increased in the first three quarters and slightly decreased in the fourth quarter, and the highest value was in the third quarter. The trend of the CH4 quarterly average values of the United States and India was slightly lower in the second quarter. The trend of the mean value of CH4 in the quarter in the European Union gradually increased, and the highest value was in the fourth quarter.
The quarterly average concentrations of CH4 in China, the United States, India and the European Union were above the global average (1845.00, 1863.00, 1876.00 and 1865.00 ppb, respectively). Among them, China (1881.00 ppb and 1903.00 ppb, respectively) in the second and third quarters was higher than the other three countries and regions, while India (1895.00 ppb and 1926.00 ppb, respectively) in the first and fourth quarters was higher than the other three countries and regions.

3.2.3. Monitoring of Monthly Average CH4 Concentrations on Global Land and in Major Countries/Regions

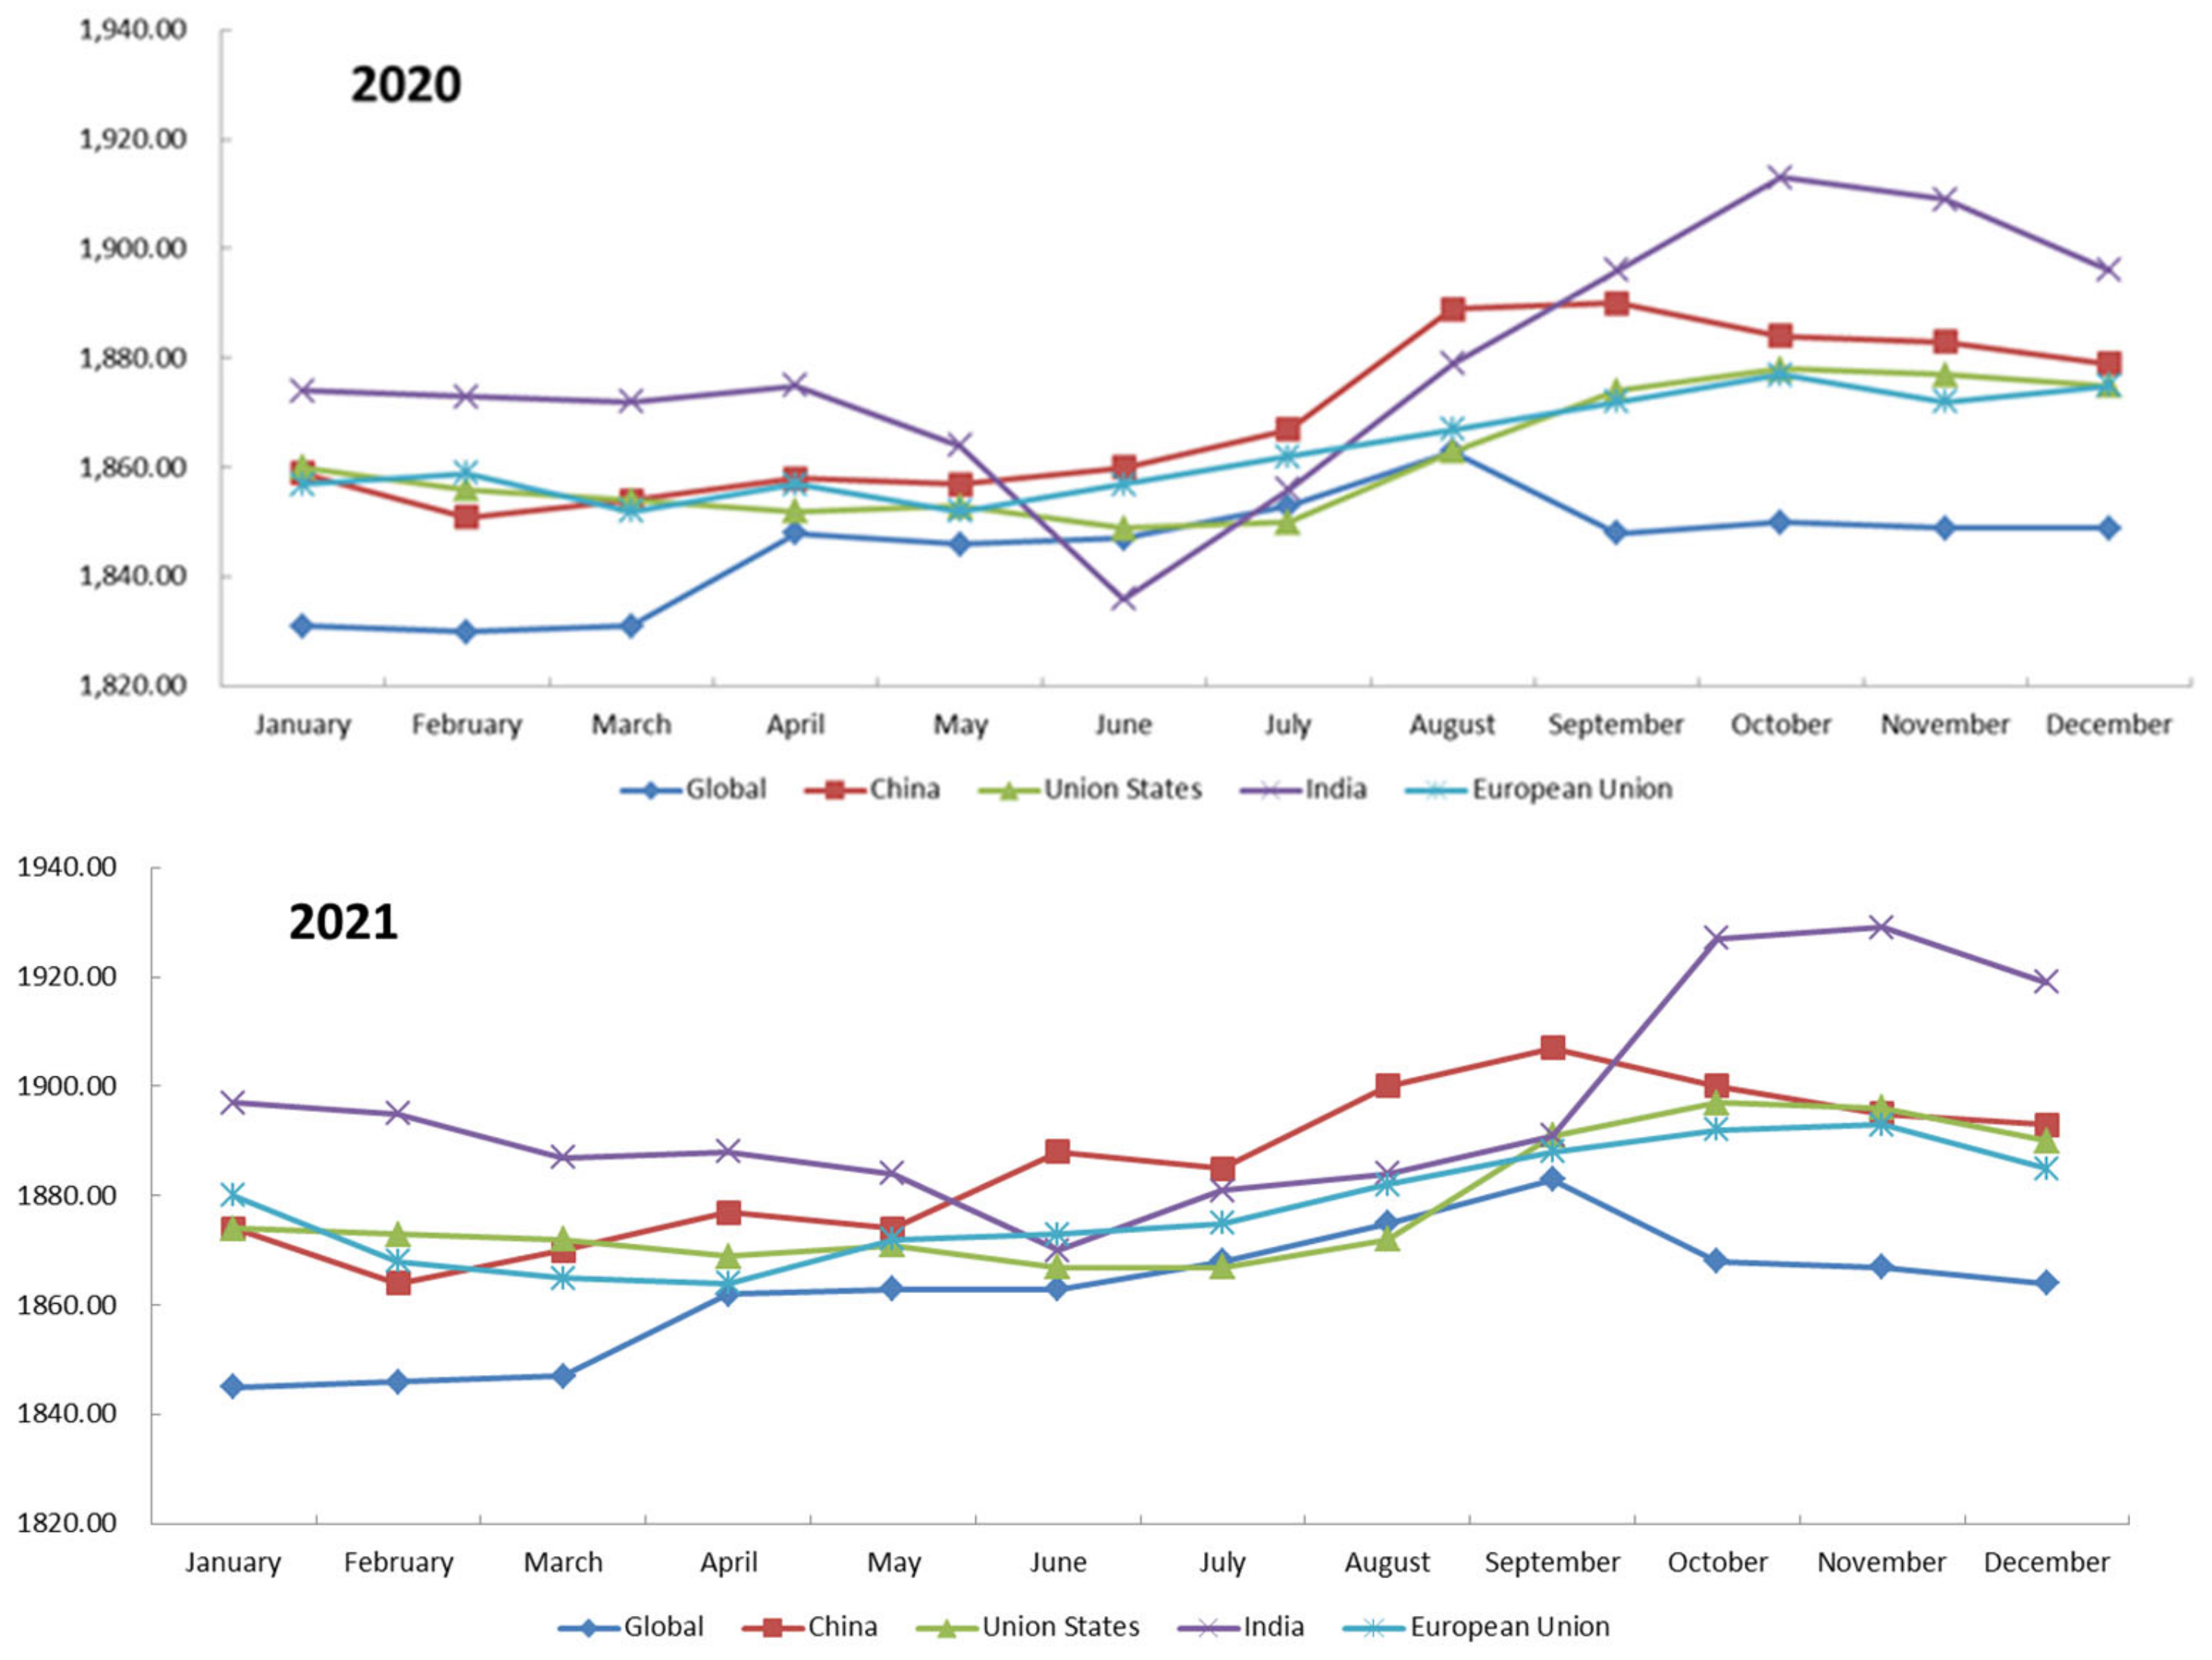
According to Figure 7, in 2021, the global land CH4 concentration from January to March was lower than 1860.00 ppb, and the CH4 concentration in other months was higher than 1860.00 ppb, with the highest concentration in September exceeding 1880.00 ppb. The CH4 concentrations in the United States and the European Union were between 1860.00 ppb and 1900.00 ppb. In China, the CH4 concentration was between 1860.00 ppb and 1900.00 ppb in all months except September, which was higher than 1900.00 ppb. India had the highest CH4 concentrations from October to December, which were 1927.00 ppb, 1929.00 ppb and 1919.00 ppb, respectively.
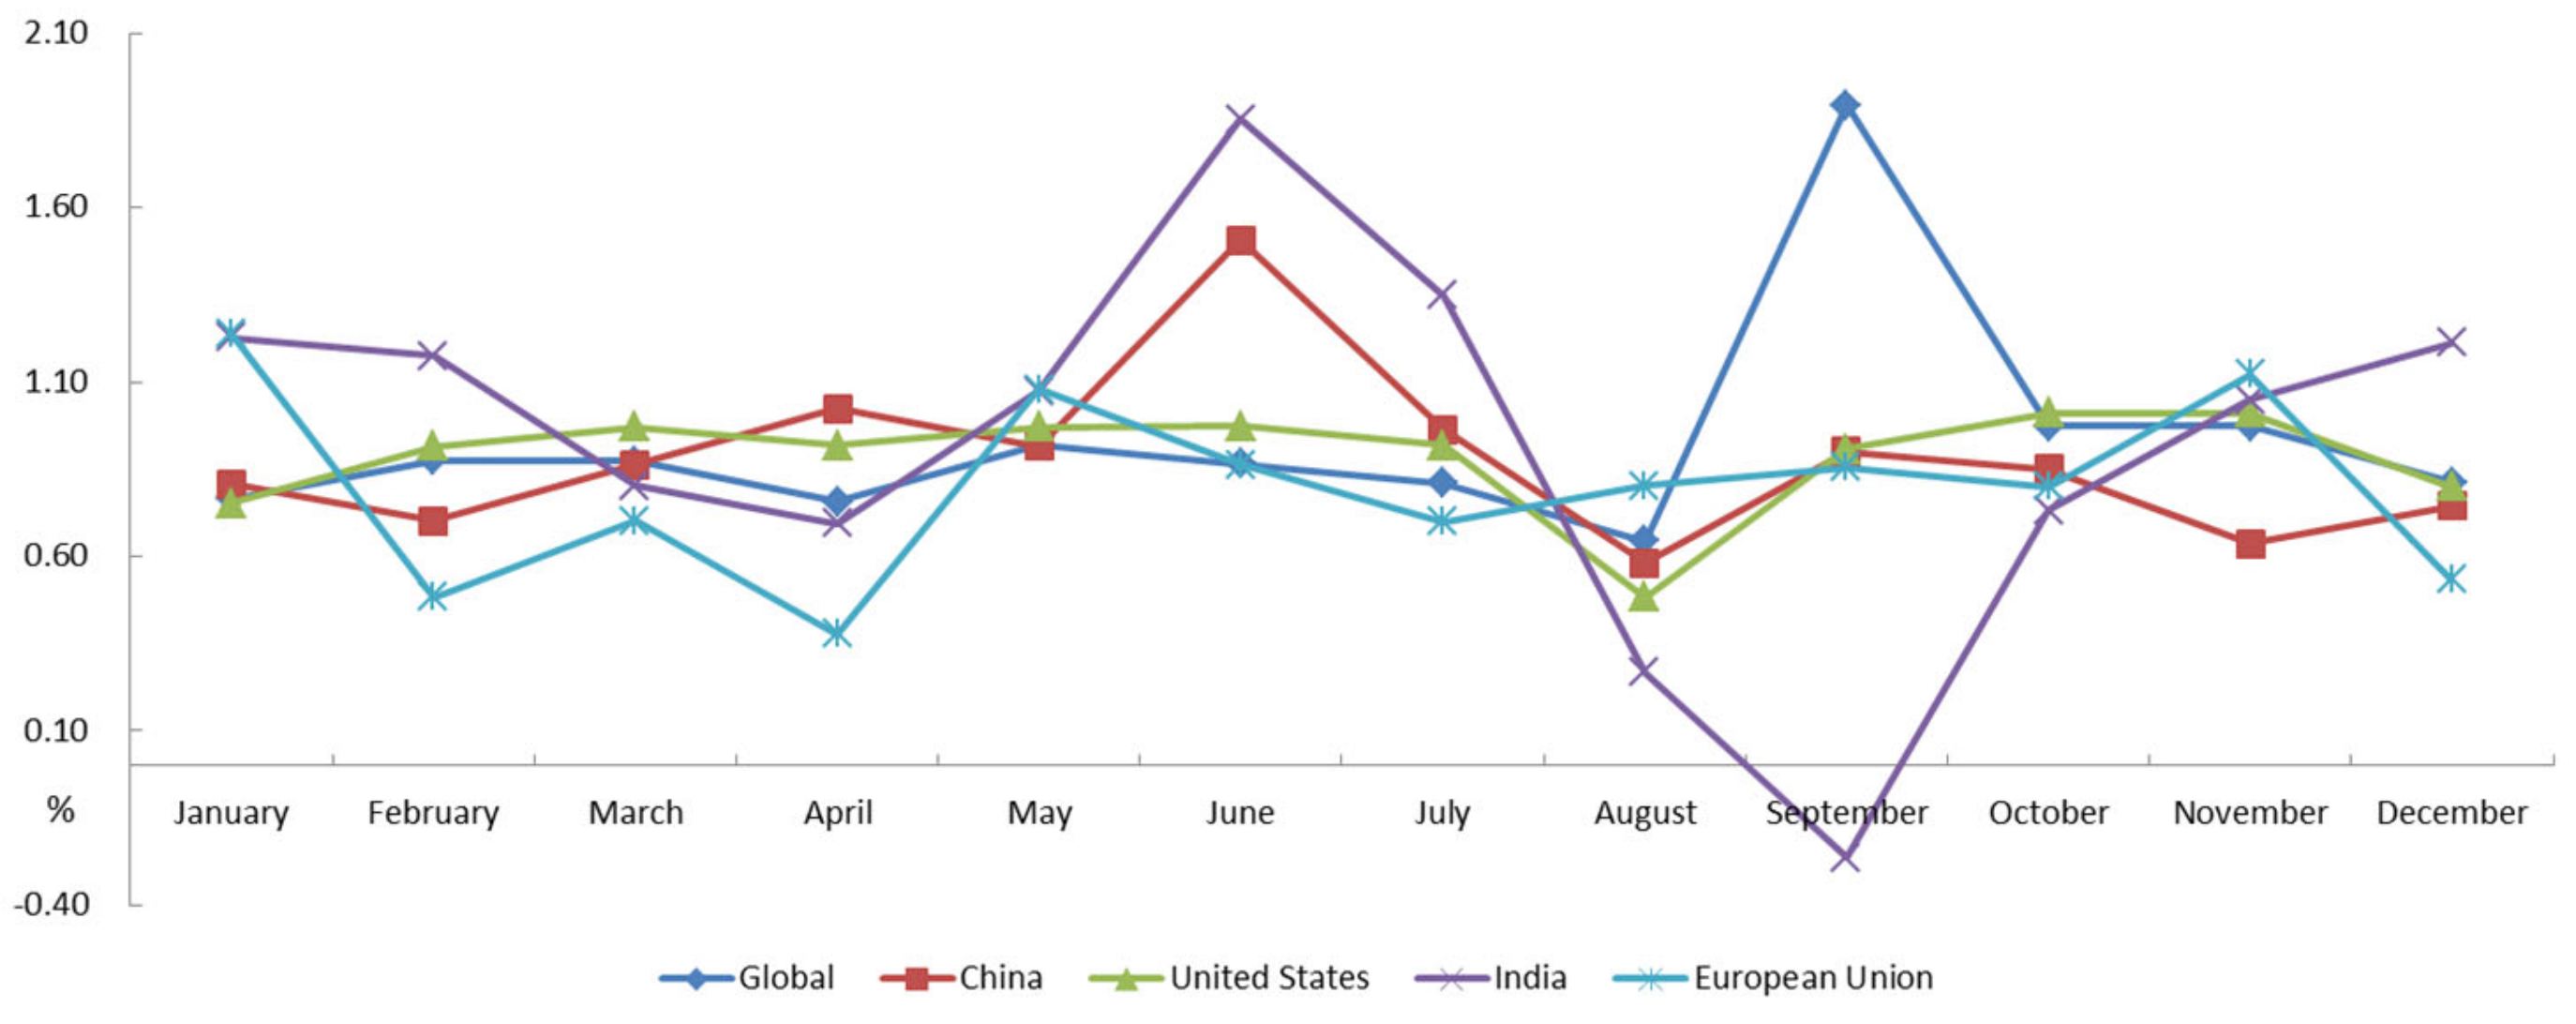
Compared with 2020 (Figure 8), except for India in September, the CH4 concentration in global land and other major countries/regions increased in 2021, and the monthly increase basically remained below 1.30%. However, China in June increased 1.51%, and India in June and July increased 1.85% and 1.35%, respectively. In addition, the global land in September increased 1.89%, a large year-on-year change.

4. Conclusions

In 2021, the annual average CO2 concentration over the global land area was 412.74 ppm, up 0.64% year on year. There were spatial differences in the distribution of CO2 concentrations. The annual average CO2 concentrations in China, India, the European Union, and the United States were 414.42 ppm, 413.53 ppm, 413.48 ppm, and 413.41 ppm, respectively, which were higher than those over global land. The reason for this may be the high consumption of fossil energy in major countries/regions. Compared with 2020, the CO2 concentration in China, the United States, India, and the European Union increased significantly. The annual average increase in the European Union was 2.71 ppm, which was higher than the global average increase (2.62 ppm). The increases in India, the United States, and China were all lower than the global average increase level, with increases of 0.59%, 0.61% and 0.63%, respectively. In 2020 and 2021, the trend of the global and major country/region quarterly average CO2 was the same, which was higher in the first and second quarters, significantly lower in the third quarter, and gradually increased in the fourth quarter. In 2020 and 2021, the monthly mean CO2 concentrations in China, the United States and the European Union peaked in April, and that in India peaked in May. However, the monthly average CO2 concentration in the four major countries/regions reached the lowest value in August. This may be due to factors such as winter heating in the Northern Hemisphere and seasonal variations in the carbon sink capacity of ecosystems.
In 2021, the annual average concentration of CH4 in the global land area was 1853.00 ppb, showing an overall upward trend, with a year-on-year increase of 0.87%. The high concentration areas were mainly concentrated in central Africa, South Asia, the Indochina Peninsula, eastern East Asia, the eastern United States and northwestern Brazil, among which India increased significantly, reaching 0.95%. The highest CH4 values in global land and China were concentrated in the third quarter, while those in the United States, India and the European Union were concentrated in the fourth quarter. China’s highest CH4 values in the second and third quarters (1881.00 ppb and 1903.00 ppb, respectively) were higher than those in the other three countries and regions. India’s first and fourth quarters (1895.00 ppb and 1926.00 ppb, respectively) were higher than those in the other three countries and regions. The CH4 concentration in China in September was the highest, which was 1907.00 ppb. The CH4 concentration in India from October to December was the highest, which was 1927.00 ppb, 1929.00 ppb and 1919.00 ppb, respectively. In addition, the CH4 concentration in China in June increased by 28.00 ppb. In India, the increase in June and July was 34.00 ppb and 25.00 ppb, respectively, showing significant year-on-year changes.

Author Contributions

All authors made great contributions to the work. Conceptualization, S.Z.; methodology, Z.W., Q.L. and S.Z.; formal analysis, L.Z. and W.Z.; resources, Z.W. and L.Z.; data curation, X.Y.; writing—original draft preparation, S.Z., L.Z.; writing—review and editing, Z.W. and Q.L. All authors have read and agreed to the published version of the manuscript.

Funding

This work was supported by the Major Projects of High-Resolution Earth Observation Systems of National Science and Technology (Grant No. 05-Y30B01-9001-19/20).

Institutional Review Board Statement

Not applicable.

Informed Consent Statement

Not applicable.

Data Availability Statement

Not applicable.

Acknowledgments

We thank the editors and anonymous reviewers for the insightful suggestions made during manuscript review process, and we also thank National Institute for Environmental Studies (NIES) for GOSAT data.

Conflicts of Interest

The authors declare no conflict of interest.

References

  1. World Meteorological Organization. State of the Global Climate 2021. WMO-No. 1290: 2022. Available online: https://public.wmo.int/en/our-mandate/climate/wmo-statement-state-of-global-climate (accessed on 9 October 2022).
  2. Boesch, H.; Baker, D.; Connor, B.; Crisp, D.; Miller, C. Global Characterization of CO2 Column Retrievals from Shortwave-Infrared Satellite Observations of the Orbiting Carbon Observatory-2 Mission. Remote Sens. 2011, 3, 270–304. [Google Scholar] [CrossRef] [Green Version]
  3. Hammerling, D.M.; Michalak, A.M.; Kawa, S.R. Mapping of CO2 at high spatiotemporal resolution using satellite observations: Global distributions from OCO-2. J. Geophys. Res. Earth Surf. 2012, 117, D06306. [Google Scholar] [CrossRef]
  4. Hammerling, D.M.; Michalak, A.M.; O’Dell, C.; Kawa, S.R. Global CO2 distributions over land from the Greenhouse Gases Observing Satellite (GOSAT). Geophys. Res. Lett. 2012, 39, L08804. [Google Scholar] [CrossRef] [Green Version]
  5. Yoshida, Y.; Kikuchi, N.; Morino, I.; Uchino, O.; Oshchepkov, S.; Bril, A.; Saeki, T.; Schutgens, N.; Toon, G.C.; Wunch, D.; et al. Improvement of the retrieval algorithm for GOSAT SWIR XCO2 and XCH4 and their validation using TCCON data. Atmos. Meas. Tech. 2015, 6, 1533–1547. [Google Scholar] [CrossRef]
  6. Wang, X.; Zhang, X.Y.; Zhang, L.Y.; Gao, L.; Tian, L. Interpreting seasonal changes of low-tropospheric CO2 over China based on SCIAMACHY observations during 2003–2011. Atmos. Environ. 2015, 103, 180–187. [Google Scholar]
  7. Yang, D.; Liu, Y.; Cai, Z.; Deng, J.; Wang, J.; Chen, X. An advanced carbon dioxide retrieval algorithm for satellite measurements and its application to GOSAT observations. Sci. Bull. 2015, 60, 2063–2066. [Google Scholar] [CrossRef] [Green Version]
  8. Yang, D.; Zhang, H.; Liu, Y.; Chen, B.; Cai, Z.; Lü, D. Monitoring carbon dioxide from space: Retrieval algorithm and flux inversion based on GOSAT data and using CarbonTracker-China. Adv. Atmos. Sci. 2017, 34, 965–976. [Google Scholar] [CrossRef]
  9. Kong, Y.; Chen, B.; Measho, S. Spatio-Temporal Consistency Evaluation of XCO2 Retrievals from GOSAT and OCO-2 Based on TCCON and Model Data for Joint Utilization in Carbon Cycle Research. Atmosphere 2019, 10, 354. [Google Scholar] [CrossRef] [Green Version]
  10. Seyed, M.M.; Naghmeh, M.D.; Saeed, A.; Oliver, S. Analyzing spatiotemporal patterns in atmospheric carbon dioxide con-centration across Iran from 2003 to 2020. Atmos. Environ. 2022, 14, 100–163. [Google Scholar]
  11. Butz, A.; Galli, A.; Hasekamp, O.; Landgraf, J.; Tol, P.; Aben, I. TROPOMI aboard Sentinel-5 Precursor: Prospective performance of CH4 retrievals for aerosol and cirrus loaded atmospheres. Remote Sens. Environ. 2012, 120, 267–276. [Google Scholar] [CrossRef]
  12. Prasad, P.; Rastogi, S.; Singh, R. Study of satellite retrieved CO2 and CH4 concentration over India. Adv. Space Res. 2014, 54, 1933–1940. [Google Scholar] [CrossRef]
  13. Hakkarainen, J.; Ialongo, I.; Tamminen, J. Direct space-based observations of anthropogenic CO2 emission areas from OCO-2. Geophys. Res. Lett. 2016, 43, 11–400. [Google Scholar] [CrossRef]
  14. Crowell, S.; Baker, D.; Schuh, A.; Basu, S.; Jacobson, A.R.; Chevallier, F.; Liu, J.; Deng, F.; Feng, L.; McKain, K.; et al. The 2015–2016 carbon cycle as seen from OCO-2 and the global in situ network. Atmos. Chem. Phys. 2019, 19, 9797–9831. [Google Scholar] [CrossRef] [Green Version]
  15. Buchwitz, M.; Reuter, M.; Schneising, O.; Hewson, W.; Detmers, R.; Boesch, H.; Hasekamp, O.; Aben, I.; Bovensmann, H.; Burrows, J.; et al. Global satellite observations of column-averaged carbon dioxide and methane: The GHG-CCI XCO2 and XCH4 CRDP3 data set. Remote Sens. Environ. 2017, 203, 276–295. [Google Scholar] [CrossRef] [Green Version]
  16. Uspensky, A.B.; Kukharsky, A.V.; Romanov, S.V.; Rublev, A.N. Monitoring the carbon dioxide mixing ratio in the troposphere and the methane total column over Siberia according to the data of the AIRS and IASI IR sounders. Izv. Atmos. Ocean. Phys. 2011, 47, 1097–1103. [Google Scholar] [CrossRef]
  17. Parker, R.; Boesch, H.; McNorton, J.; Comyn-Platt, E.; Gloor, M.; Wilson, C.; Chipperfield, M.P.; Hayman, G.D.; Bloom, A.A. Evaluating year-to-year anomalies in tropical wetland methane emissions using satellite CH4 observations. Remote Sens. Environ. 2018, 211, 261–275. [Google Scholar] [CrossRef]
  18. Nyasulu, M.; Haque, M.; Kumar, K.R.; Banda, N.; Ayugi, B.; Uddin, J. Temporal patterns of remote-sensed tropospheric carbon dioxide and methane over an urban site in Malawi, Southeast Africa: Implications for climate effects. Atmos. Pollut. Res. 2021, 12, 125–135. [Google Scholar] [CrossRef]
  19. Adiya, S.; Dalantai, S.; Wu, T.; Wu, X.; Yamkhin, J.; Bao, Y.; Sumiya, E.; Yadamsuren, G.; Avirmed, D.; Dorjgotov, B. Spatial and temporal change patterns of near-surface CO2 and CH4 concentrations in different permafrost regions on the Mongolian Plateau from 2010 to 2017. Sci. Total Environ. 2021, 800, 149–433. [Google Scholar] [CrossRef] [PubMed]
  20. British Petroleum. BP’s Statistical Review of World Energy 2020. 2021.07.08. Available online: https://www.bp.com.cn/content/dam/bp/country-sites/zh_cn/china/home/reports/statistical-review-of-world-energy/2021/BP_Stats_2021.pdf (accessed on 3 March 2022).
Figure 1. Map of global annual average CO2 concentrations in 2020 and 2021.
Atmosphere 13 01814 g001
Figure 2. CO2 concentration trends of global land and major countries/regions in 2020 and 2021.
Atmosphere 13 01814 g002
Figure 3. Monthly changes in CO2 concentrations for global land and major countries/regions from 2021 to 2020.
Atmosphere 13 01814 g003
Figure 4. Global land and major country monthly trends of CO2 concentrations in 2020 and 2021.
Atmosphere 13 01814 g004
Figure 5. Map of global annual CH4 concentrations in 2020 and 2021.
Atmosphere 13 01814 g005
Figure 6. Trends of global CH4 concentrations and major countries/regions in 2020 and 2021.
Atmosphere 13 01814 g006
Figure 7. Monthly average CH4 concentrations for global land and major countries/regions in 2021.
Atmosphere 13 01814 g007
Figure 8. Monthly changes in CH4 concentrations for global land and major countries/regions in 2021.
Atmosphere 13 01814 g008
Table 1. Annual CO2 concentrations and rates for global land and major countries/regions in 2020 and 2021.
Major RegionsCO2Variation 1
(ppm)
Variation Rate 2
(%)
20202021 3
China411.91414.422.510.61
India411.13413.532.410.59
EU 4410.77413.482.710.66
USA410.84413.412.520.63
Global Land410.13412.742.620.64
Note: 1: Change = annual CO2 concentration in 2021—CO2 concentration in 2020. 2: Changing rate = (annual CO2 concentration in 2021—CO2 concentration in 2020)/CO2 concentration in 2020 *100. 3: In order of 2021 concentration from high to low. 4: According to the EU website: EU member states now include France, Germany, Italy, Austria, Belgium, the Netherlands, Sweden, Spain, Portugal, Finland, Denmark, Greece, Ireland, Poland, Hungary, the Czech Republic, Slovakia, Lithuania, Romania, Croatia, Bulgaria, Latvia, Estonia, Slovenia, Cyprus, Luxembourg, and Cyprus (27 countries).
Table 2. Annual CH4 concentrations and changing rates for global land and major countries/regions in 2020 and 2021.
Major RegionsCH4Variation 1
(ppb)
Variation Rate 2
(%)
20202021 3
China1886.00 1904.00 18.00 0.95
India1872.00 1888.00 16.00 0.85
EU 41862.00 1877.00 15.00 0.80
USA1860.00 1876.00 16.00 0.86
Global Land1837.00 1853.00 16.00 0.87
Note: 1: Change = annual CH4 concentration in 2021—CH4 concentration in 2020. 2: Changing rate = (annual CH4 concentration in 2021—CH4 concentration in 2020)/CH4 concentration in 2020 *100. 3: In order of 2021 concentration from high to low. 4: According to the EU website: EU member states now include France, Germany, Italy, Austria, Belgium, the Netherlands, Sweden, Spain, Portugal, Finland, Denmark, Greece, Ireland, Poland, Hungary, the Czech Republic, Slovakia, Lithuania, Romania, Croatia, Bulgaria, Latvia, Estonia, Slovenia, Cyprus, Luxembourg, and Cyprus (27 countries).
Publisher’s Note: MDPI stays neutral with regard to jurisdictional claims in published maps and institutional affiliations.