Article

Real-Time PM2.5 Monitoring in a Diesel Generator Workshop Using Low-Cost Sensors

1
School of Safety Engineering, China University of Mining and Technology, Xuzhou 221116, China
2
Xuzhou Engineering Research Center for Occupational Dust Control and Environmental Protection, Xuzhou 221116, China
3
Institute of Occupational Health, China University of Mining and Technology, Xuzhou 221116, China
*
Author to whom correspondence should be addressed.
Atmosphere 2022, 13(11), 1766; https://doi.org/10.3390/atmos13111766
Submission received: 29 September 2022 / Revised: 13 October 2022 / Accepted: 20 October 2022 / Published: 26 October 2022
(This article belongs to the Special Issue Control and Purification of Particulate Matter)

Abstract

:
Particulates from diesel generator operation are a known air pollutant with adverse health effects. In this study, we used low-cost particulate matter (PM) sensors to monitor PM2.5 in a diesel generator plant. We compared the measurement results from a PM sensor and a reference instrument (DustTrak), and we found a high correlation between them. The data overestimation or underestimation of PM sensors implied the need for data calibration. Hence, we proposed a data calibration algorithm based on a nonlinear support vector machines(SVM )model, and we investigated the effect of three calibration factors on the model: humidity, temperature, and total volatile organic compounds (TVOC). It was found that the TVOC correction coefficient has great influence on the model, which should be considered when calibrating the low-cost PM sensor in diesel generator operation sites. A monitoring network with six low-cost sensors was installed in the diesel generator plant to monitor PM2.5 concentration. It was found that normal diesel generator work, diesel generator set handling work, and human activity are the most dominant ways of producing particulate matter at the site, and dispersion is the main cause of increased PM2.5 concentrations in nonworking areas. In this study, PM2.5 emissions from two different diesel generators were tested, and PM2.5 concentrations at monitoring points reached 220 μg/m3 and 120 μg/m3, respectively. This further confirms that diesel generators produce many respirable particles when working.

1. Introduction

In recent years, due to the shortage of electricity, an unstable supply of electricity, the growth of field power supply, and the demand for emergency power supply, the number of self-provided generator sets using gasoline, diesel, or kerosene as the power supply energy has increased significantly, especially in urban areas where demand is greater [1,2,3]. At present, there exist mainly diesel generator sets, gasoline generator sets, and heavy oil generator sets. Among them, diesel gensets have the characteristics of larger capacity, parallel operation, independent operation, a lack of parallel operation with the regional power grid, not being affected by power grid failure, and high reliability. Moreover, diesel engines are more economical for generating electricity than other equipment in their size range, so diesel gensets occupy an important position in gensets [4,5]. Diesel engines, as the core components of diesel generator sets, produce a large amount of respirable particulate matter and nitrogen oxide emissions during the working process, and these pollutants have a profound impact on human respiratory health. Studies have shown that the mass and the number of particles emitted by diesel engines are much greater than those emitted by gasoline engines [6,7,8]. Similarly, there are a large amount of epidemiological studies that show that asthma [9], lung dysfunction [10,11], lung cancer [12], and other related diseases [13] have a relationship with increased particulate matter exposure. Diesel generator sets require lower emission standards, and higher levels of harmful substances in exhaust emissions, than diesel engines [14,15,16]. Workers in diesel generator plants are exposed to air pollutants generated by the operation of diesel generator sets for a long time, and the presence of high concentrations of fine particulate matter, as well as volatile organic compounds, can have certain effects on the health of workers. However, there are still few studies on the monitoring of particulate matter in diesel generator plants.
In recent years, low-cost sensor technology for monitoring air pollutants, including PM2.5, has made rapid progress [17], thus providing a powerful tool for collecting high temporal resolution environmental monitoring data [18,19]. Low-cost sensors are typically based on optical methods, and they offer advantages over traditional air pollutant measurement devices in terms of affordability, ease of operation, simple maintenance, low cost, low noise, and high temporal resolution [20]. Low-cost sensors are more suitable for applications that monitor environmental quality within workplaces. Masri [21] used low-cost sensors to measure PM2.5 concentrations during factory operating hours. Frederickson [22] used low-cost air pollution sensors to record drivers’ exposure to air pollution in central London. Ruiter [23] explored evaluation variables for low-cost particulate matter monitors to assess occupational exposure. However, Borghi’s study [24] showed that as the PM2.5 concentration increases, the monitoring bias of the low-cost sensors increases. Therefore, pre-calibration of the low-cost sensors is necessary to ensure the quality of data recorded by the low-cost sensors. Algorithms for calibrating low-cost sensors are developing rapidly [25,26,27,28]. Previous studies have mostly used multiple linear regression models for data calibration, which assume a linear relationship between low-cost sensor readings and their impact factors; but Liu’s study [29] suggested that more sophisticated methods should be used to predict the complex nonlinear relationship between the two. There is little research on the calibration model of low-cost sensors in diesel power plants with a high particulate matter concentration and high TVOC content.
In this study, we proposed a data calibration algorithm to improve the performance of low-cost sensors by using a nonlinear support vector machines (SVM) algorithm [30] to calibrate low-cost sensors. Some effects of three calibration factors, including humidity, temperature, and TVOC on the model, were also investigated. Then, the calibrated low-cost sensors were used to set up a monitoring network in the diesel generator plant so as to monitor the variation of PM2.5 concentrations in real time.

2. Materials and Methods

2.1. Selection of Diesel Generator Plant

A diesel power plant rental company was selected as the site for this study. The site can be divided into a diesel generator storage area, a diesel generator test area, a maintenance shop, an office, and a personnel activity area. There are about 20 diesel generators in the factory, most of which are located in the storage area and the test area. There are two ventilation units (FAV600, UIQING, Chongqing, China) at the entrance and in the diesel generator testing area, but the ventilation units are turned off after working hours. The office has a ventilation window and is equipped with fresh air purifiers, while the office door is permanently closed and only opens when people pass through it. There is a rail-suspended crane in the factory to move the diesel generator equipment, mainly between the diesel generator storage area and the diesel generator test area. The personnel activity area provides a space for employees during their lunch break and after work in the afternoon. The maintenance shop was not in operation during the measurement period.

2.2. Selection of Low-Cost Sensors

In this study, we chose the PMSA003 low-cost sensor for PM2.5 concentration measurement. Han [31] used three low-cost PM sensors (Plantower PMSA003, Shinyei PPD42NS, and NOVA SDS011) to evaluate the performance of individual PM sensors. Han’s results showed that PMSA003 had the best fitting effect. Bulot [32] et al. evaluated four PM sensors: Alphasense OPC-N2, Plantower PMS5003, Plantower PMSA003, and Honeywell HPMA115S0. A comparison of these sensors with a nearby background station showed a correlation of 0.61 < R < 0.88. The sensors contain a built-in fan that draws PM2.5 from the surrounding environment into the light-sensing chamber. The sensor converts the light signal into particle concentration based on the proportional relation between the light signal and the mass of incoming particles. According to the manufacturer, this sensor can achieve a measurement of 0–999 μg/m3 particle concentration and maintain an accuracy of ±15%. We connected the sensor to the Arduino development board, recorded real-time data into the local memory chip, and uploaded the data to the experimental platform via WIFI to achieve real-time reading and recording of PM2.5 concentration.

2.3. Construction of Correction Test Platform

We performed side-by-side calibration tests on PM sensor units using reference equipment (DustTrak (Aerosol Monitor 8530, TSI, Shoreview, MN, USA)) near the gate in the diesel generator equipment rental. Six low-cost sensors were placed equidistantly around DustTrak, and the test unit was one meter off the ground. DustTrak was equipped with a PM2.5 impactor. We conducted an eight-hour PM2.5 concentration test using DustTrak and low-cost sensors, and the data collection interval was 30 s. Temperature and humidity sensors, and total volatile organic compounds (TVOC, BME680, BOSCH, Stuttgart, Germany) sensors, were placed near DustTrak. The BME680 sensor mainly detects compounds such as ethane, ethanol, acetone, and isoprene with an accuracy of 5% [33]. The temperature, humidity and TVOC levels at the test sites were recorded with a data acquisition interval of 30 s.

2.4. Construction of the Calibration Model

We built a low-cost PM sensor data correction method based on a nonlinear SVM algorithm, which has been applied to several fields with good stability and predictive power [34,35,36,37]. The SVM algorithm mainly mapped data to a high-dimensional feature space through a nonlinear mapping and performed predictive analysis in that space. Considering the accessibility of the predictors, temperature, humidity, and TVOC content were set as predictors. The independent variable and dependent variable were the PM2.5 concentration values measured by low-cost sensors and the DustTrak measurements, respectively. In this study, the data from the calibration unit were divided into a training set and a test set at ratios of 70% and 30%. The model was first trained on the training set data, and the test set was input into the trained model to calibrate PM2.5 concentration of the low-cost sensor and to compare the results with values measured by DustTrak.

2.5. Evaluation of the Calibration Model

This study evaluated the sensor by calculating the relative error, which is the ratio of difference between the readings recorded by PM sensors and the reference method during the same period. In this study, R2 and RMSE were chosen to evaluate the performance of the SVM model on the entire data set. The calculation equations are as follows.
relative   error   = P R R × 100 %
where P refers to the PM sensors measurements and R refers to the reference measurements.
R 2 = 1 i = 1 n ( f i f ^ i ) 2 i = 1 n ( f i f i ) 2
RMSE = i = 1 n f i f i ^ 2 n 1

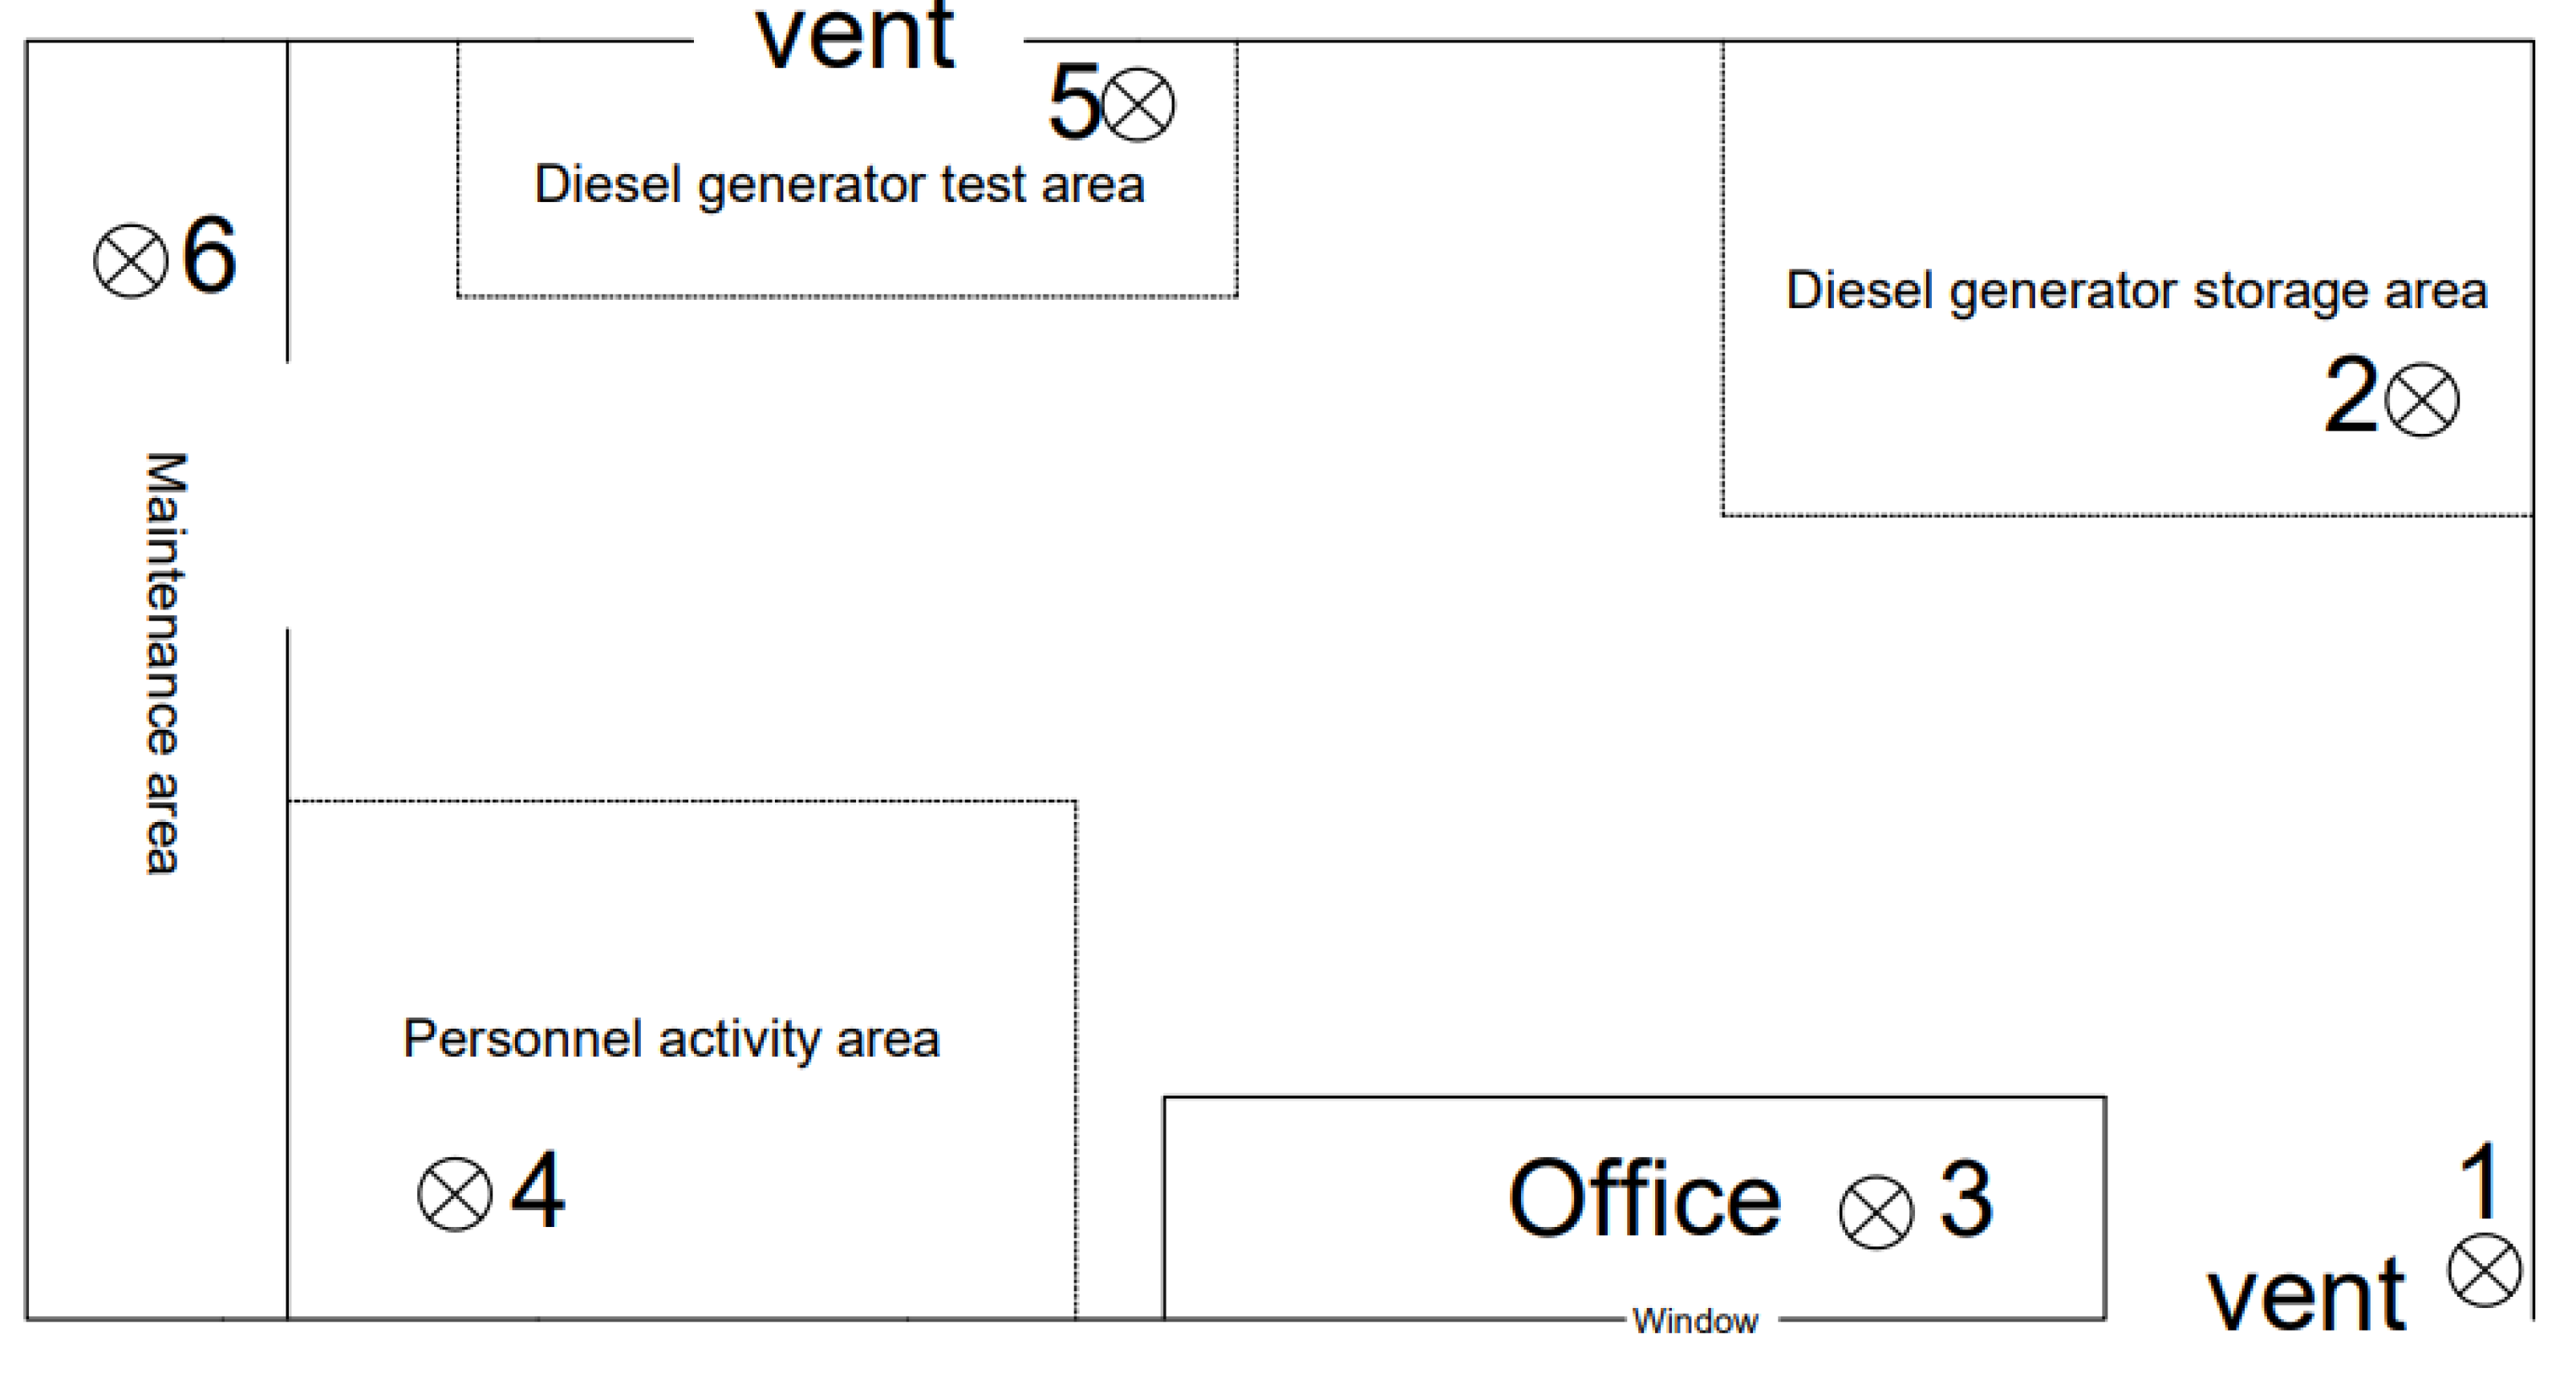
2.6. Plant Monitoring Locations

The calibrated low-cost PM2.5 sensors were placed in different areas of the plant, including the entrance, the diesel generator storage area, the office, the personnel activity area, the diesel generator testing area, and the maintenance area. The low-cost sensor in the diesel generator test area was placed at a distance of 0.5 m from the diesel generator exhaust port. At each monitoring point, the low-cost sensor was kept at a height of 1 m above the ground, and temperature and humidity sensors and TVOC sensors were also arranged in the monitoring points to measure the temperature, humidity, and TVOC content changes simultaneously.

3. Results

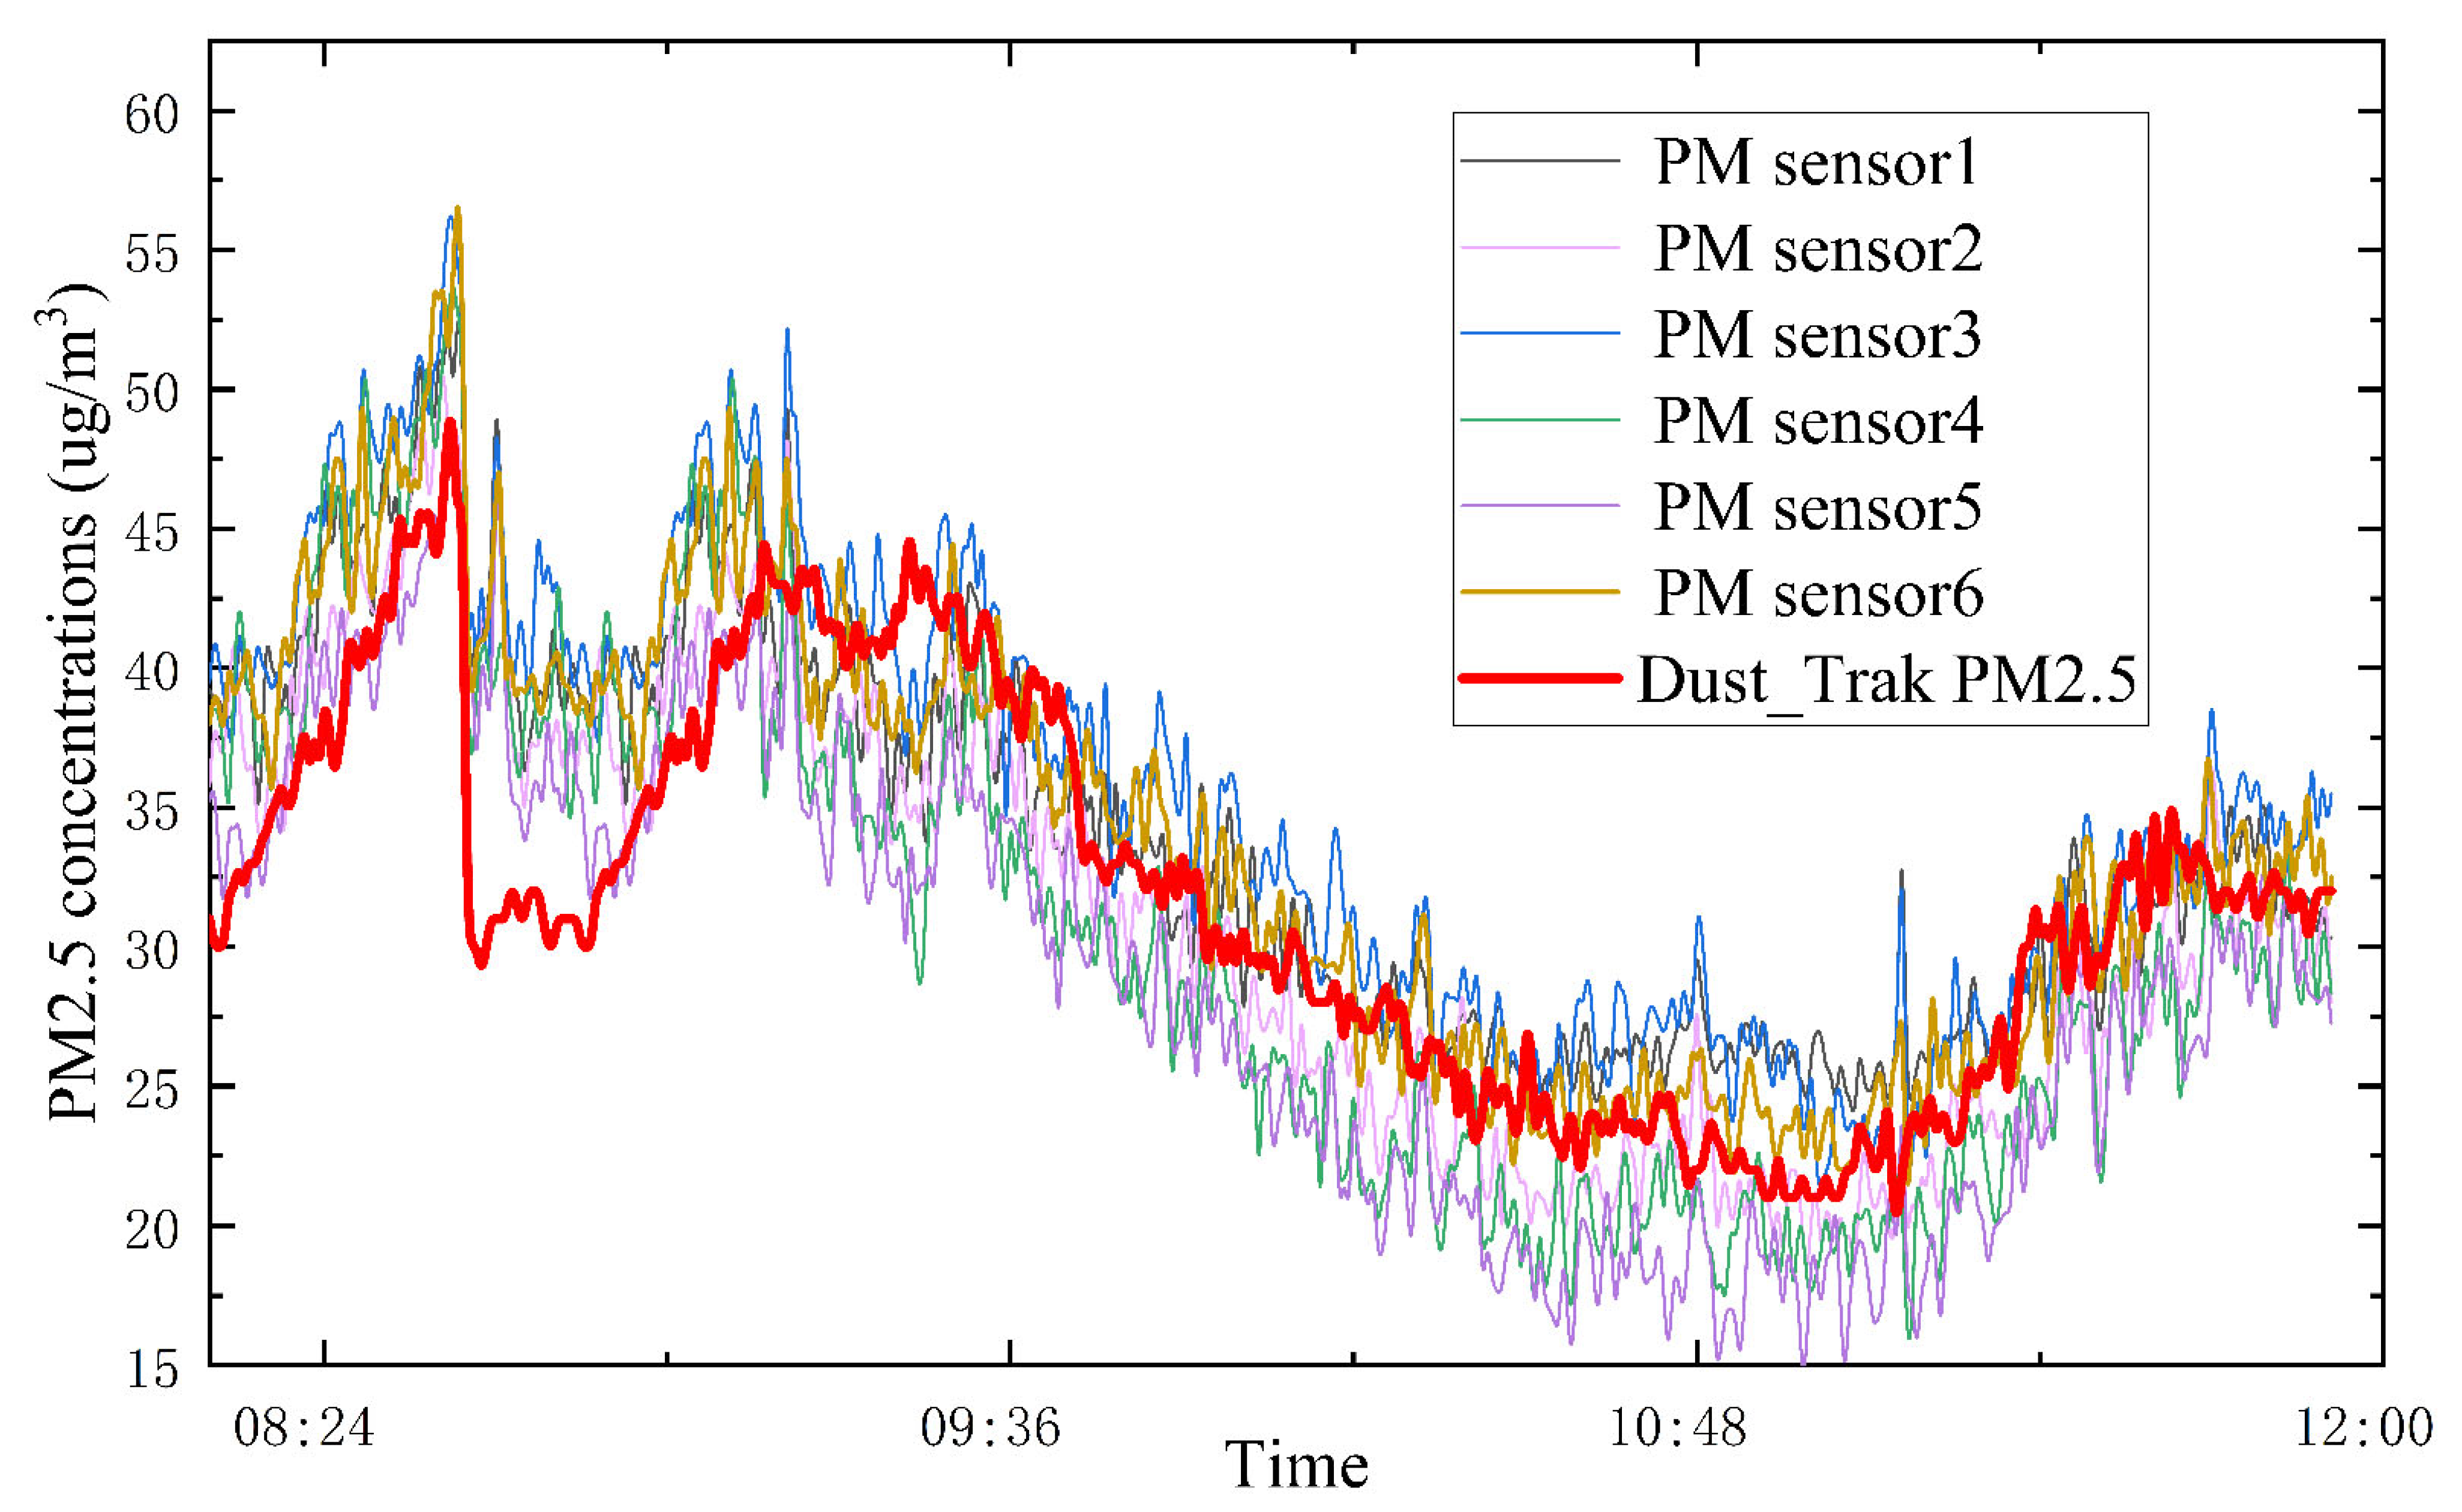
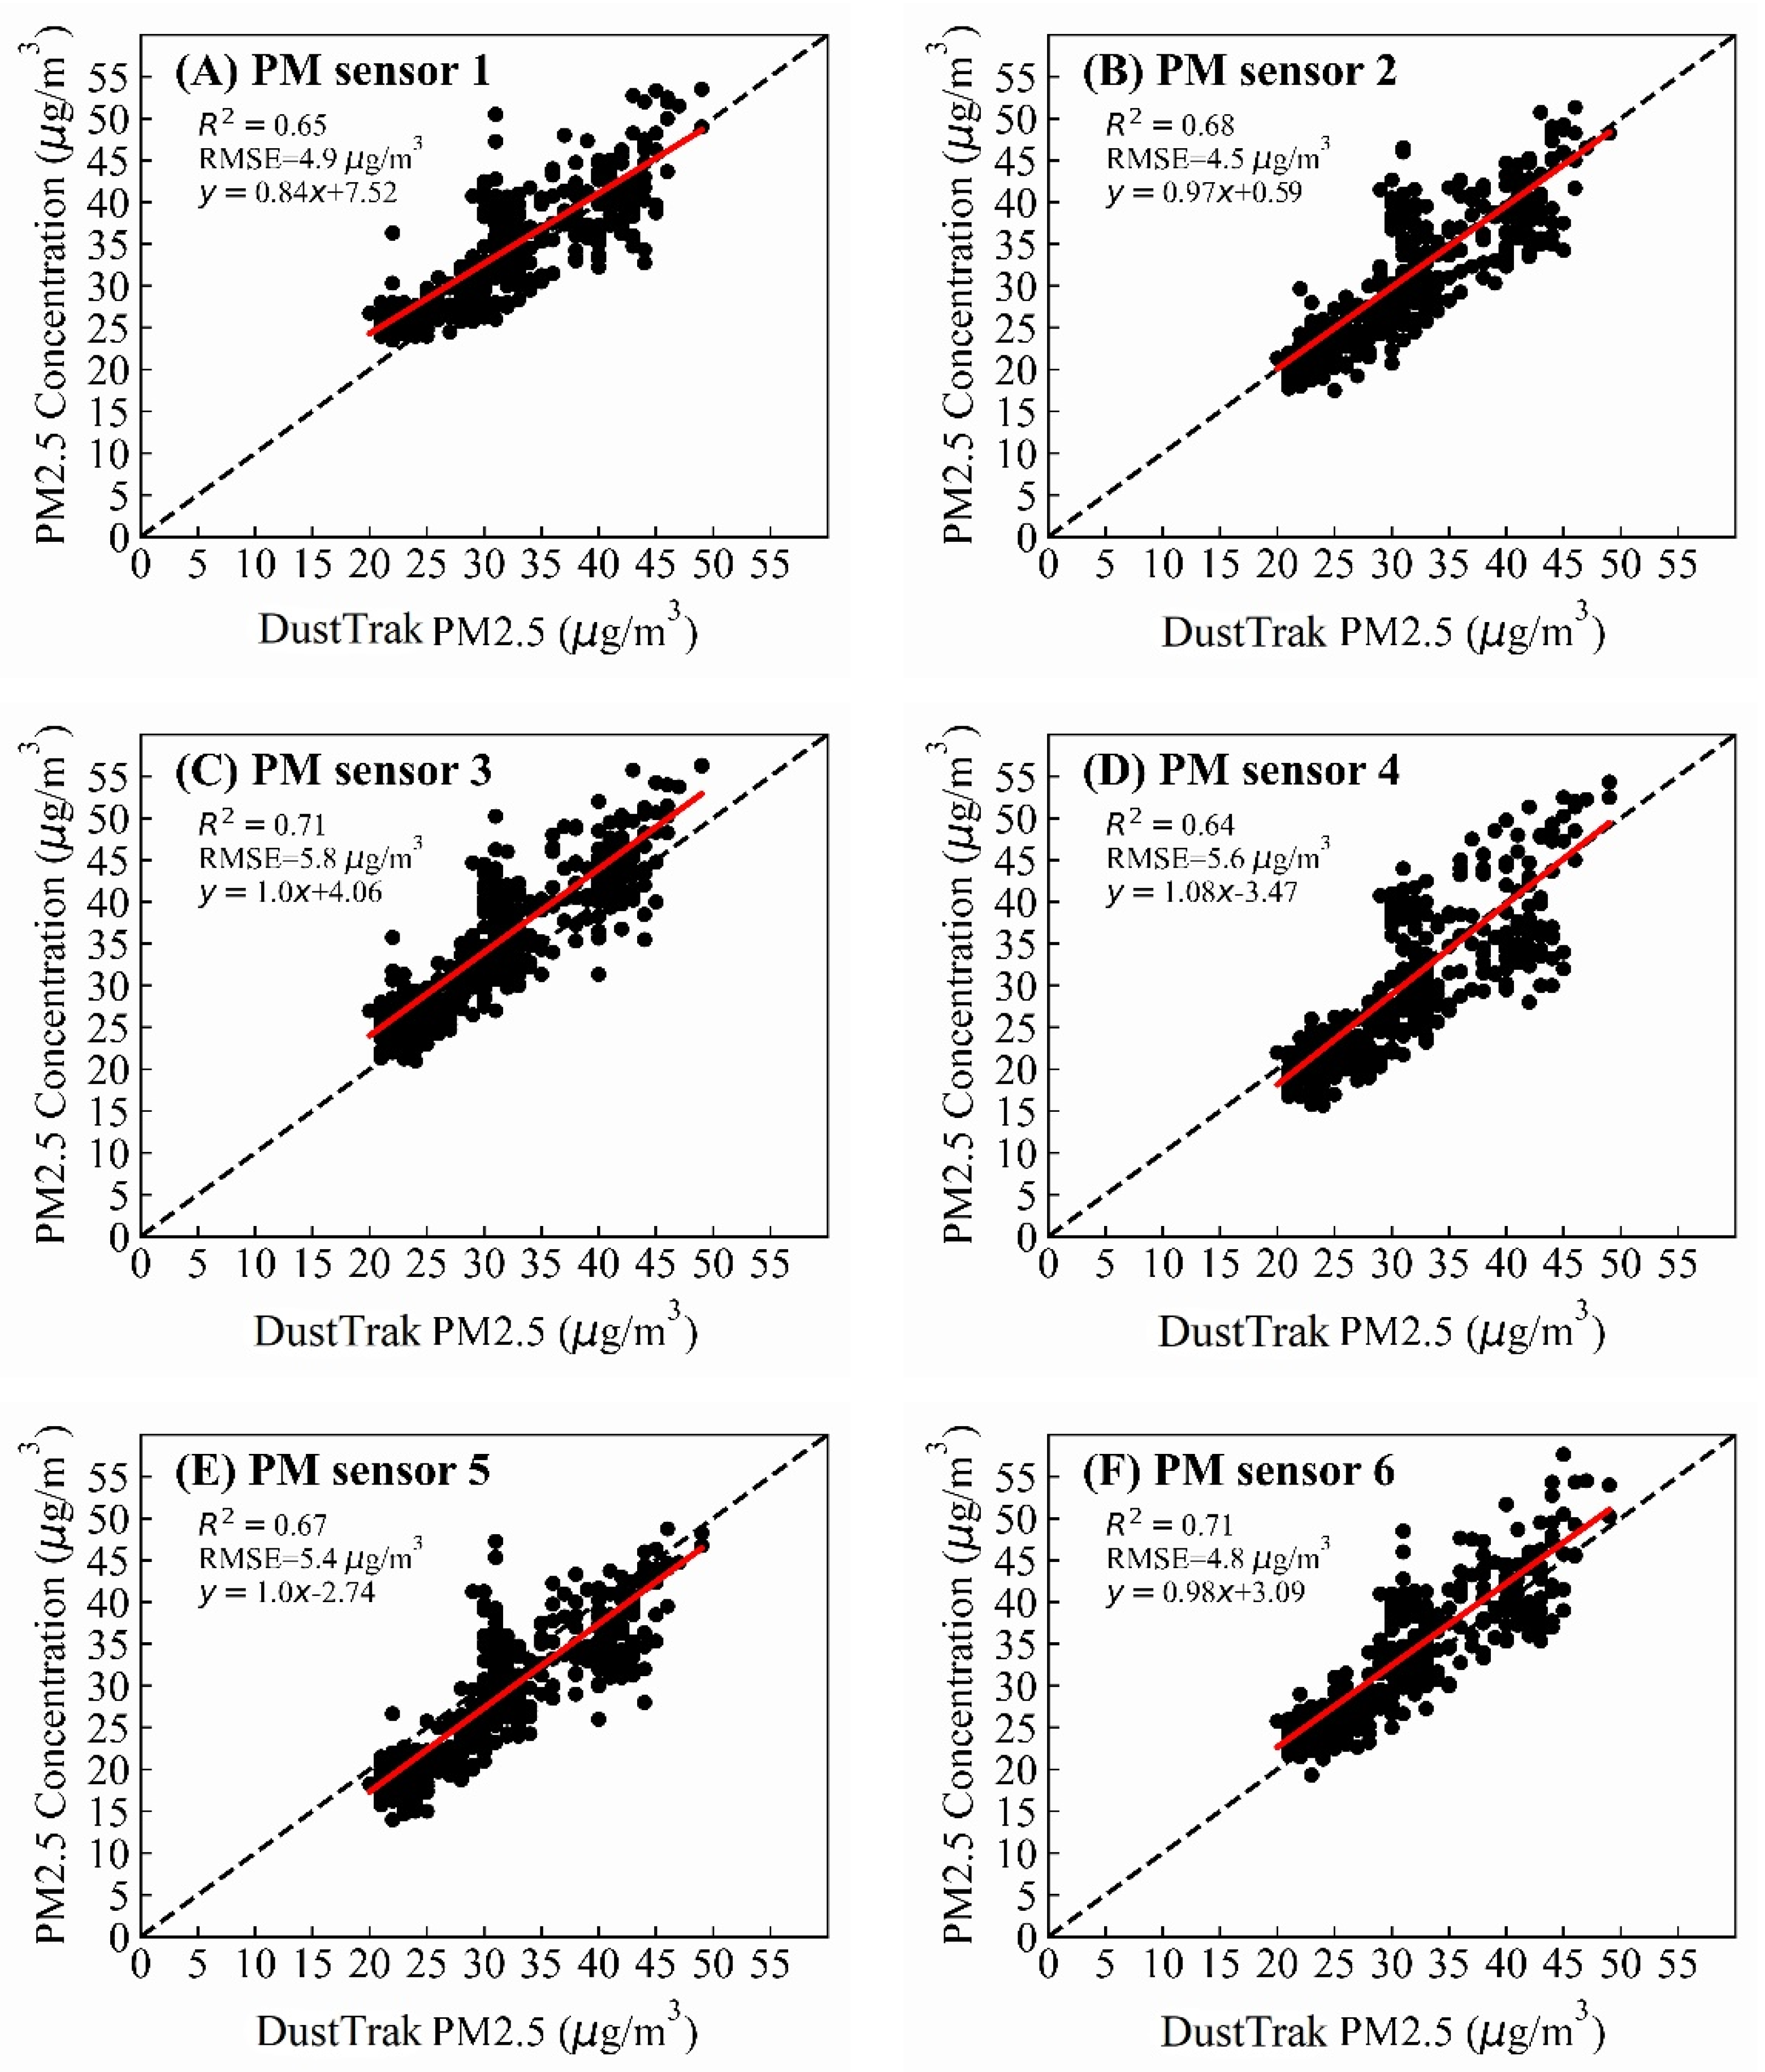
3.1. Comparison of PM Sensors and Reference Instruments

Figure 1 shows the measured values of PM2.5 concentration by the six low-cost sensors and the DustTrak in the calibration measurement experiment. From Figure 1, it can be seen that all six low-cost sensors have the same measurement trend as DustTrak. Table 1 shows the average PM2.5 concentration values, PM2.5 concentration range, and the average relative error between the different PM sensors and the reference instrument DustTrak in the calibration measurement experiment.
As shown in Table 1, the average PM2.5 concentration measured by the DustTrak in the calibration measurement experiment is 31.7 μg/m3, and the PM2.5 concentration range is 20–49 μg/m3. Among the six PM sensors, the PM sensor 2 is the closest to the data of the DustTrak, with an average relative error of only 11.18%. But the PM2.5 concentration range of PM sensor 2 is 18–51 μg/m3, which exceeds the PM2.5 concentration range of the DustTrak, indicating an overestimation or underestimation between the PM sensors and the reference instrument DustTrak. The average relative errors between the six PM sensors and the DustTrak are all kept within 15%, which are consistent with the errors claimed by the manufacturer; but the average relative errors of 3, 4 and 5 are all over 14%. The PM2.5 concentration range for PM sensor 3 is 21–56 μg/m3, which is higher than the DustTrak, indicating a more serious overestimation. Although these sensors are of the same brand, their PM2.5 measurement results may still show differences. Therefore, it is necessary to calibrate the PM sensors. To further quantify the discrepancies between the six PM sensors and the DustTrak, a comparison between the PM2.5 concentrations from the six low-cost sensors and the DustTrak were given in Figure 2.
From Figure 2, it can be seen that PM sensor 2 has the smallest RMSE value of 4.5 μg/m3, which also confirms that PM sensor 2 has the smallest mean relative error, as shown in Table 1. From Figure 2, we know that the data points of PM sensor 1 at low PM2.5 concentration all fall on the left side of the Y = X line, which implies data overestimation of PM sensor 1 at a low concentration. The R2 of PM sensor 3 is 0.71, which indicates that the data of PM sensor 3 have good convergence, but the trend line of PM sensor 3 is completely on the left side of the Y = X line, which shows that there is a serious data overestimation. The R2 of PM sensor 4 is only 0.64, and the data points fall on the right side of the Y = X line, which indicates that PM sensor 4 has a poor convergence and there is an underestimation of the data. PM sensor 5 has the same phenomenon as PM sensor 4, but the trend line of PM sensor 5 is on the right side of the Y = X line. From this, we know that PM sensor 5 has more serious data underestimation in the calibration measurement experiment. The data points of PM sensor 6 fall on the left side of the Y = X line, which shows that PM sensor 6 has a data overestimation problem.

3.2. PM Sensor Data Calibration

We developed a data correction method based on a nonlinear SVM model. Seventy percent of the PM sensor data, temperature, humidity, TVOC, and DustTrak data in the dataset were used as the training set, and were inputted into the SVM model for training. The remaining 30% of the data were inputted into the already-trained model for data calibration. To further quantify the effect of different calibration factors on data correction, this study added a regression model to the trained SVM model using the PM2.5 data measured by the DustTrak as the Y-value and the PM sensor data as the X-axis. The RH correction factor was added to the basic model for the second regression. The temperature correction factor was added to the second regression model for the third regression. The TVOC correction factor was added to the third regression model for the final regression test. Adjusted R2 was used to indicate the degree of fit of different models. The results of the models with different correction factors for PM sensor 1 are shown in Table 2.
As shown in Table 2, when no correction factor is added, the R2 of the base calibration model for PM sensor 1 is 0.65. When the humidity correction factor is added to the base calibration model, the R2 of the regression model is 0.67, which shows a 3.1% increase compared to the base model. When the temperature correction factor is added to the quadratic regression model, the adjusted R2 of the model grows to 0.72, which is an increase of 7.5%. When TVOC is added to the model as a correction factor, the adjusted R2 of the model increases to 0.75, which is an increase of 4.1% when compared to the cubic regression model with temperature and humidity correction, and an increase of 15.4% when compared to the original base model. This indicates that temperature and TVOC have a large effect on the calibration model. The effect of TVOC on the calibration model is due to the presence of diesel generators at the measurement site. The operation of diesel generators is the dominant reason for dust production in this region, which will not only produce many fine particles, but will also exhaust a large number of TVOC. Therefore, TVOC should be considered when calibrating the low-cost PM sensor at the operation site of diesel generators.
Table 3 shows the performance of the calibration models for different PM sensor data. As shown in Table 3, the R2 of the data—corrected with the calibration model—is improved, and its increase is more than 12%. The largest increase in R2 is 15.4% for PM sensor 4 data. This indicates that the model possesses good results for different PM sensors.

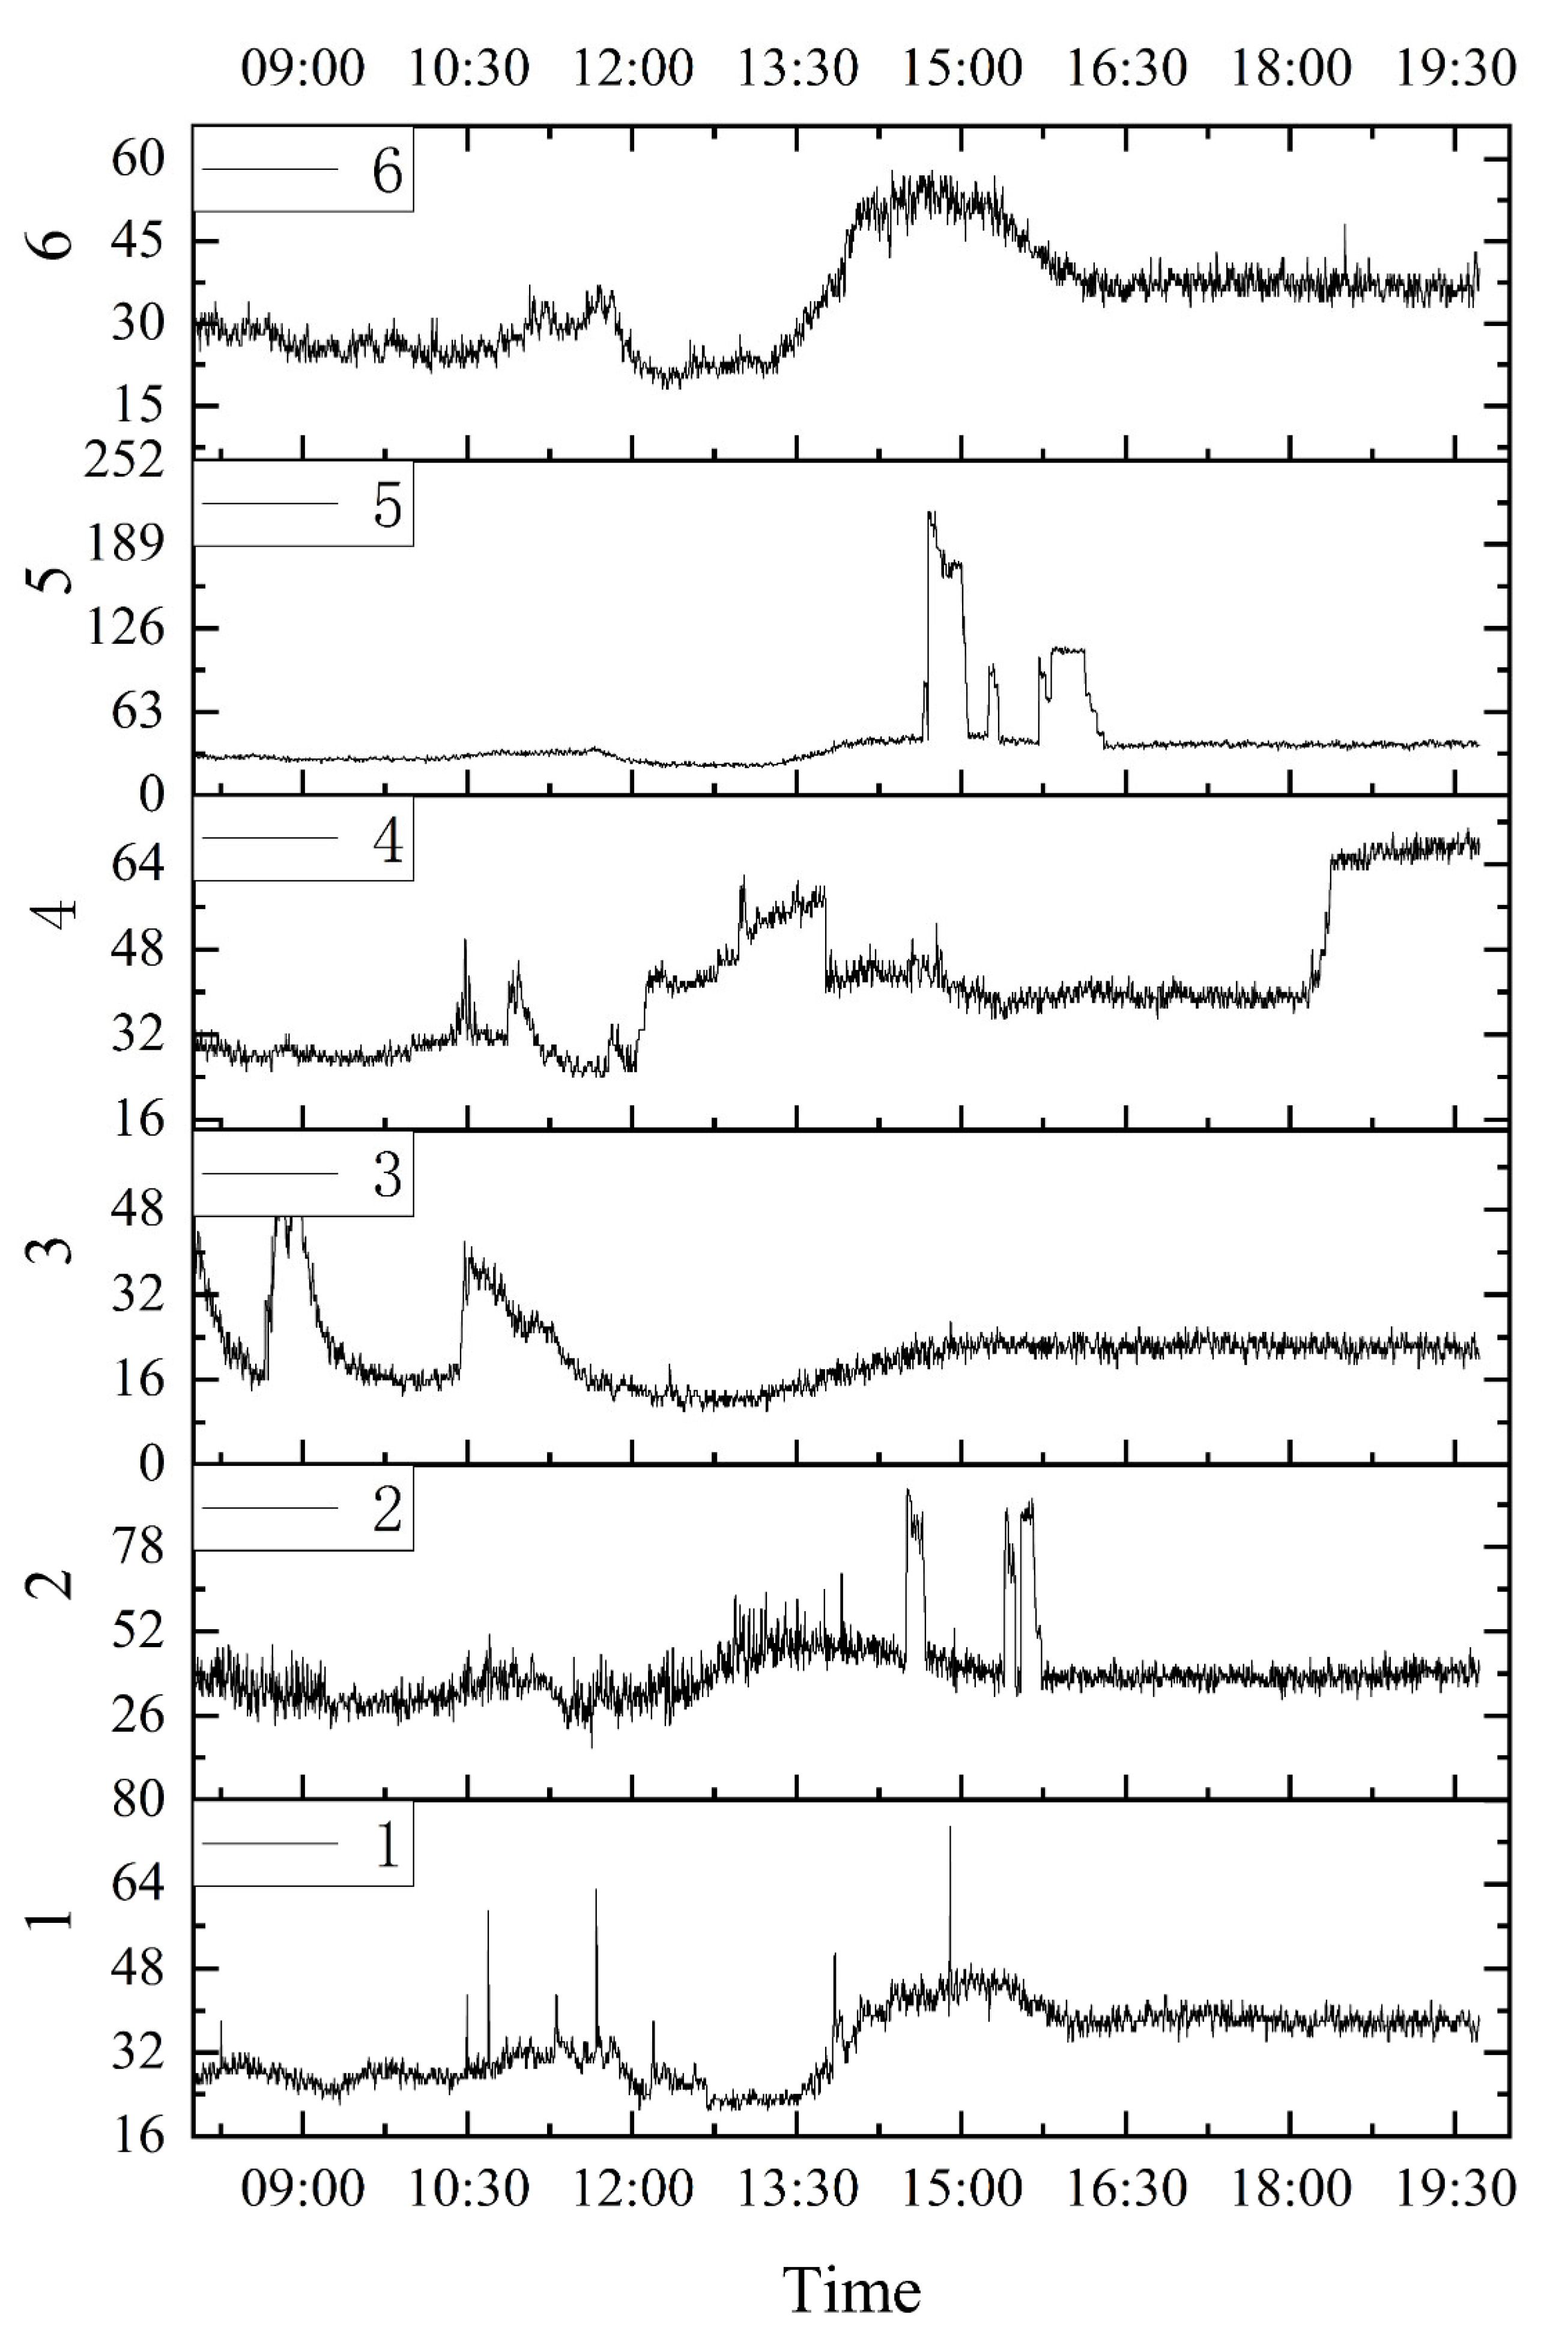
3.3. Diesel Generator Plant PM2.5 Measurement

According to the division of the internal space of the diesel generator set, six different areas were selected, and a calibrated PM sensor was placed in each area to measure the concentration of PM2.5. The positions of each measurement point are shown in Figure 3.
As shown in Figure 3, six monitoring points were arranged at the entrance, the diesel generator storage area, the office, the personnel activity area, the diesel generator testing area, and the maintenance area. The PM2.5 concentrations in the six areas were monitored from 8:00 to 20:00, and the recorded data were uploaded to the experimental platform every 30 s. The monitoring points were 1 m above the ground and placed on the experimental platform without contact with other objects. Among them, the PM sensor in the diesel generator testing area was kept at a distance of 0.5 m away from the diesel generator exhaust port during the diesel generator test. The diesel generator emission test experiments were conducted twice at 14:30 and 15:30, and the total length of each emission test experiment was about 30 min, which is basically consistent with the daily diesel generator test frequency and time of the company. The data of six monitoring points are shown in Figure 4.
As shown in Figure 4, PM2.5 concentration at monitoring point 1 was low during the period between 8:00 and 9:00. The PM2.5 concentration is 25–32 μg/m3. It is because monitoring point 1 was located at the entrance with ventilation equipment, which improved the ventilation condition of monitoring point 1. The concentration fluctuates slightly, and the overall change is not significant. This is because during this time, people’s activities were rare and scattered, and the ventilation conditions were also considerable. During this period, monitoring points 2, 4 and 6 maintained the same trend as monitoring point 1, and the overall trend tended to be flat. However, the ventilation conditions at monitoring points 2, 4 and 6 were not as good as those at monitoring point 1, which led to slightly higher PM2.5 monitoring concentrations at monitoring points 2, 4 and 6. PM2.5 concentrations at monitoring point 1 increased between 10:30 and 12:00 due to increased human activities. During this period, PM2.5 monitoring concentrations were elevated at monitoring sites 2, 4 and 6. Among them, the diesel generator storage area had the least personnel activity, so the PM2.5 monitoring concentration at monitoring point 2 has the least significant increase. Monitoring point 4 had two small peaks during this time. This is because the personnel activities were relatively concentrated in the personnel activity area, and the activities were less prevalent in the rest of monitoring area, which further confirms the positive correlation between personnel activity and PM2.5 monitoring concentration. In indoor areas without major dust producing points, human activity can be an important factor in PM2.5 increase. A steep decrease in PM2.5 monitoring concentrations occurred at monitoring point 4 at around 13:30, which was due to the operation of ventilation equipment at the diesel generator test area. This proves that good ventilation conditions can reduce the PM2.5 monitoring concentrations with clean outdoor ambient air. High PM2.5 concentrations were observed at monitoring point 2 during the diesel generator test period because the lifting of diesel generators, using a rail-suspended crane, would re-release deposited particles accumulated by equipment into the air.
In this study, the release of particles from two different models of diesel generators was investigated. The first one is the L25M, which was made to operate at a standard speed of 2200 r/min without load. The data from the monitoring point showed that, although the ventilation equipment was used, the PM2.5 concentration reached 220 μg/m3 when the diesel generator started, and then gradually stabilized at around 177 μg/m3. The second small diesel generator equipment is the T31L. The PM2.5 monitoring concentration was about 120 μg/m3 when it was operated at the standard speed of 1200 r/min without load. During the experiment, it was found that the concentration of monitoring points 1 and 6 increased, which indicates that indoor diffusion is also the main factor in PM2.5 concentration increase. After 18:00, the concentration in monitoring point 4 increased due to the personnel activities and the closure of ventilation equipment after work. Monitoring area 3 is an isolated area and there is a fresh air purifier in the room, which makes the PM2.5 concentration in monitoring point 3 lower, and the increase in dust concentration in this area is mainly caused by personnel activities.

4. Discussion

In this study, the performance of the low-cost PM sensor was evaluated. We compared the PM sensor measurement results with the data of the reference device DustTrak and found a good correlation between them. But the data overestimation and underestimation problems of the PM sensors also appeared in the comparisons, which confirms the importance of data calibration for low-cost sensors. In this study, we proposed a PM sensor reading calibration method based on a SVM algorithm, using temperature, humidity, and TVOC content as calibration factors, which can effectively improve the quality of PM sensor monitoring data. The R2 of the data, corrected with the calibration model, is improved, and the increase is more than 12%. Our study showed that after calibration, the R2 could be 0.75~0.81, the RMSE of the sensor could be lower than 4.9 μg/m3, and the relative error could be less than 15%. Meanwhile, it was found that the TVOC correction factor has a large influence on the model and should be considered when calibrating the low-cost PM sensor in the diesel generator workplace. Therefore, the TVOC sensor should be added when arranging the PM2.5 monitoring network in future scenes with high TVOC content. After calibration, the indoor PM2.5 concentration in the diesel generator plant was monitored using the PM sensors. The plant is well ventilated, and the PM2.5 concentration is around 30 μg/m3 when the diesel generator is not working. However, the PM2.5 concentration at each monitoring point in the plant increases when the diesel generator is started, which indicates that indoor diffusion is an important factor in the increase in PM2.5 concentration. The PM2.5 concentration peak at monitoring point 2 is caused by the working of the rail suspension crane. The increase in PM2.5 concentrations at monitoring point 4 indicates that human activity is a huge reason for the indoor PM2.5 enhancement. In this study, PM2.5 emissions from two different models of diesel generators were tested at monitoring point 5, and PM2.5 concentrations reached 220 μg/m3 and 120 μg/m3, respectively. This further confirms that diesel generators produce large amounts of respirable particles when operating, leading to air pollution in the workshop.

Author Contributions

Methodology, W.Z.; writing—original draft preparation, Z.F.; writing—review and editing, L.Z.; visualization, L.L. All authors have read and agreed to the published version of the manuscript.

Funding

This study is supported by the National Natural Science Foundation of China (Grant No. 52074274), the Fundamental Research Funds for the Central Universities (grant number 2021YCPY0107), and the Graduate Innovation Program of China University of Mining and Technology (grant number: 2022WLJCRCZL178).

Institutional Review Board Statement

Not applicable.

Informed Consent Statement

Not applicable.

Data Availability Statement

Not applicable.

Acknowledgments

The research site is provided by Ming Heng Jining Power Equipment Company Limited.

Conflicts of Interest

The authors declare no conflict of interest.

References

  1. Altun, S. Emissions from a diesel power generator fuelled with biodiesel and fossil diesel fuels. Energy Environ. 2015, 26, 563–571. [Google Scholar] [CrossRef]
  2. Kukharets, S.; Sukmaniuk, O.; Yarosh, Y.; Kovalchuk, V. Investigational study of environmental performance of power generator operating on generator GAS. In Proceedings of the 20th International Scientific Conference on Engineering for Rural Development, Jelgava, Latvia, 26–28 May 2021; pp. 444–450. [Google Scholar]
  3. Marqusee, J.; Ericson, S.; Jenket, D. Impact of emergency diesel generator reliability on microgrids and building-tied systems. Appl. Energy 2021, 285, 116437. [Google Scholar] [CrossRef]
  4. Marqusee, J.; Jenket, D., II. Reliability of emergency and standby diesel generators: Impact on energy resiliency solutions. Appl. Energy 2020, 268, 114918. [Google Scholar] [CrossRef]
  5. Xu, F.; Jia, S.; Han, X.; Yu, Y. Long Short Term Memory Based Status Prediction for Diesel Generator Set. In Proceedings of the 2nd IEEE International Conference on Information Communication and Signal Processing (ICICSP), Weihai, China, 28–30 September 2019; pp. 425–429. [Google Scholar]
  6. Afrinaldi, F.; Zhang, H.-C.; Liu, Z.-C.; Hernandez, A. Loss and Benefit Caused by a Diesel Engine from the Perspective of Human Health. J. Ind. Ecol. 2017, 21, 116–126. [Google Scholar] [CrossRef]
  7. Han, L.J.; Jang, Y.-K. Increase of diesel car raises health risk in spite of recent development in engine technology. Environ. Health Toxicol. 2014, 29, 1–3. [Google Scholar]
  8. Landwehr, K.R.; Larcombe, A.N.; Reid, A.; Mullins, B.J. Critical Review of Diesel Exhaust Exposure Health Impact Research Relevant to Occupational Settings: Are We Controlling the Wrong Pollutants? Expo. Health 2021, 13, 141–171. [Google Scholar] [CrossRef]
  9. Wade, J.F., 3rd; Newman, L.S. Diesel asthma. Reactive airways disease following overexposure to locomotive exhaust. J. Occup. Med. Off. Publ. Ind. Med. Assoc. 1993, 35, 149–154. [Google Scholar] [CrossRef]
  10. Hesterberg, T.W.; Long, C.M.; Bunn, W.B.; Sax, S.N.; Lapin, C.A.; Valberg, P.A. Non-cancer health effects of diesel exhaust: A critical assessment of recent human and animal toxicological literature. Crit. Rev. Toxicol. 2009, 39, 195–227. [Google Scholar] [CrossRef] [PubMed]
  11. Lecureur, V.; Monteil, C.; Jaguin, M.; Cazier, F.; Preterre, D.; Corbiere, C.; Gosset, P.; Douki, T.; Sichel, F.; Fardel, O. Comparative study on gene expression profile in rat lung after repeated exposure to diesel and biodiesel exhausts upstream and downstream of a particle filter. Environ. Pollut. 2020, 266, 115264. [Google Scholar] [CrossRef] [PubMed]
  12. Crump, K.S.; Van Landingham, C.; McClellan, R.O. Influence of Alternative Exposure Estimates in the Diesel Exhaust Miners Study: Diesel Exhaust and Lung Cancer. Risk Anal. 2016, 36, 1803–1812. [Google Scholar] [CrossRef] [Green Version]
  13. Habert, C.; Garnier, R. Health effects of diesel exhaust: A state of the art. Rev. Mal. Respir. 2015, 32, 138–154. [Google Scholar] [CrossRef] [PubMed]
  14. Krishna, S.M.; Salam, P.A.; Tongroon, M.; Chollacoop, N. Performance and emission assessment of optimally blended biodiesel-diesel-ethanol in diesel engine generator. Appl. Therm. Eng. 2019, 155, 525–533. [Google Scholar] [CrossRef]
  15. Mobarra, M.; Rezkallah, M.; Ilinca, A. Variable Speed Diesel Generators: Performance and Characteristic Comparison. Energies 2022, 15, 592. [Google Scholar] [CrossRef]
  16. Shah, S.D.; Cocker, D.R., III; Johnson, K.C.; Lee, J.M.; Soriano, B.L.; Miller, J.W. Emissions of regulated pollutants from in-use diesel back-up generators. Atmos. Environ. 2006, 40, 4199–4209. [Google Scholar] [CrossRef]
  17. Kelly, K.E.; Whitaker, J.; Petty, A.; Widmer, C.; Dybwad, A.; Sleeth, D.; Martin, R.; Butterfield, A. Ambient and laboratory evaluation of a low-cost particulate matter sensor. Environ. Pollut. 2017, 221, 491–500. [Google Scholar] [CrossRef] [PubMed]
  18. Bathory, C.; Dobo, Z.; Garami, A.; Palotas, A.; Toth, P. Low-cost monitoring of atmospheric PM-development and testing. J. Environ. Manag. 2022, 304, 114158. [Google Scholar] [CrossRef] [PubMed]
  19. Jayaratne, R.; Liu, X.; Ahn, K.-H.; Asumadu-Sakyi, A.; Fisher, G.; Gao, J.; Mabon, A.; Mazaheri, M.; Mullins, B.; Nyaku, M.; et al. Low-cost PM2.5 Sensors: An Assessment of their Suitability for Various Applications. Aerosol Air Qual. Res. 2020, 20, 520–532. [Google Scholar] [CrossRef]
  20. Gao, M.; Cao, J.; Seto, E. A distributed network of low-cost continuous reading sensors to measure spatiotemporal variations of PM2.5 in Xi’an, China. Environ. Pollut. 2015, 199, 56–65. [Google Scholar] [CrossRef] [PubMed] [Green Version]
  21. Masri, S.; Rea, J.; Wu, J. Use of Low-Cost Sensors to Characterize Occupational Exposure to PM2.5 Concentrations Inside an Industrial Facility in Santa Ana, CA: Results from a Worker- and Community-Led Pilot Study. Atmosphere 2022, 13, 722. [Google Scholar] [CrossRef]
  22. Frederickson, L.B.; Lim, S.; Russell, H.S.; Kwiatkowski, S.; Bonomaully, J.; Schmidt, J.A.; Hertel, O.; Mudway, I.; Barratt, B.; Johnson, M.S. Monitoring Excess Exposure to Air Pollution for Professional Drivers in London Using Low-Cost Sensors. Atmosphere 2020, 11, 749. [Google Scholar] [CrossRef]
  23. Ruiter, S.; Kuijpers, E.; Saunders, J.; Snawder, J.; Warren, N.; Gorce, J.-P.; Blom, M.; Krone, T.; Bard, D.; Pronk, A.; et al. Exploring Evaluation Variables for Low-Cost Particulate Matter Monitors to Assess Occupational Exposure. Int. J. Environ. Res. Public Health 2020, 17, 8602. [Google Scholar] [CrossRef] [PubMed]
  24. Borghi, F.; Spinazze, A.; Campagnolo, D.; Rovelli, S.; Cattaneo, A.; Cavallo, D.M. Precision and Accuracy of a Direct-Reading Miniaturized Monitor in PM2.5 Exposure Assessment. Sensors 2018, 18, 3089. [Google Scholar] [CrossRef] [PubMed] [Green Version]
  25. Bai, L.; Huang, L.; Wang, Z.; Ying, Q.; Zheng, J.; Shi, X.; Hu, J. Long-term Field Evaluation of Low-cost Particulate Matter Sensors in Nanjing. Aerosol Air Qual. Res. 2020, 20, 242–253. [Google Scholar] [CrossRef]
  26. Chen, C.-C.; Kuo, C.-T.; Chen, S.-Y.; Lin, C.-H.; Chue, J.-J.; Hsieh, Y.-J.; Cheng, C.-W.; Wu, C.-M.; Huang, C.-M. Calibration of Low-Cost Particle Sensors by Using Machine-Learning Method. In Proceedings of the 14th IEEE Asia Pacific Conference on Circuits and Systems (APCCAS), Chengdu, China, 26–30 October 2018; pp. 111–114. [Google Scholar]
  27. Giordano, M.R.; Malings, C.; Pandis, S.N.; Presto, A.A.; McNeill, V.F.; Westervelt, D.M.; Beekmann, M.; Subramanian, R. From low-cost sensors to high-quality data: A summary of challenges and best practices for effectively calibrating low-cost particulate matter mass sensors. J. Aerosol Sci. 2021, 158, 105833. [Google Scholar] [CrossRef]
  28. Wesseling, J.; Hendricx, W.; de Ruiter, H.; van Ratingen, S.; Drukker, D.; Huitema, M.; Schouwenaar, C.; Janssen, G.; van Aken, S.; Smeenk, J.W.; et al. Assessment of PM2.5 Exposure during Cycle Trips in The Netherlands Using Low-Cost Sensors. Int. J. Environ. Res. Public Health 2021, 18, 6007. [Google Scholar] [CrossRef]
  29. Liu, Y.; Cao, G.; Zhao, N.; Mulligan, K.; Ye, X. Improve ground-level PM2.5 concentration mapping using a random forests-based geostatistical approach. Environ. Pollut. 2018, 235, 272–282. [Google Scholar] [CrossRef]
  30. Yan, W.W.; Shao, H.H.; Tu, T.U. Application of support vector machine nonlinear classifier to fault diagnoses. In Proceedings of the 4th World Congress on Intelligent Control and Automation, Shanghai, China, 10–14 June 2002; pp. 2697–2700. [Google Scholar]
  31. Mei, H.; Han, P.; Wang, Y.; Zeng, N.; Liu, D.; Cai, Q.; Deng, Z.; Wang, Y.; Pan, Y.; Tang, X. Field Evaluation of Low-Cost Particulate Matter Sensors in Beijing. Sensors 2020, 20, 4381. [Google Scholar] [CrossRef]
  32. Bulot, F.M.J.; Johnston, S.J.; Basford, P.J.; Easton, N.H.C.; Apetroaie-Cristea, M. Long-term field comparison of multiple low-cost particulate matter sensors in an outdoor urban environment. Sci. Rep. 2020, 10, 7497. [Google Scholar]
  33. Zhang, H.; Srinivasan, R.; Ganesan, V. Low Cost, Multi-Pollutant Sensing System Using Raspberry Pi for Indoor Air Quality Monitoring. Sustainability 2021, 13, 370. [Google Scholar] [CrossRef]
  34. Bouillant, S.; Miteran, J.; Paindavoine, M.; Bourennane, E.; Bourgeat, P. Real-time image segmentation for anomalies detection using SVM approximation. In Proceedings of the 6th International Conference on Quality Control by Artificial Vision, Gatlinburg, TN, USA, 19–22 May 2003; pp. 539–545. [Google Scholar]
  35. Kavitha, K.R.; Rajendran, S.G.; Varsha, J. A Correlation Based SVM-Recursive Multiple Feature Elimination Classifier for Breast Cancer Disease using Microarray. In Proceedings of the International Conference on Advances in Computing, Communications and Informatics (ICACCI), Jaipur, India, 21–24 September 2016; pp. 2677–2683. [Google Scholar]
  36. Kim, D.S.; Park, J.S. Network-based intrusion detection with support vector machines. In Information Networking: Networking Technologies for Enhanced Internet Services; Kahng, H.K., Ed.; Springer: Berlin/Heidelberg, Germany, 2003; Volume 2662, pp. 747–756. [Google Scholar]
  37. Murosaki, T.; Yoshida, K.; Naganuma, H. Visual Inspection with SVM. In Proceedings of the Annual Conference of the SICE, Chofu, Japan, 20–22 August 2008; p. 557. [Google Scholar]
Figure 1. PM2.5 concentration–time histories recorded by low-cost PM sensors and DustTrak.
Atmosphere 13 01766 g001
Figure 2. Comparisons of PM 2.5 concentration measured by sensors 1–6 and DustTrak. (Relationship between DustTrak PM2.5 concentration and PM2.5 concentration of PM sensor 1, PM sensor 2, PM sensor 3, PM sensor 4, PM sensor 5, PM sensor 6. The red line is a linear fitting line of DustTrak PM2.5 concentration and PM2.5 concentration of PM sensor).
Atmosphere 13 01766 g002
Figure 3. Schematic diagram of diesel generator plant.
Atmosphere 13 01766 g003
Figure 4. Variation of PM2.5 concentration at different monitoring points in the diesel generator plant.
Atmosphere 13 01766 g004
Table 1. Comparison of the test performance of different sensors.
InstrumentAverage PM2.5 Concentration (μg/m3)PM2.5 Concentration Range (μg/m3)Average Relative Error
DustTrak31.720–49\
Sensor134.124–5412.43%
Sensor230.818–5111.18%
Sensor335.621–5614.79%
Sensor431.515–5414.81%
Sensor529.114–4814.91%
Sensor634.119–5711.51%
Table 2. Model results of different correction factors for PM sensor 1.
ModelCoefficientAdjusted R2p Value *
PM SensorRHTTVOC
Basic model0.84\\\0.65<0.001
Basic model + RH0.860.13\\0.67<0.001
Basic model + RH + T0.89−0.07−0.52\0.72<0.001
Basic model + RH + T + TVOC0.91−0.05−0.930.070.75<0.001
* p value for coefficients of PM sensor in the regression models.
Table 3. Calibration model results for different PM sensor data.
PM SensorR2RMSE (μg/m3)
10.754.1
20.773.8
30.814.6
40.754.9
50.774.6
60.804.1
Publisher’s Note: MDPI stays neutral with regard to jurisdictional claims in published maps and institutional affiliations.

