Article

Source Analysis and Human Health Risk Assessment Based on Entropy Weight Method Modification of PM2.5 Heavy Metal in an Industrial Area in the Northeast of China

1
Key Laboratory of Groundwater Resources and Environment of the Ministry of Education, College of New Energy and Environment, Jilin University, Changchun 130012, China
2
Northeast Institute of Geography and Agricultural Ecology, Chinese Academy of Sciences, Changchun 130102, China
3
Graduate University of Chinese Academy of Sciences, Beijing 100049, China
*
Author to whom correspondence should be addressed.
Atmosphere 2021, 12(7), 852; https://doi.org/10.3390/atmos12070852
Submission received: 26 May 2021 / Revised: 25 June 2021 / Accepted: 28 June 2021 / Published: 30 June 2021

Abstract

:
In this study, PM2.5 was analyzed for heavy metals at two sites in industrial northeast China to determine their sources and human health risks during heating and non-heating periods. A positive matrix factorization (PMF) model determined sources, and US Environmental Protection Agency (USEPA) and entropy weight methods were used to assess human health risk. PM2.5 heavy metal concentrations were higher in the heating period than in the non-heating period. In the heating period, coal combustion (59.64%) was the primary heavy metal source at Huagong Hospitals, and the contribution rates of industrial emissions and traffic emissions were 21.06% and 19.30%, respectively. Industrial emissions (42.14%) were the primary source at Xinqu Park, and the contribution rates of coal combustion and traffic emissions were 34.03% and 23.83%, respectively. During the non-heating period, coal combustion (45.29%) and industrial emissions 45.29% and 44.59%, respectively, were the primary sources at Huagong Hospital, and the traffic emissions were 10.12%. Industrial emissions (43.64%) were the primary sources at Xinqu Park, where the coal combustion and traffic emissions were 25.35% and 31.00%, respectively. In the heating period, PM2.5 heavy metals at Xinqu Park had noncarcinogenic and carcinogenic risks, and the hazard index of children (5.74) was higher than that of adult males (5.28) and females (4.49). However, adult males and females had the highest lifetime carcinogenic risk (1.38 × 10⁻³ and 1.17 × 10⁻³) than children (3.00 × 10⁻⁴). The traditional USEPA and entropy weight methods both produced reasonable results. However, when there is a difference between the two methods, the entropy weight method is recommended to assess noncarcinogenic health risks.

1. Introduction

According to the latest results of the Global Burden of Disease Study, particulate matter (PM) has become the sixth leading cause of death [1,2], and air pollution is responsible for 1.5% of the total mortality worldwide [3]. Many epidemiological studies demonstrate that when inhaled and deposited in the lungs, PM2.5 (particle diameter less than 2.5 μm) can cause respiratory and cardiovascular disease in humans [4,5,6]. Thus, exposure to high concentrations of PM2.5 leads to increases in morbidity and mortality. There are many sources of PM2.5, including industrial emissions, coal combustion, traffic emissions, rocks, and soil weathering [7,8,9]. The contributions to PM2.5 from different sources depend on geographic location, climatic conditions, economic structure, and populations [10,11]. When industrial production is reduced, PM2.5 pollution is also reduced in many cities in China. However, industrial emissions and associated PM2.5 levels remain a cause for concern in China [10]. The increased burning of coal and biomass in the winter, particularly in northern China, is the main source of PM2.5 [12,13], in contrast to southern China [14,15]. In industrial cities in northern China, the dual effects of emissions from industry and coal combustion need to be monitored and evaluated. Heavy metals in PM2.5 can harm multiple human physiological systems and organs, and therefore, effects on human health are a concern [16,17,18]. Moreover, the characteristics of heavy metals in atmospheric particulates vary depending on the source [19,20,21]. Studies have shown that the concentration of PM2.5 in Zibo, which is dominated by petrochemical industry, is relatively high in the spring, with K+ and Mg2+ mainly representing the source of fugitive dust; in winter, the concentration of F- and NO3- is relatively high, which represents coal burning; Cd and Ni, the elements of industrial emissions, do not change significantly throughout the year; research on industrial cities such as Baoding and the plateau city of Kunming also shows that the concentration of As and Hg, the elements of coal combustion, is higher in winter; Cd and Pb produced by zinc smelting are important sources of pollution in Huludao City [8,22,23,24].
To assess the impact of PM2.5 on human health, the human health risk assessment method of the US Environmental Protection Agency (USEPA) is often selected [25,26,27,28,29]. Most analyses of PM2.5 sources and human health risk assessment calculate human health risk without considering the effects of different sources, and the default parameters of models assume that factors do not interact or that interactions can be ignored [27,30,31]. However, because of factors such as humidity, wind speed and direction, temperature, and human activity, there may be different combinations of pollution sources with different levels of contribution and concentrations [32]. The USEPA method can be improved by coupling the source of the pollution analysis model with the human health risk assessment model; however, such models only analyze data for a specific time [33], and there is no approach for comprehensive analysis of long time series data. Heavy metals may bioaccumulate, and animal models indicate that the concentrations of heavy metals and the extent of their effects are nonlinear [34]. Moreover, the cellular toxicity of multiple heavy metals is not merely the sum of the toxicity of single heavy metals, and combinations of different heavy metals can produce synergistic or antagonistic effects [35,36]. Therefore, the health risks of different heavy metals to a population should not be simply determined by the addition of effects. To determine the effects of different combinations of pollution sources on human health risk in a long time series, the possible compound effects of multiple heavy metals on human health need to be considered. In this article, multiple heavy metals were regarded as a system, and the entropy weight method was introduced to supplement human health risk assessment.
Entropy was proposed by the German physicist Clausius to describe random thermal motion in thermodynamics [37]. Thereafter, Boltzmann developed entropy theory and applied it to information theory, in which entropy is defined as a random variable [37] and the acquisition of entropy indicates a loss of information. Therefore, with an increase in the entropy value, less information is provided by a factor, and it is less important in a comprehensive evaluation [38]. To reduce the uncertainty of factors in an evaluation model, the information entropy model was established, which calculates a factor’s entropy weight [37,39]. The biggest advantage of the entropy method is to use the data itself to calculate the weight index instead of human factors, thereby improving the objectivity of the comprehensive evaluation results [40]. The entropy weight method has been validated in many types of assessments, including environmental pollution assessment, vulnerability distribution in coastal aquifers, ecological risk assessment, and comprehensive water quality assessment [39,41,42]. In such studies, the weightings between the indicators in the index and the weightings of the subsystems in the evaluation system are applied reasonably, demonstrating the suitability of the weighting method in evaluation systems. Thus, this approach should also be applicable to human health risk assessment of atmospheric PM.
To assess heavy metal pollution in Huludao City, Liaoning Province, China, environmental pollution study has focused on soils, indoor and outdoor dust, sediments, fresh water, insects, and food, and has included heavy metal accumulation, distribution, and degree of pollution, as well as human health risk assessment [22,43,44,45,46]. In this research, the concentrations of heavy metals in atmospheric PM2.5 were determined, and the health risks were assessed at two sites in Huludao City. To assess human health risk, the entropy weight method was compared with the traditional USEPA method. The objectives of the study were the following: (1) to identify changes in PM2.5 and the heavy metal concentrations during heating and non-heating periods; (2) to determine the main sources of heavy metals and their contributions in the different periods; (3) to assess the human health risks of heavy metals in PM2.5 (carcinogenic and noncarcinogenic risks); and (4) to compare different methods that estimate the human health risk over the long-term.

2. Materials and Methods
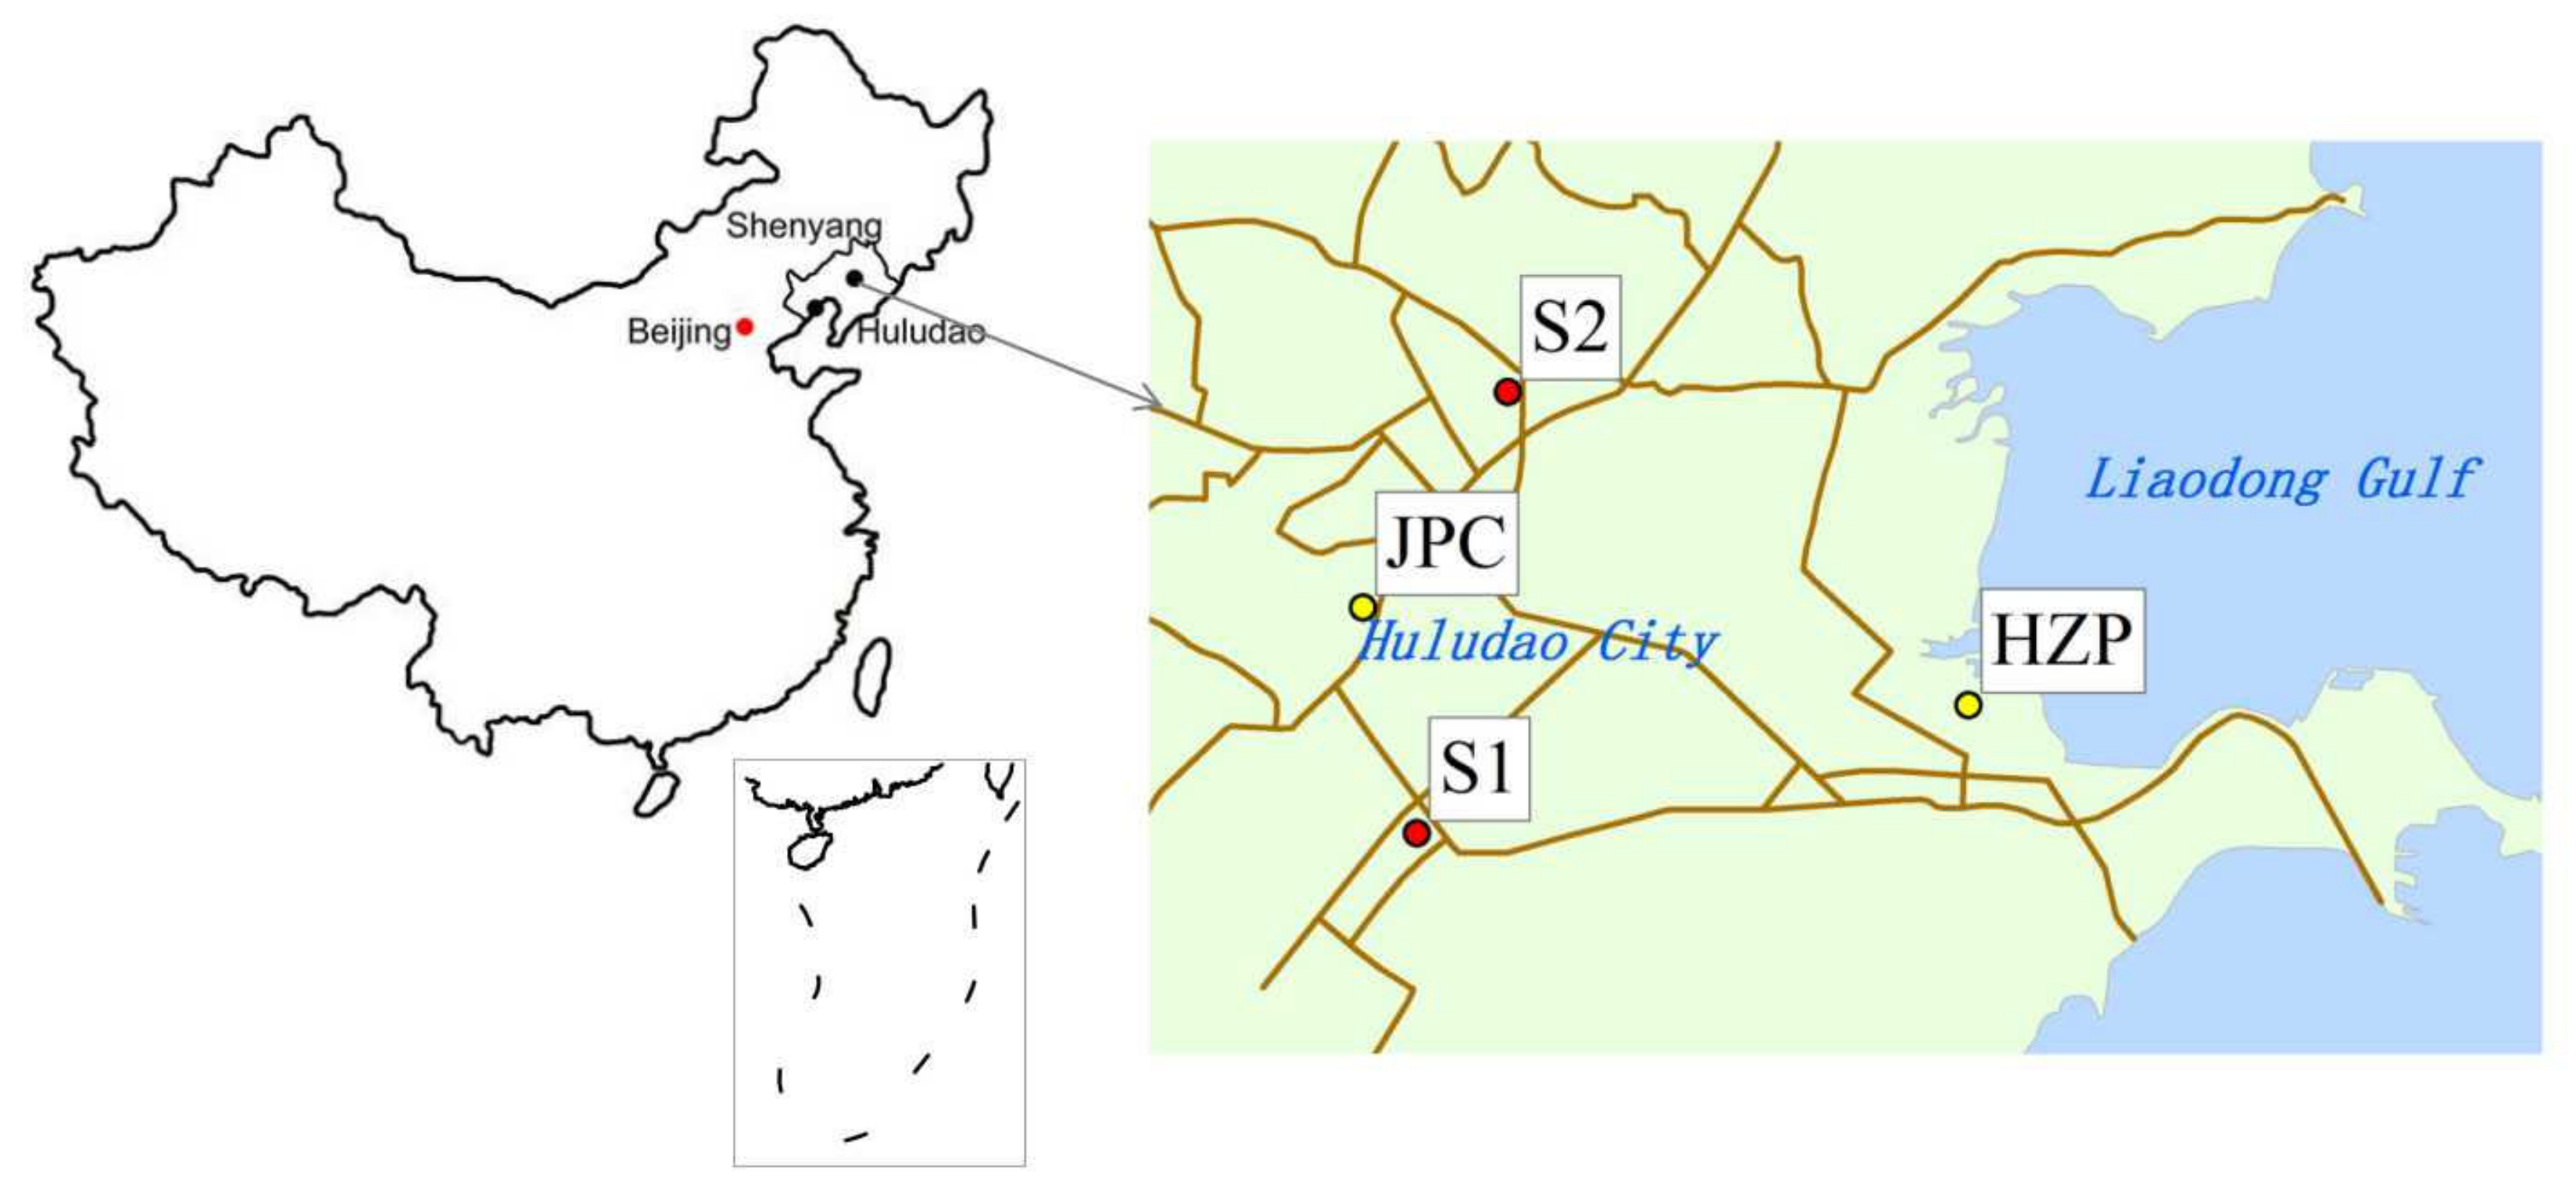
2.1. Study Area

The research was conducted at two sites in Huludao City, an industrial city in northeast China. The city is in the southwestern part of Liaoning Province adjacent to the Liaodong Gulf of the Bohai Sea (Figure 1). The region has a north temperate continental monsoon climate. The west monsoon is dominant in winter, and the east monsoon prevails in summer. The average annual wind speed is 3 m/s. The main industries in Huludao City are petrochemicals, nonferrous metals, mechanical shipbuilding, and energy and power. The city has the largest zinc smelter in Asia, the Huludao Zinc Plant (HZP). As a result of the smelting operations, heavy metals are discharged into the environment and pollute the atmosphere, soil, and rivers [22,43]. Industrial activities and coal combustion are responsible for an approximate twofold increase in pollution in the study area. One sampling site was at Huagong Hospital, which is in the Lianshan District of Huludao City. Metal mining is the main industry in the region, and the city has a large proportion of secondary and tertiary industries. The other sampling site was at Xinqu Park, which is in the Longgang District of Huludao City. The forested land in this area accounted for 50.6% of the total land area, and it is a relatively new urban area dominated by secondary and tertiary industries.

2.2. Sample Collection and Preparation

The distribution of sampling sites is shown in Figure 1. At the Huagong Hospital site, the PM2.5 mass concentrations and the atmospheric particle samples were collected and measured continuously using an atmospheric particulate monitor (APM; Dasibi 7201, Beijing Zhongshengtyco Environmental Science and Technology Development Co. Ltd., Beijing, China). The duration of sample collection was 1 h, and the airflow was 16.7 L min−1. At the Xinqu Park site, the PM2.5 mass concentrations and the atmospheric particulate samples were collected separately by using two APM systems (i-5030 and i-FH62C14, Thermo Fisher, Franklin, MA, USA). The duration for both sample collections was 6 h, and the airflow was 16.7 L min−1. The PM2.5 was sampled in the study areas from April 2015 to March 2016. According to the “Huludao City Heating Management Measures” (2011), November to March is the heating period, and April to October is the non-heating period [47]. The PM2.5 was sampled at two points in both Huagong Hospital and Xinqu Park, and a total of 96 valid samples were collected.

2.3. Chemical Analyses

The PM2.5 samples were collected on 47 mm diameter quartz fiber filters. A sample was weighed after constant temperature (25 °C) and relative humidity (30%) for 24 h, the filter membrane was cut in half and transferred to a Teflon digestion vessel. Then, HNO3, HF, and HClO4 (1:1:5) were added to the vessel. The sample mixture was heated for 3 h at 200 °C [48]. After digestion, the sample was cooled to room temperature, and the solution was quantitatively transferred to a 50 mL volumetric flask, which was filled to the mark. The sample digests were analyzed using inductively coupled plasma mass spectrometry (Thermo Fisher, Germany) to determine the concentrations of nickel (Ni), cadmium (Cd), lead (Pb), copper (Cu), and arsenic (As) on the filters [31].
For quality assurance/quality control, 10 blank filters and river sediment standard (Fluvial sediments: GBW08301) were digested and analyzed as described above to determine heavy metal detection limits and recovery rates. The average concentrations in the blank filters were the following (μg m−3): 0.021 ± 0.006 Ni; 0.088 ± 0.006 Cu; 0.249 ± 0.034 As; 0.003 ± 0.002 Cd; and 0.037 ± 0.020 Pb. The detection limits were the following (μg m−3): 0.016 Ni, 0.018 Cu, 0.098 As, 0.006 Cd, and 0.057 Pb. According to the river sediment tests, the average recovery rates of heavy metals ranged from 89.83% to 115.15%. The calculated values of the atmospheric PM2.5 samples used in this article were obtained by subtracting the blank filter value from the test value.

2.4. Positive Matrix Factorization Model (PMF)

A positive matrix factorization (PMF) model allocates sources based on internal correlation of the data and determines the main contributing factors according to the size of the contribution and the actual local conditions [19,49]. The eigenvalues of each component are analyzed, and the source type represented by each factor is determined [19,49]. The PMF model has been widely used in the analysis of sources of heavy metals, aerosols, and organic matter in atmospheric PM and has performed well in separating different combustion sources [19,20,50]. The goal of PMF is to solve the chemical mass balance between the measured species concentrations and the source profiles [19,49]. In addition, minimization of the objective function of the PMF model enables derivation of the factor contributions and the profiles. The species method-specific limit of detection limit (MDL) is calculated to determine the uncertainty of an element [50,51,52]. In this study, the PMF model used 96 samples as the input items. For the model, the MDL was 2.82 times the standard deviation of the 10 blank filters. The uncertainty was calculated according to Equations (1) and (2). When the concentration was lower than the MDL, Equation (1) was used to calculate the uncertainty, and when the concentration was higher than the MDL, Equation (2) was used, with the error function the relative standard deviation. According to the PMF5.0 user guide, a signal-to-noise ratio lower than 0.5 is defined as “Bad”, a ratio higher than 0.5 and lower than 1 is “Weak”, and a ratio higher than 1 is “Strong”. According to the running result of the model objective function, the residual result between −3 and +3 was selected, and the minimum objective function was the output result [53,54].
U n c = 5 6 × M D L  
U n c = E r r o r   F r a c t i o n × c o n c e n t r a t i o n 2 + 0.5 × M D L 2  

2.5. Health Risk Assessment

Heavy metals are readily accumulated in human organs such as the liver and kidney and are difficult to degrade and excrete from the body [55]. Heavy metals in atmospheric particulates will enter the human body via respiration, skin absorption, and oral intake, and pose risks to human health [56,57]. Currently, the USEPA’s human health risk assessment model is widely used to estimate heavy metal exposure levels. The model is based on the exposure mode, exposure time, concentration factor, and the average daily inhaled dose of non-carcinogenic metal (ADDinh, mg·kg−1·day−1) and the average daily inhaled dose of metal carcinogen for lifetime exposure (LADDinh, mg·kg−1·day−1) in order to calculate the risk index for the human health, as given by Equations (3)–(5) [29,58]. In this study, a risk assessment for heavy metal (Ni, Cu, As, Cd, and Pb) exposure based on intake of PM2.5 was carried out. The metals were divided into two categories, in which all the heavy metals were considered non-carcinogenic, and Ni, As, and Cd were considered carcinogenic [59].
The basic statistical data and abbreviations used in the study are as follows:
A D D i n h   i L A D D i n h   i = C × I n h R × E F × E D B W × A T n A T c
C: concentration of heavy metals in PM2.5, mg/m3. InhR: inhalation rate, 19.20 m3/day for adult males, 14.17 m3/day for adult females, 5.00 m3/day for children [29,58]. EF: exposure frequency, 350 day/year in this study [56]. ED: exposure duration, 30 years for adults, and 6 years for children [29,58]. BW: average body weight, 62.70 kg for adult males, 54.40 kg for adult females, 15.00 kg for children [30,60]. ATn: averaging time for non-carcinogens, ED × 365 days [30,60]. ATc: averaging time for carcinogens, 70 × 365 days [29,58]. Age of children, 0–16 years; adults, 17–70 years [56].
The hazard quotient (HQ) represents the risk due to non-carcinogens, and the incremental lifetime cancer risk (ILCR) for carcinogens was calculated using the following equations [22,29,56,58]:
H Q i = A D D i n h   i R f D i
I L C R i = L A D D i n h   i × C S F i
RfD: reference dose; Ni 2.00 × 10⁻² mg·kg−1·day−1; Cu 4.00 × 10⁻² mg·kg−1·day−1; As 3.00 × 10⁻⁴ mg·kg−1·day−1; Cd 1.00 × 10⁻³ mg·kg−1·day−1; Pb 3.50 × 10⁻³ mg·kg−1·day−1 [29,58]. CSF: carcinogens slope factor; Ni 0.84 mg·kg−1·day−1; As 1.51 mg·kg−1·day−1; Cd 6.30 mg·kg−1·day−1 [29,58].
As in previous studies [8,29,54], and without considering the interaction between heavy metals, the hazard index (HI) was calculated by superimposing the HQ value of each heavy metal, and the ILCRtotal was calculated by superimposing the ILCR value of each heavy metal, as shown in Equations (6) and (7).
H I = i H Q i
I L C R t o t a l = i I L C R i
The human health risk index, however, calculated by the above method does not take into account the impact of different pollution sources. Although the ME2 model can also calculate health risks from different sources, it does not consider the long-term effects of the factors on the population, especially heavy metal pollutants [33,61]. Therefore, this study introduces the entropy weight method into the human health risk assessment to evaluate the impact of factors which pose a long-term effect. First, we establish relevant feature matrices based on the samples and the evaluation parameters:
A =   a 11 a 21 a m 1 a 12 a 22 a m 2     a 1 n a 2 n a m n
where A represents the relevant feature matrices, m is the number of considered features (in this paper m is the number of heavy metals), and n is the number of samples [39,62]. The parameter index amount, j, in sample i is subsequently (yij) calculated by Equation (9); the information entropy (Hi) is calculated by Equation (10); and the entropy weight, Ei, is calculated by Equation (11) [62].
y i j = a i j / i = 1 m a i j         i = 1 , 2 , , m ; j = 1 , 2 , , n .
H i = 1 ln n j = 1 n y i j ln y i j     i = 1 , 2 , , m ; j = 1 , 2 , , n
E i = 1 H i m i = 1 m H i i = 1 , 2 , , m .
To show the impact of different pollution sources on the human health risk, the entropy weight method was used to calculate the weight value of the HQ value and the ILCR for each heavy metal, and the weighted correction of the HI’ value and the ILCRtotal’ for human health risk, as shown in Equations (12) and (13):
H I ' = i H Q i E i
I L C R t o t a l ' = i I L C R i E i
where Ei represents the weight of different heavy metal HQ values or ILCR values in the method for calculation (see Equations (9)–(11)). If HQ and HI exceed 1 or if ILCR and ILCRtotal exceed 10−4, then there is a chance that non-carcinogenic or carcinogenic effects might occur. If the ILCR and ILCRtotal values exceed 10−6, but do not exceed 10−4, there is a potential carcinogenic risk for the heavy metals [22,55].

2.6. Data Analysis

SPSS Statistics 25 was used for statistical analysis and Origin 2017 for plotting. Excel in office 2016 calculates the coefficient of variation (CV).

3. Results and Discussion

3.1. Particulate Matter Concentrations

The average PM2.5 concentrations were 45.31 μg m−3 in Xinqu Park and 57.36 μg m−3 in Huagong Hospital. The concentrations were higher during the heating period (62.63 μg m−3 in Xinqu Park; 68.36 μg m−3 in Huagong Hospital) than in the non-heating period (33.91 μg m−3 in Xinqu Park; 52.05 μg m−3 in Huagong Hospital). This finding is consistent with the results of several studies [48,63]. The concentrations in the study area were relatively low compared with those in Beijing (89.60 to 196.3 μg m−3) [48], Shanghai (103.1 μg m−3) [63], and other large cities. In addition, the concentrations in Chengdu (41.45 to 115.4 μg m−3) [64], a city of greater size and population density than Huludao, were generally higher. The highest PM2.5 concentrations in Huludao were similar to those in the tourist city of Tai’an (63.00 μg m−3) [65] but were lower than those in the industrial city of Zhuzhou (81.00 to 201.3 μg m−3) [27]. Existing studies have shown that only considering the level of social and economic development, when the share of urban secondary industry is low, PM2.5 pollution is lighter, and the polycentric and scattered population distribution will increase the concentration of PM2.5 in Chinese cities [10,11].
The concentration of PM2.5 at Huagong Hospital was higher than that at Xinqu Park. However, the PM2.5 concentration (33.91 μg m−3) at Xinqu Park only met the ambient air quality standards (35.00 μg m−3) during the non-heating period. High concentrations of PM2.5 may increase human health risks [60]. A nonparametric test indicated the PM2.5 concentration in Huagong Hospital and Xinqu Park was significantly different (p < 0.05). The concentration was also significantly different between the two sampling sites during the heating and the non-heating periods (p < 0.05). These results indicated that the main sources of PM2.5 at the two sampling sites were different. This difference might be because Xinqu Park is downwind of the HZP, whereas Huagong Hospital is in the old part of the city northwest of the HZP and is relatively less affected by plant emissions.

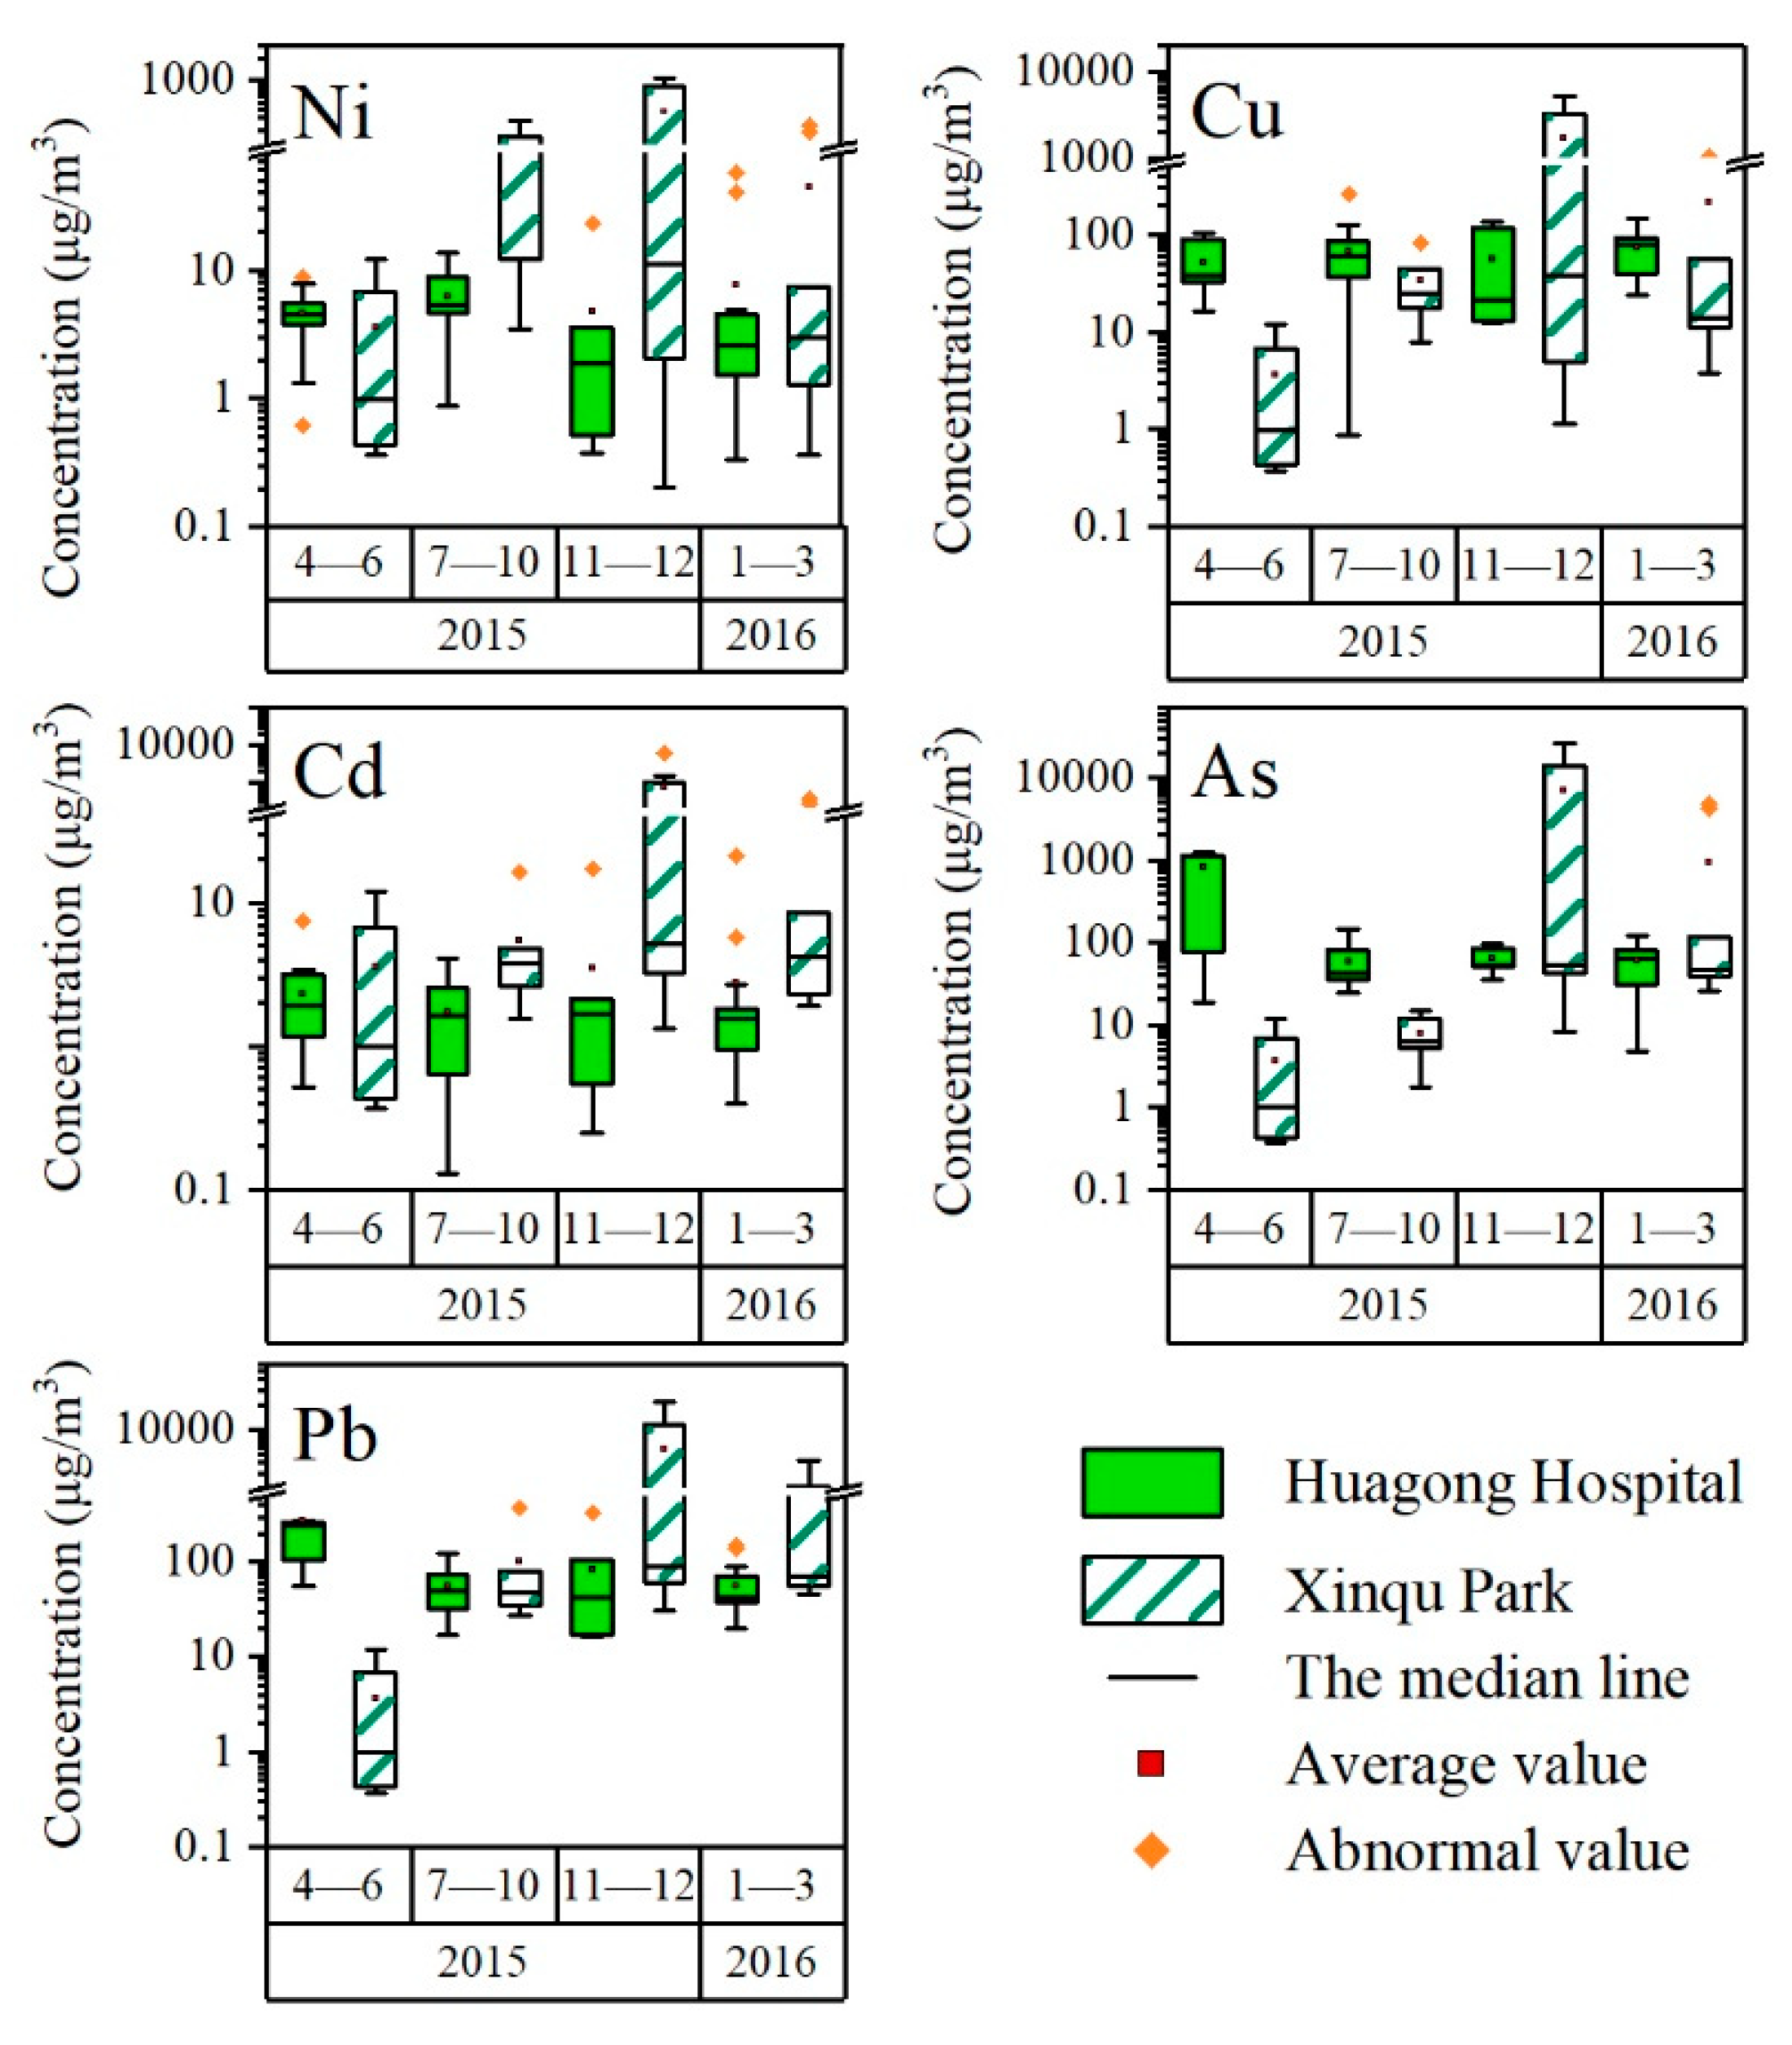
3.2. Heavy Metal Content of PM2.5

Figure 2 shows heavy metal concentrations in PM2.5 in the study area. Except for As and Pb at Huagong Hospital, the concentration of heavy metals in the heating period was higher than that in the non-heating period. The concentration of heavy metals in PM2.5 at Xinqu Park was higher than that at Huagong Hospital during the heating period, and the concentrations of Ni and Cd at Xinqu Park were higher than those at Huagong Hospital during the non-heating period. Differences in the locations and sources of the two sampling sites might have affected the concentrations of heavy metals. In previous studies, the concentration of heavy metals is highest in winter and lowest in summer [13,64]. The heavy metal content of PM2.5 in the industrial city of Changzhou in southern China in autumn and winter was higher than that in the present study. In Changzhou, traffic and industrial emissions are the main sources of pollution, with coal combustion sources the smallest contributor [30]. By contrast, in Chifeng City in northern China, the main sources of heavy metal pollution are coal combustion and vehicle emissions [66]. The heavy metal concentrations of PM2.5 in Chifeng City are slightly lower than those in the present study, and the highest concentrations occur in winter and the lowest concentrations occur in summer [66].
Nonparametric tests on the heavy metal concentrations in the different sampling periods detected differences between heavy metals (p < 0.05), suggesting there were multiple sources of heavy metals. During the heating period, the concentrations of As, Pb, and Cu were relatively high. Arsenic is an important indicator of coal combustion, and Pb is an important pollutant from zinc smelting and may also be a product of coal combustion [64,67]. Therefore, during the heating period, heavy metal concentrations in PM2.5 might be most affected by coal combustion and industrial production. In the non-heating period, the concentrations of As, Pb, and Cu were higher at Huagong Hospital than at Xinqu Park, whereas the concentrations of Ni and Pb were higher at Xinqu Park than at Huagong Hospital. Nickel is primarily derived from the burning of fossil fuels, the wear of auto parts, and ship emissions [64,67,68]. Therefore, during the non-heating period, the differences in the concentrations of heavy metals between the two sampling points might be due to the different locations and sources.

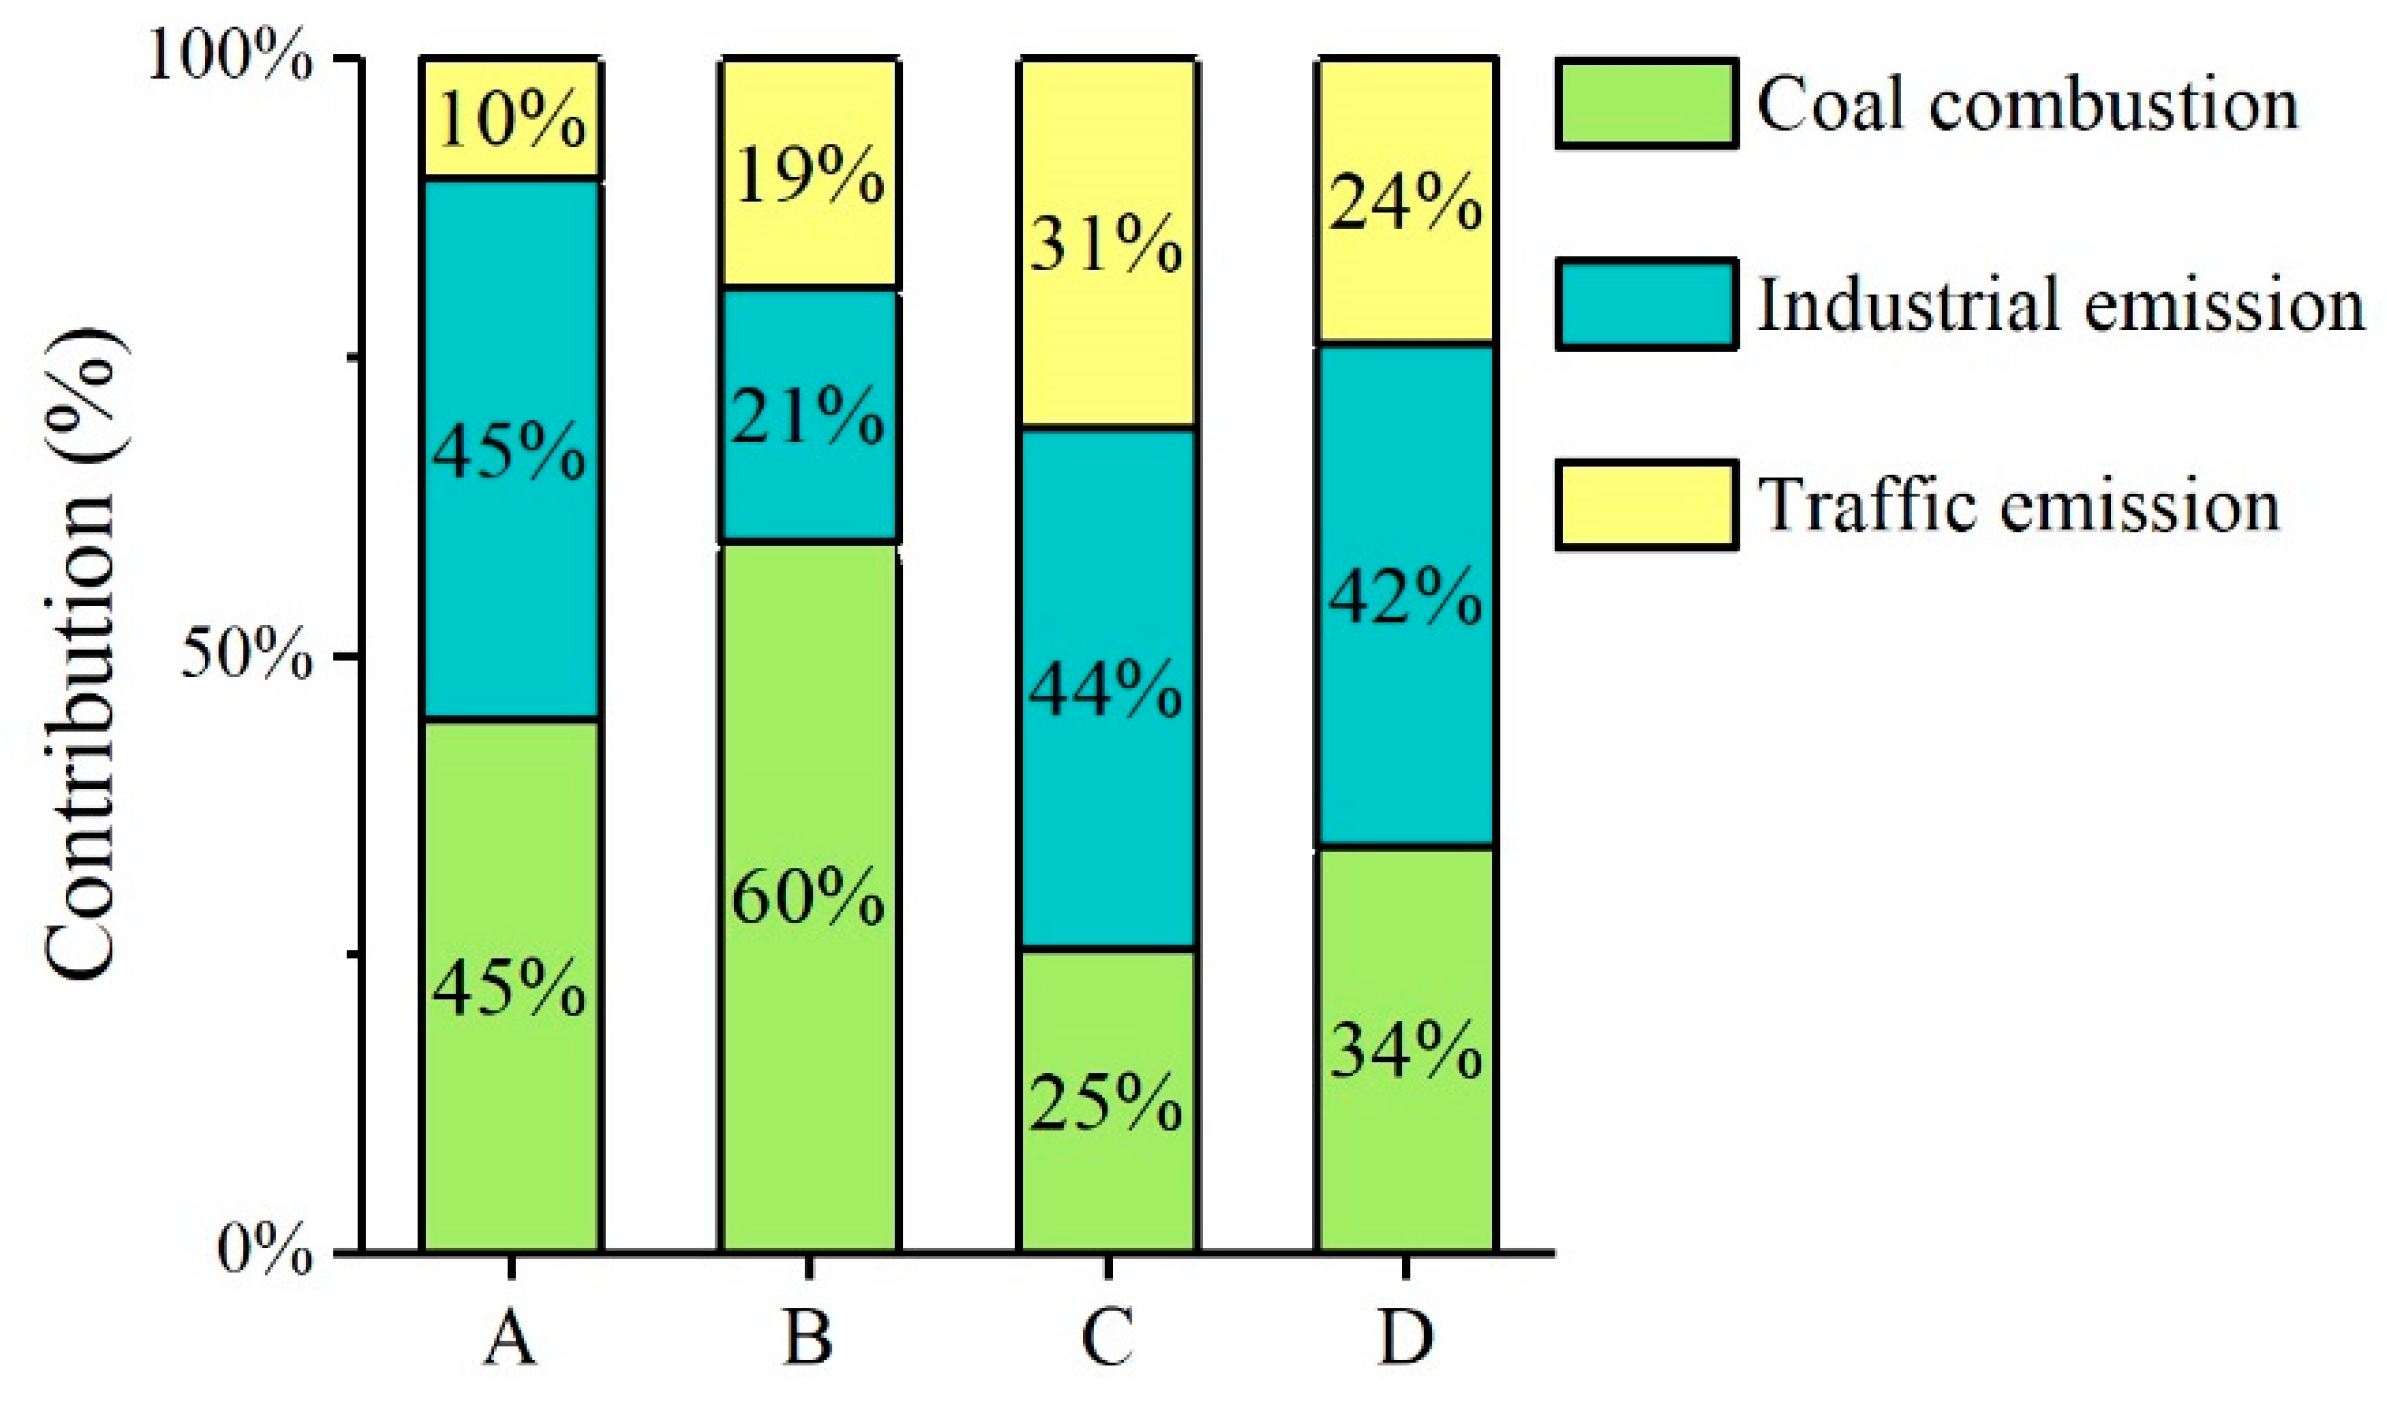
3.3. Source Apportionment Analysis

3.3.1. Identification of Factors

The USEPA PMF5.0 model was used to classify the sources of heavy metals in PM2.5 at Huagong Hospital and Xinqu Park. Figure 3 shows the major air pollution sources and their contributions. The first factor had high concentrations of As (44.30–84.53%), Pb (36.61–47.86%), and Cd (6.50–66.20%). Many studies show that As and Pb are important indicators of coal combustion, especially As [64,69,70]. The combustion of coal also releases many trace elements, including Pb and Cd [58,71], and thus, those metals in PM2.5 indicated that coal combustion might be the source. The second factor had high concentrations of Cd (22.53–57.46%), Pb (33.95–50.60%), and Cu (13.87–74.23%). The metals Cd, Cu, and Pb are typically associated with smelting and nonferrous metal industries [64,72,73,74], Cd and Pb are important pollution signs in zinc smelting [40,41,42], and therefore, the emission signature was attributed to industrial emissions. The third factor had relatively high concentrations of Ni (12.41–79.05%), Cd (11.27–36.04%), and Pb (12.79–22.62%). Nickel is primarily derived from the combustion of fossil fuels but is also an important indicator of ship emissions and is closely linked with road dust derived from worn vehicle components (e.g., brake linings and tire wear) and vehicle exhaust (oil, diesel combustion) [66,68,75]. The study area is adjacent to Liaodong Bay, and ship emissions might be a source of heavy metals in PM2.5, which were classified as traffic emissions. In this article, the traffic emissions are the total emissions generated by vehicle and ship emissions. The study area is in northeast China and is a typical metallurgical processing area. The HZP produces 3.3 × 10⁵ tonnes of zinc per year, as well as Cd [46] and a variety of heavy metals [76]. Thus, industrial emissions and coal combustion were the main sources of PM2.5 in the study area.

3.3.2. Source Apportionment for the Non-Heating Period

Figure 4 shows the source contributions from the PMF model. In the non-heating period, the main source of heavy metals in PM2.5 at Huagong Hospital was industrial emissions (45.29%), followed by coal combustion (44.59%) and traffic emissions (10.12%). At Xinqu Park, the main source was industrial emissions (43.64%), followed by traffic emissions (31.00%) and coal combustion (25.35%). According to the model results, industrial emissions were the main source of PM2.5 in the study area. The different secondary sources for the two sampling points might be related to their locations and meteorological factors. During the non-heating period, the study area is dominated by southerly and southwesterly winds. Therefore, the sampling points in Xinqu Park were likely affected by emissions from ships in Liaodong Bay, and the contribution from traffic emissions was relatively high. The results in this study are consistent with those for Chengdu and Tai’an in southern China [64,65]. However, industrial emissions had a relatively high contribution in the study area, likely because zinc smelting was the dominant industry. Chengdu is a provincial capital city, and Tai’an is a tourist destination [64,65]. The contribution of industrial emissions during the non-heating period (summer) was higher than that of coal burning, which is in contrast to results from the industrial city of Chifeng in northern China [66]. The contrast may be due to coal-fired power generation and coke plants in Chifeng City, which increase the contribution of coal combustion during the non-heating period [66], compared with that in the study area.

3.3.3. Source Apportionment for the Heating Period

The PMF model identified the main sources of PM2.5 in the study area (Figure 4). During the heating period, the main source of heavy metals in PM2.5 at Huagong Hospital was coal combustion (59.64%), followed by industrial emissions (21.06%) and traffic emissions (19.30%), whereas at Xinqu Park, industrial emissions (42.14%) dominated, followed by coal combustion (34.03%) and traffic emissions (23.83%). Thus, there were differences in the main sources of PM2.5 heavy metals at the two sampling sites. The differences might be because Huagong Hospital is in the old urban area of the city where the population is relatively dense. Coal-fired heating might also affect the site, in addition to industrial production, particularly considering the wind direction. During the heating period, the wind direction is mainly northerly and southwesterly, and because of the dilution/dispersal effect, the wind direction might have had a disproportionate effect on pollutant dispersal [77]. Coal-fired heating might have had less effect on Xinqu Park. In Liaoning Province, for example, coal consumption for industrial processes reached 175 million tonnes in 2015, including the burning of 140 million tonnes of coal for fuel [78]. In Chengdu, air conditioners are heavily used in the cold period, and that usage creates an increased demand for coal in thermal power generation; hence, the contribution of PM2.5 associated with coal combustion increases in winter [64].
Overall, industrial emissions were the main source of PM2.5 in the study area, followed by coal combustion and then traffic emissions. These results are the same as those for Tai’an and Chengdu [64,65], whereas the differences between Chifeng City and the present study are only because the research area is an industrial city dominated by zinc smelting [66]. At Huagong Hospital, coal-fired heating increased the contribution of coal combustion to heavy metals in PM2.5. A similar conclusion was also reached in a PM10 source analysis in northeast China [79]. According to the data of the Department of Ecology and Environment of Liaoning Province (2015), the contributions to PM2.5 from industrial emissions are much higher than those from traffic emissions. Because contributions from pollution sources change in time and space, there are different combinations of pollutants, and they likely have different health risks to populations.

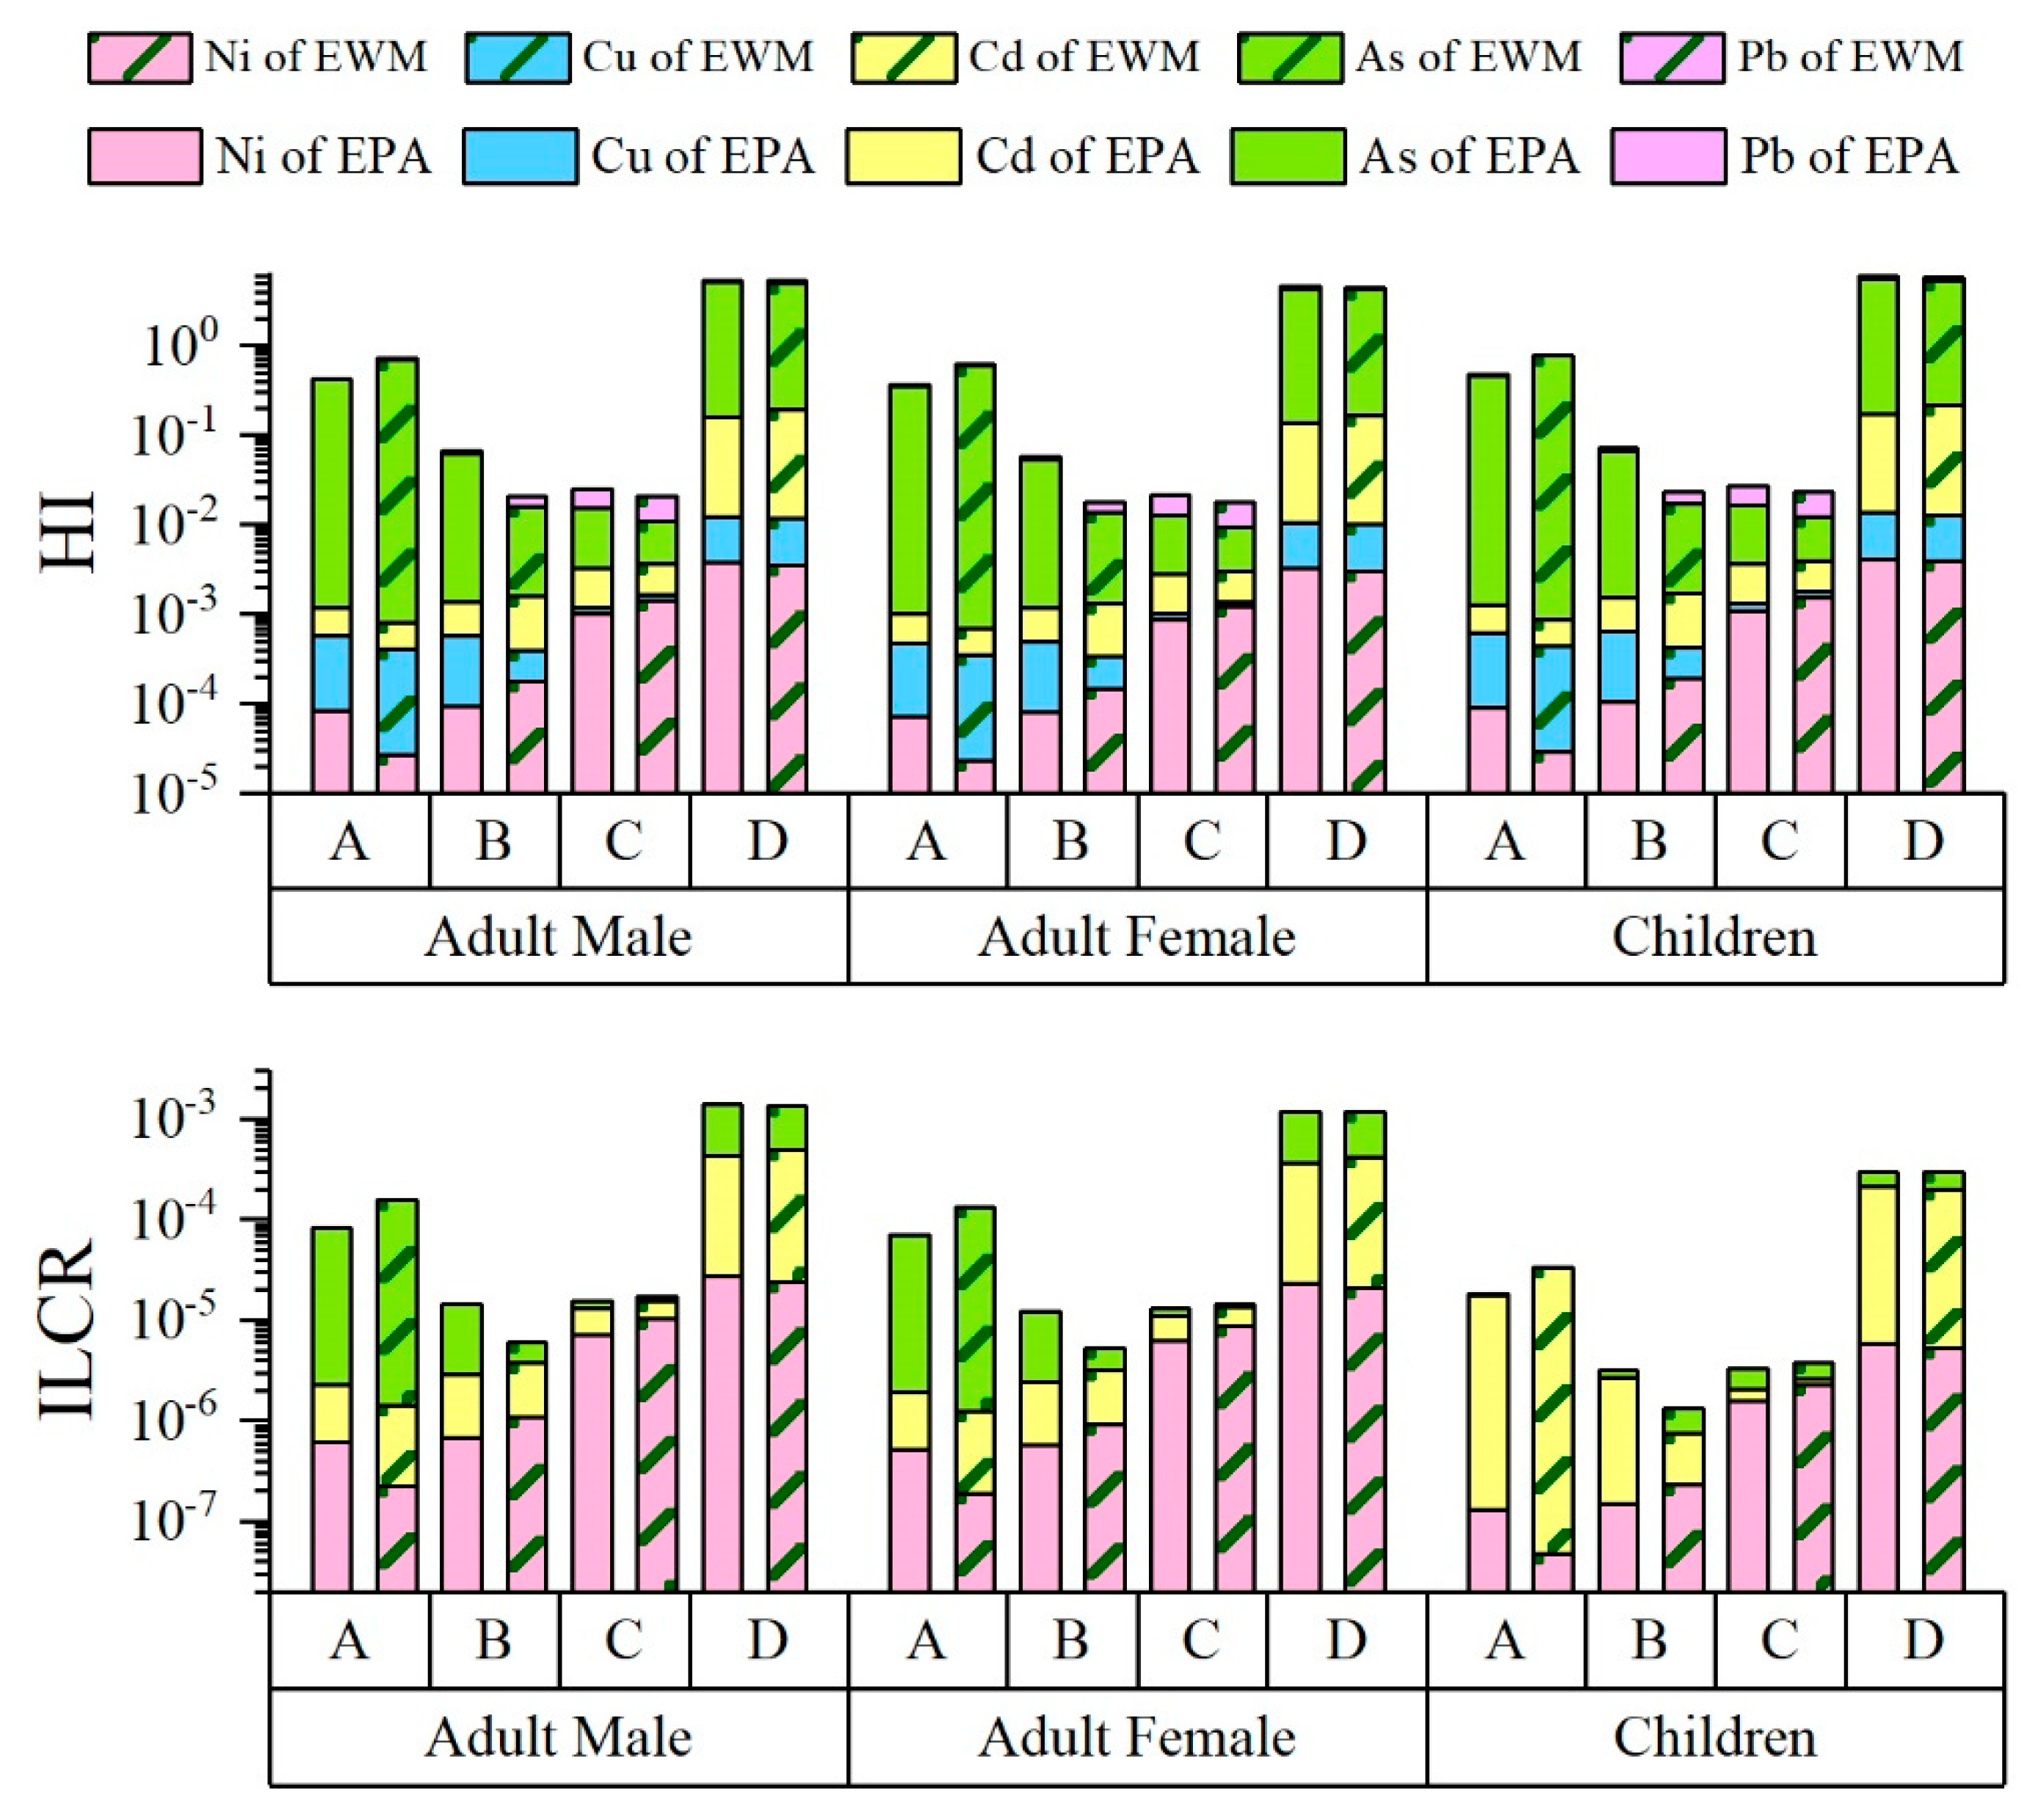
3.4. Health Risk Assessment

The human health risk assessment index only represents the assessment results for a particular period. However, because of the bioaccumulation of heavy metals, the assessment results of individual sampling periods cannot fully represent the human health risks in a study area. Therefore, in this paper, the average value of heavy metal concentrations during the sampling period was used to represent the human health risk associated with heavy metals in PM2.5. In this study, HQ was used to evaluate the noncarcinogenic risk, and the ILCR was used to evaluate the carcinogenic risk. The different types of risk were analyzed separately for the heating and non-heating periods. The total carcinogenic risk and the total noncarcinogenic risk were calculated by the traditional USEPA method and the entropy weight method; the calculation results are shown in Figure 5.

3.4.1. Non-Carcinogenic Risk Assessment

The lowest noncarcinogenic risk index in the non-heating period was for adult women at Xinqu Park (2.14 × 10⁻² (USEPA) and 1.78 × 10⁻² (entropy weight method)), whereas the highest noncarcinogenic risk index was for children at Huagong Hospital (0.469 (USEPA) and 0.788 (entropy weight method)) (Figure 5). In the non-heating period, the hazard index was less than 1, indicating that heavy metals in PM2.5 in the study area did not pose a noncarcinogenic human health risk. During the heating period, adult women at Huagong Hospital had the lowest noncarcinogenic risk (5.67 × 10⁻² (USEPA) and 1.79 × 10⁻² (entropy weight method)), whereas children at Xinqu Park had the highest noncarcinogenic risk index (5.90 (USEPA) and 5.74 (entropy weight method)). The HI value of Xinqu Park was greater than 1, indicating that heavy metals posed a noncarcinogenic risk to human health in the area. Similar results are also reported for Tianjin City and Sistan in Iran [80,81]. Increased human health risks associated with increased heavy metal concentrations have been reported previously [16,82]. For the different populations at the two sampling locations within the same sampling period, the noncarcinogenic risk index was ranked as children > adult males > adult females. Thus, children likely faced the greatest noncarcinogenic risk from heavy metal pollution. This finding is consistent with studies in which the noncarcinogenic risk for children is higher than that for adults. In addition, the exposure parameters of weight and breathing rate, among others, are higher for adult males than for adult females [8,11,31]. A nonparametric test of the population HI determined by the two methods in the different periods showed that the results were significantly different at Huagong Hospital (p < 0.05). However, there was no significant difference between the results of the two methods at Xinqu Park (p > 0.05). This difference might be because the main sources of heavy metals in PM2.5 in the heating and non-heating periods at Huagong Hospital were different, as were the main contributing heavy metals. Therefore, the weight of the HQ value of each heavy metal calculated by the entropy weight method was different. To compare the difference in the results of the two methods, the coefficient of variation (CV) of the HI value during the period was calculated. At Huagong Hospital, the CV values of the entropy weight method were slightly higher (1.185 for the non-heating period and 0.524 for the heating period) than those of the USEPA method (1.182 for the non-heating period and 0.453 for the heating period). At Xinqu Park, the CV values of the entropy weight method were lower (0.561 for the non-heating period and 1.419 for the heating period) than those of the USEPA method (0.563 for the non-heating period and 1.437 for the heating period). Thus, there was little difference between the results of the two methods at Xinqu Park, and the values calculated by the entropy weight method had a lower degree of dispersion. In evaluating the effects of long-term changes in heavy metal concentrations in PM2.5 on human health risks, the calculation results of entropy weight method might be more representative.

3.4.2. Carcinogenic Risk Assessment

Figure 5 shows the carcinogenic risk assessment results for the study area. The lowest carcinogenic risk index for the non-heating period was for children at Xinqu Park (3.31 × 10⁻⁶ (USEPA) and 3.73 × 10⁻⁶ (entropy weight method)), whereas the highest carcinogenic risk index was for adult males at Huagong Hospital (8.30 × 10⁻⁵ (USEPA) and 1.55 × 10⁻⁴ (entropy weight method)). Therefore, according to the entropy weight method, the heavy metals in PM2.5 in the non-heating period were a potential carcinogenic risk in the study area or a carcinogenic risk to adults at Huagong Hospital (1.55 × 10⁻⁴ for males and 1.32 × 10⁻⁴ for females). The lowest carcinogenic risk index for the heating period was for children at Huagong Hospital (3.17 × 10⁻⁶ (USEPA) and 1.33 × 10⁻⁶ (entropy weight method)), whereas the highest carcinogenic risk index was for adult males at Xinqu Park (1.38 × 10⁻³ (USEPA) and 1.37 × 10⁻³ (entropy weight method)). During the heating period, the heavy metals in PM2.5 were a potential carcinogenic risk to people at Huagong Hospital and a carcinogenic risk to people at Xinqu Park. A nonparametric test of the population HI of the two methods in different periods showed that the two methods produced different results at Huagong Hospital (p < 0.05) but not at Xinqu Park (p > 0.05). At Huagong Hospital, the CV values of the entropy weight method were slightly higher (1.185 for the non-heating period and 0.889 for the heating period) than those of the USEPA method (1.160 for the non-heating period and 0.518 for the heating period). At Xinqu Park, the CV values of the entropy weight method were lower (0.742 for the non-heating period and 1.396 for the heating period) than those of the USEPA method (0.607 for the non-heating period and 1.396 for the heating period). The results of the two methods at Xinqu Park were similar, although the result of the USEPA method had a smaller degree of dispersion. For ILCR, the traditional USEPA method might be more applicable. At Xinqu Park, the carcinogenic risk during the heating period was higher than that in the non-heating period, a conclusion also reached in a recent study [8]. However, at Huagong Hospital, the risk of carcinogenesis was high during the non-heating period. For the different population groups, the risk of carcinogenesis was higher in adults than that in children, and the health risks of adult males were higher than those of adult females. Studies of the Pearl River delta region and Baoding City reached conclusions consistent with those of this study [8,83]. With respect to the study area, industrial emissions and coal combustion were the main sources of carcinogenic risk for the population, and heavy metals caused the highest carcinogenic risk to adult males and the lowest carcinogenic risk to children.

4. Conclusions

In this study, PM2.5 concentrations were quantified, the sources were identified, and health risks were assessed in an industrial area of northeast China. The concentrations of PM2.5 in the heating period were higher than those in the non-heating period. In addition, the PM2.5 concentrations in the old city at Huagong Hospital were higher than those at Xinqu Park. The PM2.5 concentrations of various metals differed. In general, the heavy metal concentrations in the heating period were higher than those in the non-heating period. Nonparametric tests detected differences between concentrations of heavy metals in PM2.5, indicating there were different sources of heavy metals in the study area. The PMF model identified industrial emissions as the main source of heavy metals in PM2.5, followed by coal combustion and then traffic emissions. Compared with the sources of emissions at Xinqu Park, an increased demand for coal combustion for heating during the winter led to elevated concentrations of heavy metals in PM2.5 at Huagong Hospital, demonstrating coal combustion was the most important source of pollution. In the heating period, coal combustion (59.64%) was primary heavy metal source at Huagong Hospitals, and the contribution rates of industrial emissions and traffic emissions were 21.06% and 19.30%, respectively. Industrial emissions (42.14%) were the primary source at Xinqu Park, and the contribution rates of coal combustion and traffic emissions were 34.03% and 23.83%, respectively. During the non-heating period, coal combustion (45.29%) and industrial emissions (44.59%) were the primary sources at Huagong Hospital, and the traffic emissions were 10.12%. Industrial emissions (43.64%) were the primary sources at Xinqu Park, the coal combustion and traffic emissions were 25.35% and 31.00%, respectively. Differences in the contributions of heavy metals in PM2.5 from different pollution sources affected the risks to human health. Children had the highest noncarcinogenic risk and adult females had the lowest noncarcinogenic risk, whereas adult males had the highest carcinogenic risk and children had the lowest carcinogenic risk. Furthermore, during the heating period, there were noncarcinogenic and carcinogenic risks to the public only at Xinqu Park, whereas during the non-heating period, there was potential carcinogenic risk for people in Huagong Hospitals and Xinqu Park. Compared with the traditional USEPA method, the results of the entropy weight method were also reasonable. However, when there is a difference between the two methods, the entropy weight method is recommended to assess noncarcinogenic health risks, because the result has smaller dispersion and is more representative. In contrast, the USEPA method is recommended for ILCR.

Author Contributions

Conceptualization, S.S., N.Z., S.W., X.S., D.D.; Methodology, S.S., S.W., Y.L., S.H., S.D., Q.A., P.L., X.L.; Software, S.S., N.Z., X.H.; Formal analysis, S.S., Y.L., S.D., P.L.; Investigation, S.S., S.W., Q.A.; Writing—original draft preparation, S.S., Y.L., X.L.; Writing—review and editing, S.S., N.Z., S.W., S.H., X.S., Q.A., X.L.; Visualization, S.S., X.S., Q.A., P.L., X.L., D.D.; Resources, N.Z., Y.L., S.H., X.S., Q.A., X.H.; Supervision, N.Z., S.D., P.L., X.H., D.D.; Project administration, N.Z., X.H., D.D.; Funding acquisition, N.Z.; Data curation, S.W., Y.L., S.D., P.L.; Validation, Y.L., S.H., X.L., D.D. All authors have read and agreed to the published version of the manuscript.

Funding

This work was supported by the National Natural Science Foundation of China (Grant Nos. 41722110 and 41571474), Leading Talents and Team Project of Scientific and Technological Innovation for Young and Middle-aged Groups of Jilin Province (20200301015RQ), and Major Special Program of Scientific and Technological of Jilin Province (20200503003SF).

Institutional Review Board Statement

Not applicable.

Informed Consent Statement

Not applicable.

Data Availability Statement

Not applicable.

Acknowledgments

We want to thank the editor and anonymous reviewers for their valuable comments and suggestions to this paper.

Conflicts of Interest

The authors declare no conflict of interest.

References

  1. Quan, J.; Tie, X.; Zhang, Q.; Liu, Q.; Li, X.; Gao, Y.; Zhao, D. Characteristics of heavy aerosol pollution during the 2012–2013 winter in Beijing, China. Atmos. Environ. 2014, 88, 83–89. [Google Scholar] [CrossRef]
  2. Stafoggia, M.; Bellander, T.; Bucci, S.; Davoli, M.; De Hoogh, K.; De’Donato, F.; Gariazzo, C.; Lyapustin, A.; Michelozzi, P.; Renzi, M.; et al. Estimation of daily PM10 and PM2.5 concentrations in Italy, 2013–2015, using a spatiotemporal land-use random-forest model. Environ. Int. 2019, 124, 170–179. [Google Scholar] [CrossRef] [PubMed]
  3. Al-Hemoud, A.; Gasana, J.; Al-Dabbous, A.; Alajeel, A.; Al-Shatti, A.; Behbehani, W.; Malak, M. Exposure levels of air pollution (PM2.5) and associated health risk in Kuwait. Environ. Res. 2019, 179, 108730. [Google Scholar] [CrossRef] [PubMed]
  4. Makkonen, U.; Hellén, H.; Anttila, P.; Ferm, M. Size distribution and chemical composition of airborne particles in south-eastern Finland during different seasons and wildfire episodes in 2006. Sci. Total Environ. 2010, 408, 644–651. [Google Scholar] [CrossRef]
  5. Fang, D.; Wang, Q.; Li, H.; Yu, Y.; Lu, Y.; Qian, X. Mortality effects assessment of ambient PM2.5 pollution in the 74 leading cities of China. Sci. Total Environ. 2016, 569–570, 1545–1552. [Google Scholar] [CrossRef]
  6. Kan, H.; Chen, R.; Tong, S. Ambient air pollution, climate change, and population health in China. Environ. Int. 2012, 42, 10–19. [Google Scholar] [CrossRef]
  7. Sulong, N.A.; Latif, M.T.; Khan, F.; Amil, N.; Ashfold, M.J.; Wahab, M.I.A.; Chan, K.M.; Sahani, M. Source apportionment and health risk assessment among specific age groups during haze and non-haze episodes in Kuala Lumpur, Malaysia. Sci. Total Environ. 2017, 601–602, 556–570. [Google Scholar] [CrossRef]
  8. Liang, B.; Li, X.-L.; Ma, K.; Liang, S.-X. Pollution characteristics of metal pollutants in PM2.5 and comparison of risk on human health in heating and non-heating seasons in Baoding, China. Ecotoxicol. Environ. Saf. 2019, 170, 166–171. [Google Scholar] [CrossRef]
  9. Schwarz, J.; Pokorná, P.; Rychlík, Š.; Škáchová, H.; Vlček, O.; Smolík, J.; Ždímal, V.; Hůnová, I. Assessment of air pollution origin based on year-long parallel measurement of PM2.5 and PM10 at two suburban sites in Prague, Czech Republic. Sci. Total Environ. 2019, 664, 1107–1116. [Google Scholar] [CrossRef]
  10. Li, Y.; Zhu, K.; Wang, S. Polycentric and dispersed population distribution increases PM2.5 concentrations: Evidence from 286 Chinese cities, 2001–2016. J. Clean. Prod. 2020, 248, 119202. [Google Scholar] [CrossRef]
  11. Liang, D.; Wang, Y.-Q.; Wang, Y.-J.; Ma, C. National air pollution distribution in China and related geographic, gaseous pollutant, and socio-economic factors. Environ. Pollut. 2019, 250, 998–1009. [Google Scholar] [CrossRef]
  12. Ma, B.; Wang, L.; Tao, W.; Liu, M.; Zhang, P.; Zhang, S.; Li, X.; Lu, X. Phthalate esters in atmospheric PM2.5 and PM10 in the semi-arid city of Xi’an, Northwest China: Pollution characteristics, sources, health risks, and relationships with meteorological factors. Chemosphere 2020, 242, 125226. [Google Scholar] [CrossRef]
  13. Li, X.; Jiang, L.; Bai, Y.; Yang, Y.; Liu, S.; Chen, X.; Xu, J.; Liu, Y.; Wang, Y.; Guo, X.; et al. Wintertime aerosol chemistry in Beijing during haze period: Significant contribution from secondary formation and biomass burning emission. Atmos. Res. 2019, 218, 25–33. [Google Scholar] [CrossRef]
  14. Xu, G.; Ren, X.; Xiong, K.; Li, L.; Bi, X.; Wu, Q. Analysis of the driving factors of PM2.5 concentration in the air: A case study of the Yangtze River Delta, China. Ecol. Indic. 2020, 110, 105889. [Google Scholar] [CrossRef]
  15. Luo, J.; Zhang, J.; Huang, X.; Liu, Q.; Luo, B.; Zhang, W.; Rao, Z.; Yu, Y. Characteristics, evolution, and regional differences of biomass burning particles in the Sichuan Basin, China. J. Environ. Sci. 2020, 89, 35–46. [Google Scholar] [CrossRef]
  16. Liang, L.; Wang, Z.; Li, J. The effect of urbanization on environmental pollution in rapidly developing urban agglomerations. J. Clean. Prod. 2019, 237, 117649. [Google Scholar] [CrossRef]
  17. Ledoux, F.; Kfoury, A.; Delmaire, G.; Roussel, G.; El Zein, A.; Courcot, D. Contributions of local and regional anthropogenic sources of metals in PM2.5 at an urban site in northern France. Chemosphere 2017, 181, 713–724. [Google Scholar] [CrossRef]
  18. Vannini, A.; Paoli, L.; Russo, A.; Loppi, S. Contribution of submicronic (PM1) and coarse (PM > 1) particulate matter deposition to the heavy metal load of lichens transplanted along a busy road. Chemosphere 2019, 231, 121–125. [Google Scholar] [CrossRef]
  19. Bergthorson, J.; Goroshin, S.; Soo, M.; Julien, P.; Palecka, J.; Frost, D.; Jarvis, D. Direct combustion of recyclable metal fuels for zero-carbon heat and power. Appl. Energy 2015, 160, 368–382. [Google Scholar] [CrossRef]
  20. Men, C.; Liu, R.; Xu, F.; Wang, Q.; Guo, L.; Shen, Z. Pollution characteristics, risk assessment, and source apportionment of heavy metals in road dust in Beijing, China. Sci. Total Environ. 2018, 612, 138–147. [Google Scholar] [CrossRef]
  21. Wang, W.; Yu, J.; Cui, Y.; He, J.; Xue, P.; Cao, W.; Ying, H.; Gao, W.; Yan, Y.; Hu, B.; et al. Characteristics of fine particulate matter and its sources in an industrialized coastal city, Ningbo, Yangtze River Delta, China. Atmos. Res. 2018, 203, 105–117. [Google Scholar] [CrossRef]
  22. Zheng, N.; Liu, J.; Wang, Q.; Liang, Z. Health risk assessment of heavy metal exposure to street dust in the zinc smelting district, Northeast of China. Sci. Total Environ. 2010, 408, 726–733. [Google Scholar] [CrossRef]
  23. Luo, Y.; Zhou, X.; Zhang, J.; Xiao, Y.; Wang, Z.; Zhou, Y.; Wang, W. PM2.5 pollution in a petrochemical industry city of northern China: Seasonal variation and source apportionment. Atmos. Res. 2018, 212, 285–295. [Google Scholar] [CrossRef]
  24. Guo, W.; Zhang, Z.; Zheng, N.; Luo, L.; Xiao, H.; Xiao, H. Chemical characterization and source analysis of water-soluble inorganic ions in PM2.5 from a plateau city of Kunming at different seasons. Atmos. Res. 2020, 234, 104687. [Google Scholar] [CrossRef]
  25. Tang, Z.; Zhang, L.; Huang, Q.; Yang, Y.; Nie, Z.; Cheng, J.; Yang, J.; Wang, Y.; Chai, M. Contamination and risk of heavy metals in soils and sediments from a typical plastic waste recycling area in North China. Ecotoxicol. Environ. Saf. 2015, 122, 343–351. [Google Scholar] [CrossRef]
  26. Hou, S.; Zheng, N.; Tang, L.; Ji, X.; Li, Y.; Hua, X. Pollution characteristics, sources, and health risk assessment of human exposure to Cu, Zn, Cd and Pb pollution in urban street dust across China between 2009 and 2018. Environ. Int. 2019, 128, 430–437. [Google Scholar] [CrossRef]
  27. Zhang, X.; Zhang, K.; Lv, W.; Liu, B.; Aikawa, M.; Wang, J. Characteristics and risk assessments of heavy metals in fine and coarse particles in an industrial area of central China. Ecotoxicol. Environ. Saf. 2019, 179, 1–8. [Google Scholar] [CrossRef]
  28. Perez, P.; Gramsch, E. Forecasting hourly PM2.5 in Santiago de Chile with emphasis on night episodes. Atmos. Environ. 2016, 124, 22–27. [Google Scholar] [CrossRef]
  29. U.S. EPA. Risk Assessment Guidance for Superfund, Volume I: Human Health Evaluation Manual; EPA/540/1-89/002; Office of Solid Waste and Emergency Response: Washington, DC, USA, 1989. Available online: https://www.epa.gov/risk/risk-assessment-guidance-superfund-volume-i-human-health-evaluation-manual-supplemental (accessed on 30 June 2021).
  30. Bi, C.; Chen, Y.; Zhao, Z.; Li, Q.; Zhou, Q.; Ye, Z.; Ge, X. Characteristics, sources and health risks of toxic species (PCDD/Fs, PAHs and heavy metals) in PM2.5 during fall and winter in an industrial area. Chemosphere 2020, 238, 124620. [Google Scholar] [CrossRef] [PubMed]
  31. Agarwal, A.; Mangal, A.; Satsangi, A.; Lakhani, A.; Kumari, K.M. Characterization, sources and health risk analysis of PM2.5 bound metals during foggy and non-foggy days in sub-urban atmosphere of Agra. Atmos. Res. 2017, 197, 121–131. [Google Scholar] [CrossRef]
  32. Gui, K.; Che, H.; Wang, Y.; Wang, H.; Zhang, L.; Zhao, H.; Zheng, Y.; Sun, T.; Zhang, X. Satellite-derived PM2.5 concentration trends over Eastern China from 1998 to 2016: Relationships to emissions and meteorological parameters. Environ. Pollut. 2019, 247, 1125–1133. [Google Scholar] [CrossRef]
  33. Peng, X.; Shi, G.; Liu, G.; Xu, J.; Tian, Y.; Zhang, Y.; Feng, Y.; Russell, A.G. Source apportionment and heavy metal health risk (HMHR) quantification from sources in a southern city in China, using an ME2-HMHR model. Environ. Pollut. 2017, 221, 335–342. [Google Scholar] [CrossRef]
  34. Gao, Y.; Zhang, Y.; Feng, J.; Zhu, L. Toxicokinetic-toxicodynamic modeling of cadmium and lead toxicity to larvae and adult zebrafish. Environ. Pollut. 2019, 251, 221–229. [Google Scholar] [CrossRef]
  35. Eze, C.T.; Michelangeli, F.; Otitoloju, A.A. In vitro cyto-toxic assessment of heavy metals and their binary mixtures on mast cell-like, rat basophilic leukemia (RBL-2H3) cells. Chemosphere 2019, 223, 686–693. [Google Scholar] [CrossRef]
  36. Yuan, Y.; Wu, Y.; Ge, X.; Nie, D.; Wang, M.; Zhou, H.; Chen, M. In vitro toxicity evaluation of heavy metals in urban air particulate matter on human lung epithelial cells. Sci. Total Environ. 2019, 678, 301–308. [Google Scholar] [CrossRef]
  37. He, Y.; Guo, H.; Jin, M.; Ren, P. A linguistic entropy weight method and its application in linguistic multi-attribute group decision making. Nonlinear Dyn. 2016, 84, 399–404. [Google Scholar] [CrossRef]
  38. Chaji, A. Analytic approach on maximum Bayesian entropy ordered weighted averaging operators. Comput. Ind. Eng. 2017, 105, 260–264. [Google Scholar] [CrossRef]
  39. Bordbar, M.; Neshat, A.; Javadi, S. Modification of the GALDIT framework using statistical and entropy models to assess coastal aquifer vulnerability. Hydrol. Sci. J. 2019, 64, 1117–1128. [Google Scholar] [CrossRef]
  40. Zhu, Y.; Tian, D.; Yan, F. Effectiveness of Entropy Weight Method in Decision-Making. Math. Probl. Eng. 2020, 2020, 3564835. [Google Scholar] [CrossRef]
  41. Yang, J.Y.; Zhang, L.L. Fuzzy Comprehensive Evaluation Method on Water Environmental Quality Based on Entropy Weight with Consideration of Toxicology of Evaluation Factors. Adv. Mater. Res. 2011, 356–360, 2383–2388. [Google Scholar] [CrossRef]
  42. Zhang, X.; Wang, C.; Li, E.; Xu, C. Assessment Model of Ecoenvironmental Vulnerability Based on Improved Entropy Weight Method. Sci. World J. 2014, 2014, 797814. [Google Scholar] [CrossRef] [Green Version]
  43. Zheng, N.; Wang, Q.; Zhang, X.; Zheng, D.; Zhang, Z.; Zhang, S. Population health risk due to dietary intake of heavy metals in the industrial area of Huludao city, China. Sci. Total Environ. 2007, 387, 96–104. [Google Scholar] [CrossRef]
  44. Zheng, N.; Wang, Q.; Zheng, D. Health risk of Hg, Pb, Cd, Zn, and Cu to the inhabitants around Huludao Zinc Plant in China via consumption of vegetables. Sci. Total Environ. 2007, 383, 81–89. [Google Scholar] [CrossRef]
  45. Zheng, N.; Wang, Q.; Liang, Z.; Zheng, D. Characterization of heavy metal concentrations in the sediments of three freshwater rivers in Huludao City, Northeast China. Environ. Pollut. 2008, 154, 135–142. [Google Scholar] [CrossRef]
  46. Lu, C.; Zhang, J.; Jiang, H.; Yang, J.; Zhang, J.; Wang, J.; Shan, H. Assessment of soil contamination with Cd, Pb and Zn and source identification in the area around the Huludao Zinc Plant. J. Hazard. Mater. 2010, 182, 743–748. [Google Scholar] [CrossRef]
  47. Huludao City Heating Management Measures. 2011. Available online: http://www.hld.gov.cn/zwgk/zc/zfl/201110/t20111021_457584.html (accessed on 30 June 2021).
  48. Yang, H.; Chen, J.; Wen, J.; Tian, H.; Liu, X. Composition and sources of PM2.5 around the heating periods of 2013 and 2014 in Beijing: Implications for efficient mitigation measures. Atmos. Environ. 2016, 124, 378–386. [Google Scholar] [CrossRef]
  49. Paatero, P.; Eberly, S.; Brown, S.G.; Norris, G.A. Methods for estimating uncertainty in factor analytic solutions. Atmos. Meas. Tech. 2014, 7, 781–797. [Google Scholar] [CrossRef] [Green Version]
  50. Deng, J.; Zhang, Y.; Qiu, Y.; Zhang, H.; Du, W.; Xu, L.; Hong, Y.; Chen, Y.; Chen, J. Source apportionment of PM2.5 at the Lin’an regional background site in China with three receptor models. Atmos. Res. 2018, 202, 23–32. [Google Scholar] [CrossRef]
  51. Tan, J.; Duan, J.-C.; Ma, Y.-L.; Yang, F.-M.; Cheng, Y.; He, K.-B.; Yu, Y.-C.; Wang, J.-W. Source of atmospheric heavy metals in winter in Foshan, China. Sci. Total Environ. 2014, 493, 262–270. [Google Scholar] [CrossRef]
  52. Chen, X.; Lu, X. Contamination characteristics and source apportionment of heavy metals in topsoil from an area in Xi’an city, China. Ecotoxicol. Environ. Saf. 2018, 151, 153–160. [Google Scholar] [CrossRef]
  53. Callén, M.S.; Iturmendi, A.; López, J.M. Source apportionment of atmospheric PM2.5-bound polycyclic aromatic hydrocarbons by a PMF receptor model. Assessment of potential risk for human health. Environ. Pollut. 2014, 195, 167–177. [Google Scholar] [CrossRef]
  54. Lu, Z.; Liu, Q.; Xiong, Y.; Huang, F.; Zhou, J.; Schauer, J.J. A hybrid source apportionment strategy using positive matrix factorization (PMF) and molecular marker chemical mass balance (MM-CMB) models. Environ. Pollut. 2018, 238, 39–51. [Google Scholar] [CrossRef] [PubMed]
  55. Gao, P.; Guo, H.; Zhang, Z.; Ou, C.; Hang, J.; Fan, Q.; He, C.; Wu, B.; Feng, Y.; Xing, B. Bioaccessibility and exposure assessment of trace metals from urban airborne particulate matter (PM10 and PM2.5) in simulated digestive fluid. Environ. Pollut. 2018, 242, 1669–1677. [Google Scholar] [CrossRef] [PubMed]
  56. Gao, Y.; Guo, X.; Ji, H.; Li, C.; Ding, H.; Briki, M.; Tang, L.; Zhang, Y. Potential threat of heavy metals and PAHs in PM2.5 in different urban functional areas of Beijing. Atmos. Res. 2016, 178–179, 6–16. [Google Scholar] [CrossRef]
  57. Gao, Y.; Guo, X.; Li, C.; Ding, H.; Tang, L.; Ji, H. Characteristics of PM2.5 in Miyun, the northeastern suburb of Beijing: Chemical composition and evaluation of health risk. Environ. Sci. Pollut. Res. 2015, 22, 16688–16699. [Google Scholar] [CrossRef] [PubMed]
  58. U.S. EPA. Exposure Factors Handbook 2011 Edition (Final); EPA/600/R-09/052F; U.S. Environmental Protection Agency: Washington, DC, USA, 2011. Available online: https://cfpub.epa.gov/si/si_public_record_report.cfm?Lab=NCEA&count=10000&dirEntry.Id=236252&searchall=&showcriteria=2&simplesearch=0&timstype= (accessed on 30 June 2021).
  59. Di Vaio, P.; Magli, E.; Caliendo, G.; Corvino, A.; Fiorino, F.; Frecentese, F.; Saccone, I.; Santagada, V.; Severino, B.; Onorati, G.; et al. Heavy Metals Size Distribution in PM10 and Environmental-Sanitary Risk Analysis in Acerra (Italy). Atmosphere 2018, 9, 58. [Google Scholar] [CrossRef] [Green Version]
  60. Sulaymon, I.D.; Mei, X.; Yang, S.; Chen, S.; Zhang, Y.; Hopke, P.K.; Schauer, J.J.; Zhang, Y. PM2.5 in Abuja, Nigeria: Chemical characterization, source apportionment, temporal variations, transport pathways and the health risks assessment. Atmos. Res. 2020, 237, 104833. [Google Scholar] [CrossRef]
  61. Salameh, D.; Pey, J.; Bozzetti, C.; El Haddad, I.; Detournay, A.; Sylvestre, A.; Canonaco, F.; Armengaud, A.; Piga, D.; Robin, D.; et al. Sources of PM2.5 at an urban-industrial Mediterranean city, Marseille (France): Application of the ME-2 solver to inorganic and organic markers. Atmos. Res. 2018, 214, 263–274. [Google Scholar] [CrossRef] [Green Version]
  62. Harte, J.; Newman, E. Maximum information entropy: A foundation for ecological theory. Trends Ecol. Evol. 2014, 29, 384–389. [Google Scholar] [CrossRef]
  63. Wang, J.; Hu, Z.; Chen, Y.; Chen, Z.; Xu, S. Contamination characteristics and possible sources of PM10 and PM2.5 in different functional areas of Shanghai, China. Atmos. Environ. 2013, 68, 221–229. [Google Scholar] [CrossRef]
  64. Kong, L.; Tan, Q.; Feng, M.; Qu, Y.; An, J.; Liu, X.; Cheng, N.; Deng, Y.; Zhai, R.; Wang, Z. Investigating the characteristics and source analyses of PM2.5 seasonal variations in Chengdu, Southwest China. Chemosphere 2020, 243, 125267. [Google Scholar] [CrossRef]
  65. Liu, B.; Song, N.; Dai, Q.; Mei, R.; Sui, B.; Bi, X.; Feng, Y. Chemical composition and source apportionment of ambient PM2.5 during the non-heating period in Taian, China. Atmos. Res. 2016, 170, 23–33. [Google Scholar] [CrossRef]
  66. Hao, Y.; Meng, X.; Yu, X.; Lei, M.; Li, W.; Yang, W.; Shi, F.; Xie, S. Quantification of primary and secondary sources to PM2.5 using an improved source regional apportionment method in an industrial city, China. Sci. Total Environ. 2020, 706, 135715. [Google Scholar] [CrossRef]
  67. Olawoyin, R.; Schweitzer, L.; Zhang, K.; Okareh, O.; Slates, K. Index analysis and human health risk model application for evaluating ambient air-heavy metal contamination in Chemical Valley Sarnia. Ecotoxicol. Environ. Saf. 2018, 148, 72–81. [Google Scholar] [CrossRef]
  68. Tao, J.; Zhang, L.; Cao, J.; Zhong, L.; Chen, D.; Yang, Y.; Chen, D.; Chen, L.; Zhang, Z.; Wu, Y.; et al. Source apportionment of PM2.5 at urban and suburban areas of the Pearl River Delta region, south China—With emphasis on ship emissions. Sci. Total Environ. 2017, 574, 1559–1570. [Google Scholar] [CrossRef]
  69. Chen, Y.-C.; Hsu, C.-Y.; Lin, S.-L.; Chang-Chien, G.-P.; Chen, M.-J.; Fang, G.-C.; Chiang, H.-C. Characteristics of Concentrations and Metal Compositions for PM2.5 and PM2.5–10 in Yunlin County, Taiwan during Air Quality Deterioration. Aerosol Air Qual. Res. 2015, 15, 2571–2583. [Google Scholar] [CrossRef]
  70. Gupta, T.; Mandariya, A. Sources of submicron aerosol during fog-dominated wintertime at Kanpur. Environ. Sci. Pollut. Res. 2013, 20, 5615–5629. [Google Scholar] [CrossRef]
  71. Liu, X.; Ouyang, W.; Shu, Y.; Tian, Y.; Feng, Y.; Zhang, T.; Chen, W. Incorporating bioaccessibility into health risk assessment of heavy metals in particulate matter originated from different sources of atmospheric pollution. Environ. Pollut. 2019, 254, 113113. [Google Scholar] [CrossRef]
  72. Mohanraj, R.; Azeez, P.A.; Priscilla, T. Heavy Metals in Airborne Particulate Matter of Urban Coimbatore. Arch. Environ. Contam. Toxicol. 2004, 47, 162–167. [Google Scholar] [CrossRef]
  73. Gioda, A.; Pérez, U.; Rosa, Z.; Jimenez-Velez, B.D. Concentration of Trace Elements in Airborne PM10 from Jobos Bay National Estuary, Puerto Rico. Water Air Soil Pollut. 2006, 174, 141–159. [Google Scholar] [CrossRef]
  74. Duan, J.; Tan, J. Atmospheric heavy metals and Arsenic in China: Situation, sources and control policies. Atmos. Environ. 2013, 74, 93–101. [Google Scholar] [CrossRef]
  75. Khillare, P.S.; Sarkar, S. Airborne inhalable metals in residential areas of Delhi, India: Distribution, source apportionment and health risks. Atmos. Pollut. Res. 2012, 3, 46–54. [Google Scholar] [CrossRef] [Green Version]
  76. Li, Y.; Yu, Y.; Zheng, N.; Hou, S.; Song, X.; Dong, W. Metallic elements in human hair from residents in smelting districts in northeast China: Environmental factors and differences in ingestion media. Environ. Res. 2020, 182, 108914. [Google Scholar] [CrossRef] [PubMed]
  77. Kuerban, M.; Waili, Y.; Fan, F.; Liu, Y.; Qin, W.; Dore, A.J.; Peng, J.; Xu, W.; Zhang, F. Spatio-temporal patterns of air pollution in China from 2015 to 2018 and implications for health risks. Environ. Pollut. 2020, 258, 113659. [Google Scholar] [CrossRef]
  78. Department of Ecology and Environment of Liaoning Province. 2015 Annual Environmental Statistics of Liaoning Province. 2017. Available online: http://sthj.ln.gov.cn/xxgk/zwgk/hjcjnb/201711/t20171106_88215.html (accessed on 30 June 2021).
  79. Ni, T.; Han, B.; Bai, Z. Source Apportionment of PM10 in Four Cities of Northeastern China. Aerosol Air Qual. Res. 2012, 12, 571–582. [Google Scholar] [CrossRef] [Green Version]
  80. Behrooz, R.D.; Kaskaoutis, D.; Grivas, G.; Mihalopoulos, N. Human health risk assessment for toxic elements in the extreme ambient dust conditions observed in Sistan, Iran. Chemosphere 2021, 262, 127835. [Google Scholar] [CrossRef]
  81. Han, W.; Gao, G.; Geng, J.; Li, Y.; Wang, Y. Ecological and health risks assessment and spatial distribution of residual heavy metals in the soil of an e-waste circular economy park in Tianjin, China. Chemosphere 2018, 197, 325–335. [Google Scholar] [CrossRef]
  82. Wu, Y.; Li, G.; Yang, Y.; An, T. Pollution evaluation and health risk assessment of airborne toxic metals in both indoors and outdoors of the Pearl River Delta, China. Environ. Res. 2019, 179, 108793. [Google Scholar] [CrossRef]
  83. Hime, N.J.; Marks, G.B.; Cowie, C.T. A Comparison of the Health Effects of Ambient Particulate Matter Air Pollution from Five Emission Sources. Int. J. Environ. Res. Public Health 2018, 15, 1206. [Google Scholar] [CrossRef] [Green Version]
Figure 1. Study area. S1: Xinqu Park sampling area; S2: Huagong Hospital sampling area.
Atmosphere 12 00852 g001
Figure 2. Heavy metal concentrations of PM2.5 in Huagong Hospital and Xinqu Park. Note: (a) represents April to June; (b) represents July to September; (c) represents October to De-cember; (d) represents January to March.
Atmosphere 12 00852 g002
Figure 3. Source profiles and percentage contributions of heavy metals in PM2.5 by PMF.
Atmosphere 12 00852 g003
Figure 4. Contribution of PM2.5 heavy metals from different source. Note: (A) represents non-heating period of Huagong Hospital in 2015; (B) represents heating period of Huagong Hospital in 2015; (C) represents non-heating period of Xinqu Park in 2015; (D) represents heating period of Xinqu Park in 2015.
Atmosphere 12 00852 g004
Figure 5. Risk indices of the two methods. Note: (A) represents non-heating period in Huagong Hospital; (B) represents heating period in Huagong Hospital; (C) represents non-heating period in Xinqu Park; (D) represents heating period in Xinqu Park. Children: 0–16 years; males: 17–70 years; females: 17–70 years. EWM: entropy weight method.
Atmosphere 12 00852 g005
Publisher’s Note: MDPI stays neutral with regard to jurisdictional claims in published maps and institutional affiliations.

