Article

Impacts of Non-Local versus Local Moisture Sources on a Heavy (and Deadly) Rain Event in Israel

1
Department of Earth Sciences, The Hebrew University of Jerusalem, Givat Ram, Jerusalem 9190401, Israel
2
Weather It Is, Ltd., Jerusalem 9134401, Israel
3
Interdisciplinary Center Herzliya (IDC), School of Sustainability, Herzliya 4610101, Israel
4
Israel Meteorological Service, Bet Dagan 5025001, Israel
5
Department of Physics, Ariel University, Ariel 40700, Israel
6
Eastern R&D Center, Ariel 40700, Israel
*
Author to whom correspondence should be addressed.
Atmosphere 2021, 12(7), 855; https://doi.org/10.3390/atmos12070855
Submission received: 6 May 2021 / Revised: 24 June 2021 / Accepted: 26 June 2021 / Published: 30 June 2021

Abstract

:
Motivated by poor forecasting of a deadly convective event within the Levant, the factor separation technique was used to investigate the impact of non-local versus local moisture sources on simulated precipitation and lightning rates in central and southern Israel on 25 and 26 April 2018. Both days saw unusually heavy rains, and it was hypothesized that antecedent precipitation on 25 April contributed to the development of deadly flooding late morning on the 26th, as well as strong lightning and heavy rains later the same day. Antecedent precipitation led to an increase in the precipitable water content and an overall increase in instability as measured by the Convective Available Potential Energy (CAPE). The deadly flood occurred in the area of the Tzafit river gorge (hereafter, Tzafit river), about 25 km southeast of the city of Dimona, a semi-arid region in the northeastern Negev desert. The heavy rains and strong lightning occurred throughout the Levant with local peaks in the vicinity of Jerusalem. Factor separation conducted in model simulations showed that local ground moisture sources had a large impact on the CAPE and subsequent precipitation and lightning rates in the area of Jerusalem, while non-local moisture sources enabled weak convection to occur over broad areas, with particularly strong convection in the area of the Tzafit river. The coupled impact of both moisture sources also led to localized enhanced areas of convective activity. The results suggest that forecast models for the Levant should endeavor to incorporate an accurate depiction of soil moisture to predict convective rain, especially during the typically drier spring-time season.

1. Introduction

A tragedy occurred on 26 April 2018 when 10 students hiking in the Tzafit river were swept away by a flash flood (https://www.timesofisrael.com/nahal-tzafit-where-9-students-died-in-a-flood-is-a-popular-canyon-trail/, accessed on 1 May 2021). In the late afternoon of that day, Jerusalem streets filled with water (https://www.washingtonpost.com/news/capital-weather-gang/wp/2018/04/27/the-weather-in-the-middle-east-has-gone-haywire-due-to-freak-storm/, accessed on 1 May 2021), as heavy rains (~50 mm), high total lightning rates, and hail were recorded in less than an hour. The previous day, heavy rains affected much of the Levant, including Israel, which themselves were preceded a few days earlier by lighter episodes of precipitation over northern areas and desert areas to the south and east of Israel. Such antecedent precipitation impacted the calculated soil moisture index both within Israel and in surrounding areas prior to the floods on 26 April 2018 (see Figure 1).
It is hypothesized that antecedent precipitation provided local and non-local moisture sources, which individually and synergistically led to the onset and intensification of thunderstorm development on 26 April 2018 [1,2].
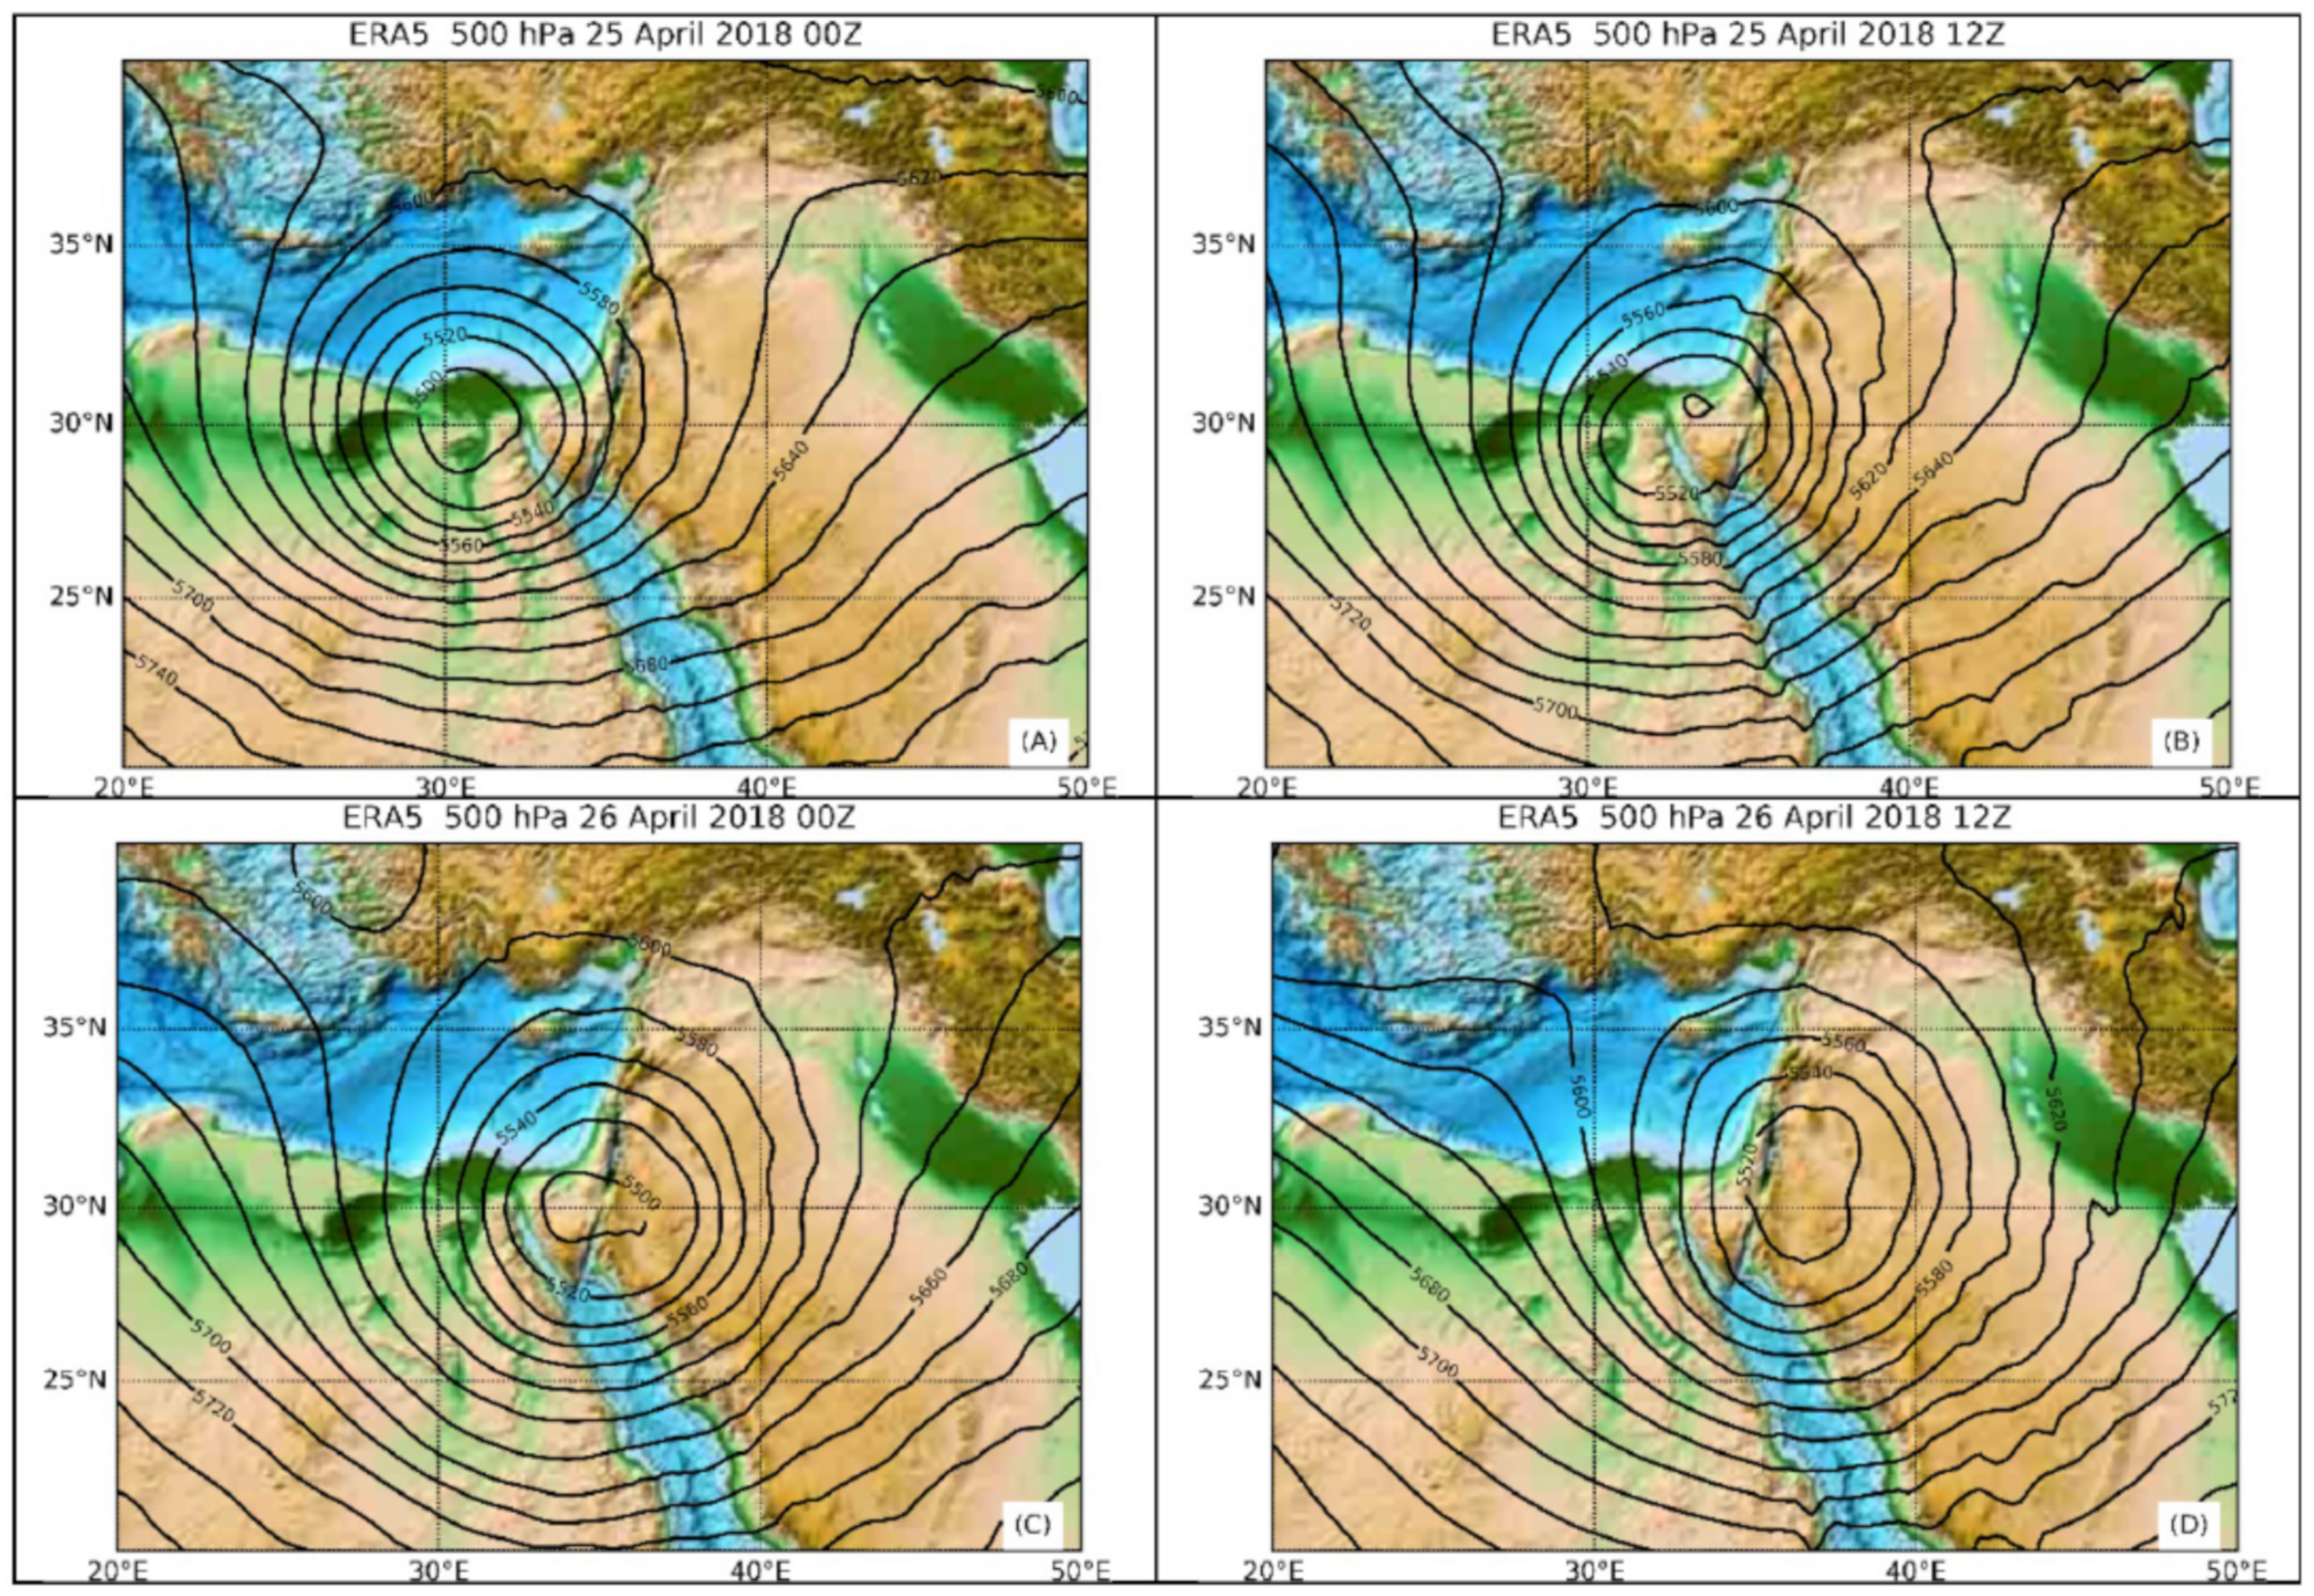
To put the event in a meteorological context, we note that on 25–27 April 2018, an extreme precipitation event occurred in the Levant. Precipitation intensities with a return period of 75 to 100 years resulted in flash floods of a high magnitude (with a return period of 10 to 50 years), claiming 46 casualties in Israel and Jordan [3]. Such thunderstorms occurred in response to the passage of a very cold upper low-pressure system transversing Egypt, Israel, and Jordan, which provided support for Red-Sea surface trough development, a synoptic-scale weather system known to produce a prolific amount of lightning [4]. Dayan et al. [5] analyzed the dynamic and thermodynamic conditions of this intense storm. An upper-level cut-off low-pressure area with geopotential height minimum located over north-central Egypt at 0000 UTC 25 April 2018 (Figure 2A) moved eastward, preserving its intensity over the next 36 h as it moved through the Sinai Peninsula at 1200 UTC (Figure 2B), across Israel and Jordan at 0000 UTC 26 April 2018 (Figure 2C), and then northeast towards Syria at 0000 UTC 26 April 2018 (Figure 2D).
Cut-off lows such as the one described above are often associated with high-impact weather [6], as a pool of cold air and cyclonic circulation induce large areas of deep convective instability. In this event, the K index was above 30 °C, indicating thunderstorm potential based on the vertical temperature lapse rate, as well as the amount and vertical extent of low-level moisture in the atmosphere. The counterclockwise flow around the center of the low drew substantial amounts of dust northward into the region, but also meant that moisture sources besides the Mediterranean Sea could have potentially contributed to the intensity of thunderstorm development, especially after the storm brought heavy rains to a wide area on 25 April 2018.
For example, Dayan et al. [5] found that three moisture sources were responsible for the severity and long duration of this rainstorm event. One was of a tropical nature, originating in East Africa. This was most likely the result of strong southwesterly winds as the storm moved into the Sinai and then into Israel (Figure 2B). Moisture originating from tropical sources during such rainstorms enriches the mid-atmospheric levels, which makes the rain formation less sensitive to the availability of low-level moisture. Hence rain cells are expected not only over mountain upslopes but also over low terrains such as the one that caused the deadly flood in the Tzafit river [5]. The second moisture source originated from Iraq, via deep moist convection. This was most likely the result of the storm moving across Israel into Jordan (Figure 2C), as it was shifting slightly northeastward towards Syria, thus drawing moisture through southeasterly flows from the Tigris and Euphrates river deltas in Iraq. The third was at the lower levels and was advected inland from the Mediterranean Sea by northwesterly winds (Figure 2D). As the storm shifted northeastwards towards Iraq, moisture sources from the east and the Mediterranean Sea could have led to a convergence zone over the Jerusalem central mountains.
Yet, while forecasters realized that the synoptic situation might produce floods and issued general flood warnings, high-resolution forecasts provided by the Israel Meteorological Service did not predict the intensity of rain and lightning in the Jerusalem area or the actual deadly floods that occurred in the vicinity of the Tzafit gorge basin [3]. For this reason, it was hypothesized that discrepancies in forecast model initial conditions—particularly atmospheric humidity—might have contributed to model forecast errors.
For instance, Reichle et al. [7] noted discrepancies between satellite-derived soil moisture, soil moisture modelled from observations, and measured soil moisture. The presence of higher actual volumetric soil moisture compared with values in the Global Forecast Systems model (GFS) initial gridded atmospheric moisture could have been a factor in forecasting lower precipitation (or storm intensity) than was actually observed. More recently, Quiring et al. [8] and Ford et al. [9] describe the development of a high-resolution, real-time gridded soil moisture product that leverages data from in-situ networks, satellite platforms, and land surface models. Such a comprehensive dataset does not exist in the eastern Mediterranean region, and so localized forecasts must instead rely on GFS (or European Center for Medium-Range Weather Forecast; ECMWF) soil moisture gridded data. Errors in the initial distribution of soil moisture are bound to have a large impact on the prediction of streamflow, as uncertainties in precipitation forcing and prestorm soil moisture states represent important sources of error [10].
The present manuscript investigates the relative importance of local versus non-local moisture sources on convection during the heavy rain event of 25 and 26 April 2018 in Israel. Local volumetric soil moisture impacts are enabled through the assimilation of rainfall data derived from radar observations located at Bet-Degan, Israel. Non-local moisture content refers to atmospheric moisture that was advected into the local region of interest (or gridded domain). The moistening of the atmospheric column through continuous lightning assimilation is the surrogate for non-local moisture sources arising from both surface evaporation within the Levant and moisture sources non-local to the region. Section 2 reviews the observations. Section 3 discusses the methods employed. Section 4 presents results, while Section 5 summarizes and discusses the results.

2. Observations

2.1. Lightning Data

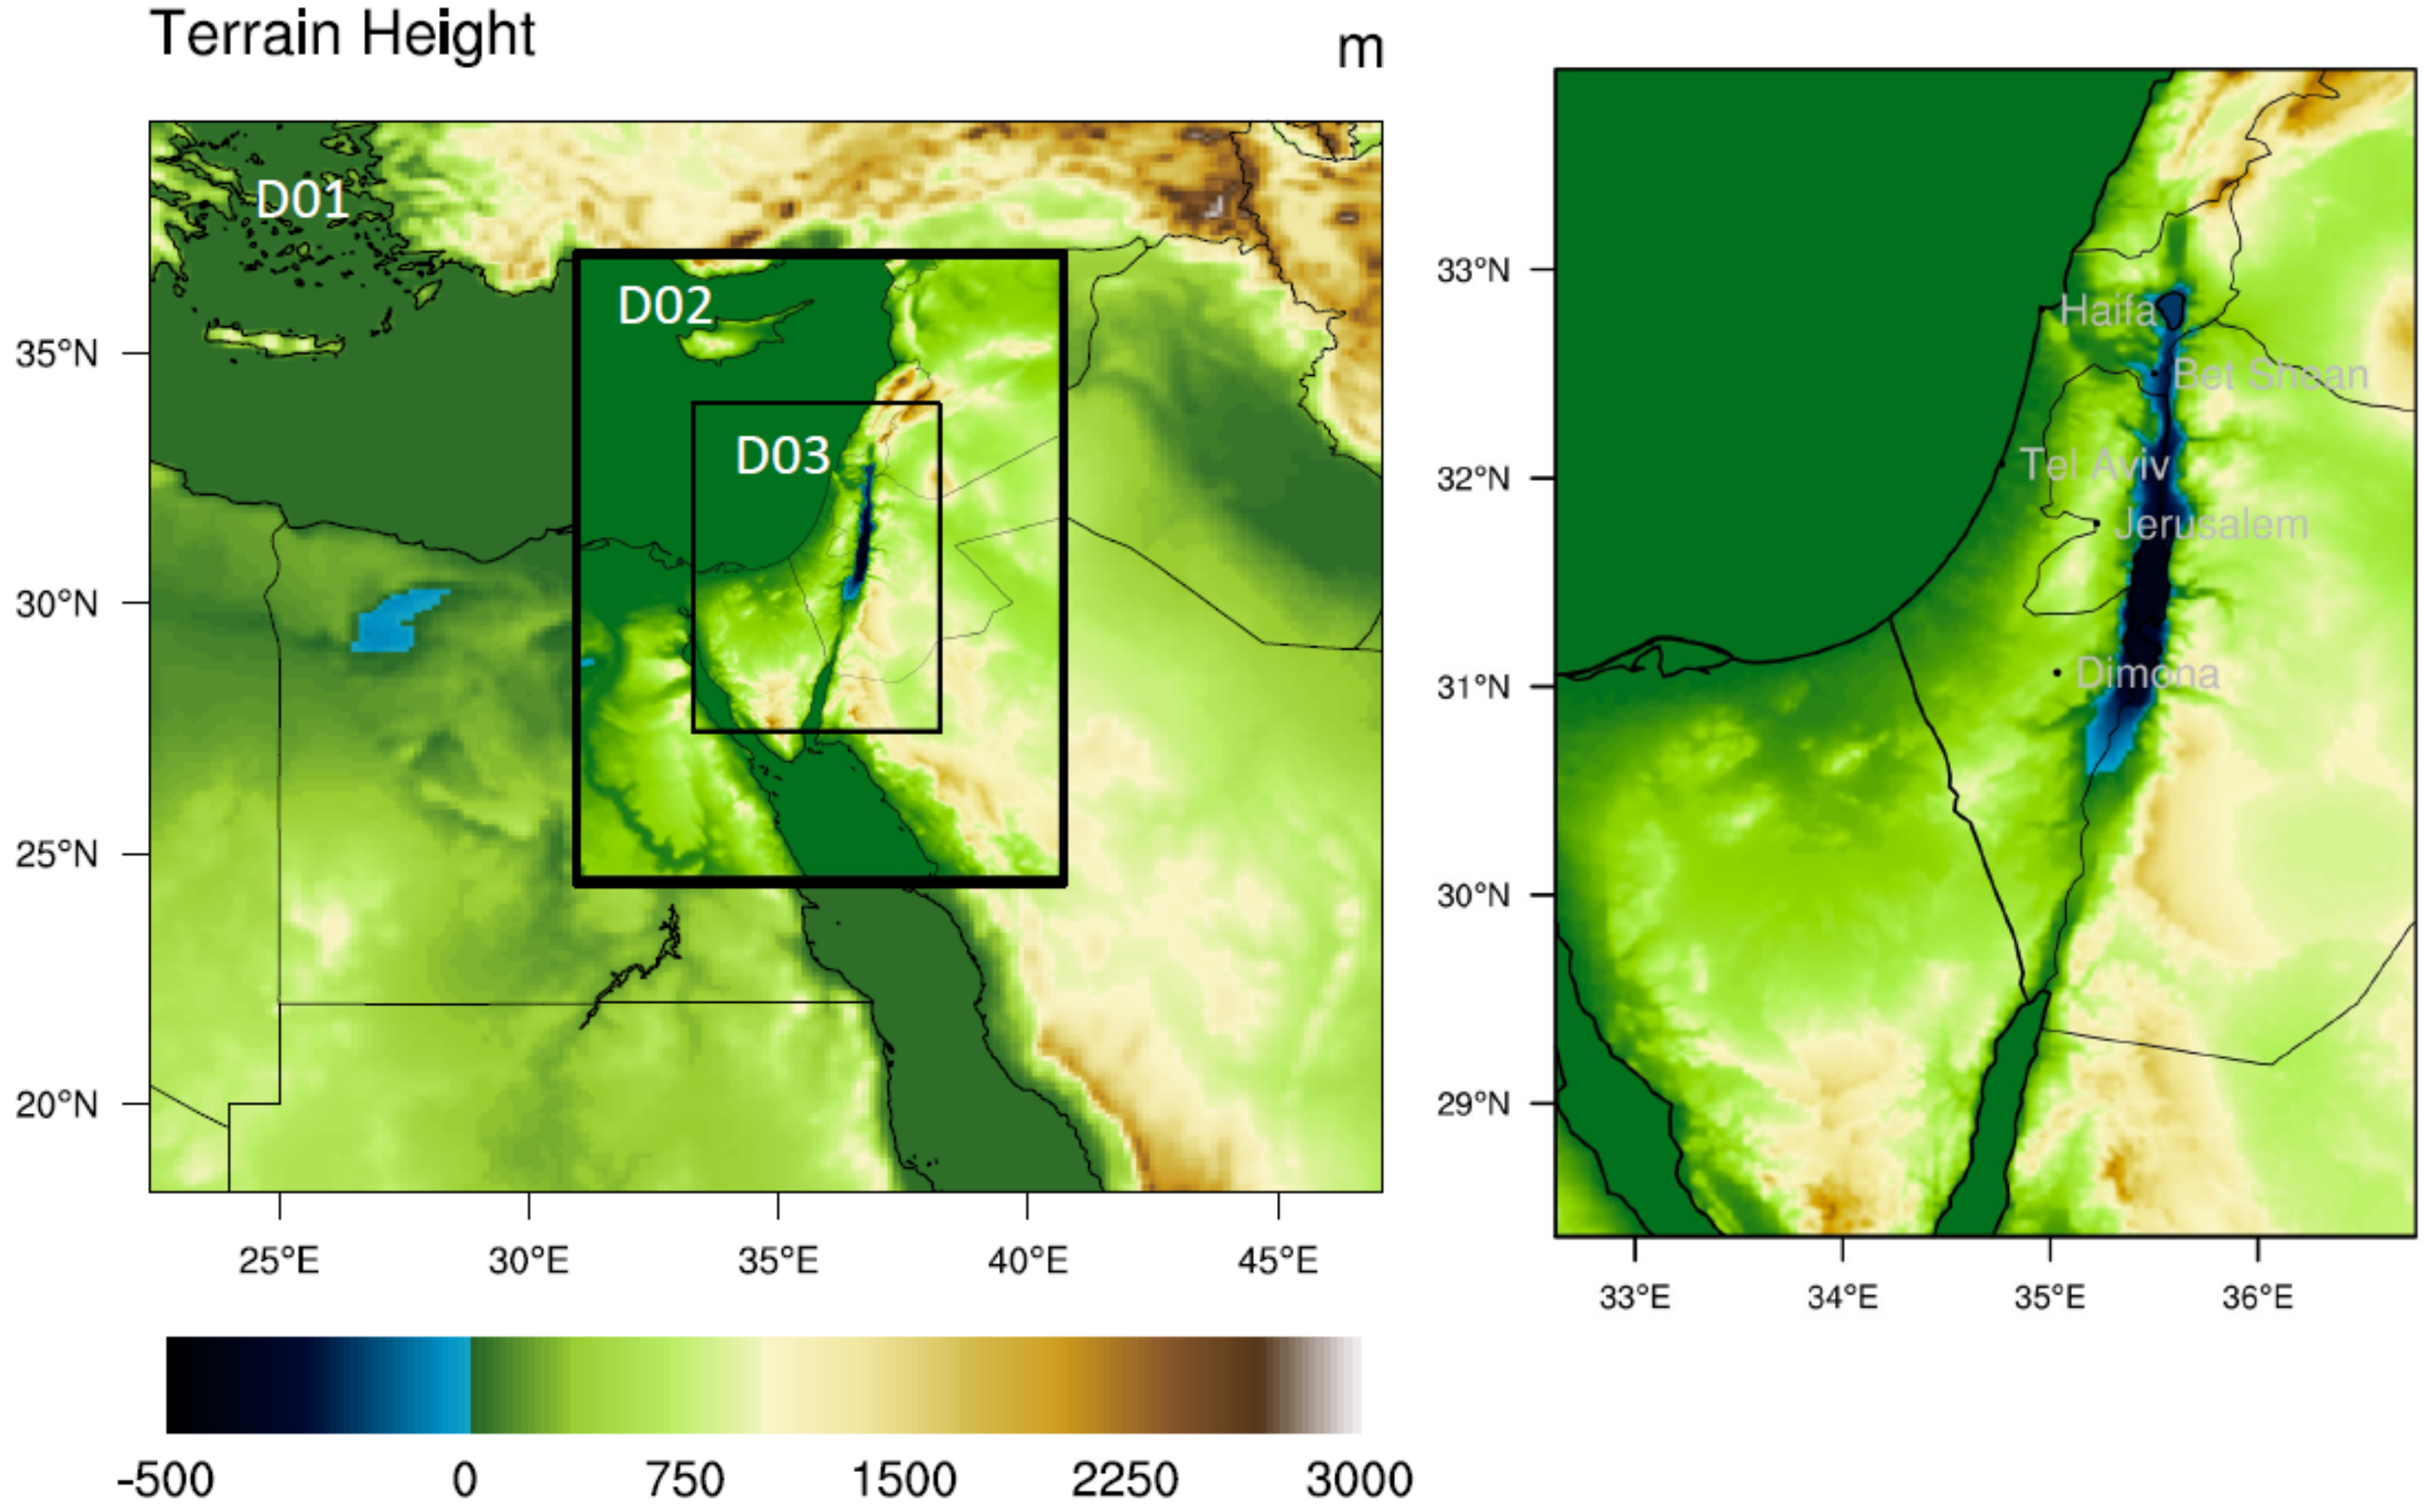
Lightning data were obtained from the Israel Total Lightning Network, which is part of Earth Networks’ Total Lightning Network (ENTLN; [11]). In the area of the model domain with 1.3 km grid spacing (see Figure 3; Domain 3), Earth Networks calculates that the network detects more than 95% of the cloud-to-ground lightning and 60–70% of the intra-cloud lightning, with a spatial accuracy within 300–400 m. Otherwise, the detection efficiency outside the 1.3 km domain and within the area of the 4 km domain is calculated to be >90% for the cloud-to-ground and 50% for the intra-cloud lightning.
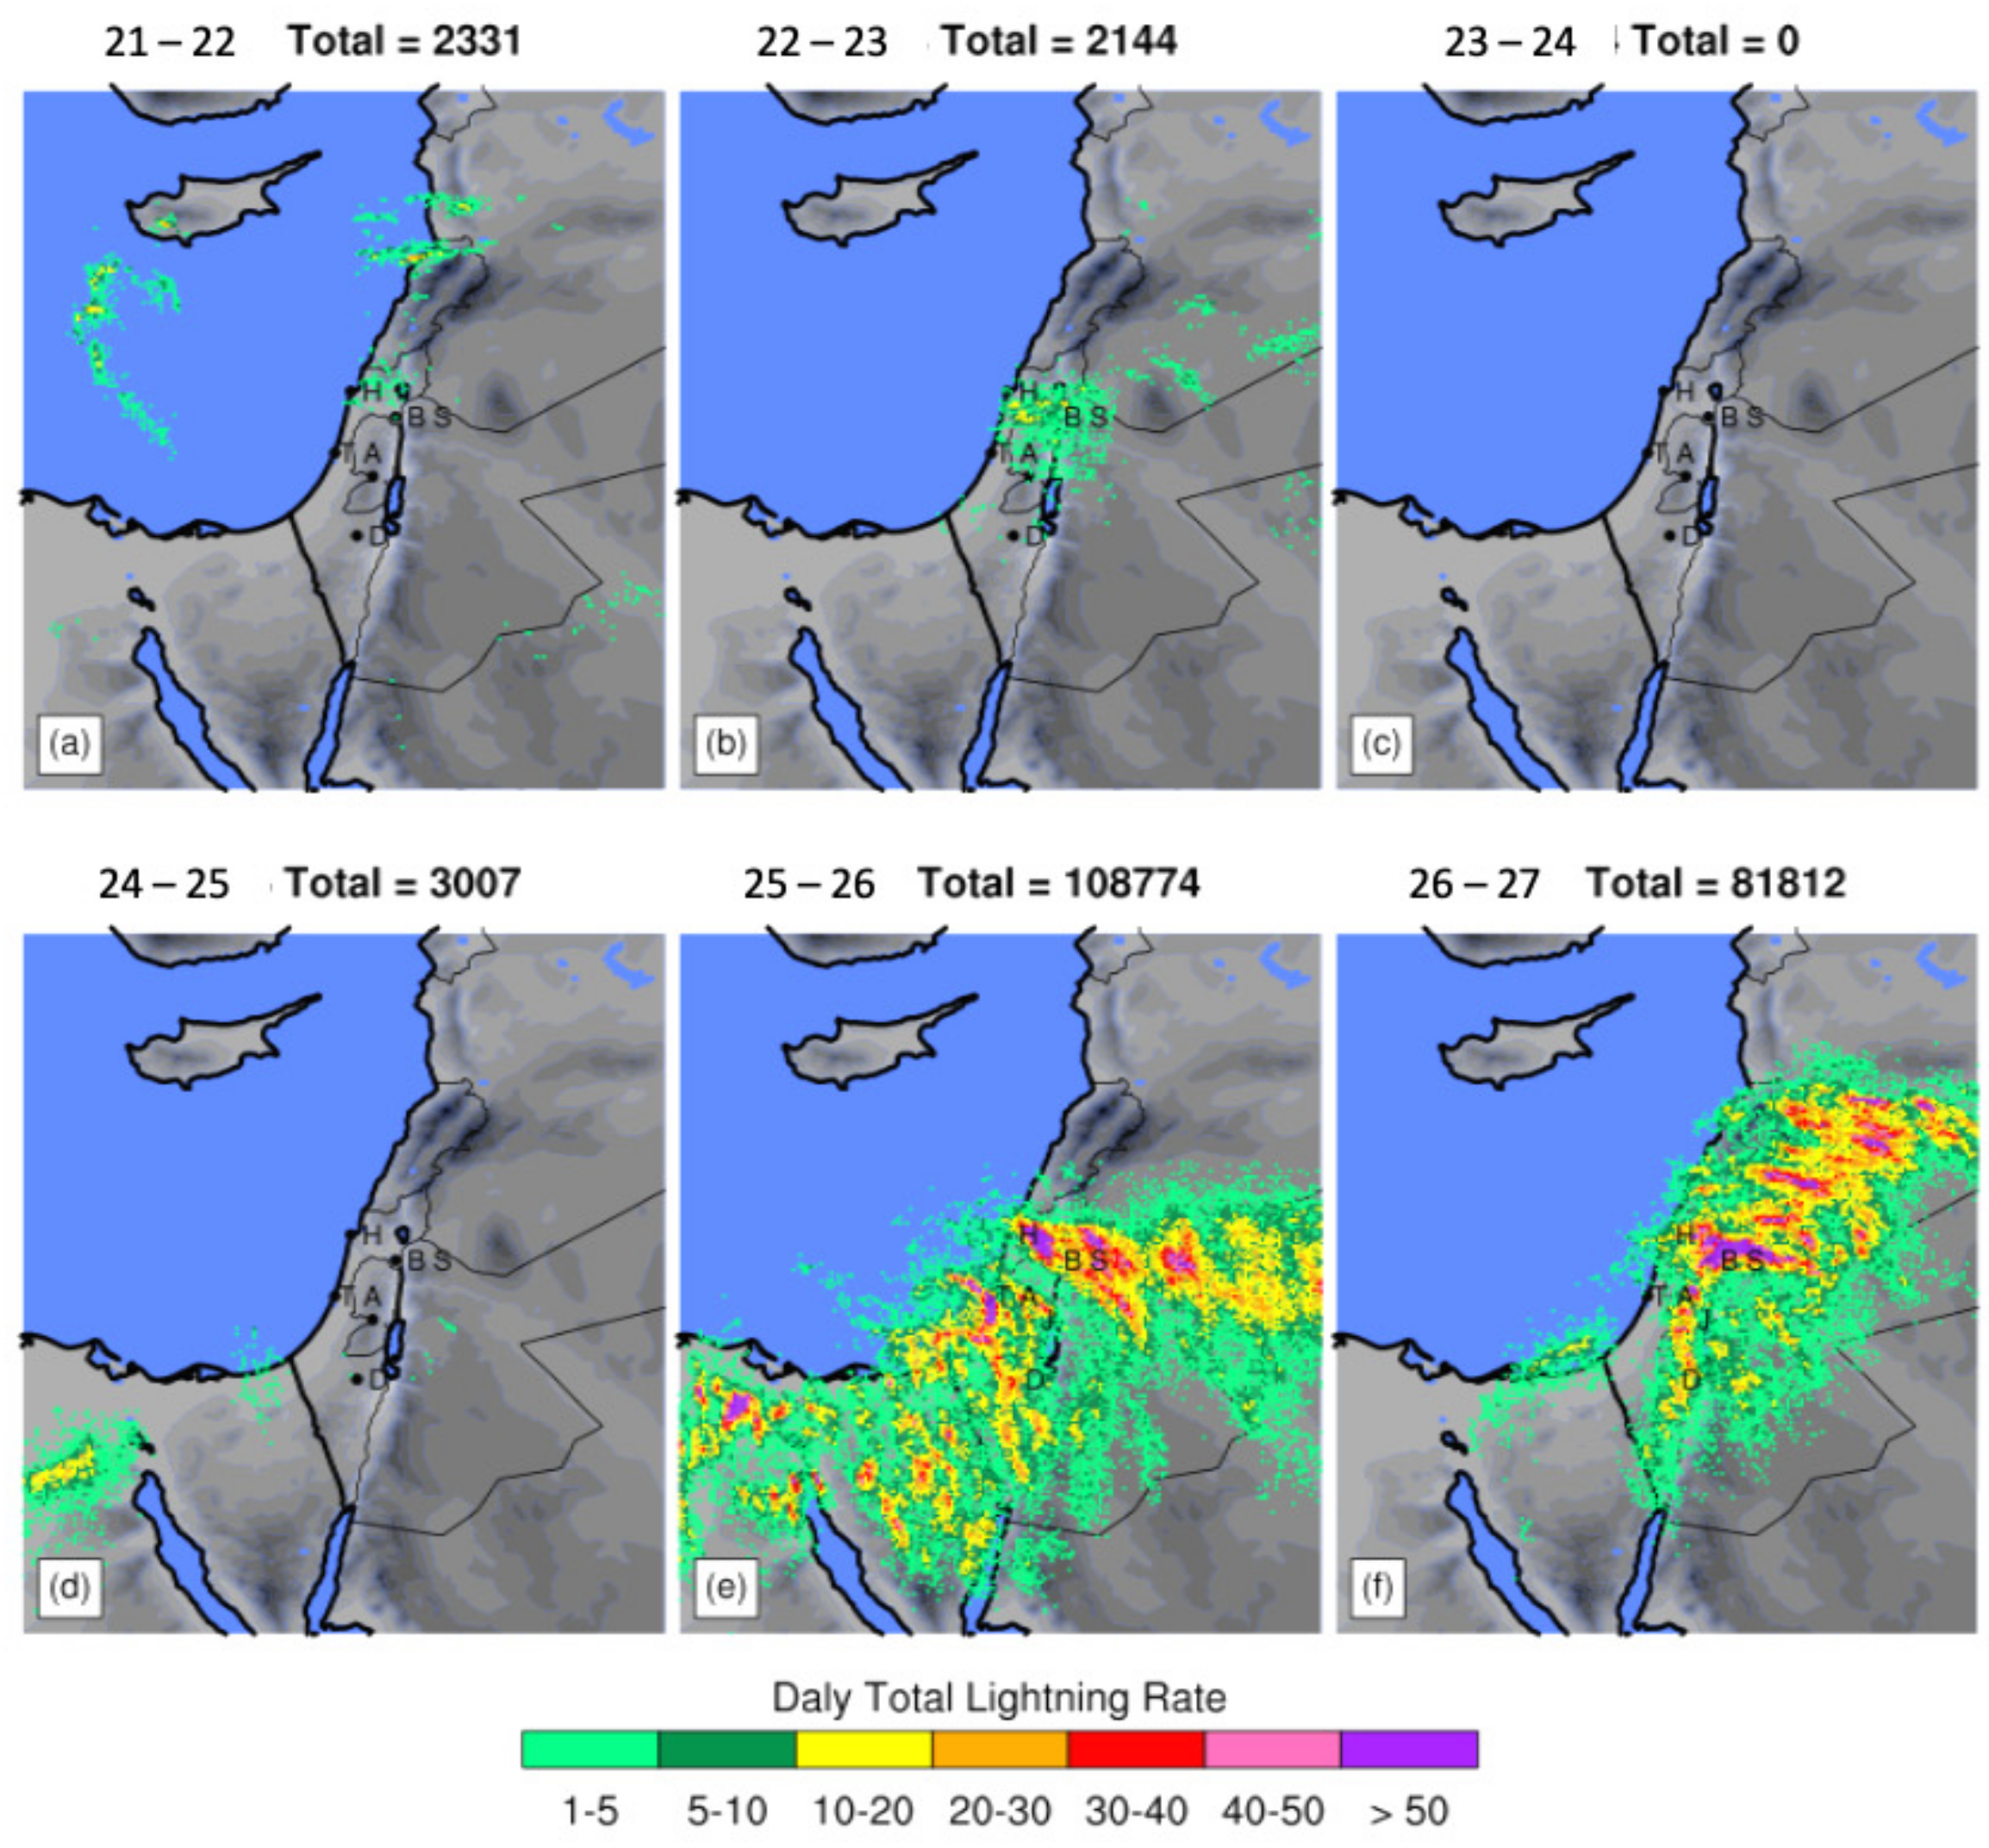
A six-day depiction of total lightning suggests that precipitation from convective storms led to an increase in antecedent precipitation prior to the storms on 26 April 2018. Figure 4 shows that localized convection occurred over northern Israel on 21 April 2018, one day after the start of the simulation experiment. More widespread convection occurred over central and northern Israel on 22 April, while there were convective storms over the northern Sinai on 24 April. There was widespread convection on 25 April over much of Egypt, also covering all of Israel and most of Jordan, as well as southern Syria. On 26 April, lightning was observed over northern Sinai, much of Israel and Jordan, and southern Syria.
The lightning data were used to provide qualitative comparisons to the model simulation results. It was also used to provide the basis for continuous moisture assimilation on the outer 4 km and 12 km domains (Figure 4; assimilated from 10-min total lightning rate). A small modification was made to the moisture assimilation scheme of Fierro et al. [12] to include a 0.25 °C degree of heating centered at the lifting condensation level. To symbolically represent the release of latent heat at cloud base, the magnitude of the heating varied vertically as the cosine of the vertical distance within half the height of the Lifting Condensation Level. As in the original scheme, the magnitude of the heating—like the moistening—depended on the hyperbolic tangent of the amount of graupel mass. As the forecast graupel amount increased, the applied heating and moistening were reduced.
The assimilation scheme is usually used for short-term initialization of convection, which then proceeds in the forecast according to the synoptic forcing. However, such an approach did not work for this case study on either the 4 km or 1.3 km grids, as the simulated convection dissipated soon after being initialized. Hence, the assimilation scheme was applied continuously on the 4 km grid and the 12 km grid (but not on the domain of the 1.3 km grid), so long as the conditions for its activation were met. The convective or stratiform clouds that developed on the 4 km grid can be considered for the purposes of this study as possible non-local sources of moisture for the 1.3 km grid domain. These sources likely arise from the advection of moisture through the outer boundaries of the 4 km grid or from surface moisture within it arising from the antecedent precipitation. Hence, the assimilation scheme and the convection it generates can be considered a correction to the WRF simulation that results from GFS analysis-based initial and boundary conditions.

2.2. Observed Precipitation

The Quantitative Precipitation Estimation (QPE) analysis is based on a constant altitude plan precipitation indicator (CAPPI at height of 1 km) from a C-Band Doppler radar located at Israel Meteorological Service (IMS) headquarters in Bet Dagan (32.01 N, 34.85 E). The Marshall–Palmer Z–R relationship, Z = 200R1.6 [13], is used to convert the reflectivity into rainfall intensity. The Integrated Nowcasting through Comprehensive Analysis (INCA) system then combines surface rain gauges with radar data in such a way that the observations at the rain gauges’ locations are reproduced [14]. There is some ambiguity regarding the conversion of radar data to precipitation amounts. Relevant to this study, the Israel meteorological service suggests that the presented values may be an underestimation of rainfall by a factor of 2, especially away from the immediate location of the weather radar near Tel Aviv.
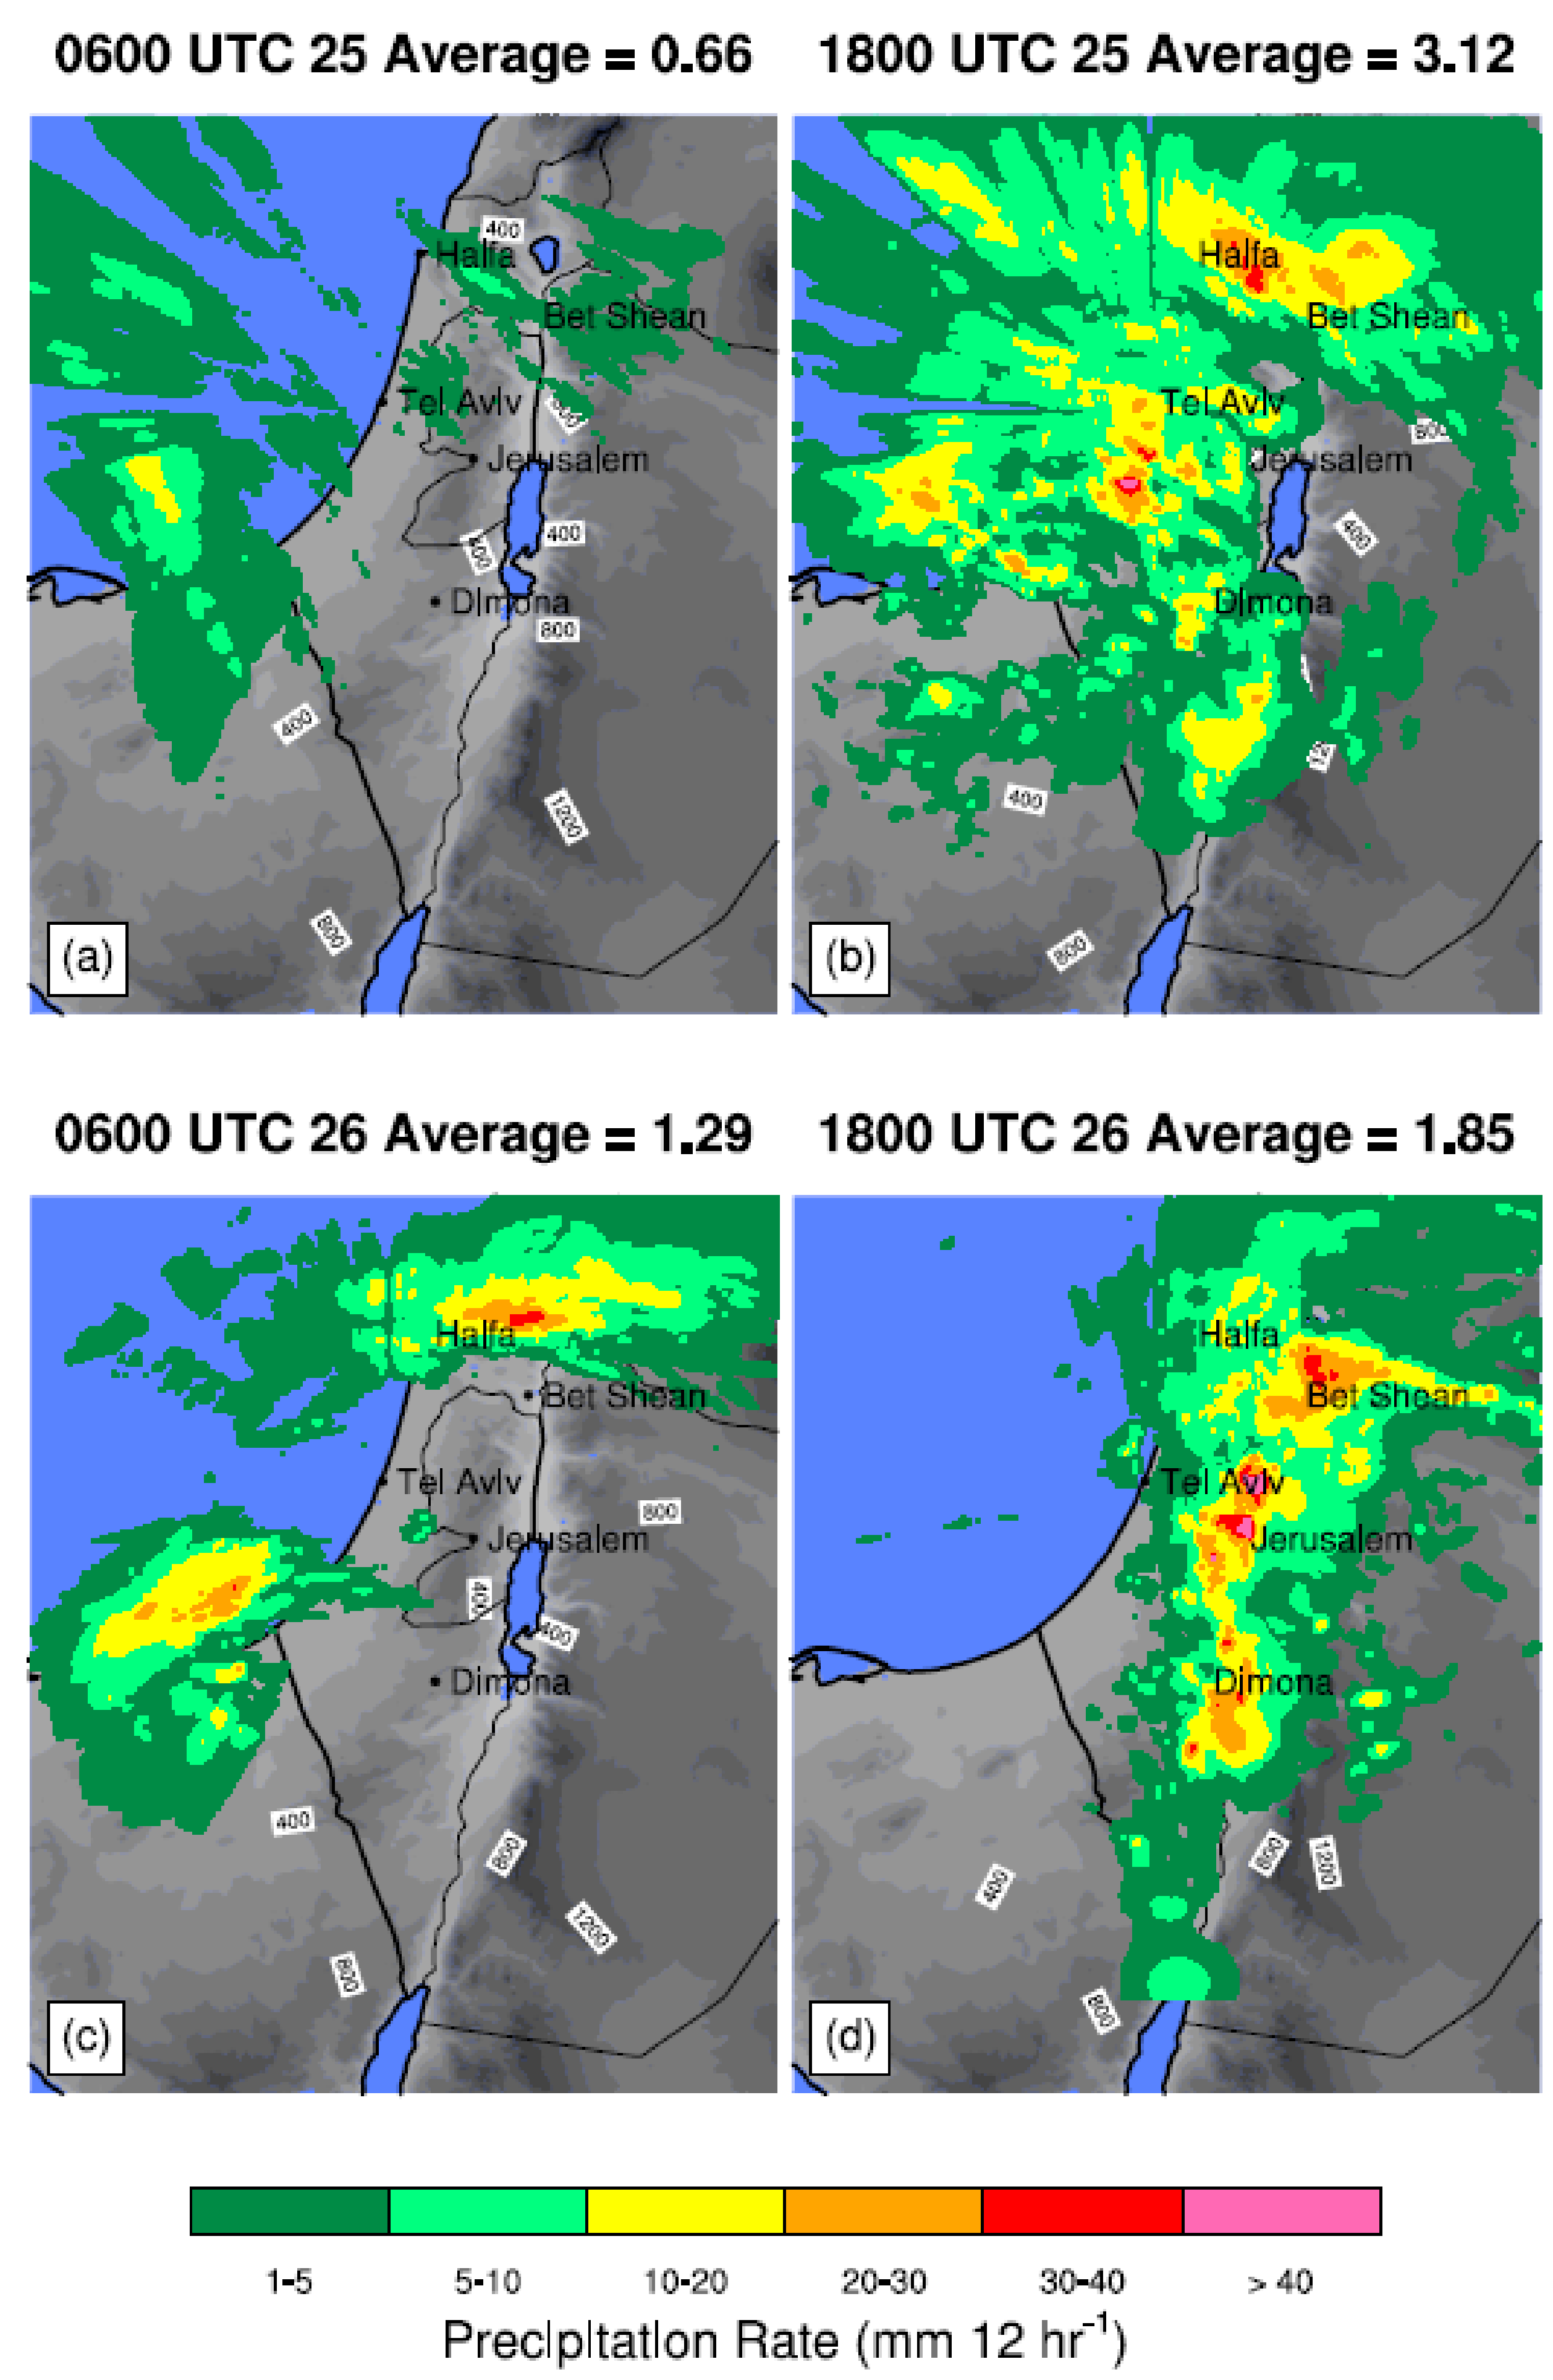
Figure 5 provides 12 h summaries of rainfall from 1800 UTC 24 April to 1800 UTC 26 April 2018. From 1800 24 April to 0600 UTC April 25, light rain occurred over northern Israel and the northern Sinai, while heavier rain approached the Israel western coastline (Figure 5a). Heavier and more widespread precipitation occurred during the daytime (Figure 5c,d; 0600–1800 UTC) on 25 and 26 April. This suggests that daytime heating of the surface and boundary layer might have led to an enhancement of convective precipitation on both days. Nevertheless, there was still heavy precipitation during the intervening nighttime over a limited area from northeastern Sinai into Israel’s southern coastal cities (Figure 5c), and from northern Israel into southern Syria. Average daytime observed land rainfall values were higher on 25 April compared to 26 April (3.12 compared to 1.85 mm), but rainfall was locally heavier in areas where flooding was more likely (e.g., river basins running from the Jerusalem, Judean hills, and Shomron mountains into the Jordan and Dead Sea Valleys, and Hazera ridge, one of the Israeli Negev desert ridges overlooking the Tzafit river gorge). For instance, on 25 April 2018, the heaviest rain was located to the southwest of Tel Aviv (10 to 20 mm, with localized areas greater than 20 mm), along with southern coastal areas (local maximum greater than 40 mm). In contrast, on 26 April, 20 to 30 mm fell to the east in the area south of Dimona, in the Tzafit river gorge. There were localized areas with even higher amounts (30–40 mm) stretching inland from near the city of Bet She’an in the northern Jordan valley and also southward to locations just south of Jerusalem, where greater than 40 mm was measured.

2.3. Estimation of Precipitable Water Vapor (PWV)

PWV values were derived from GPS tropospheric path delays using NASA’s JPL GipsyX software [15], which basically executes complex inversion algorithms [16,17] for retrieving the Zenith Total Delay (ZTD). The ZTD can be divided into two components, the Zenith Hydrostatic Delay (ZHD), which is mainly a function of the atmospheric pressure [18], and the Zenith Wet Delay (ZWD), which is estimated by subtracting the ZHD from the ZTD. The ZHD is modeled using global empirical mapping functions [19,20,21,22]. For instance, a single ground-based GPS receiver takes into account all the available GPS satellites that are in the line of sight (with the ground receiver) inside a cone area (32 × 5 km), whose data are gathered and then mapped from slant to vertical direction. Furthermore, as the ZWD is proportional to the total amount of water vapor along a vertical atmospheric column, it can be translated into PWV using a water-vapor-weighted mean temperature [18]. Here, the PWV data were extracted from 21 GPS ground stations belonging to the Survey of Israel Active Permanent Network (SOI-APN). For a more detailed description of the methodology, see Ziskin Ziv et al. [23,24]. Six daily values are presented below.
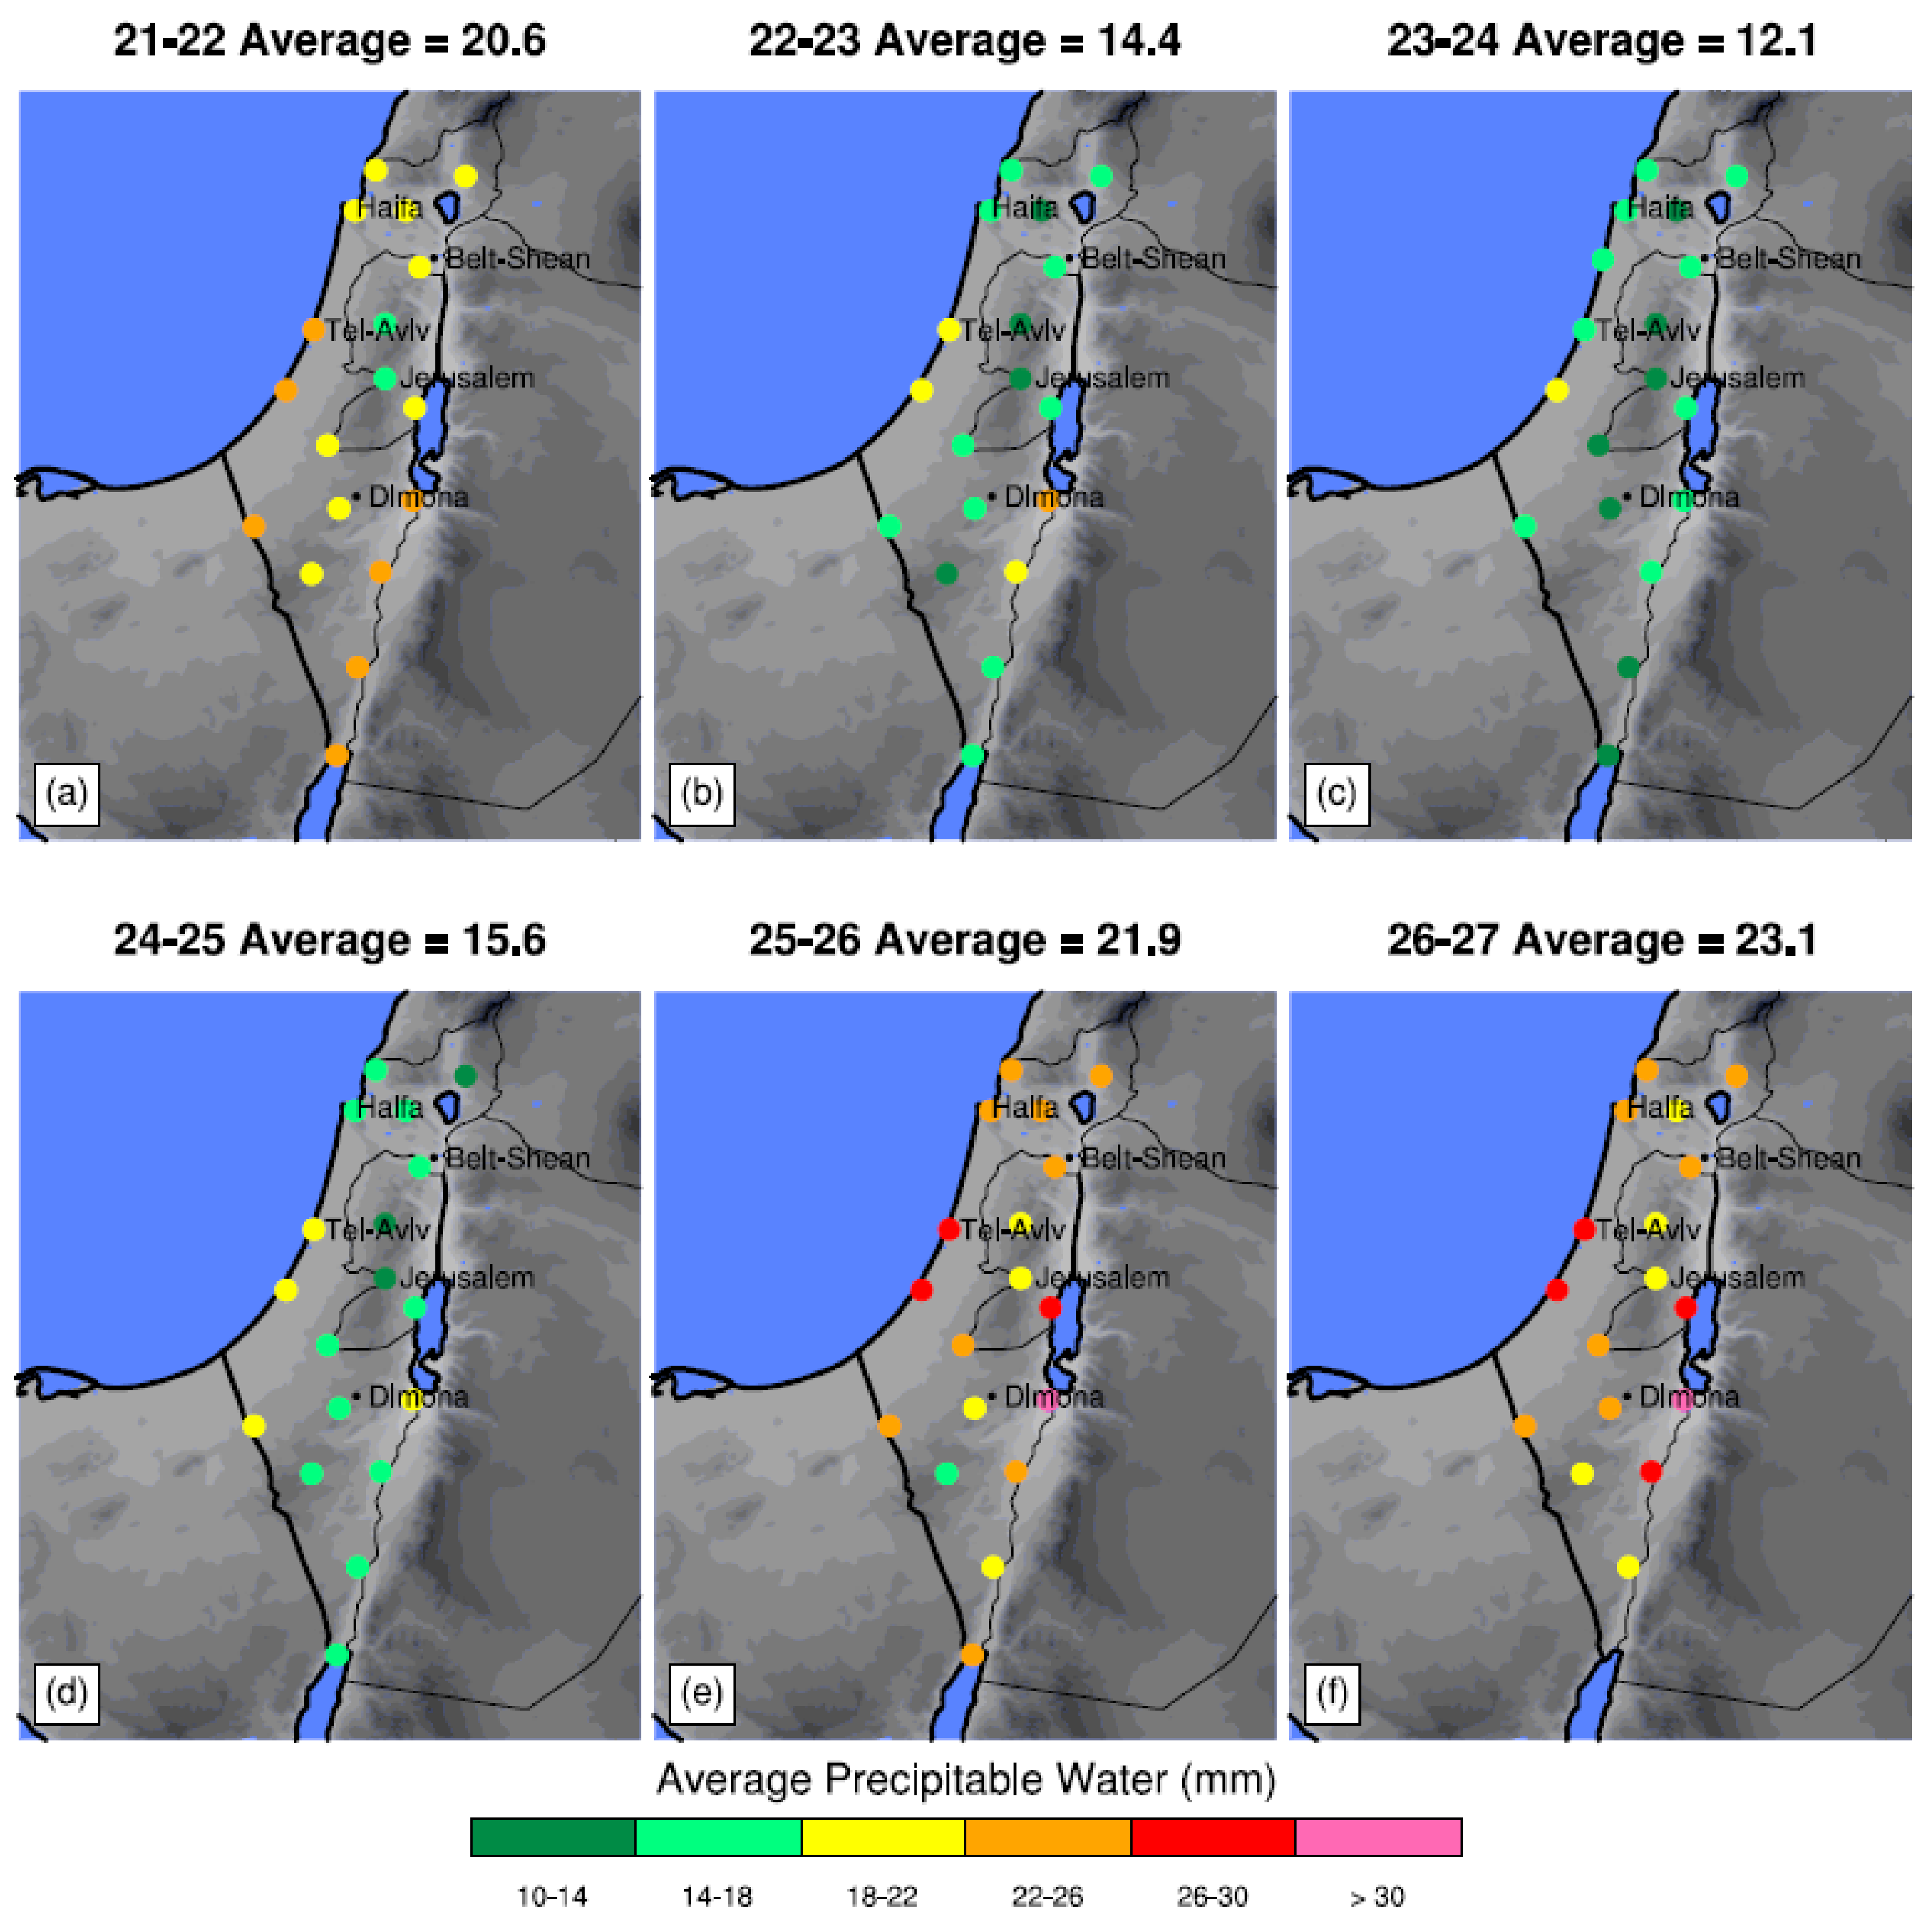
Consistent with the wide coverage by convective storms, comparatively high values of atmospheric precipitable water occurred on the 25th, with average values close to 22 mm (Figure 6)—an average increase of about 30% from the previous day. The following day, when the disaster occurred, 26 April 2018, precipitable water values rose to an average of 23.1 mm, with daily average values at the 21 stations ranging from 18 to 30 mm.

2.4. Soil Moisture

The ECMWF soil moisture analysis, SM-DAS-2 product, is based on ASCAT surface soil moisture data assimilation in the ECMWF Land Data Assimilation System. Technological advances in remote sensing of soil moisture have led to improved accuracy of the measurements [25]. Correlations of the SM-DAS-2 product with in situ data are very satisfactory over most sites located in contrasting biomes and climate conditions with averaged correlation values of 0.70 [1]. The soil moisture index shown in Figure 1 can be inferred as representative of upper “root zone” or upper soil layer values [26].

3. Model Description

3.1. Domain

As described in Lynn et al. [27], the Weather and Forecasting Research (WRF) model version 4.03 [28] was used to simulate this event, in a domain that covered the eastern Mediterranean and the Levant, the adjacent coastal plain, and mountainous and desert areas to the north, south, and east. The model was initialized with GFS boundary initial and lateral boundary conditions from 0000 UTC 20 to 0000 UTC 27 April 2018. This relatively long period of the simulation was chosen to allow for atmospheric dust to form and be advected, as well as antecedent precipitation to occur in the model simulation prior to the two-day period of heaviest precipitation on 25 and 26 April 2018. Three WRF domains were used in all case study experiments (Figure 3). The outer, “coarse” domain (“D01”) had 12 km grid-spacing with 200 × 200 elements in the west-to-east and north-to-south directions, respectively. A convection-allowing 4 km domain (“D02”) was placed within D01, which had 199 × 301 grid elements. This convection-allowing domain was large enough to assimilate most of the observed electrical activity, while the grid spacing was small enough to allow for the triggering and simulation of moist convection. Domain “D03” simulated microphysical processes on a cloud-allowing grid with grid-spacing of 1.3 km, using 301 × 475 elements. There were 51 vertical levels, with greater vertical resolution in the lower boundary layer than in the free-atmosphere above. The coarse domain used a cumulus parameterization [29], but the 4 km and 1.3 km forecast domains did not require this because they are convection-allowing and cloud-allowing grids, respectively. Instead, we used the Thompson and Eidhammer [30] bulk parameterization scheme, which was also used on the 12 km grid. The dynamic time step was nominally set at 72 s, with the time step of each inner grid reduced by a factor 3 from its parent grid, adjusted for numerical stability. Numerical model information moved from the coarse nest to the inner nests, and then returned to the coarse nest, in a process known as two-way nesting. Interior analysis nudging was used on the outer domain, while the inner nests were nudged with lateral boundary nudging [31]. The model output frequency was every 60 min, and each simulation duration was, as noted, for 7 days.

3.2. Aerosol Concentrations

Desert dust particle concentrations were calculated by the prognostic GoCART model in WRF and served as an input of dust particles from the surface at each integration time step. This follows the approach used in the “Thompson” scheme [30] for ice nucleation in the operational High-Resolution Rapid Refresh modeling system WRF. The GoCART model predicts the concentration of aerosol particles with effective radii from 0.73 μm to 8.0 μm in 5 size bins with fixed densities per bin. Within the Thompson scheme, the desert dust does not impact the nucleation of cloud droplets. Yet, as described by Levin et al. [32], desert particles traversing the Mediterranean can nucleate large cloud particles. Lynn et al. [27] showed that such large particles and urban aerosols enhance the convective intensity and affect cloud microphysics and charging processes, leading to lightning. The possible impacts of dust on cloud-drop (as well as ice nucleation) on simulated convective intensity will need to be investigated in a separate study using, for example, Spectral (bin) Microphysics (e.g., [27,33]).

3.3. Soil Moisture Initialization

The quantitively derived precipitation values were used to initialize the volumetric soil moisture in the model. The hypothesis was that a more realistic depiction of soil moisture would lead to a more accurate simulation of surface humidity fluxes [34]. Very few in-situ observations of soil moisture (both surface and by soil layers) and/or soil heat flux exists, so instead, it was supposed that assimilated rainfall, derived from radar observations, could be used to test the potential impact of soil moisture on the simulation of the convective events of 25 and 26 April 2018. For these purposes, the WRF model Noah LSM [35] was modified to accept only radar-derived precipitation amounts, irrespective of any simulated precipitation. The derived rainfall amounts were used as is, multiplied by 1.5, and then multiplied by 2, in order to test the sensitivity of convective and rainfall intensity to soil moisture to a range of 10-min volumetric soil moisture profiles at all land grid points within the 1.3 km domain. The WRF gridded soil conditions were created by running the forecast simulation with the observed rain amounts (or their multiple) and then using the resulting volumetric soil moisture profiles in the WRF sensitivity tests. The simulations are henceforth referred to, respectively, as S-1.0, S-1.5, and S-2.0. Note, in these simulations, no changes were allowed in model soil moisture because of model predicted rainfall and/or its surface evaporation.
These sensitivity tests showed that antecedent rainfall prior to 0600 UTC 26 April strongly modified the initial volumetric soil moisture. For instance, Figure 7a shows the WRF top layer volumetric soil moisture based solely on the GFS initial conditions, as well as subsequent WRF simulated precipitation at 0600 UTC 26 April 2018. Values of first layer soil moisture (1–10 cm) over Israel were predominantly between 0.40 and 0.50 m3 m−3. All sensitivity tests suggest that moister soils were actually located over northern Israel into eastern Syria, a geographical area from which strong convection originated during the morning and afternoon of 26 April. More widespread soil moisture values of >0.50 m3 m−3 were also found over the northern Negev, where mostly values of less than 0.50 m3 m−3 were observed in most southern areas in Figure 7a. In S-1.0 (Figure 7b) there were a few localized areas with soil moisture values >0.6 m3 m−3. Figure 7c,d show that additional moisture increased the areas of soil moisture with values >0.6 m3 m−3 and even >0.7 in S-2.0. Simulation S-2.0 has volumetric soil moisture whose patterned values appear qualitatively closest to the satellite-derived values of 26 April 2018 (Figure 1), and its simulation results are used in the factor separation analysis below.

3.4. Forecast Lightning

To predict the number of lightning events (cloud-to-ground and intra-cloud), we used the Dynamic Lightning Scheme (DLS; [36]). The DLS is based on the Lightning Potential Index (LPI; [37,38]), which is first multiplied by the mass of ice and then divided by a unit coulomb of electrical charge C, to represent the electrical potential of the lightning-producing cloud fields in volts (referred to here as LPI*). Second, to calculate the build-up of electric potential energy (Joules) within the cloud, LPI* is multiplied by the density of air times the current (ρ I LPI*), which is referred to as the “Power Index”—a time-dependent variable. Third, as the Power Index reaches or passes a preset threshold, the energy within each lightning stroke is then discharged during the time interval (t) of a lightning event propagating from the height of discharge to the ground as a vertical leader. The time scale over which this occurs depends on the layer from which the energy begins to be discharged: It is largest for +CG (cloud-to-ground) and smallest for IC (intra-cloud). The DLS has been shown to accurately predict both cloud-to-ground and intra-cloud lightning [39].

3.5. Factor Separation

The factor separation approach [3,40,41] was used to compare the relative impacts of local versus non-local moisture sources. Factor separation was recently used by Lynn et al. [42] to decipher the relative importance of desert dust and urban aerosols in the 4 January 2020 flood disaster in Tel Aviv. The “Control” simulation was the WRF simulation initialized with GFS boundary condition; soil moisture conditions were coupled with WRF land surface evaporation and precipitation processes. Within the factor separation nomenclature, it is referred to as f0 (Equation (1)). The local contribution f1 (Equation (2)) was obtained from the simulation with the assimilated soil moisture. The simulation results with assimilated lightning on the outer 12 km and intermediate 4 km grid, referred to as non-local moisture sources, were used to derive factor f2 (Equation (3)). The coupled interactive term is named f12, representing the combined impact of non-local and local moisture sources on model forecast results (Equation (4)).
If X represents the initial model conditions, then f(X) means the model results from a simulation with those settings. For instance:
fo = f(Control)
f1 = f(local) − fo
f2 = f(non-local) − fo
f12 = f(local and non-local) − (f(local) + f(non-local)) + fo
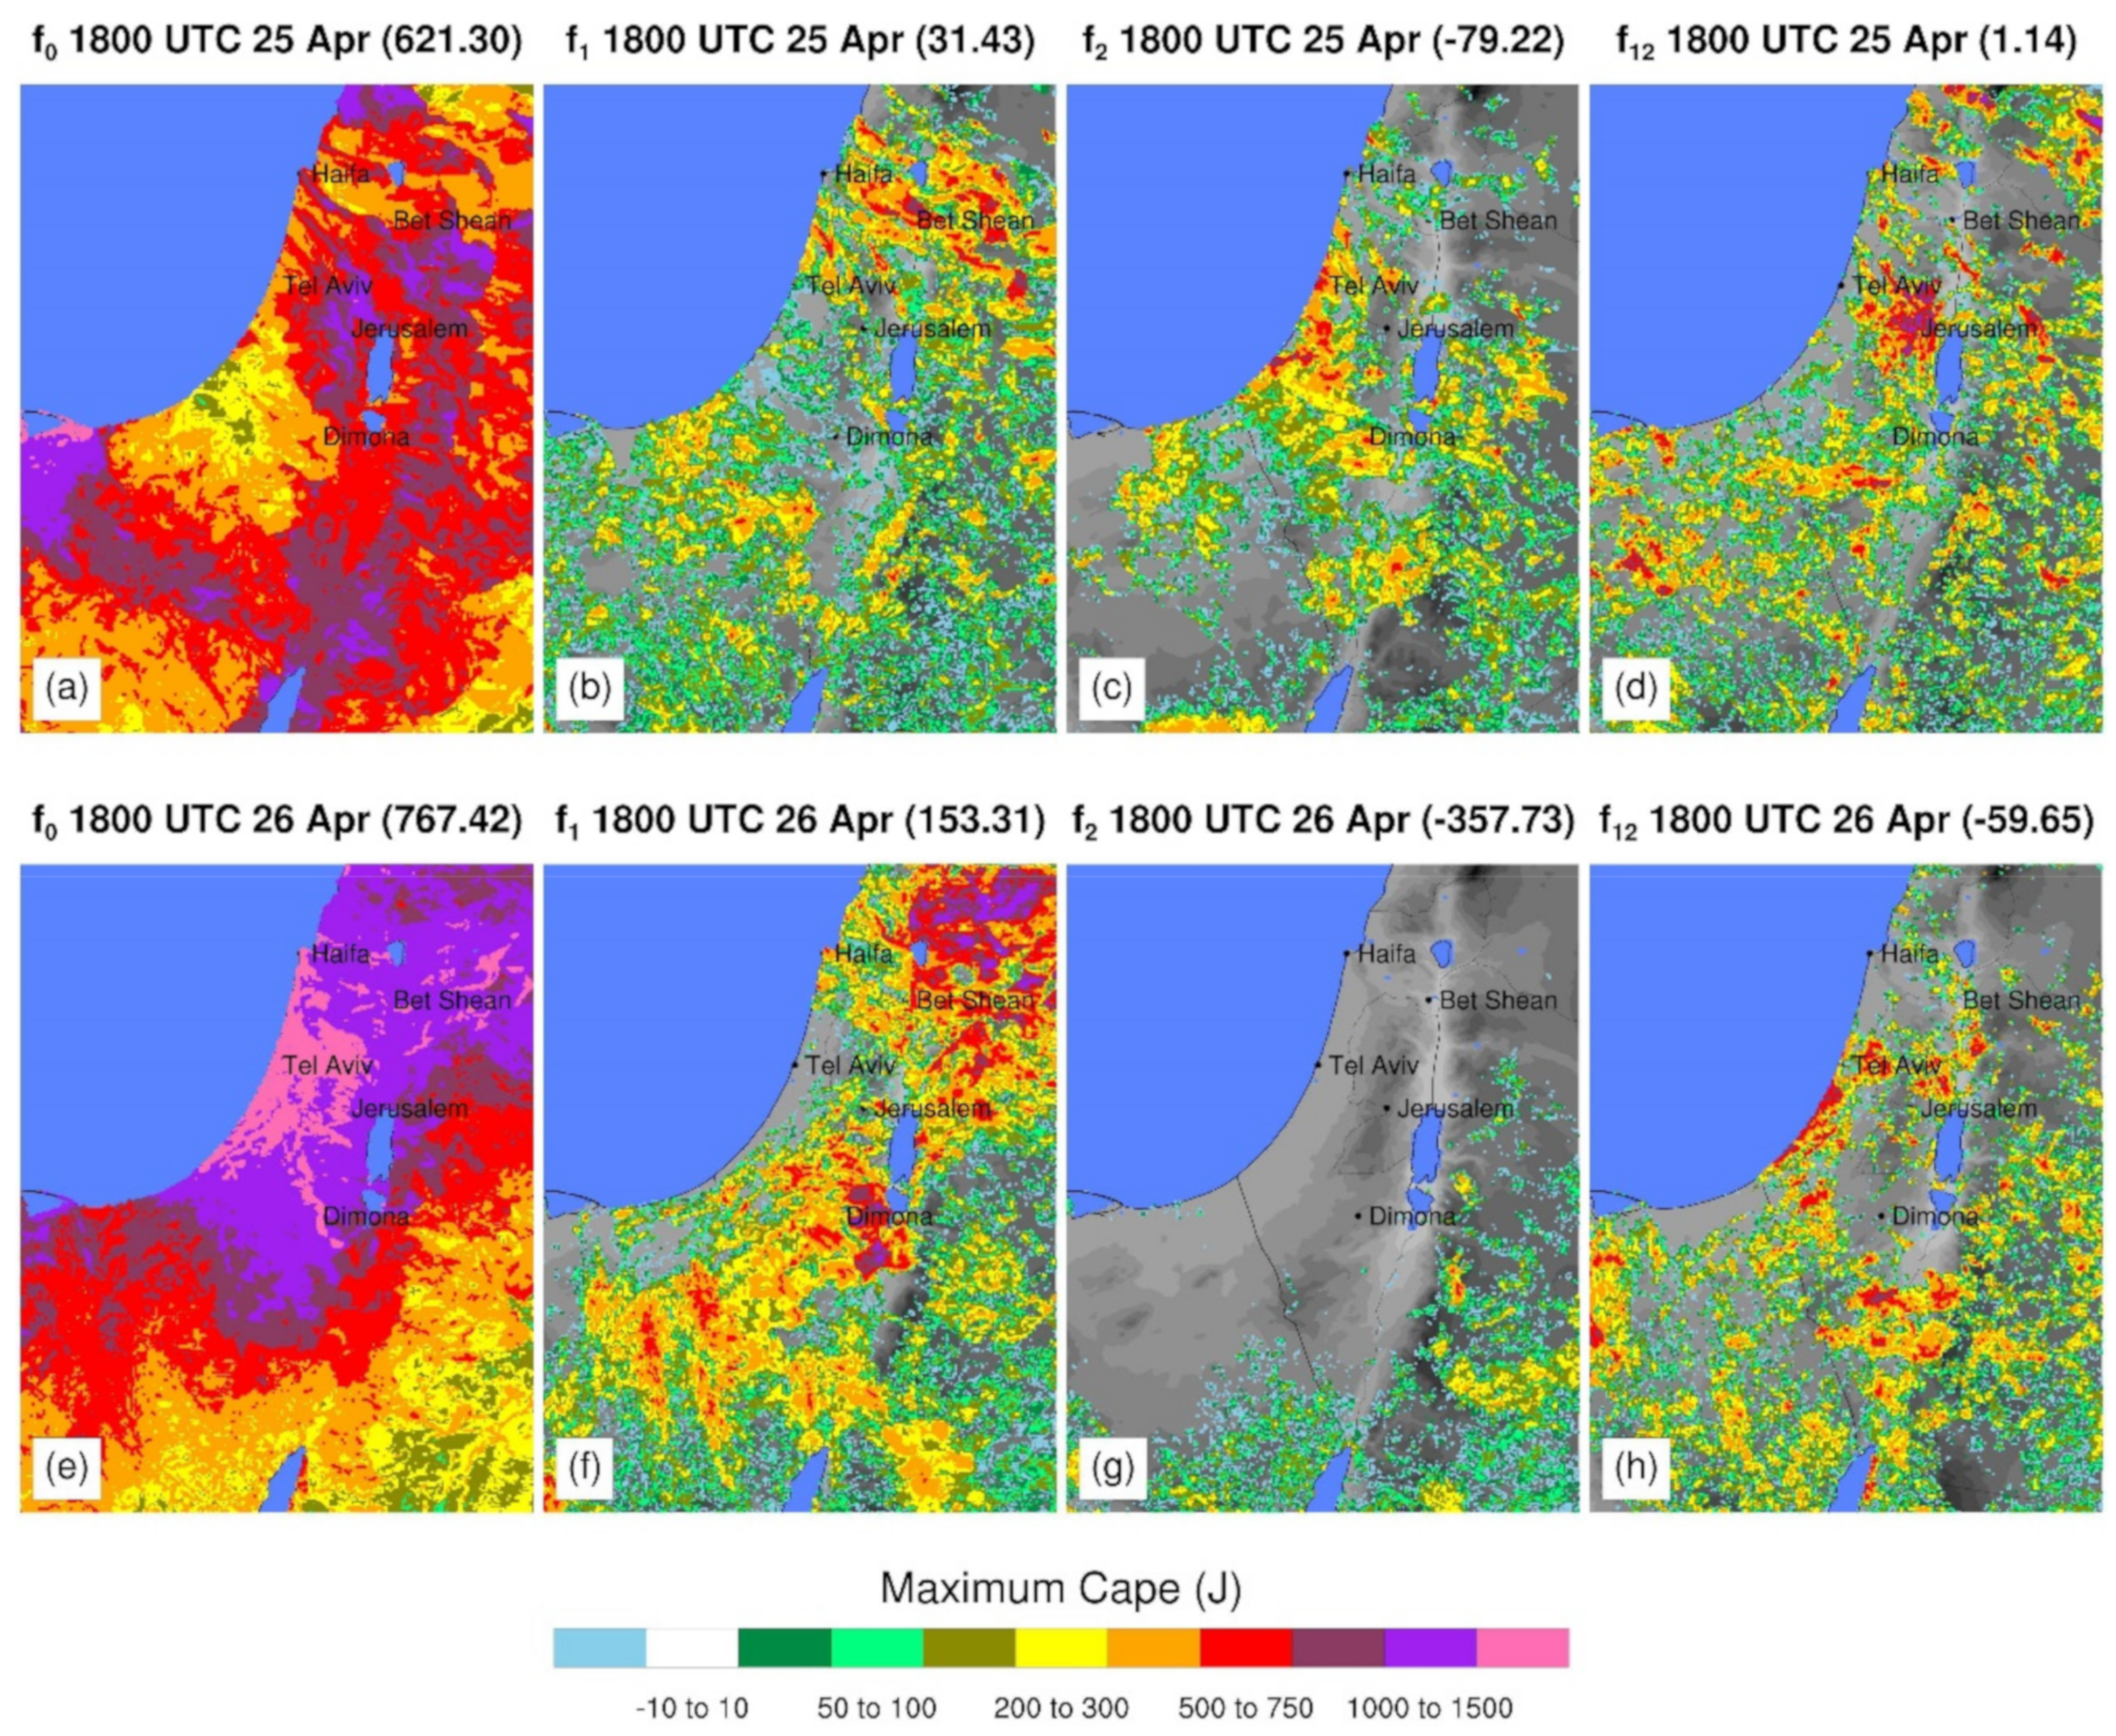
For reference, factor separation is applied later on in Section 4.2 to results from the control, the simulation S-2.0 (referred to as “local” in the equations), and S-2.0 with non-local moisture sources. While Equations (1)–(3) provide intuitive results, Equation (4) (f12) requires additional explanation. When applied to gridded data, this equation provides a spatial map of locations where non-local moisture (dry air) advection could combine with local soil moisture increases (decreases) to produce larger (smaller) CAPE. The results would be to create more unstable (stable) conditions to synergistically act to enhance (or diminish), for instance, lightning intensity.

4. Results

4.1. Impact of Soil Moisture

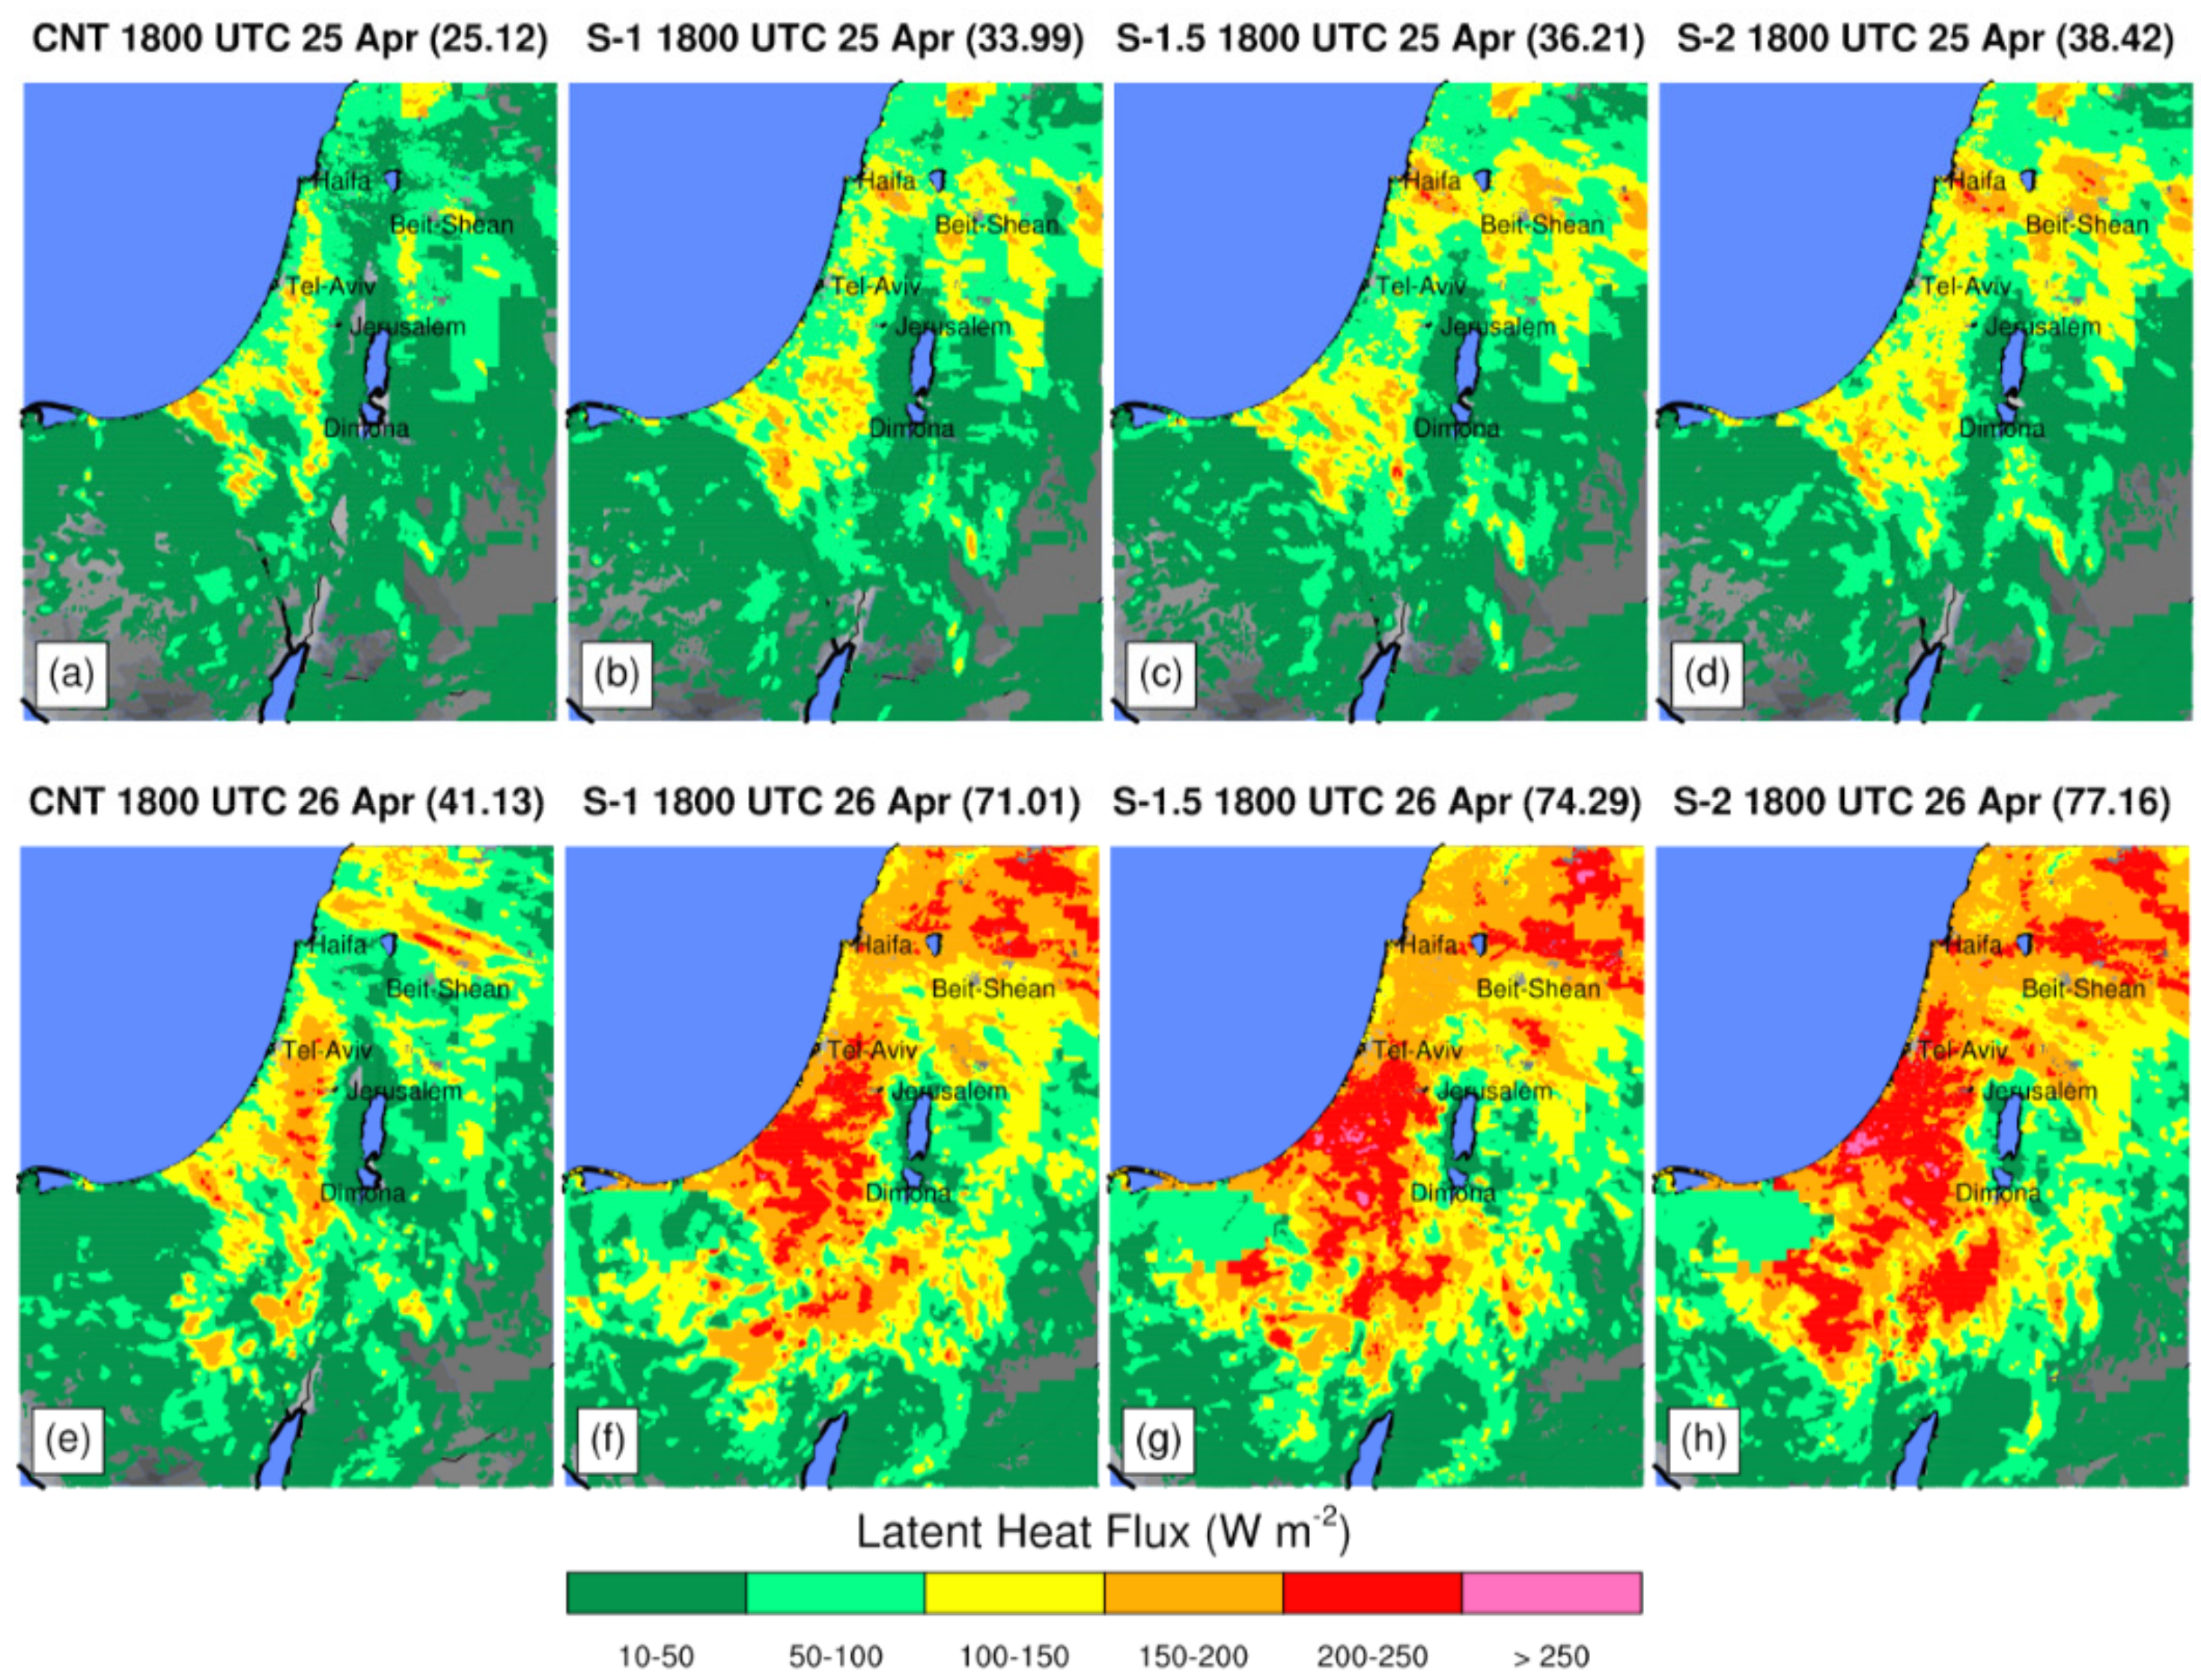
Higher volumetric soil moisture led to corresponding increases in surface latent heat flux (Figure 8). In the control (Figure 8a), daytime average latent heat flux over land on 25 April 2018 was about 25 W m−2. When the derived rainfall from radar observations was imposed, average values increased by about 30%, to 33 W m−2. When derived rainfall was increased by 50 and 100%, respectively, latent heat fluxes increased by about 45 to 50% (Figure 8c,d). The larger values of volumetric soil moisture on 25 April led to large increases in latent heat flux on 26 April 2018. The control average was 41 W m−2 and the simulations with derived soil moisture had average values 70 to 80% higher (Figure 8b–d). The most relevant aspect is the fact that the largest latent heat fluxes were found to be located to the northeast of Bet Shean and the areas immediately west of and including Jerusalem, as well as areas southward over the northern Negev desert and in the area southeast of Dimona (within the Tzafit river gorge). Correspondingly, on 26 April, convection originated to the northeast of Bet Shean, intensified over Jerusalem, and occurred most strongly in the area southeast of Dimona (not shown).
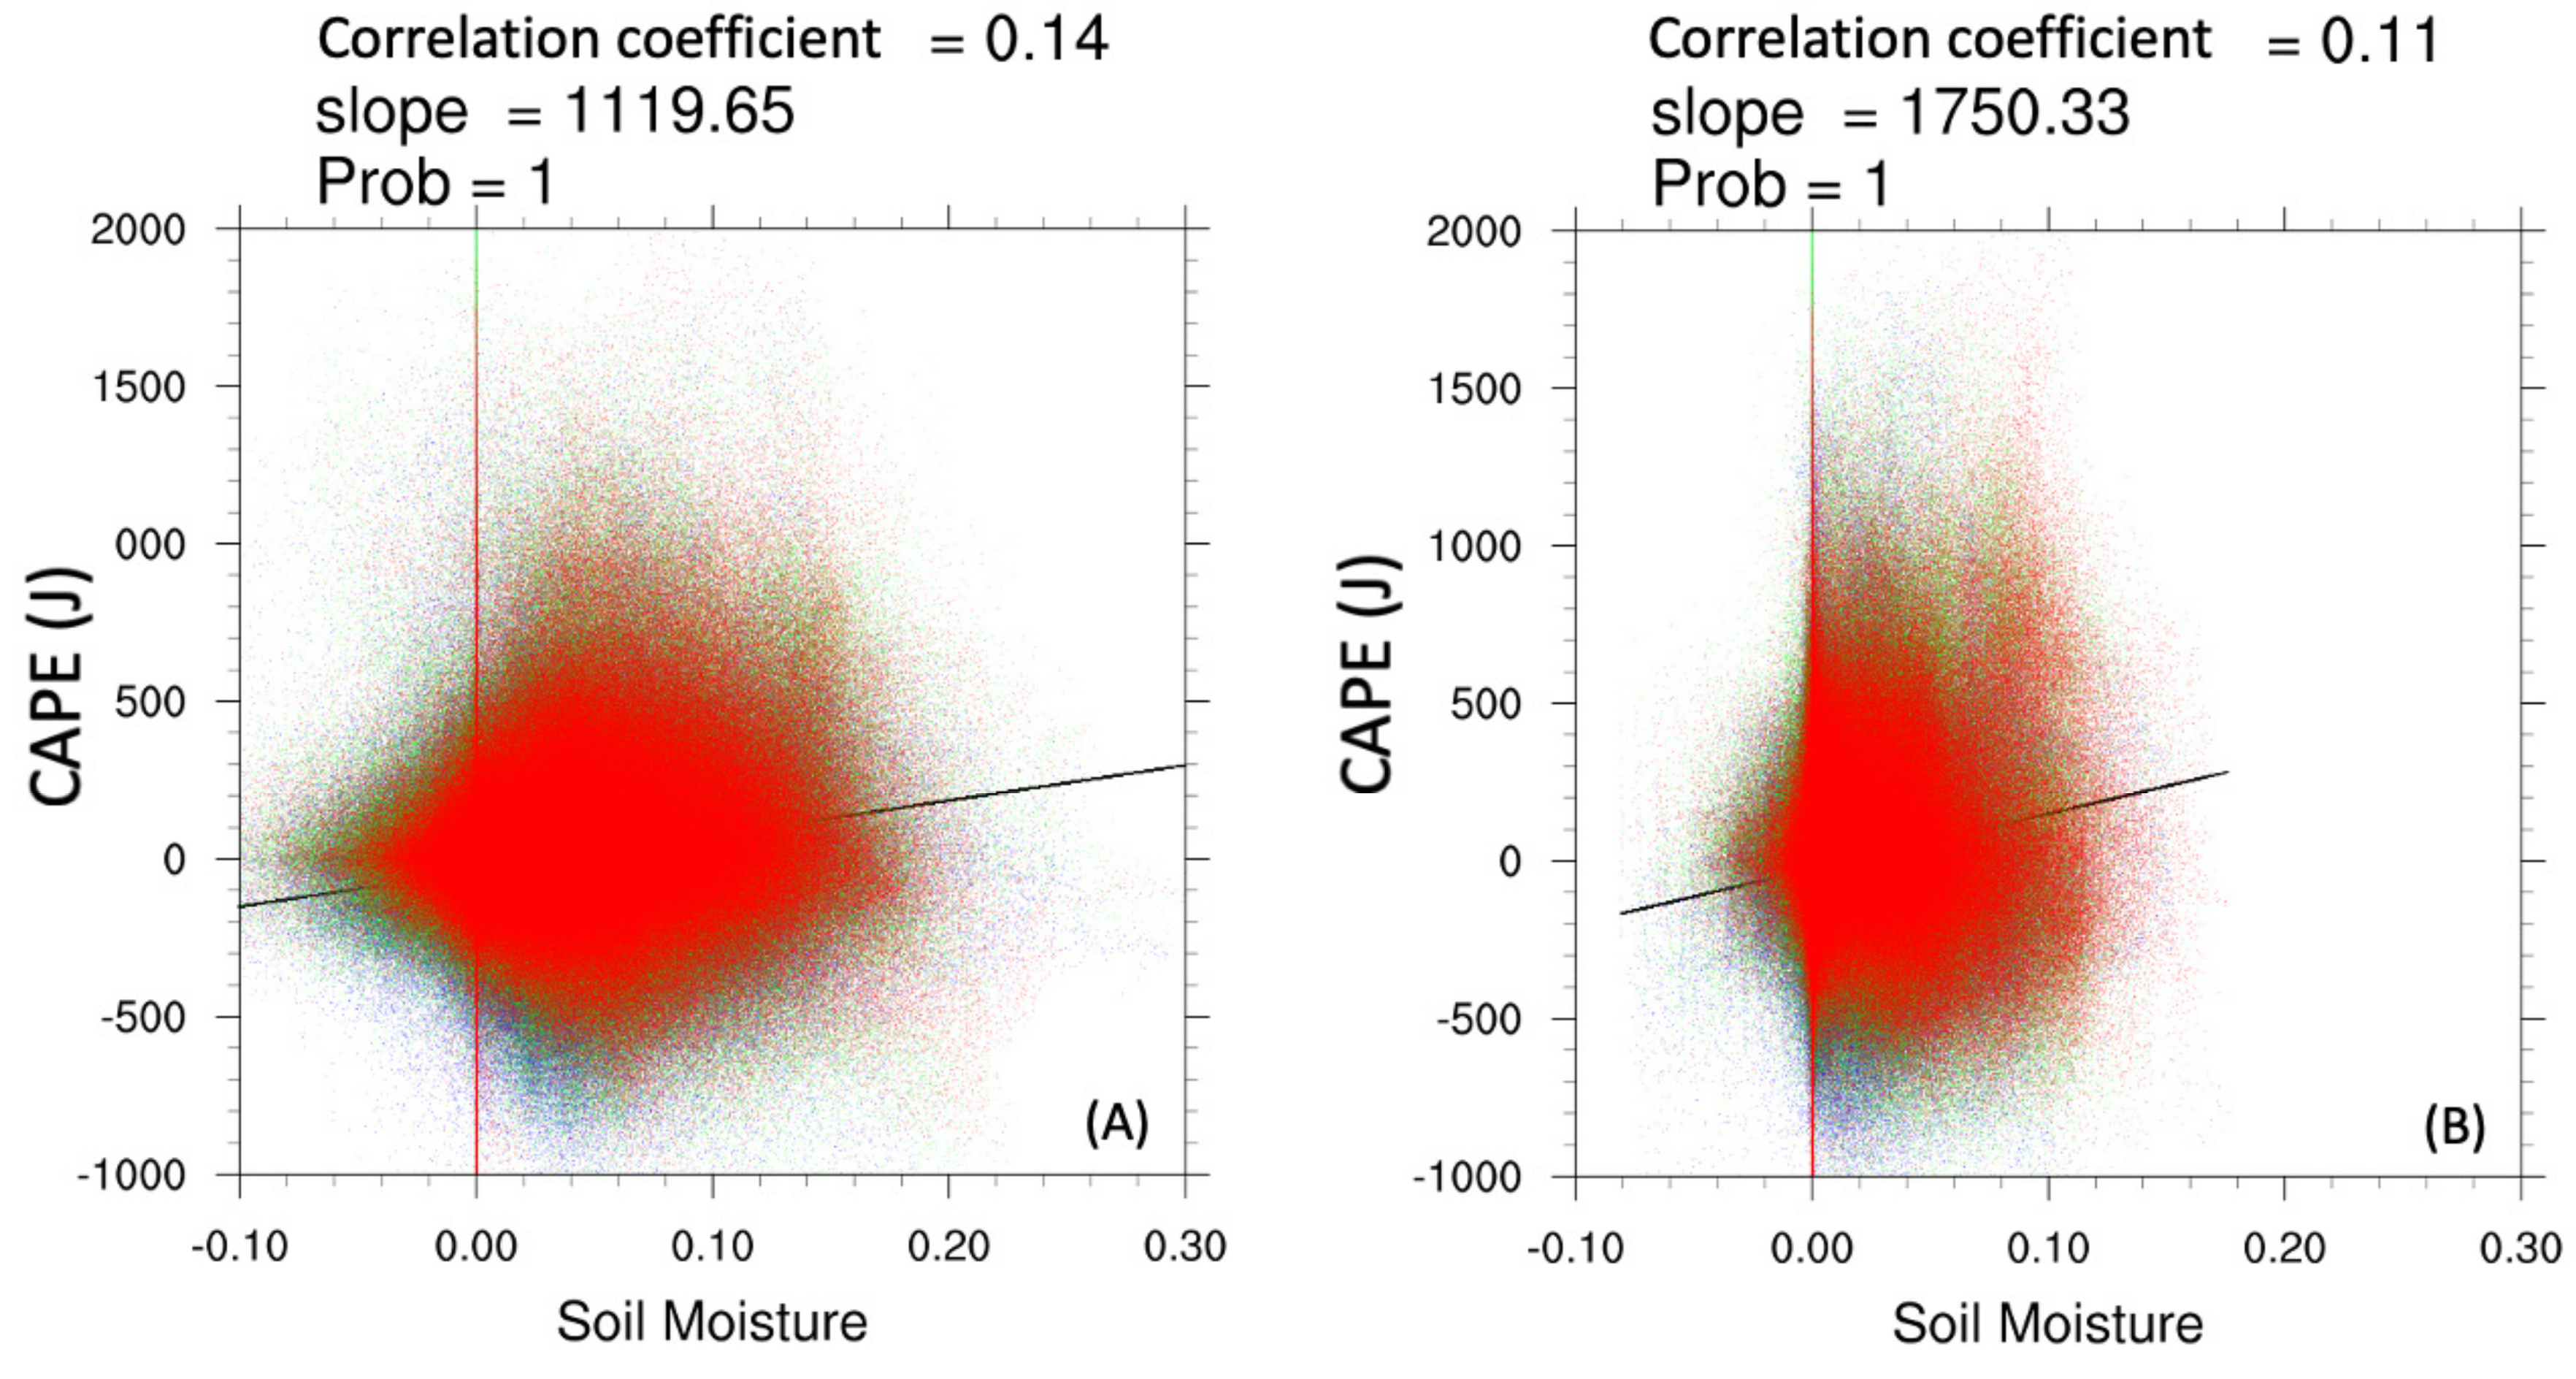
There was also a (significant) negative correlation between increased soil moisture (higher latent heat flux) and the lifting condensation level (LCL; not shown), implying that volumetric soil moisture is important to lower level atmospheric moistening. The additional surface moisture flux likely influenced the CAPE in opposite ways (as seen in Figure 9): More moisture generally led to lower cloud bases (lower LCL), leading to an increase in CAPE. On the other hand, an increase in the environment humidity likely decreased CAPE in some locations, as the environment virtual temperature increases. Moreover, depending on the location of surface rainfall moistening in Control (and ambient atmospheric conditions), some locations had more or less CAPE in the Control than in the simulations with radar-derived soil moisture.
A linear fit to the data showed that CAPE values in these simulations increased with an increase in soil moisture. Figure 9 shows CAPE values plotted versus surface (Figure 9A) and first-layer (Figure 9B) soil moisture values. The data represent the CAPE and soil moisture for all gridded land points (within D03) between the hours of 0600 and 1700 UTC on 26 April 2018. The plotted points represent the difference between the Control and either S-1.0 (blue points), S-1.5 (green), or S-2.0 (red). By showing the differences in CAPE, it is supposed that the scatter plots show more clearly the impact of changing soil moisture on CAPE than the values of CAPE themselves. The CAPE and soil moisture are positively correlated (at the 95% significance level) for both surface layer and first-layer soil moisture. Looking at the loci of points, S-1.0 produced more points that had negative changes in CAPE (and even a decrease in some locations of soil moisture) than S-1.5 and S-2.0. In fact, the median change in CAPE for S-1.0 was −24 J, −1 J for S-1.5, and 2 J for S-2.0. Hence, overall, only S-2.0 produced more points with more CAPE than the Control.
Specifically, while most points are seen to be bounded between −500 and + 750 J, there are a number of points with CAPE values >1000 J, and these points are more likely to serve as loci for convection. In the area of the scatter plot where both soil moisture and CAPE were positive, there appear generally more green (S-1.5) and red (S-2.0) points above the highly concentrated mass of points than blue points. Based on Figure 9B, it is suggested that turbulent mixing over vegetation seems to correlate with higher (red) values of first-layer moisture and CAPE. Thus, local soil moisture changes led to a greater likelihood of more intense thunderstorms on 26 April.
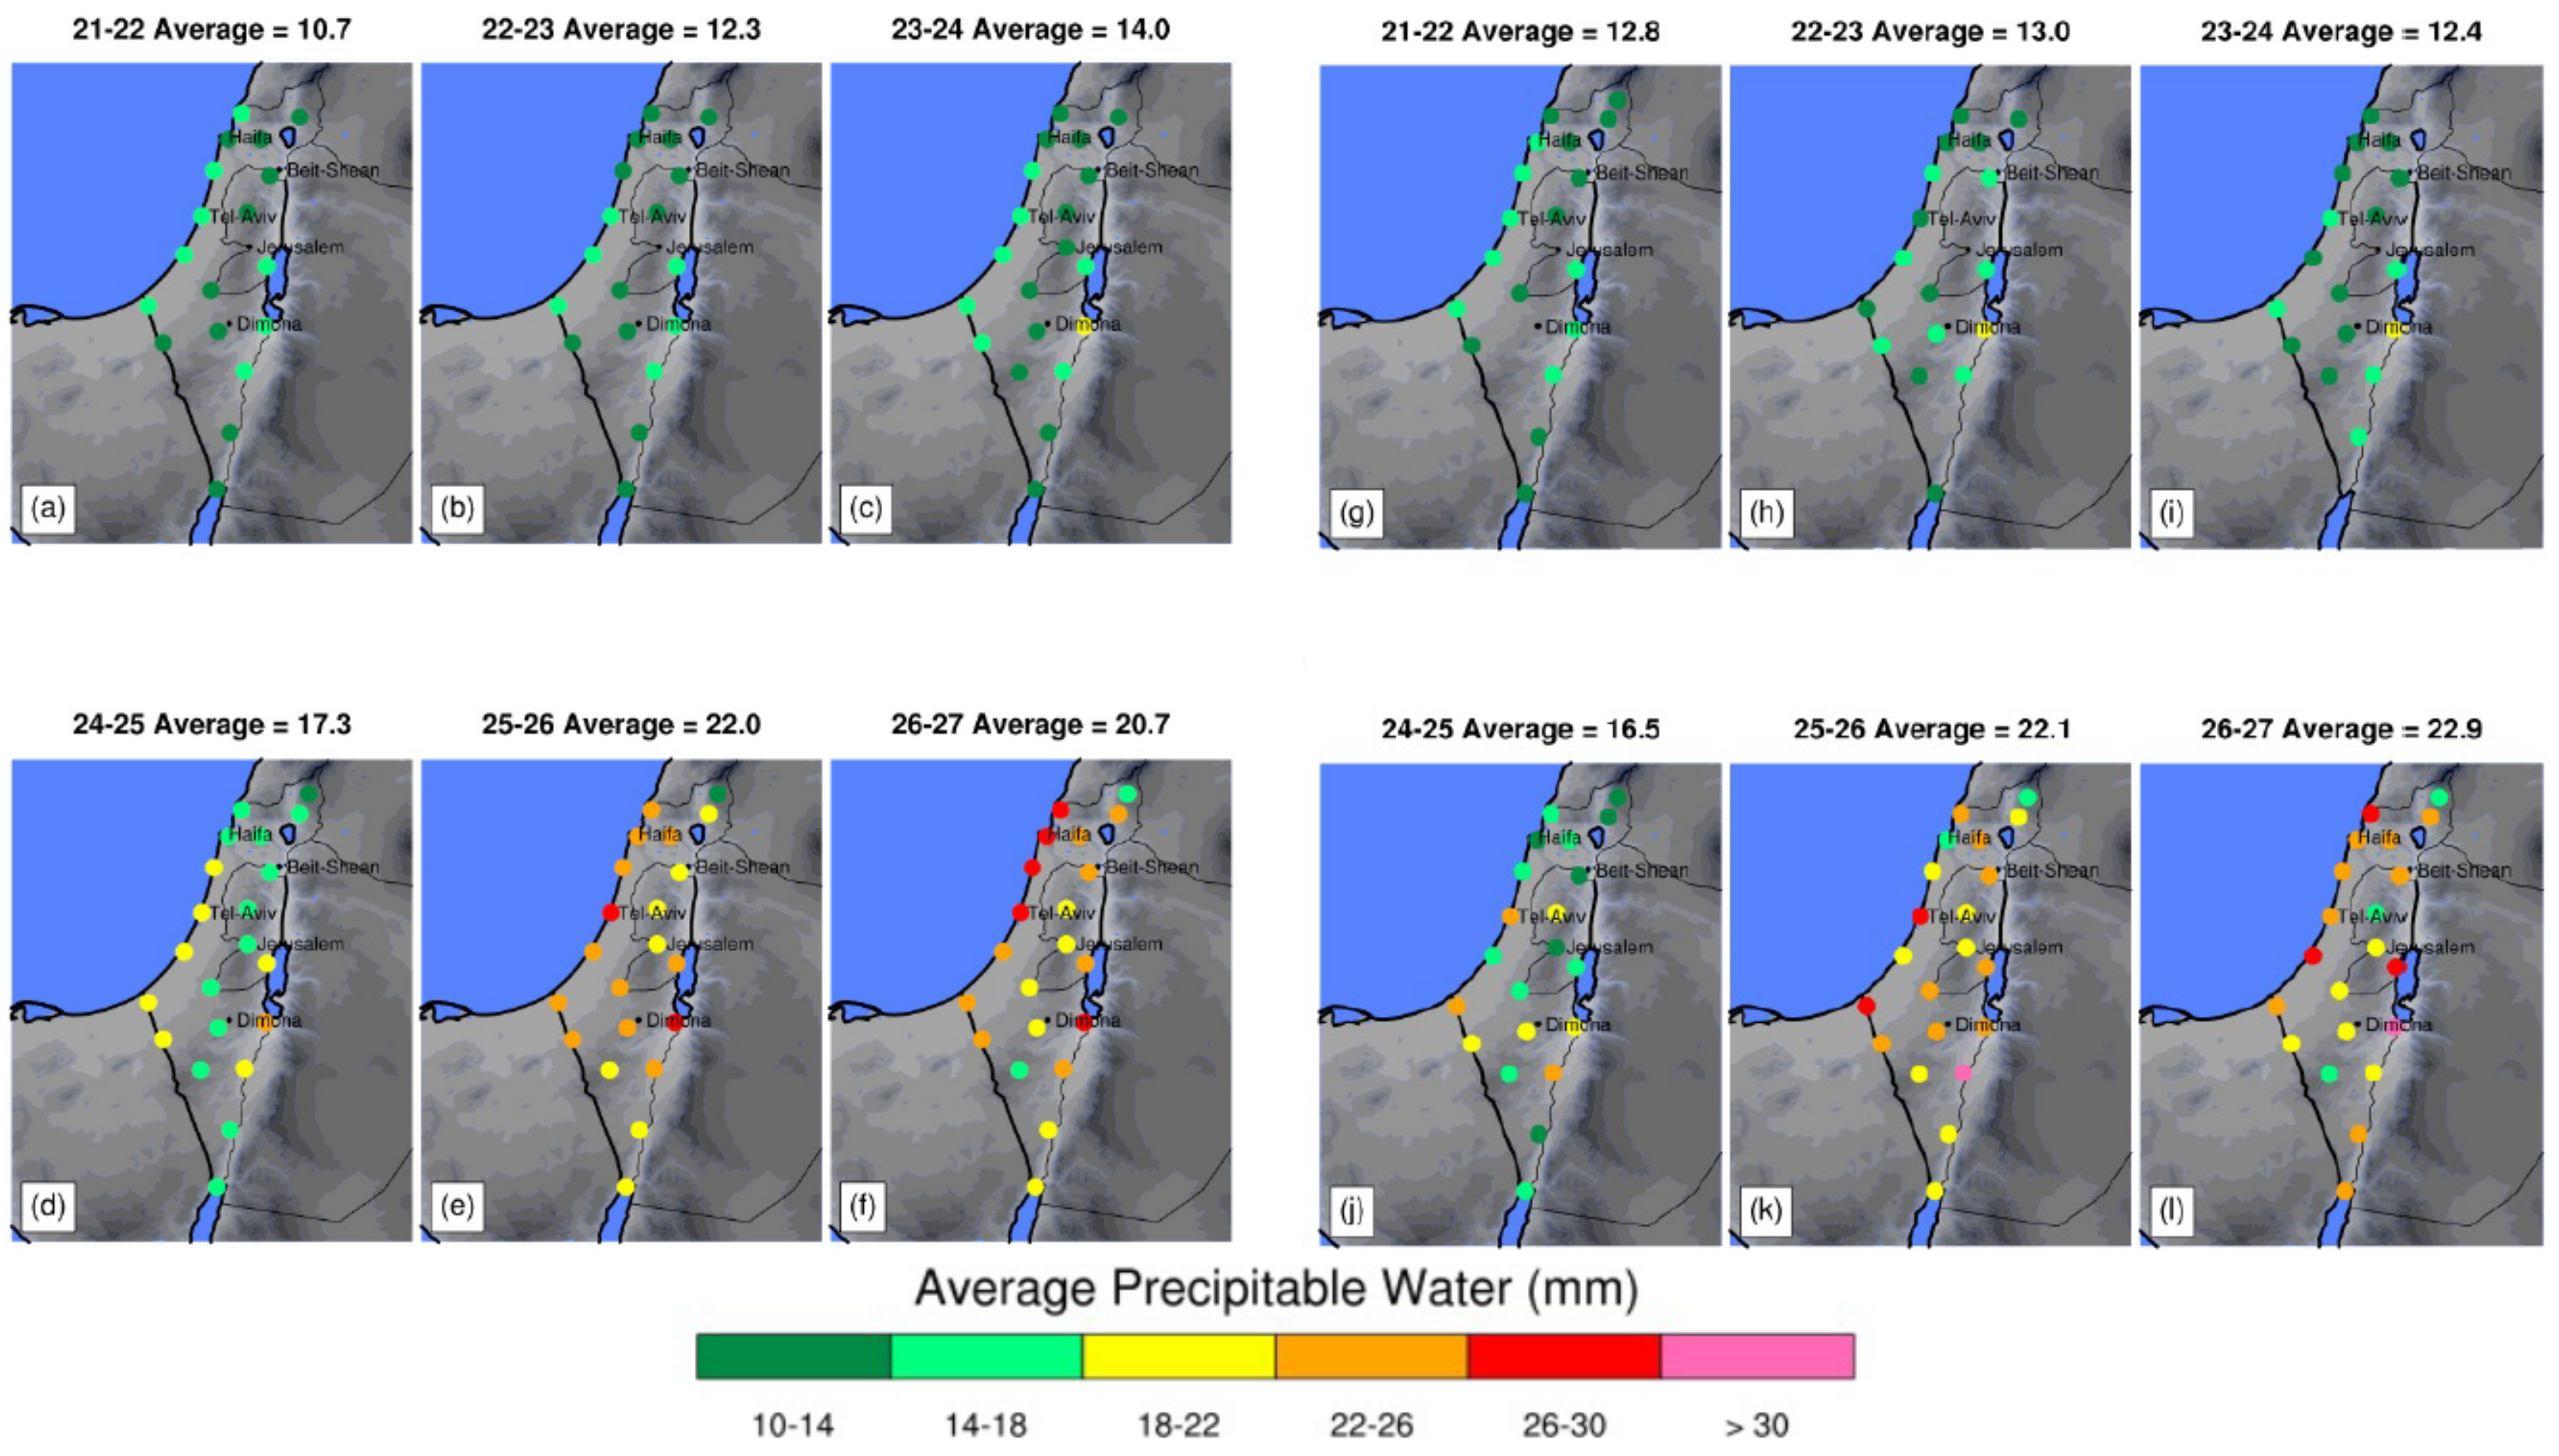
Figure 10 compares the precipitable water values from the control and S-2.0. The data points shown are the model grid points closest to the location of each GPS observing station. Both simulations quite underestimated precipitable water on the second day (21 April; compare Figure 10b–h). However, this was not a day with heavy rain or lightning. More importantly, S-2.0 produced, on average, precipitable water values (Figure 10l) closer to observations (Figure 6f) than the Control (Figure 10f)—when the deadly flooding and severe floods occurred on 26 April.
Through their effect on CAPE and precipitable water, soil moisture magnitude differences impacted the distribution and to some extent the precipitation amounts on both 25 and 26 April 2018. Figure 11 shows 12-h precipitation values (0600–1800 UTC) on 25 and 26 April 2018. On 25 April, the additional soil moisture increased average precipitation amounts by 5 to 7%, with S-2.0 producing the highest average value (5.02 mm). On 26 April, mean amounts decreased by about 10%, with S-2.0 producing the least amount on average (2.0 mm; Figure 11d). However, a qualitative comparison with Figure 5b suggests that S-2.0 (Figure 11d) more realistically depicted the amount and location of precipitation on 25 April in the area of Tel Aviv and southward of it compared with the other forecasts, as well as a band of precipitation occurring on 26 April just north of Jerusalem and southward of it (Figure 11h). In contrast, the control simulation produced very heavy precipitation on 25 April in a band from the southwest of Dimona to the north of Tel Aviv (Figure 11a), and heavier convection on 26 April (Figure 11e) comparatively too far west of Jerusalem.
None of these simulation forecasts produced precipitation in the area of Dimona and south of it, in the Tzafit river gorge. In the next section, we turn to the use of factor separation to explicitly calculate the impact of local versus non-local moisture sources on CAPE, lightning, and precipitation. It will be shown that non-local moisture sources contributed to the flooding rains in the Tzafit Basin.

4.2. Local Versus Non-Local Moisture Impacts

4.2.1. CAPE

Expressed through factor separation, both local and non-local moisture sources affected maximum CAPE values (Figure 12), both individually and synergistically. For example, both local (f1; from S-2.0) and non-local moisture (f2) sources led to a general increase in maximum CAPE values on 25 April 2018, although the location of the increases depended on the moisture source. For example, f1 led to increased CAPE in southwestern and north-central Israel, while f2 led to an increase in CAPE over west Central Israel, and the areas just to the southwest of Dimona. The coupled interactions (f12) produced a very large increase in CAPE in the vicinity of Jerusalem. Results from the control simulation suggest that precipitation (see below) on 25 April led to a general increase in CAPE from 25 April to 26 April (fo; compare Figure 12a,e), with values of CAPE doubling to produce many locations greater than 1000 J. The factor f1 shows (Figure 12f) that antecedent soil moisture had a large impact on CAPE values on 26 April, but non-local moisture advection did not. The largest increase occurred in the area of Bet Shean and Dimona (as well as the Tzafit river gorge). CAPE increases compared to Control were more than 1000 J due to the local increase in lower-level moisture. In contrast, non-local moisture sources (f2) had only a small impact on CAPE values on 26 April. CAPE changes associated with couple interactions (f12) were limited to local areas, including the southwestern coast, areas to the south of Dimona, and areas north of Jerusalem. Hence, the increase in convective potential on 26 April was mostly due to an increase in volumetric soil moisture.

4.2.2. Lightning

On 25 April 2018, local and non-local moisture sources led to a redistribution of thunderstorms and ensuing lightning (Figure 13) within the simulation domain. Factor separation (f1, f2) showed (Figure 13b,c) that the local soil (from S-2.0) and non-local moisture sources led to a redistribution of forecast lightning. Lightning that was generally located south of Dimona (f0; Figure 13a) in the control simulation, was “relocated” to an area stretching from just north of Dimona, through Jerusalem, and then northward to near Tel Aviv. Within the redistributed areas, there were locations with 5 to 10 events per 12 h. There was also additional forecast lightning in the vicinity of the city of Bet Shean (Figure 13b). The net result was a small increase in overall lightning activity. The coupled interactions of both factors (f12) increased lighting intensity over far southern Israel (Figure 13d), and produced a stronger cell with lightning rates of 10 to 25 per 12 h immediately to the south of Dimona, in the Tzafit river gorge. Generally, lower but positive lightning rates were also produced over the immediate Jerusalem area, as well as north-central Israel and Jordan. Overall, there was a slight net decrease in lightning activity in Figure 13d, possibly an indication that relatively stronger convection in some locations suppressed overall lightning activity in other locations.
Factor separation revealed important changes in the distribution of lightning on 26 April 2018 (Figure 13e–h), including into or near the areas of flooding rains. On 26 April, the control simulation produced a north-to-south line of convective cells from north-central to south-central Israel (Figure 13e), west of Jerusalem and its observed location (Figure 4e). Localized moisture impacts (f1) on lightning intensity were seen in Figure 13f, where imposed soil moisture led to (i) a decrease in lightning activity west of Jerusalem, and (ii) scattered convective cells within the area of the Jerusalem north-to-south mountain ridge (qualitatively, more consistent with observations than in Control). No lighting was produced in the vicinity of Tzafit, where it did occur in the observations. The advection of non-local moisture (f2) led to widespread lightning coverage over southern and far northern areas of Israel, as well as Jordan, consistent with observations. There were as many as 10–25 lightning events in the area just south of Dimona (13g). The coupled interaction term, f12, also led to widespread lightning just south of Jerusalem, and over southern Israel. Lightning increases were also present over most of Jordan. Lightning intensity increases associated with f12 were between 5–10 events in the Jerusalem area. There was also lightning in what would be the northernmost part of the Tzafit river gorge (Figure 13h). Hence, both local and non-local and moisture sources acted by themselves or synergistically to affect lightning distribution and intensity.

4.2.3. Precipitation

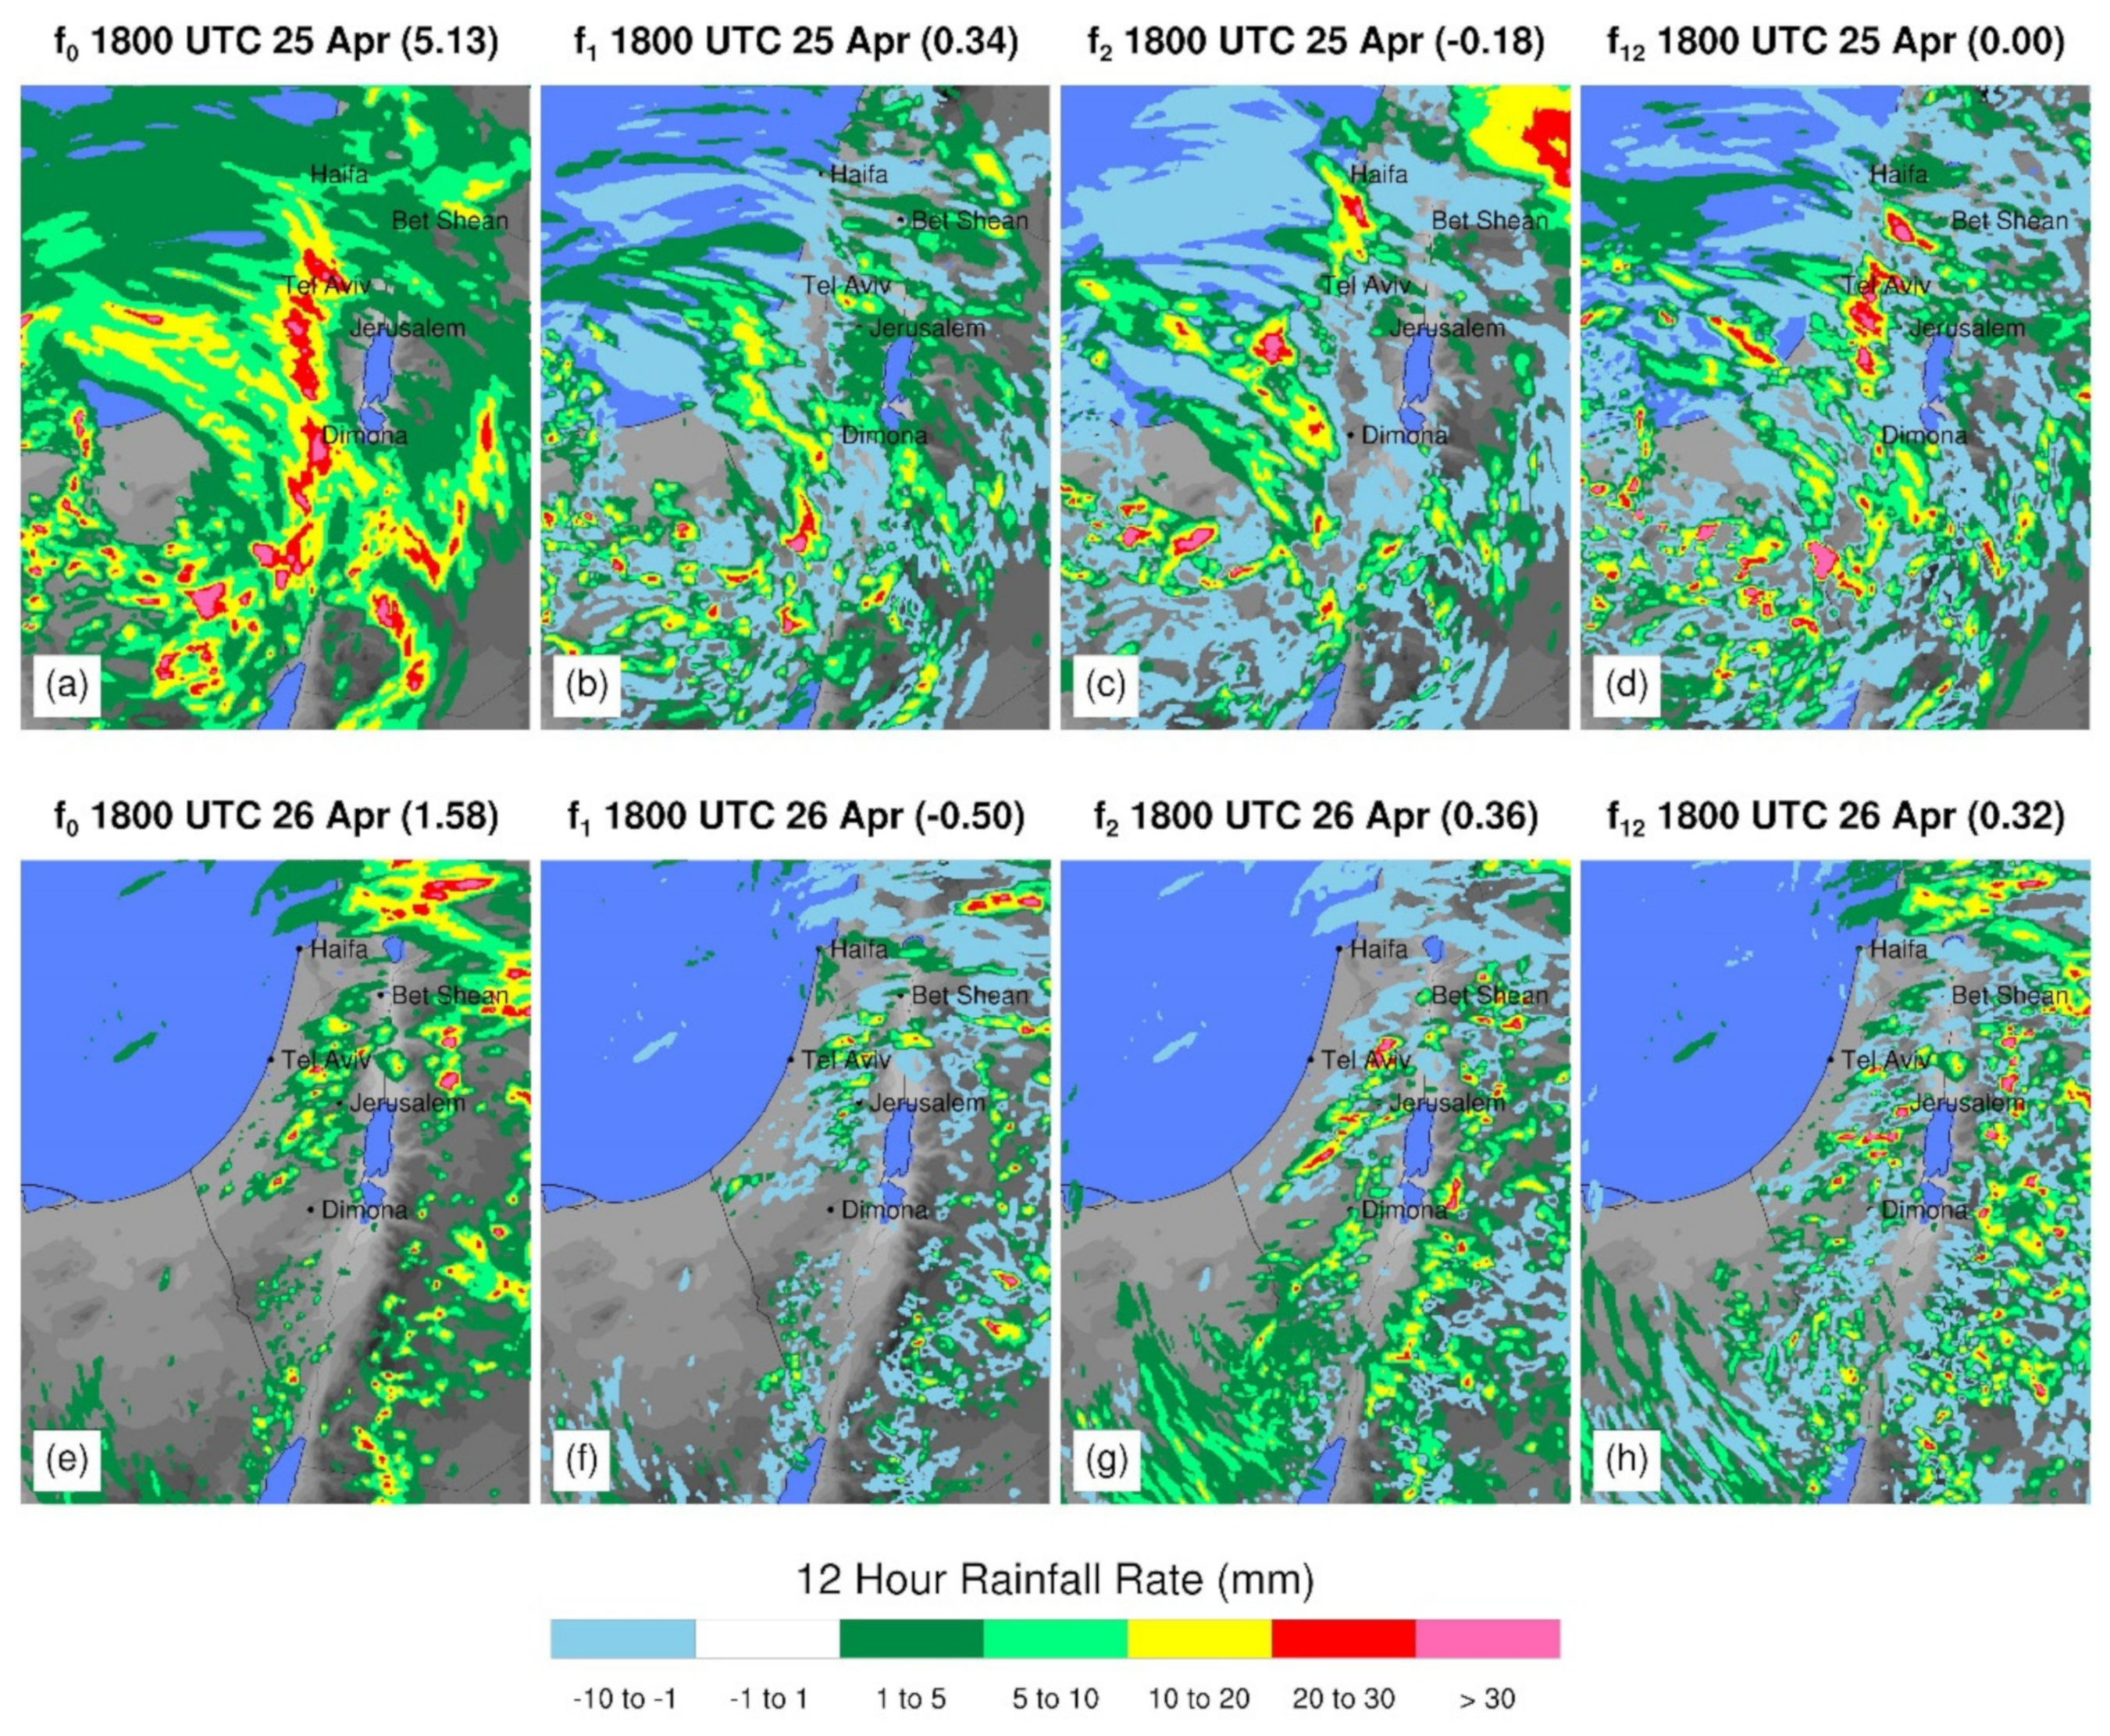
Consistent with the changes in lightning distribution, factor separation also revealed that both non-local and local moisture sources had important impacts on the distribution of precipitation on 25 April 2018. The assimilation of soil moisture prior to and during 25 April 2018 led to about a 7% increase in average rainfall over land (Figure 14b) within the 1.3 km domain, compared to the control experiment (Figure 14a); likewise, non-local moisture sources led to a similar increase (Figure 14c). Overall, the local (f1) and non-local moisture sources (f2) led to the intensification of precipitation in areas to the west (and what would be upwind) of Dimona and the Tzafit river gorge. Precipitation values had maximum values of 20 to 30 mm. There was also substantial precipitation (>30 mm per 12 h) to the northeast of Bet Shean, associated with non-local sources (f2). The coupled interactions (f12) produced an area of precipitation of 10 to 20 mm within the Tzafit river gorge basin (Figure 14d). Note, however, that there were broad areas where precipitation lightly decreased, most likely due to the intensification and focusing of convection in the aforementioned locations.
Both local (f1) and non-local (f2) moisture sources contributed to heavy precipitation in the Jerusalem area on 26 April 2018, while non-local moisture sources contributed to heavier precipitation in the area of Bet Shean, Jerusalem, and the Tzafit river gorge. The local moisture source (f1) led to the formation of different convective cells with 5 to 10, 10 to 20, and 20 to 30 mm per 12 h along the Jerusalem north-to-south mountain ridge. Note, however, that neither f0 (Figure 14e) (from the control simulation) nor f1 (Figure 14f) forecast precipitation in the area of the Tzafit river gorge. Figure 14g shows that (f2) produced rainfall amounts of 10–20 mm in the area of the Tzafit gorge; the coupled interactions of both factors (f12) contributed 5–10 mm in the northernmost part of the gorge itself. The coupled interactions also produced the heaviest precipitation, >30 mm, in the area of Jerusalem and environs to its immediate southwest. Hence, both local and non-local moisture sources coupled to contribute to the flooding rains in both areas. However, non-local moisture sources contributed the most to the precipitation in the area of the flood in the Tzafit basin.

5. Conclusions

Numerical simulations were conducted to evaluate the importance of local (soil moisture) versus non-local moisture sources on the strong convective event in the Levant on 25 and 26 April 2018. Late morning flooding in the river gorge of Tzafit killed 10 student hikers, while late afternoon heavy rains flooded streets in Jerusalem. A deterministic WRF forecast based on GFS initial data did not forecast the general characteristics of the flooding events that occurred on 26 April 2018. WRF sensitivity simulation tests produced with added local and non-local moisture sources showed the importance of both sources of moisture. The added moisture led to areas with increased atmospheric instability (i.e., larger CAPE), resulting in an enhanced lightning intensity and precipitation on the 26th, suggesting that antecedent precipitation “primed” the atmosphere for convection on the 26th.
Precipitation on 25 April led to a latent heat flux increase of about 65% from 25 to 26 April in the control simulation (based on GFS boundary conditions), but more than 100% in simulations with volumetric soil moisture based on assimilated rainfall. Local moisture sources led to a near doubling of maximum CAPE values on 26 April, the day of the floods. The effect of local moisture sources was to qualitatively improve the 12-h forecast of lightning and precipitation along the central mountain ridge of Jerusalem. Non-local moisture sources contributed importantly to enhanced lightning and precipitation intensity in the Tzafit river gorge. Non-local moisture sources also led to an increase in lightning activity over a wide area in the south of Israel. The combination or synergistic interactions of moisture sources led to increases in the intensity of lighting along the Jerusalem north-to-south mountain ridge, as well as large parts of southern Israel, and near the Tzafit river gorge. Concurrently, there was also additional precipitation in the gorge itself.
Barton et al. [43] documented the impact of soil moisture gradients on strong convection in the mountainous Tibetan Plateau. They found that mesoscale gradients in soil moisture led to stronger convection, especially in the presence of light winds. In the current study, WRF simulations using derived antecedent precipitation showed strong gradients in precipitation, where elevated soil moisture areas likely favored convection on 26 April 2018, when the flooding rains occurred. On the other hand, Alfieri et al. [44] found that antecedent soil moisture was not correlated with next-day daily convective precipitation events, suggesting that other factors besides soil moisture are also relevant to convective growth. This might be explained by the possible effect of an increase of soil moisture leading to a general decrease in CAPE due to associated surface cooling. In other words, antecedent precipitation might lead to an increase in convective activity when a strong upper-level low (as occurred on these days) follows a rainy day. Furthermore, Grimm et al. [45] found that soil moisture gradients can lead to the persistent formation of convective cells in large-scale systems in semi-arid regions, conditions similar to the Israeli landscape in springtime. It should also be noted that mid-level moisture in Red-Sea Trough synoptic settings is known to have played a significant role in many flooding events in the area, such as those described by de-Vries et al. [46], Shentsis et al. [47], and Belachsan et al. [48].
Various approaches exist to improve short-term convective forecasts. These include the assimilation of radar and lightning data, as well as winds, etc. After the flood event, the first author tried various approaches to assimilate lightning data immediately prior to the development of the severe storms on 26 April. While convection was initiated (not shown), it soon dissipated after the lightning assimilation was turned off. This suggests that the GFS initial conditions used in the WRF model were not able to sustain convection, leading to the conclusion that the land surface soil and desert areas within Israel and in neighboring states were not sufficiently moistened by antecedent precipitation prior to the 26th.
Hence, this study’s conclusions emphasize the importance of obtaining high-quality land surface soil moisture data when forecasting convection over dry land areas, especially when the wind trajectory is over land, supporting the need, for example, for NASA’s “Soil Moisture Active Passive” mission (https://smap.jpl.nasa.gov/, accessed on 1 May 2021). One possible path to creating gridded datasets is the assimilation of remote and gauge precipitation, as well as remotely sensed moisture data [39]. Because of the potential sensitivity of model forecast results to volumetric soil moisture, it is worth continuing to explore the potential of using “blended” soil moisture datasets in both deterministic and ensemble forecasting, even in sparsely vegetated areas [49].
This paper investigated the potential importance of local and remote moisture sources on total 12-h precipitation amounts. Desert flooding, however, can occur from short-lived convective cells (less than 1 h, for example). Simulations are planned with Spectral (bin) Microphysics that will utilize the initial conditions found in this study to be most favorable to the development of heavy rains in the observed locations. These simulations will also include the impact of desert dust on cloud and ice nucleation, and use lightning assimilation just prior to the flooding events in the local domain to trigger convection at the right time and place. It is hoped that the combination of improved soil initialization, coupled with lightning assimilation on the local domain, will enable us to investigate the impact of dust on precipitation intensity on the development of convection on 25 and 26 April 2018. Together, improved sensing of soil moisture and atmospheric dust could lead to improvements in the ability to forecast potentially deadly flooding events.

Author Contributions

B.L. wrote the manuscript and conducted the research. Y.Y. edited the manuscript and arranged funding to support the research. Y.L. provided editorial support and data analysis support, S.Z.Z. and Y.R. calculated the precipitable water shown in Figure 6. A.K. helped improve the analysis of the model results. All authors have read and agreed to the published version of the manuscript.

Funding

This research was supported by Israeli Science Foundation collaboration with the Chinese National Science Foundation (ISF-NSFC) grant number 2640/17. A. Khain was supported by DoE projects DE-FOA-0001638 and DE-0000237884.

Institutional Review Board Statement

None required.

Informed Consent Statement

None required.

Data Availability Statement

No data accessed.

Acknowledgments

Computer resources were provided by The Hebrew University of Jerusalem, Department of Earth Sciences, and Weather It Is, LTD. This research was supported by Israeli Science Foundation collaboration with the Chinese National Science Foundation (ISF-NSFC) grant number 2640/17. A. Khain was supported by DoE projects DE-FOA-0001638 and DE-0000237884. Radar data were provided by the Israel Meteorological Service. The Quantitative Precipitation Estimation (QPE) analysis was produced by Elyakom Vadislavsky from the Israel Meteorological Service (IMS). The lightning data are the property of Weather It Is, LTD. The version of the WRF model is based on the publicly available version, WRF Model Version 4.03 (18 December 2018) http://www2.mmm.ucar.edu/wrf/users/, accessed on 1 May 2021.

Conflicts of Interest

The authors declare no conflict of interest.

References

  1. Ford, T.W.; Rapp, A.D.; Quiring, S.M. Does Afternoon Precipitation Occur Preferentially over Dry or Wet Soils in Oklahoma? J. Hydrometeorol. 2015, 16, 874–888. [Google Scholar] [CrossRef]
  2. Guzmán, A.G.; Torrez, W.C. Daily Rainfall Probabilities: Conditional upon Prior Occurrence and Amount of Rain. J. Appl. Meteorol. Climatol. 1985, 24, 1009–1014. [Google Scholar] [CrossRef] [Green Version]
  3. Rinat, Y.; Marra, F.; Armon, M.; Metzger, A.; Levi, Y.; Khain, A.; Vadislavsky, E.; Rosensaft, M.; Morin, E. Hydrometeorological analysis and forecasting of a 3 d flash-flood-triggering desert rainstorm. Nat. Hazards Earth Syst. Sci. 2021, 21, 917–939. [Google Scholar] [CrossRef]
  4. Shalev, S.; Saaroni, H.; Izsak, T.; Yair, Y.; Ziv, B. The spatio-temporal distribution of lightning over Israel and the neighboring area and its relation to regional synoptic systems. Nat. Hazards Earth Syst. Sci. 2011, 11, 2125–2135. [Google Scholar] [CrossRef] [Green Version]
  5. Dayan, U.; Lensky, I.M.; Ziv, B. Atmospheric Conditions Leading to an Exceptional Fatal Flash Flood in the Negev Desert, Israel. Nat. Hazards Earth Syst. Sci. Discuss. 2020, 21, 1583–1597. [Google Scholar] [CrossRef]
  6. Muñoz, C.; Schultz, D.; Vaughan, G. A midlatitude climatology and interannual variability of 200- and 500-hPa cut-off lows. J. Clim. 2020, 33, 2201–2222. [Google Scholar] [CrossRef] [Green Version]
  7. Reichle, R.H.; Koster, R.D.; Dong, J.; Berg, A.A. Global Soil Moisture from Satellite Observations, Land Surface Models, and Ground Data: Implications for Data Assimilation. J. Hydrometeorol. 2004, 5, 430–442. [Google Scholar] [CrossRef]
  8. Quiring, S.M.; Ford, T.W.; Wang, J.K.; Khong, A.; Harris, E.; Lindgren, T.; Goldberg, D.W.; Li, Z. The North American Soil Moisture Database: Development and Applications. Bull. Am. Met. Soc. 2016, 97, 1441–1459. [Google Scholar] [CrossRef]
  9. Ford, T.W.; Quiring, S.M.; Zhao, C.; Leasor, Z.T.; Landry, C. Triple Collocation Evaluation of In Situ Soil Moisture Observations from 1200+ Stations as part of the U.S. National Soil Moisture Network. J. Hydrometeorol. 2020, 21, 2537–2549. [Google Scholar] [CrossRef]
  10. Chen, F.; Crow, W.T.; Ryu, D. Dual Forcing and State Correction via Soil Moisture Assimilation for Improved Rainfall–Runoff Modeling. J. Hydrometeorol. 2014, 15, 1832–1848. [Google Scholar] [CrossRef]
  11. Bui, V.; Chang, L.; Heckman, S. A Performance Study of Earth Networks Total Lighting Network (ENTLN) and Worldwide Lightning Location Network (WWLLN). In Proceedings of the International Conference on Computational Science and Computational Intelligence (CSCI), Las Vegas, NV, USA, 7–9 December 2015; pp. 386–391. [Google Scholar] [CrossRef]
  12. Fierro, A.O.; Mansell, E.R.; Ziegler, C.L.; MacGorman, D.R. Application of a lightning data assimilation technique in the WRF-ARW model at cloud-resolving scales for the Tornado Outbreak of 24 May 2011. Mon. Weather Rev. 2012, 140, 2609–2627. [Google Scholar] [CrossRef]
  13. Marshall, J.S.; Palmer, W.M. The distribution of raindrops with size. J. Meteor 1948, 5, 165–166. [Google Scholar] [CrossRef]
  14. Haiden, T.; Kann, A.; Wittmann, C.; Pistotnik, G.; Bica, B.; Gruber, C. The Integrated Nowcasting through Comprehensive Analysis (INCA) system and its validation over the Eastern Alpine region. Weather Forecast. 2011, 26, 166–183. [Google Scholar] [CrossRef]
  15. Bar-Sever, Y.E. Real-Time GNSS Positioning with JPL’s new GIPSYx Software. In Proceedings of the AGU Fall Meeting Abstracts 2016, San Francisco, CA, USA, 13–16 December 2016; p. G44A-04. [Google Scholar]
  16. Duan, J.; Bevis, M.; Fang, P.; Bock, Y.; Chiswell, S.; Businger, S.; Rockend, C.; Solheimd, F.; van Hoved, T.; Ware, R.; et al. GPS Meteorology: Direct Estimation of the Absolute Value of Precipitable Water. J. Appl. Meteorol. 1996, 35, 830–838. [Google Scholar] [CrossRef] [Green Version]
  17. Webb, F.; Zumberge, J. An Introduction to GIPSY/OASIS-II; JPL Publication D-11088; Jet Propulsion Laboratory: Pasadena, CA, USA, 1993. [Google Scholar]
  18. Davis, J.; Herring, T.; Shapiro, I.; Rogers, A.; Elgered, G. Geodesy by radio interferometry: Effects of atmospheric modeling errors on estimates of baseline length. Radio Sci. 1985, 20, 1593–1607. [Google Scholar] [CrossRef]
  19. Böhm, J.; Niell, A.; Tregoning, P.; Schuh, H. Global Mapping Function (GMF): A new empirical mapping function based on numerical weather model data. Geophys. Res. Lett. 2006, 33. [Google Scholar] [CrossRef] [Green Version]
  20. Reuveni, Y.; Kedar, S.; Owen, S.E.; Moore, A.W.; Webb, F.H.I. Improving sub-daily strain estimates using GPS measurements. Geophys. Res. Lett. 2012, 39. [Google Scholar] [CrossRef]
  21. Reuveni, Y.; Kedar, S.; Moore, A.W.; Webb, F. Analyzing slip events along the Cascadia margin using an improved subdaily GPS analysis strategy. Geophys. J. Int. 2014, 198, 1269–1278. [Google Scholar]
  22. Reuveni, Y.; Bock, Y.; Tong, X.; Moore, A.W. Calibrating interferometric synthetic aperture radar (InSAR) images with regional GPS network atmosphere models. Geophys. J. Int. 2015, 202, 2106–2119. [Google Scholar] [CrossRef] [Green Version]
  23. Ziskin Ziv, S.; Yair, Y.; Alpert, P.; Uzan, L.; Reuveni, Y. The diurnal variability of precipitable water vapor derived from tropospheric path delays over the eastern Mediterranean. Atmos. Res. 2021, 249, 105307. [Google Scholar] [CrossRef]
  24. Ziskin Ziv, S.; Alpert, P.; Reuveni, Y. Long term variability and trends of precipitable water vapor derived from GPS tropospheric path delays over the Eastern Mediterranean. Int. J. Climatol. 2021. [Google Scholar] [CrossRef]
  25. Brocca, L.; Crow, W.T.; Ciabatta, L.; Massari, C.; De Rosnay, P.; Enenkel, M.; Hahn, S.; Amarnath, G.; Camici, S.; Tarpanelli, A.; et al. A review of the applications of ASCAT soil moisture products. IEEE J. Sel. Top. Appl. Earth Obs. Remote Sens. 2017, 10, 2285–2306. [Google Scholar] [CrossRef]
  26. Bartalis, Z.; Wagner, W.; Naeimi, V.; Hasenauer, S.; Scipal, K.; Bonekamp, H.; Figa, J.; Anderson, C. Initial soil moisture retrievals from the METOP-A Advanced Scatterometer (ASCAT). Geophys. Res. Lett. 2007, 34, 20. [Google Scholar] [CrossRef] [Green Version]
  27. Lynn, B.H.; Yair, Y.; Shpund, J.; Levi, Y.; Qie, X.; Khain, A. Using factor separation to elucidate the respective contributions of desert dust and urban pollution to the 4 January 2020 Tel Aviv lightning and flash flood disaster. J. Geophys. Res. Atmos. 2020, 125, e2020JD033520. [Google Scholar] [CrossRef]
  28. Skamarock, W.C.; Klemp, J.B.; Dudhia, J.; Gill, D.O.; Barker, D.; Duda, M.G.; Huang, X.-y.; Wang, W.; Powers, J.G. A Description of the Advanced Research WRF Version 3; (No. NCAR/TN-475+STR); University Corporation for Atmospheric Research: Boulder, CO, USA, 2008. [Google Scholar] [CrossRef]
  29. Kain, J.S. The Kain–Fritsch convective parameterization: An update. J. Appl. Meteorol. 2004, 43, 170–181. [Google Scholar] [CrossRef] [Green Version]
  30. Thompson, G.; Eidhammer, T. A Study of Aerosol Impacts on Clouds and Precipitation Development in a Large Winter Cyclone. J. Atmos. Sci. 2014, 71, 3636–3658. Available online: https://journals.ametsoc.org/view/journals/atsc/71/10/jas-d-13-0305.1.xml (accessed on 21 March 2021). [CrossRef]
  31. Bowden, J.H.; Otte, T.L.; Nolte, C.G.; Otte, M.J. Examining interior grid nudging techniques using two-way nesting in the WRF model for regional climate modeling. J. Clim. 2012, 25, 2805–2823. [Google Scholar] [CrossRef]
  32. Levin, Z.; Ganor, E.; Gladstein, V. The Effects of Desert Particles Coated with Sulfate on Rain Formation in the Eastern Mediterranean. J. Appl. Meteorol. 1996, 35, 1511–1523. [Google Scholar] [CrossRef] [Green Version]
  33. Shpund, J.; Khain, A.; Lynn, B.; Fan, J.; Han, B.; Ryzhkov, A.; Snyder, J.; Dudhia, J.; Gill, D. Simulating a mesoscale convective system using WRF with a new spectral bin microphysics: 1: Hail vs Graupel. J. Geophys. Res. Atmos. 2019, 124, 14072–14101. [Google Scholar] [CrossRef]
  34. Lu, Y.; Steele-Dunne, S.C.; De Lannoy, G.J.M. Improving Soil Moisture and Surface Turbulent Heat Flux Estimates by Assimilation of SMAP Brightness Temperatures or Soil Moisture Retrievals and GOES Land Surface Temperature Retrievals. J. Hydrometeorol. 2020, 21, 183–203. [Google Scholar] [CrossRef]
  35. Niu, G.Y.; Yang, Z.L.; Mitchell, K.E.; Chen, F.; Ek, M.B.; Barlage, M.; Kumar, A.; Manning, K.; Niyogi, D.; Rosero, E.; et al. The community Noah land surface model with multiparameterization options (Noah-MP): 1. Model description and evaluation with local-scale measurements. J. Geophys. Res. 2011, 116, D12109. [Google Scholar] [CrossRef] [Green Version]
  36. Lynn, B.H.; Yair, Y.; Price, C.; Kelman, G.; Clark, A.J. Predicting cloud-to-ground and intracloud lightning in weather forecast models. Weather Forecast. 2012, 27, 1470–1488. [Google Scholar] [CrossRef]
  37. Lynn, B.; Yair, Y. Prediction of lightning flash density with the WRF model. Adv. Geosci. 2010, 23, 11–16. [Google Scholar] [CrossRef] [Green Version]
  38. Yair, Y.; Lynn, B.; Price, C.; Kotroni, V.; Lagouvardos, K.; Morin, E.; Mugnai, A.; Llasat, M.D.C. Predicting the potential for lightning activity in Mediterranean storms based on the Weather Research and Forecasting (WRF) model dynamic and microphysical fields. J. Geophys. Res. 2010, 115, D04205. [Google Scholar] [CrossRef] [Green Version]
  39. Liu, Q.; Reichle, R.H.; Bindlish, R.; Cosh, M.H.; Crow, W.T.; de Jeu, R.; Gabrielle, J.; De Lannoy, M.; Huffman, G.J.; Jackson, T.J. The Contributions of Precipitation and Soil Moisture Observations to the Skill of Soil Moisture Estimates in a Land Data Assimilation System. J. Hydrometeorol. 2011, 12, 750–765. [Google Scholar] [CrossRef]
  40. Alpert, P.; Tzidulko, M.; Krichak, S.; Stein, U. A multi-stage evolution of an ALPEX cyclone. Tellus 1996, 48A, 209–220. [Google Scholar] [CrossRef]
  41. Alpert, P.; Sholokhman, T. (Eds.) Factor Separation in the Atmosphere, Applications and Future Prospects; Cambridge University Press: Cambridge, UK, 2011; p. 274. Available online: http://www.cambridge.org/catalogue/catalogue.asp?isbn=9780521191739 (accessed on 1 May 2021).
  42. Lynn, B.H.; Kelman, G.; Ellrod, G. An evaluation of the efficacy of using observed lightning to improve convective lightning forecasts. Weather Forecast. 2015, 30, 405–423. [Google Scholar] [CrossRef]
  43. Barton, E.J.; Taylor, C.M.; Klein, C.; Harris, P.P.; Meng, X. Observed Soil Moisture Impact on Strong Convection over Mountainous Tibetan Plateau. J. Hydrometeorol. 2021, 22, 561–572. [Google Scholar] [CrossRef]
  44. Alfieri, L.; Claps, P.; D’Odorico, P.; Laio, F.; Over, T.M. An Analysis of the Soil Moisture Feedback on Convective and Stratiform Precipitation. J. Hydrometeorol. 2008, 9, 280–291. [Google Scholar] [CrossRef] [Green Version]
  45. Grimm, A.M.; Pal, J.S.; Giorgi, F. Connection between Spring Conditions and Peak Summer Monsoon Rainfall in South America: Role of Soil Moisture, Surface Temperature, and Topography in Eastern Brazil. J. Clim. 2007, 20, 5929–5945. [Google Scholar] [CrossRef] [Green Version]
  46. De Vries, A.J.; Tyrlis, E.; Edry, D.; Krichak, S.O.; Steil, B.; Lelieveld, J. Extreme precipitation events in the Middle East: Dynamics of the Active Red Sea Trough. J. Geophys. Res. Atmos. 2013, 118, 7087–7108. [Google Scholar] [CrossRef]
  47. Shentsis, I.; Laronne, J.B.; Alpert, P. Red Sea Trough flood events in the Negev, Israel (1964–2007). Hydrol. Sci. J. 2012, 57, 42–51. [Google Scholar] [CrossRef]
  48. Belachsen, I.; Marra, F.; Peleg, N.; Morin, E. Convective rainfall in a dry climate: Relations with synoptic systems and flash-flood generation in the Dead Sea region. Hydrol. Earth Syst. Sci. 2017, 21, 5165–5180. [Google Scholar] [CrossRef] [Green Version]
  49. Yin, J.; Zhan, X.; Zheng, Y.; Liu, J.; Fang, L.; Hain, C.R. Enhancing Model Skill by Assimilating SMOPS Blended Soil Moisture Product into Noah Land Surface Model. J. Hydrometeorol. 2015, 16, 917–931. [Google Scholar] [CrossRef]
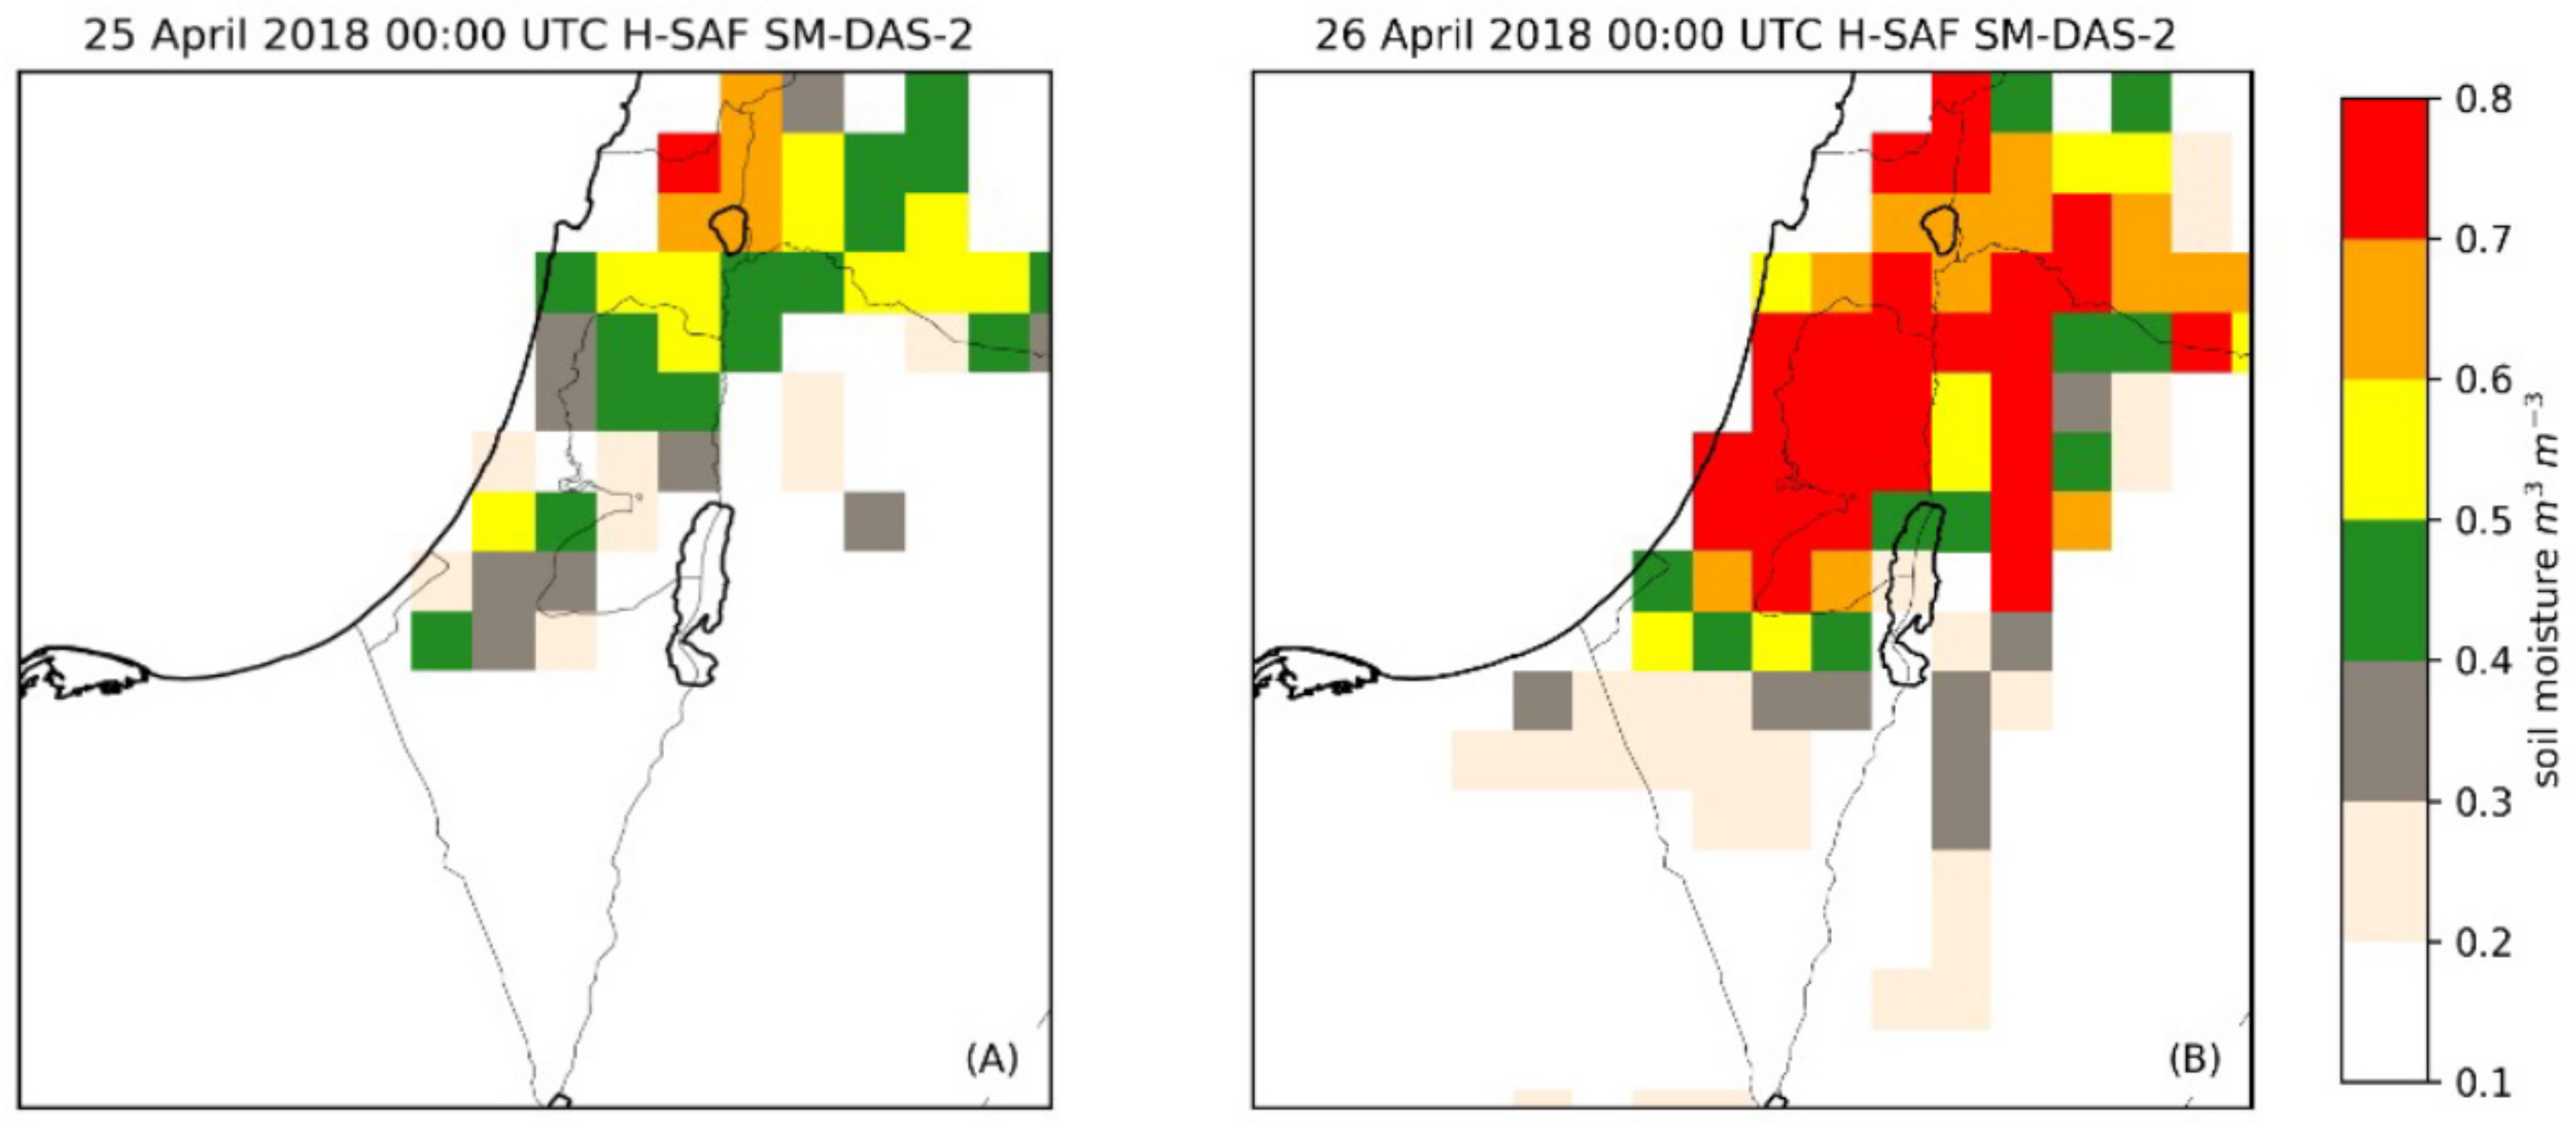
Figure 1. Advanced Scatterometer (ASCAT) derived moisture index within the upper soil layer with thickness of 0.07 m, at the beginning of (A) 25 April 2018 and (B) 26 April 2018.
Atmosphere 12 00855 g001
Figure 2. ERA5 reanalysis of a 500 hPa cut-off low-pressure system within the Levant region at 00:00 and 12:00 UTC on 25 and 26 April 2018. (A) at 0000 UTC 25 April, (B) at 1200 UTC April 25, (C) at 0000 UTC 26 April, and (D) at 1200 UTC 26 April 2018.
Atmosphere 12 00855 g002
Figure 3. Topographical maps of the grid domains used in the simulation experiments (left). The outside grid, labeled D01, had 12 km grid spacing, while domain D02 (thick black border) had 4 km grid spacing. The innermost domain D03 (thin black border) had 1.3 km grid spacing. The Mediterranean and Red Seas are both colored dark green. Close-up of the highest resolution domain that shows the cities of Tel Aviv, Haifa, Bet Shean, Jerusalem, and Dimona (grey lettering). The Tzafit river gorge is located about 25 km southeast of Dimona.
Atmosphere 12 00855 g003
Figure 4. Daily observed total lightning for the 24 h time periods shown (e.g., (a) 21–22: 0000 UTC 21 April until (e) 0000 UTC 22 April 2018). The total number of recorded events within are also shown. The letter or letter combinations refer to the location of cities references within the text. T A refer to the city of Tel Aviv, B S to Bet She’an, H to Haifa, J to Jerusalem, and D to Dimona. Dimona is about 25 km to the Northwest of the Tzafit river basin where the students died in a flood.
Atmosphere 12 00855 g004
Figure 5. Derived rainfall rates from observed radar reflectivity for the 12 h periods ending at the (a) 0600 UTC 25 April, (b) 1800 UTC 25 April, (c) 0600 UTC 26 April, and (d) 1800 UTC 26 April 2018. The domain averages are also shown in the panel labels.
Atmosphere 12 00855 g005
Figure 6. Same as Figure 4, but for daily averaged derived precipitable water from observations of satellite GPS data from (a) UTC 21 April to (f) 27 April 2018.
Atmosphere 12 00855 g006
Figure 7. Volumetric soil moisture in the first soil layer (1–10 cm) from four different simulations at 0000 UTC 26 April 2018. In (a), GFS initial conditions were used in a WRF simulation, which produced precipitation that wet the ground (the Control). In (b), 10-min derived rainfall rate from radar observations was used instead of simulated rainfall to moisten the soil (S-1.0). In (c), observed rainfall rate was increased by 50% (S-1.5), while in (d) the observed rainfall was twice multiplied (S-2.0). The derived soil moisture (bd) was then used in WRF simulations with soil-atmospheric feedbacks only allowed to affect the surface temperature, but not soil moisture.
Atmosphere 12 00855 g007
Figure 8. Simulated latent heat from forecasts with GFS initial volumetric soil moisture and those with derived soil moisture values based on radar observations. S-1 used the derived precipitation in 10 min intervals. S-1.5 and S-2.0 used 50 and 100% higher rainfall amounts (twice multiplied). Values were averaged from 0600 to 1800 UTC 25 April 2018 (ad), and 26 April 2018 (eh). The area average of latent heat flux over land is given in the map label within parentheses.
Atmosphere 12 00855 g008
Figure 9. Volumetric soil moisture versus CAPE on 26 April 2018 (over land, only) between the hours of 0600 and 1700 UTC. The output frequency was 1 h. The CAPE values shown in the scatter plot are the differences between the Control and S-1.0 (blue), S-1.5 (green), and S-2.0 (red) simulations. (A) CAPE versus surface soil moisture, and (B) CAPE versus first layer (0.1–10 cm) soil moisture. The null hypothesis was rejected at the 5% level (“Prob” or probability = 1).
Atmosphere 12 00855 g009
Figure 10. Average daily precipitable water derived from WRF Control simulation (af) and S-2.0 (gl) output from hourly output for the days shown. Average values are shown in the parentheses.
Atmosphere 12 00855 g010
Figure 11. Simulated 12 h rainfall rates from simulations with soil moisture initialized from the Control (a,e), S-1.0 (b,f), S-1.5 (c,g), and S-2.0 (d,h) Area averages are given in the parentheses.
Atmosphere 12 00855 g011
Figure 12. Factor separation maps for maximum daytime CAPE between 0600 and 1700 UTC on 25 and 26 April 2018. The factors were calculated for the 1.3 km (D03) simulation domain. The factor fo (a,e) is from the control simulation, while f1 (b,f) represents the effect of local volumetric soil moisture (from S-2.0) on maximum CAPE values. The factor f2 (c,g), represents the effect of non-local moisture sources on maximum CAPE values, while f12 (d,h) shows the effect of coupled interactions of nonlocal and local moisture sources on maximum CAPE. The numbers within the parentheses show the average values of CAPE over land.
Atmosphere 12 00855 g012
Figure 13. Factor separation maps for 12 h lightning rates from the 1.3 km (D03) domain. The factor fo (a,e)is from the control simulation, while f1 (b,f) represents the effect of local soil moisture on 12 h lightning rates. The factor f2 (c,g) represents the effect of non-local moisture sources on lightning rates, while f12 (d,h) shows the effect of coupled interactions of non-local and local moisture sources on 12 h lightning rates.
Atmosphere 12 00855 g013
Figure 14. Same as Figure 13, but for 12 h rainfall rates.
Atmosphere 12 00855 g014
Publisher’s Note: MDPI stays neutral with regard to jurisdictional claims in published maps and institutional affiliations.