Abstract
The Typical meteorological year (TMY) database is often used to calculate air-conditioning loads, and it directly affects the building energy savings design. Among four kinds of TMY databases in China—including Chinese Typical Year Weather (CTYW), International Weather for Energy Calculations (IWEC), Solar Wind Energy Resource Assessment (SWERA) and Chinese Standard Weather Data (CSWD)—only CSWD is measures solar radiation, and it is most used in China. However, the solar radiation of CSWD is a measured daily value, and its hourly value is separated by models. It is found that the cloud ratio (diffuse solar radiation divided by global solar radiation) of CSWD is not realistic in months of May, June and July while compared to the other sets of TMY databases. In order to obtain a more accurate cloud ratio of CSWD for air-conditioning load calculation, this study aims to propose a method of refining the cloud ratio of CSWD in Shanghai, China, using observed solar radiation and the Perez model which is a separation model of high accuracy. In addition, the impact of cloud ratio on air-conditioning load has also been discussed in this paper. It is shown that the cloud ratio can yield a significant impact on the air conditioning load.
1. Introduction
The development of meteorological data for the air-conditioning load calculation is currently a subject of study in many countries. Global emissions of carbon dioxide (CO2), which is the main cause of global warming, had been increased by 0.6% in 2018, reaching an all-time high of 36.8 billion ton in 2019. The growth of global emissions in 2019 was almost entirely due to China, which increased its CO2 output by 0.26 Gt CO2 [1]. In China, as the economy grows, the energy supply per person becomes scarce. According to the China Climate Change Info-Net (CCCIN), it is known that China’s CO2 emissions accounted for a relatively large proportion of the world’s CO2 emissions, about 30% in 2016 [2]. Carbon emissions of building and construction industry in China reached 115 billion kg in 2012 and contributed 3.4% to the country’s emissions [3]. Therefore, it is important to estimate the average annual energy consumption and CO2 emissions of buildings [4]. For this task, many standard year weather data sources are used to be input into simulation software such as EnergyPlus [5] that is used worldwide and New HASP/ACLD-β that is often used in Japan [6]. Thus, the accuracy of those Standard Year Weather Data determines the accuracy of the building energy consumption and CO2 emissions calculations.
Among the various parameters in meteorological databases, solar radiation is considered one of the most important for a classification of the sky conditions, which fluctuate from clear to overcast sky, and establishing an appropriate radiance model from experimental data is often required. Thus, many models have been developed to analyze and separate the components of solar radiation in order to achieve the purpose of air-conditioning design and energy savings. An equation of the sky radiance distribution from clear sky to overcast sky, as functions of the cloud ratio and the atmospheric clearness index, was proposed by Brunger and Hooper [7]. Moon and Spencer proposed a luminance distribution model of overcast sky [8]. This overcast sky model was simplified and has been recommended as the CIE standard overcast sky by CIE [9]. The homogeneous sky to show absolute values of sky luminance distribution was proposed by Kittler [10]. This study suggested methods to identify the indicatrix and gradation characteristics by specific trace circle measurements on the sky vault, and it proposed provisional relations expressing their dependence on the illumination turbidity factor of the atmosphere. Perraudeau classified sky conditions into five categories and proposed an equation of sky luminance distribution [11]. Perez et al. proposed the all-weather model as functions of sky clearness and sky brightness by which all skies were classified into eight categories [12].
With calls for further reduction of CO2 emissions and energy conservation, the accuracy of Standard Year Weather Data should be improved for air-conditioning load calculation, which is directly related to energy conservation of buildings. Four kinds of typical meteorological year (TMY) database developed by different organizations are usually used in China [13]: Chinese Typical Year Weather (CTYW), International Weather for Energy Calculations (IWEC), Solar Wind Energy Resource Assessment (SWERA) and Chinese Standard Weather Data (CSWD). Among these TMY databases, only in CSWD—which is the most used in China—is daily solar radiation directly estimated from experimental data, while in the remaining TMY databases, such quantity is evaluated from the observation of other meteorological parameters, such as temperature and relative humidity, through some solar irradiance models. Because each TMY database uses different models to calculate the solar radiation, there will be some differences in solar radiation among these four kinds of TMY database. By comparing the four TMY databases in Shanghai, China, it was found that the cloud ratios (which are defined as diffuse solar radiation divided by global solar radiation) of CSWD for the three months from May to July are relatively lower than the other three TMY databases. Thus, it is questioned if the solar radiation components of the CSWD database may have some accuracy problems, with a correspondence decrease in air-conditioning load calculation accuracy.
Focusing on the solar radiation of CSWD in Shanghai, China, a method is proposed to refine the cloud ratio of CSWD by using the actual observed solar radiation in Shanghai, including diffuse solar radiation and global solar radiation, and an empirical solar radiation separation model [14]. In addition, the influence of cloud ratios on air conditioning load is also discussed using a typical glass building simulation in this paper.
2. Materials and Methods
2.1. Solar Radiation of Standard Year Weather Data in Shanghai
Table 1 shows characteristic of solar radiation of four TMY databases in China. Using the four TMY databases in Shanghai, the monthly cloud ratios of four TMY databases in Shanghai have been calculated and summarized in Figure 1. We can see that the monthly cloud ratio of CSWD in Shanghai is approximately 0.20 lower than that of the other three kinds of TMY database in the three months from May to July, and the monthly cloud ratios of CSWD in the three months have almost the same value of about 0.4. Additionally, a study by Lu et al. [15] showed that the recorded daily global irradiance of CSWD in Shanghai on three days of TMY (12 May, 10 July and 9 October) was zero, and it is considered unrealistic. Thus, the accuracy of solar radiation of CSWD in May, June and July is being questioned.

Table 1.
Summary of four TMY database to derive solar radiation in China.
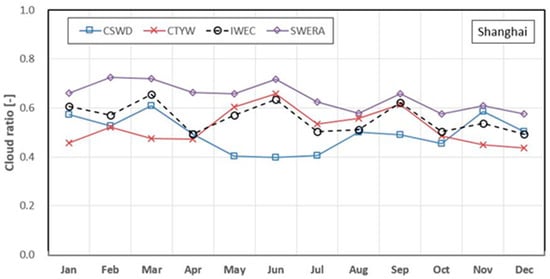
Figure 1.
Calculated monthly cloud ratios among four kinds of TMY database in Shanghai, China.
2.2. Cloud Ratio of Solar Radiation in Japan
With the aim of verifying the error of the cloud ratio of CSWD database, eight major regions (Sapporo: 141.21° E, 43.03° N; Aomori: 140.44° E, 40.49° N; Akita: 140.06° E, 39.43° N; Tokyo: 139.45° E, 35.41° N; Nagoya: 136.54° E, 35.11° N; Osaka: 135.29° E, 34.41° N; Fukuoka: 130.23° E, 33.35° N; Kagoshima: 130.33° E, 31.36° N) of Japan, which is a neighboring country of China, were selected because these selected regions implemented actual observations of solar radiation. The cloud ratios for the eight selected regions of Japan were calculated by using the Expanded AMeDAS Weather Database of Japan [22].
The calculated monthly cloud ratios for the eight main regions of Japan are shown in Figure 2. Results show that the monthly cloud ratios for the eight regions change around 0.55 in the three months from May to July.
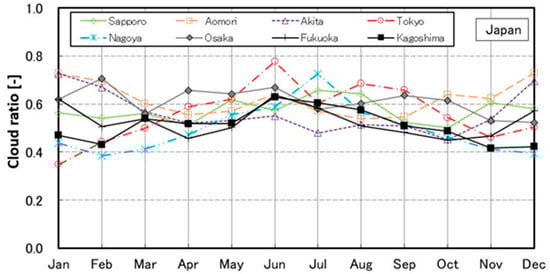
Figure 2.
Comparison of monthly cloud ratios among eight main sites of Japan.
2.3. Sky Condition Classification
In order to put another argument against CSWD accuracy for the months of May, June and July in Shanghai, China, the sky conditions are classified into five states depending on the clear sky index (Kc) and cloudless index (Cle) by Igawa et al [23]. The Kc index is defined based on the global solar radiation, and the Cle index is defined based on the global solar radiation and diffuse solar radiation. The matrix of sky condition classification is shown in Figure 3. The sky conditions are tentatively classified into five categories: (1) clear sky conditions (sky index (Si) ≥ 1.7); (2) near clear sky conditions (1.7 ≥ Si > 1.5); (3) intermediate sky conditions (1.5 ≥ Si > 0.6); (4) near overcast sky conditions (0.6 ≥ Si > 0.3); and (5) overcast sky conditions (Si ≦ 0.3). The sky index (Si) is calculated as “Si = Kc + Cle0.5”.
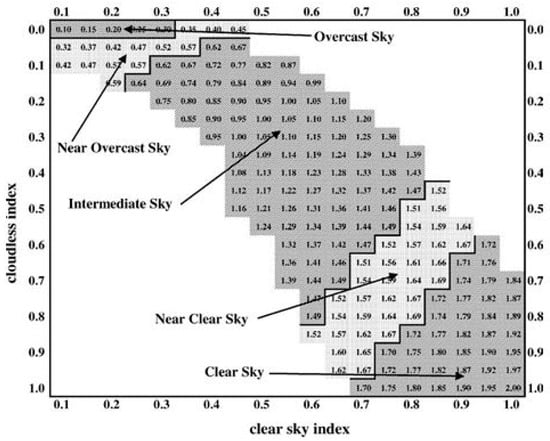
Figure 3.
Matrix of sky condition classification for sky index (Si) by Igawa et al [23].
The indices of Kc and Cle are calculated by using Kasten’s formulation [24]. The formulation to derive Kc and Cle is shown as follows:
where “Ig” is the global solar radiation [W/m2], “Ic” is direct solar radiation outside atmosphere (≒1.367 [W/m2]), “m” is the atmospheric path [-], “TL” is the Linke turbidity factor (=2.5), “γ” is the solar zenith angle [deg], “Kc” is the clear sky index [-], “Ig0” is the standard global solar radiation [W/m2], “Cle” is the cloudless index [-], “Ce” is the cloud ratio [-], “Ces” is the standard cloud ratio [-], and “Id” is the diffuse solar radiation [W/m2].
Kc = Ig/Ig0
m = 1/(cosγ + 0.50572 × (96.07995 − γ)−1.6364)
Ig0 = 0.84 × Ic/m × exp(−0.027 × TL × m)
Cle = (1 − Ce)/(1 − Ces)
Ce = Id/Ig
Ces = 0.01299 + 0.07698 × m − 0.003857 × m2 + 0.0001054 × m3 − 0.000001031 × m4
Calculating the Kc and Cle of representative clear days (27 May, 29 June and 25 July) of May, June and July for CSWD, it is shown that the calculated indices of Kc and Cle are 0.58 and 1.18 for 27 May, respectively; 0.62 and 1.06 for 29 June, respectively; and 0.70 and 1.10 for 25 July, respectively. The Cle index of the three representative clear days is out of sky condition classification. In addition to these three representative clear days, it was found that there are many other days that are also out of sky condition classification as shown in Figure 3. Thus, it is considered that the solar radiation of CSWD may deviate from reality in the three months from May to July.
3. Refinement to Solar Radiation
3.1. Observed Solar Radiation
With the purpose of refining the solar radiation of three months (May, June and July) of CSWD, actual observation of solar radiation was carried out in Shanghai, China. A pyranometer (as shown in Figure 4) was placed on the rooftop of a building of Tongji University located in Shanghai, China to observe the global solar radiation and diffuse solar radiation with a step of one-minute record. The rotary shielding band is applied to cover the direct solar radiation of sunlight and observe the diffuse solar radiation with a data interval of five minutes.
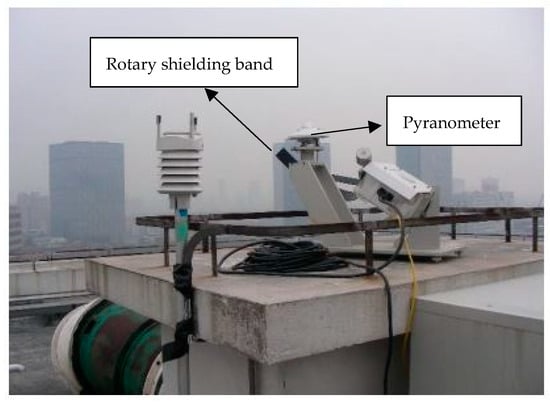
Figure 4.
Installation situation of on-site pyranometer with totary shielding band.
As an example of the observed solar radiation data, Figure 5 shows the actual observed global solar radiation and diffuse solar radiation with one-minute intervals from January to September (the data for the three months from October to December is not completed due to instrument failure), 2011 in Shanghai, China. The monthly average cloud ratios of the solar radiation from January to September were calculated using the solar radiation data so obtained. It is shown that all nine months have cloud ratios of above 0.5, and the results are also larger than the value of the CSWD database from May to July.
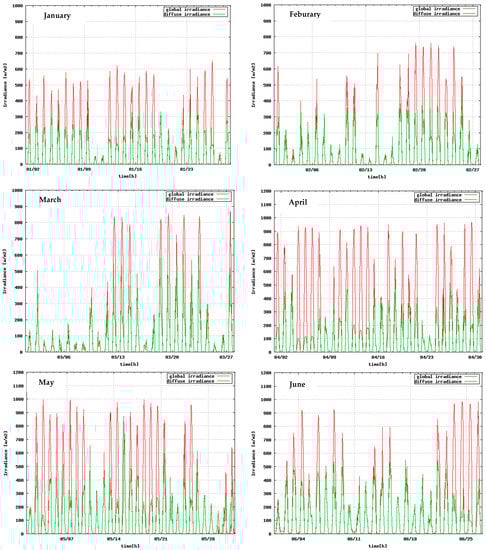
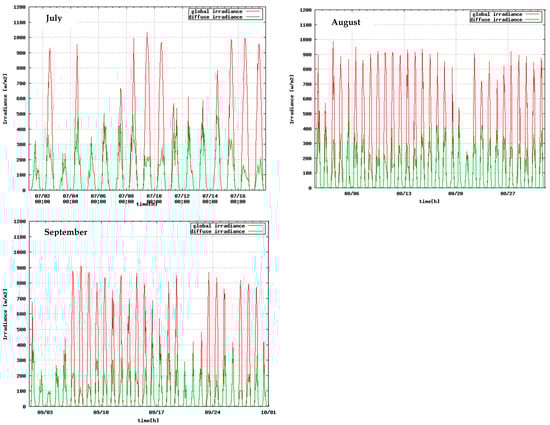
Figure 5.
Actual observed solar radiation (diffuse irradiance and global irradiance) from January to September, 2011 in Shanghai, China; please note that the observation that zero values of irradiance in the figures correspond to night hours.
A representative day was selected from each month (Jan. to Sep.) as the analysis object, and the daily average cloud ratios, Kc and Cle, of selected relatively clear days from each month (Jan. to Sep.) were calculated using the Equations (1)–(6) above, and the results are recorded in Figure 6. We can see that all indicators of Kc and Cle on these days are within the sky condition classification (as shown in Figure 3) proposed by Igawa et al [23]. Thus, we can conclude that these observed solar radiations can be trusted for modifying the cloud ratio of CSWD database.
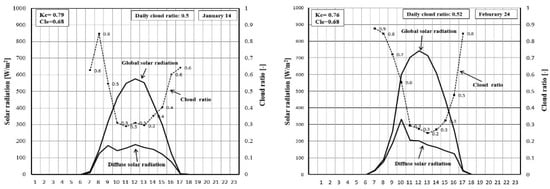
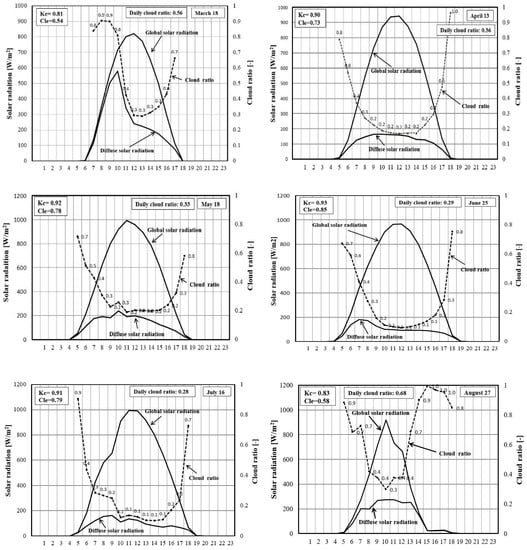
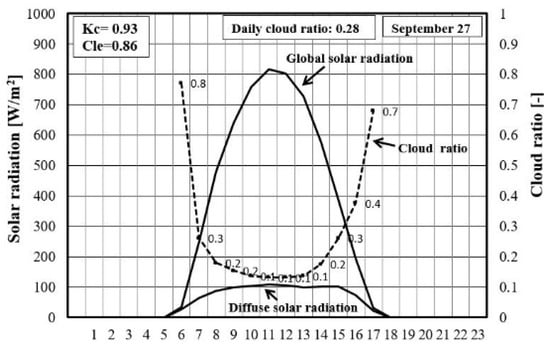
Figure 6.
Daily cloud ratios, Kc and Cle of a relatively clear day selected from each month (from January to September) in Shanghai, China.
Figure 7 shows the comparison of monthly cloud ratios from January to September between observed solar radiation and CSWD in Shanghai. It is indicated that the monthly average cloud ratios calculated by observed global solar radiation and diffuse solar radiation vary from 0.5 to 0.63, and they are about 0.15 larger than that of CSWD in the three months from May to July. There is almost no difference compared to the other months.
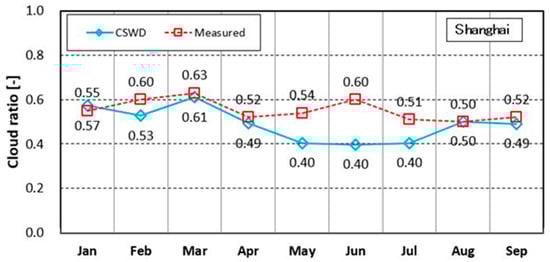
Figure 7.
Monthly average cloud ratios calculated by observed solar radiation and CSWD database in Shanghai, China.
The observation solar radiation in this paper is only a single year’s data for Shanghai, thus we considered the fact that data exposed in this section are just indicative for a low accuracy concerning CSWD cloud ratios data for the town of Shanghai, China.
3.2. Introduction of Perez Model
The research by Soga et al [25] compared a lot of solar radiation separation models and indicated that the “Perez model” [14] has a high separation accuracy compared to other solar radiation separation models; thus, this study adopts the “Perez model” to separate the diffuse and direct solar radiation from global solar radiation.
The equations of solar radiation separation involved in the Perez model are shown in the following:
If, Kc ≤ 0.6, then,
If, Kc > 0.6, then,
where “I” is the direct solar radiation, “Idisc” is the direct solar radiation estimated by the DISC model proposed by Maxwell [26], “X (Kc′, Z, W, ∆Kc′)” is a coefficient function of the four insolation condition parameters, “Kc” is the ratio of global to extraterrestrial irradiance on a horizontal plane, “m” is the atmospheric path as defined in Equation (2) of Section 2.3, and “Ic” is the normal incident extraterrestrial solar radiation.
where “Kc′” is the clearness index, “Ig” is the global solar radiation, and “Z” is the solar altitude.
where the subscripts i, i + 1, and I − 1 refer, respectively, to the current, the next, and the previous hourly record. If the hourly record before or after is missing (for example, the beginning or end of the day), ∆Kc′ may be expressed as,
I = Idisc · X (Kc′, Z, W, ΔKc′)
Idisc = Ic · [Knc − {A + B · exp(C · m)}]
Knc = 0.866 − 0.122m + 0.0121m2 − 0.000653m3 + 0.000014m4
A = 0.512 − 1.56Kc + 2.286Kc2 − 2.22Kc3
B = 0.37 + 0.962Kc
C = −0.28 + 0.932Kc − 2.048Kc2
A = −5.743 + 21.77Kc − 27.49Kc2 + 11.56Kc3
B = 41.40 − 118.5Kc + 66.05Kc2 + 31.9Kc3
C = −47.01 + 184.2Kc − 222.0Kc2 + 73.81Kc3
Kc = Ig/(Ic · sinZ)
Kc′ = Kc/(1.031·exp(−1.4/(0.9 + 9.4/m)) + 0.1)
ΔKt′ = 0.5 · (|Kc′i − Kc′i + 1| + |Kc′i − Kc′i − 1|)
ΔKc′ = |Kc′i − Kc′i ± 1|
The precipitation “W” can be calculated by the dew-point temperature (Td), and it is expressed as equation (20):
W = exp(0.07 · Td − 0.075)
Table 2 shows the summary of the four insolation condition dimensions (solar zenith angle “Z”, clearness index “Kc′”, stability index “∆Kc′”, and precipitation “W”).
Table 2.
Bins used for four insolation condition dimensions X (Kc′, Z, W, ∆Kc′).
The database contains more than 58,000 records from 18 measurement stations at 15 sites in North US and EU.
3.3. Application of Perez Model for Refinement of Solar Radiation
In order to verify the accuracy of Perez model, the following work has been done in this study.
Firstly, we used the Perez model to separate the diffuse solar radiation from global solar radiation observed in Osaka, Japan and compared the diffuse solar radiation separated by Perez model to the observed diffuse solar radiation. The result is shown in Figure 8. We can see that there is a very high correlation coefficient (R2) of approximately 0.998, almost no difference between the diffuse solar radiation estimated by the Perez model and the observed diffuse solar radiation for a representative day in Osaka. Thus, it can be considered that the accuracy of Perez model is reliable.
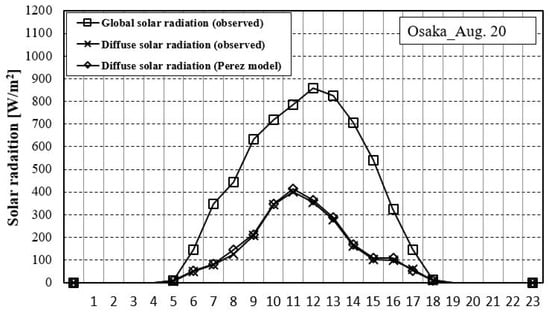
Figure 8.
Observed diffuse solar radiation and diffuse solar radiation separated by the Perez model on a representative day (20 August) in Osaka, Japan.
Secondly, we used the Perez model to refine the solar radiation of the CSWD database of three months from May to July. The solar radiation including direct and diffuse components of three months (May, June and July) for the CSWD database are combined into global solar radiation, and the combined global solar radiation is separated into diffuse and direct solar radiation again by the Perez model.
Thirdly, we compared the diffuse solar radiation of the CSWD database separated by the Perez model with the original diffuse solar radiation of CSWD.
3.4. Proposed Simple Refinement Method
Based on the observed solar radiation at the rooftop of Tongji University located in Shanghai, China, a simple method was proposed to refine the solar radiation of three months (May to July) for CSWD database.
The proposed simple refinement method is storied as the following steps, and shown in Figure 9.
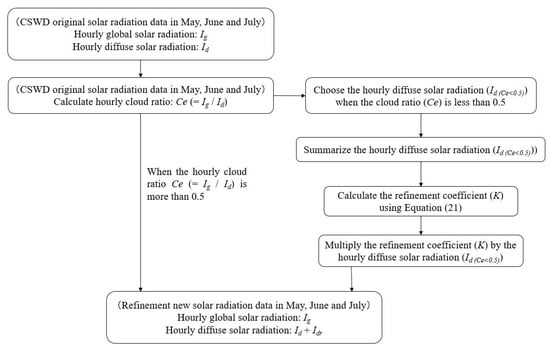
Figure 9.
The steps of authors’ refinement method.
1st step: To calculate the hourly cloud ratio (Ce) of original solar radiation of the CSWD database in three months, from May to July, using equation (5) “Ce = Id/Ig”. If the calculated hourly cloud ratio (Ce) is more than 0.5, the diffuse solar radiation (Id) does not need to be refined, and it will be directly added to the refinement solar radiation of the CSWD database.
2nd step: To choose the hourly diffuse solar radiation (Id) when the hourly cloud ratio (Ce) is less than 0.5, and to define it as “Id(Ce < 0.5)”.
3rd step: To summarize the hourly diffuse solar radiation (Id(Ce < 0.5)).
4th step: To calculate the refinement coefficient (K) by the following Equation (21),
where “Ig” is the original hourly global solar radiation of the CSWD database [W/m2]; “Id” is the original hourly diffuse solar radiation of the CSWD database [W/m2]; “Id(Ce < 0.5)” is the hourly diffuse solar radiation [W/m2], when “Ce“ is less than 0.5; and “K” is the refinement coefficient [-].
{(∑Id - (∑Id(Ce < 0.5)) + (∑Id(Ce < 0.5) × K)} / Ig = 0.5
5th step: To multiply the refinement coefficient (K) by the hourly diffuse solar radiation (Id(Ce < 0.5)) extracted by the 2nd step.
Idr = Id(Ce < 0.5) × K
6th step: To integrate the unrefined hourly diffuse solar radiation (Id) and refined hourly diffuse solar radiation (Idr) of the CSWD database to yield a new refined hourly diffuse solar radiation of three months from May to July.
4. Results and Discussion
4.1. Comparison of Perez Model and Authors’ Proposed Simple Refinement Method
The daily cloud ratios of three representative days (27 May, 29 June and 25 July in Shanghai) are calculated and compared among the original CSWD, Perez model and authors’ proposed simple refinement method.
The results are shown in Figure 10. It is shown that the diffuse solar radiation separated by the Perez model is approximately 90 W/m2 larger in 27 May, approximately 106 W/m2 larger in 29 June, and approximately 94 W/m2 larger in 25 July, while compared to that of the original CSWD database. It is also shown that the difference between the Perez model and the authors’ proposed simple refinement method is less than 10 W/m2, and almost the same.
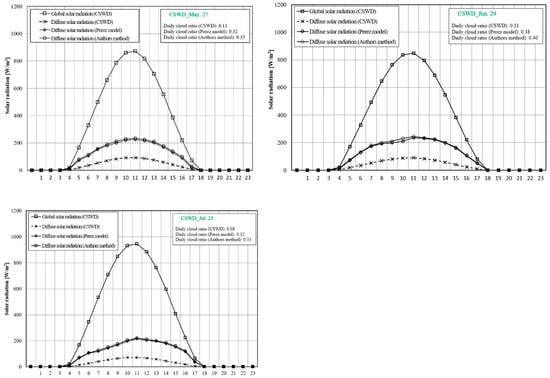
Figure 10.
Comparison of diffuse solar radiation and daily cloud ratios among original CSWD database, Perez model and authors’ simple refinement method in Shanghai, China.
In addition, the daily cloud ratios are also calculated and compared among the three databases (original CSWD, Perez model and authors’ proposed simple refinement method). It is shown that the daily cloud ratio of the Perez model is approximately 0.11 higher in 27 May, approximately 0.10 higher in 29 June, and approximately 0.09 higher in 25 July, while compared to that of the original CSWD database. It is also shown that the difference in cloud ratios between the Perez model and the authors’ proposed simple refinement method is very small, only about 0.02.
By using the diffuse solar radiation of three months (from May to July) refined by the Perez model and the authors’ proposed simple refinement method, the correlation coefficient (R2) is calculated. The result shows a very high value of 0.997 (as shown in Figure 11).
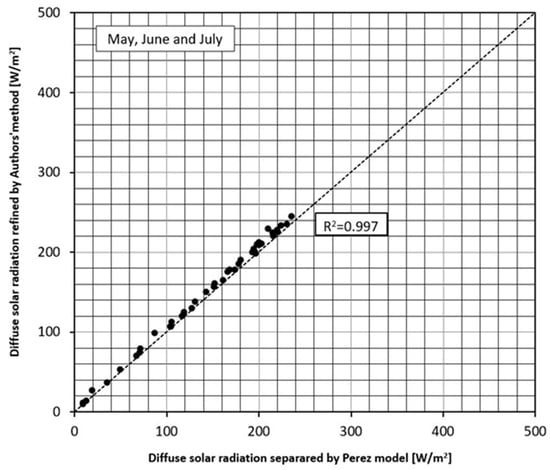
Figure 11.
Correlation of diffuse solar radiation between the Perez model and the authors’ proposed simple refinement method in three months (from May to July).
Based on the above results, we can conclude that the authors’ proposed simple refinement method can be used to refine the cloud ratio of solar radiation for the CSWD database.
4.2. Refinement to Solar Radiation of CSWD by Authors’ Proposed Simple Refinement Method
Using the proposed simple refinement method, the monthly cloud ratios of the original CSWD database in three months from May to July are refined, and the result is shown in Figure 12. It is shown that the monthly cloud ratio after refinement has increased by about 0.13 in May, has increased by 0.15 in June, and has increased by about 0.13 in July.
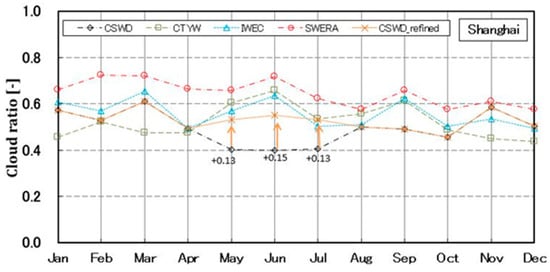
Figure 12.
Refined monthly cloud ratios of the CSWD database in three months from May to July in Shanghai, China.
5. Evaluation of Influence on Air-Conditioning Load of Buildings
To evaluate the effect of the cloud ratios on the air-conditioning load of buildings, this study used an air-conditioning load calculation program, “New HASP/ACLD-β” [6], often used in Japan [27], to calculate the air-conditioning load of a glass building simulation located in Shanghai, China. All parameters such as the incident solar radiation including diffuse and direct solar radiation, cloudiness, solar reflectivity of exterior walls, structure of building walls, operating condition of air-conditioning, etc. could be rewritten easily in the New HASP/ACLD-β calculation program.
The air-conditioning load of the simulated building located in Shanghai, China was calculated under the condition that the clear sky index (Kc) is fixed, and the cloudless index (Cle) is varied by three patterns of 0.8, 0.9 and 1.0.
Results (as shown in Figure 13) show that the air-conditioning load of the simulated building will increase by approximately 10%, while varying the cloudless index (Cle) varies from 1.0 to 0.8. Thus, it is considered that the change in cloudless index (or cloud ratio) will strongly affect the air-conditioning load of buildings.
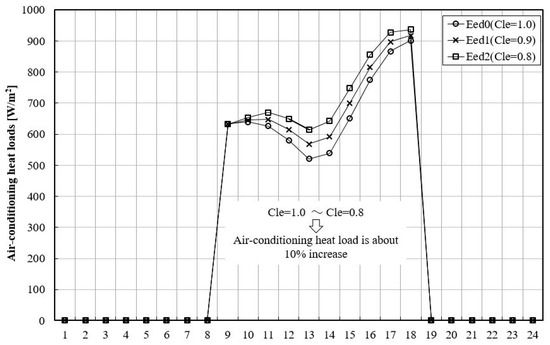
Figure 13.
Impact of cloudless index (Cle) on air-conditioning heat load of buildings when the index of Cle varied from 1.0 to 0.8.
6. Conclusions and Future Work
This study has pointed out the cloud ratios the CSWD database, which is defined as the index of diffuse solar radiation divided by global solar radiation, shows smaller values in the three months (May, June, and July) in Shanghai while compared to the other three TMY databases (CTYW, IWEC, SWERA). The main reason that the smaller cloud ratio is considered is because the diffuse solar radiation of the CSWD database is inaccurate. Thus, with the aim of improving the accuracy of diffuse solar radiation in the CSWD database, this study used the actual observed solar radiation in Shanghai, China for about one year and proposed a simple refinement method to refine the diffuse solar radiation (or cloud ratios) of the CSWD database. In addition, in order to verify the accuracy of the proposed simple refinement method, this study also compared the results of the authors’ proposed simple refinement method with that of the Perez model of high accuracy.
The obtained knowledge in this study is summarized as follows.
- ♦
- By comparing the four TMY databases (CSWD, CTYW, IWEC, SWERA) often used in China, it is shown that the monthly cloud ratio of CSWD in Shanghai is approximately 0.20 lower than that of the other three TMY databases in three months from May to July, and the monthly cloud ratios of CSWD in the three months have almost the same value, about 0.4.
- ♦
- The monthly cloud ratios for the eight main sites of Japan were calculated and investigated using the Expanded AMeDAS Weather Database. It is shown that the monthly cloud ratios for the eight main sites of Japan are all above 0.5.
- ♦
- The indices of Kc and Cle of representative days in May, June and July for CSWD were calculated. It was verified that the calculated indices of Kc and Cle for chosen representative days of May, June and July are out of sky condition classification. Therefore, it is considered that the diffuse solar radiation of CSWD in the three months may deviate from reality.
- ♦
- A solar radiation separation model, the “Perez model”, was used to separate the global solar radiation into direct solar radiation and diffuse solar radiation. The cloud ratios of CSWD separated by the Perez model were calculated and compared to that of the original CWSD. It is shown that the cloud ratio of CSWD separated by the Perez model is higher than that of the original CSWD, respectively for May, June and July.
- ♦
- A simple refinement method was proposed by authors to refine the diffuse solar radiation of CSWD. The diffuse solar radiation of CSWD was refined by a proposed simple refinement method, and it was also compared with the Perez model of high accuracy. It is shown that the correlation coefficient (R2) shows a very high value of 0.997. Thus, it can be concluded that the proposed simple refinement method could be used to refine the diffuse solar radiation (or cloud ratios) of the CSWD database.
- ♦
- The evaluation of influence on the air-conditioning load of a simulated building located in Shanghai, China was carried out under three different conditions of the cloudless index (Cle) with 0.8, 0.9 and 1.0. The result showed that the air-conditioning load of a simulated building increases by approximately 10% while varying the cloudless index (Cle) from 1.0 to 0.8. Therefore, it is considered that the change in the cloudless index (or cloud ratio) will strongly affect the air-conditioning load of buildings.
Future work will aim to observe the solar radiation in the other sites of China and develop a more accurate TMY database for air-conditioning load calculation which is directly related to building energy savings.
Author Contributions
Conceptualization, methodology, supervision, investigation, data curation, J.Y. and K.E.; formal analysis, visualization, writing–review and editing, J.Y. and C.F. All authors have read and agreed to the published version of the manuscript.
Funding
This research received no external funding.
Institutional Review Board Statement
Not applicable.
Informed Consent Statement
Not applicable.
Data Availability Statement
The data presented in this study are available on request from the corresponding author.
Acknowledgments
The authors are sincerely grateful to Tongji University of Shanghai, China for providing the observation sites.
Conflicts of Interest
The authors declare no conflict of interest.
References
- Carbon Brief—Clear on Climate. Available online: https://www.carbonbrief.org/analysis-global-fossil-fuel-emissions-up-zero-point-six-per-cent-in-2019-due-to-china (accessed on 15 December 2020).
- Baldinelli, G.; Asdrubali, F.; Baldassarri, C.; Bianchi, F.; D’Alessandro, F.; Schiavoni, S.; Basilicata, C. Energy and environmental performance optimization of a wooden window: A holistic approach. Energy Build. 2014, 79, 114–131. [Google Scholar] [CrossRef]
- Lu, Y.; Cui, P.; Li, D. Carbon emissions and policies in China’s building and construction industry: Evidence from 1994 to 2012. Build. Environ. 2016, 95, 94–103. [Google Scholar] [CrossRef]
- Zhou, W.; Mi, H. Building Energy Consumption and CO2 Emissions in China. Recent Researches in Energy & Environment, 2011, ISBN 978-960-474-274-5. Available online: http://wseas.us/e-library/conferences/2011/Cambridge/EE/EE-24.pdf (accessed on 15 December 2020).
- U.S. Department of Energy, EnergyPlus Weather Data. 2008. Available online: http://apps1.eere.energy.gov/buildings/energyplus/cfm/weather_data.cfm (accessed on 16 December 2020).
- The Society of Heating, Air-Conditioning and Sanitary Engineers of Japan (SHASE). Operation Manual of New HASP/ACLD-β; SHASE: Tokyo, Japan, 2004. [Google Scholar]
- Brunger, A.P.; Hooper, F.C. Anisotropic sky radiance model based on narrow field of view measurements of shortwave radiance. Sol. Energy 1993, 51, 53–64. [Google Scholar] [CrossRef]
- Moon, P.; Spencer, D.E. Illumination from a nonuniform sky. Trans. Illum. Engng. Soc. 1942, 37, 707–726. [Google Scholar]
- CIE. Natural daylight, Official recommendation. In Proceedings of the Compte Rendu, CIE 13th Session, Zürich, Switzerland, 13–22 June 1955; Volume II. [Google Scholar]
- Kittler, R. Luminance distribution characteristics of homogeneous skies: A measurement and prediction strategy. Light. Res. Technol. 1985, 17, 183–188. [Google Scholar] [CrossRef]
- Perraudeau, M. Luminance Models; National Lighting Conference: Cambridge, UK, 1988; pp. 291–292. [Google Scholar]
- Perez, R.; Seals, R.; Michalsky, J. All-weather model for sky luminance distribution—Preliminary configuration and validation. Sol. Energy 1993, 50, 235–245. [Google Scholar] [CrossRef]
- China Meteorological Bureau, Climate Information Center, Climate Data Office and Tsinghua University, Department of Building Science and Technology. China Standard Weather Data for Analyzing Building Thermal Conditions; China Building Industry Publishing House: Beijing, China, 2005. [Google Scholar]
- Perez, R. Dynamic global-to-direct irradiance conversion models. ASHRAE Trans. 1992, 98, 354–369. [Google Scholar]
- Lu, S.; Emura, K.; Igawa, N. Statistical characteristics of five sets of Standard Year Weather Data in China. Arch. Sci. Rev. 2010, 53, 415–428. [Google Scholar] [CrossRef]
- Collares-Pereira, M.; Rabl, A. The average distribution of solar radiation-correlations between diffuse and hemispherical and between daily and hourly insolation values. Sol. Energy 1979, 22, 155–164. [Google Scholar] [CrossRef]
- Liu, B.Y.; Jordan, R.C. The interrelationship and characteristic distribution of direct, diffuse and total solar radiation. Sol. Energy 1960, 4, 1–19. [Google Scholar] [CrossRef]
- Hayagawa. Study of Meteorological Data for Heat Load Calculation by Monte Carlo Method. Transactions of the Society of Heat-ing, Air-Conditioning and Sanitary Engineers of Japan. 1976, No.0, 1–12. Available online: https://ci.nii.ac.jp/naid/10006779437/ (accessed on 14 April 2021). (In Japanese).
- Zhang, Q. Separation of horizontal solar radiation into direct and diffuse components with Gompertz function. J. Environ. Eng. AIJ 2004, 69, 31–37. [Google Scholar] [CrossRef][Green Version]
- Maxwell, E. METSTAT—The solar radiation model used in the production of the National Solar Radiation Data Base (NSRDB). Sol. Energy 1998, 62, 263–279. [Google Scholar] [CrossRef]
- Kasten, F.; Czeplak, G. Solar and terrestrial radiation dependent on the amount and type of cloud. Sol. Energy 1980, 24, 177–189. [Google Scholar] [CrossRef]
- Japan, A.I.J. Expanded AMeDAS Weather Data, Maruzen. 2003. Available online: https://www.jma.go.jp/jp/amedas/ (accessed on 16 January 2021).
- Igawa, N.; Koga, Y.; Matsuzawa, T.; Nakamura, H. Models of sky radiance distribution and sky luminance distribution. Sol. Energy 2004, 77, 137–157. [Google Scholar] [CrossRef]
- Kasten, F. Parametrisierung der Globalstahlung durch Bedeckungsgrad und Trübungsfaktor. Ann. Meteorol. Neue Folge 1984, 20, 49–50. [Google Scholar]
- Soga, K.; Akasaka, H.; Nimiya, H. A comparison of models to estimate hourly direct and diffuse irradiation from hourly global irradiation. J. Arch. Plan. AIJ 1998, 63, 17–24. (In Japanese) [Google Scholar] [CrossRef]
- Maxwell, E.L. A Quasi-Physical Model for Converting Hourly Global Horizontal to Direct Normal Insolation; Technical Re-port No. SERI/TR-215-3087; Solar Energy Research Institute: Golden, CO, USA, 1987. [Google Scholar]
- Yuan, J.; Farnham, C.; Emura, K.; Alam, A. Proposal for optimum combination of reflectivity and insulation thickness of building exterior walls for annual thermal load in Japan. Build. Environ. 2016, 103, 228–237. [Google Scholar] [CrossRef]
Publisher’s Note: MDPI stays neutral with regard to jurisdictional claims in published maps and institutional affiliations. |
© 2021 by the authors. Licensee MDPI, Basel, Switzerland. This article is an open access article distributed under the terms and conditions of the Creative Commons Attribution (CC BY) license (https://creativecommons.org/licenses/by/4.0/).