
An Assessment of Indoor Air Quality in the Arrivals Hall of Beirut–Rafic Hariri International Airport: Monitoring of VOCs and NO2

 and
and 
Abstract

1. Introduction
2. Materials and Methods
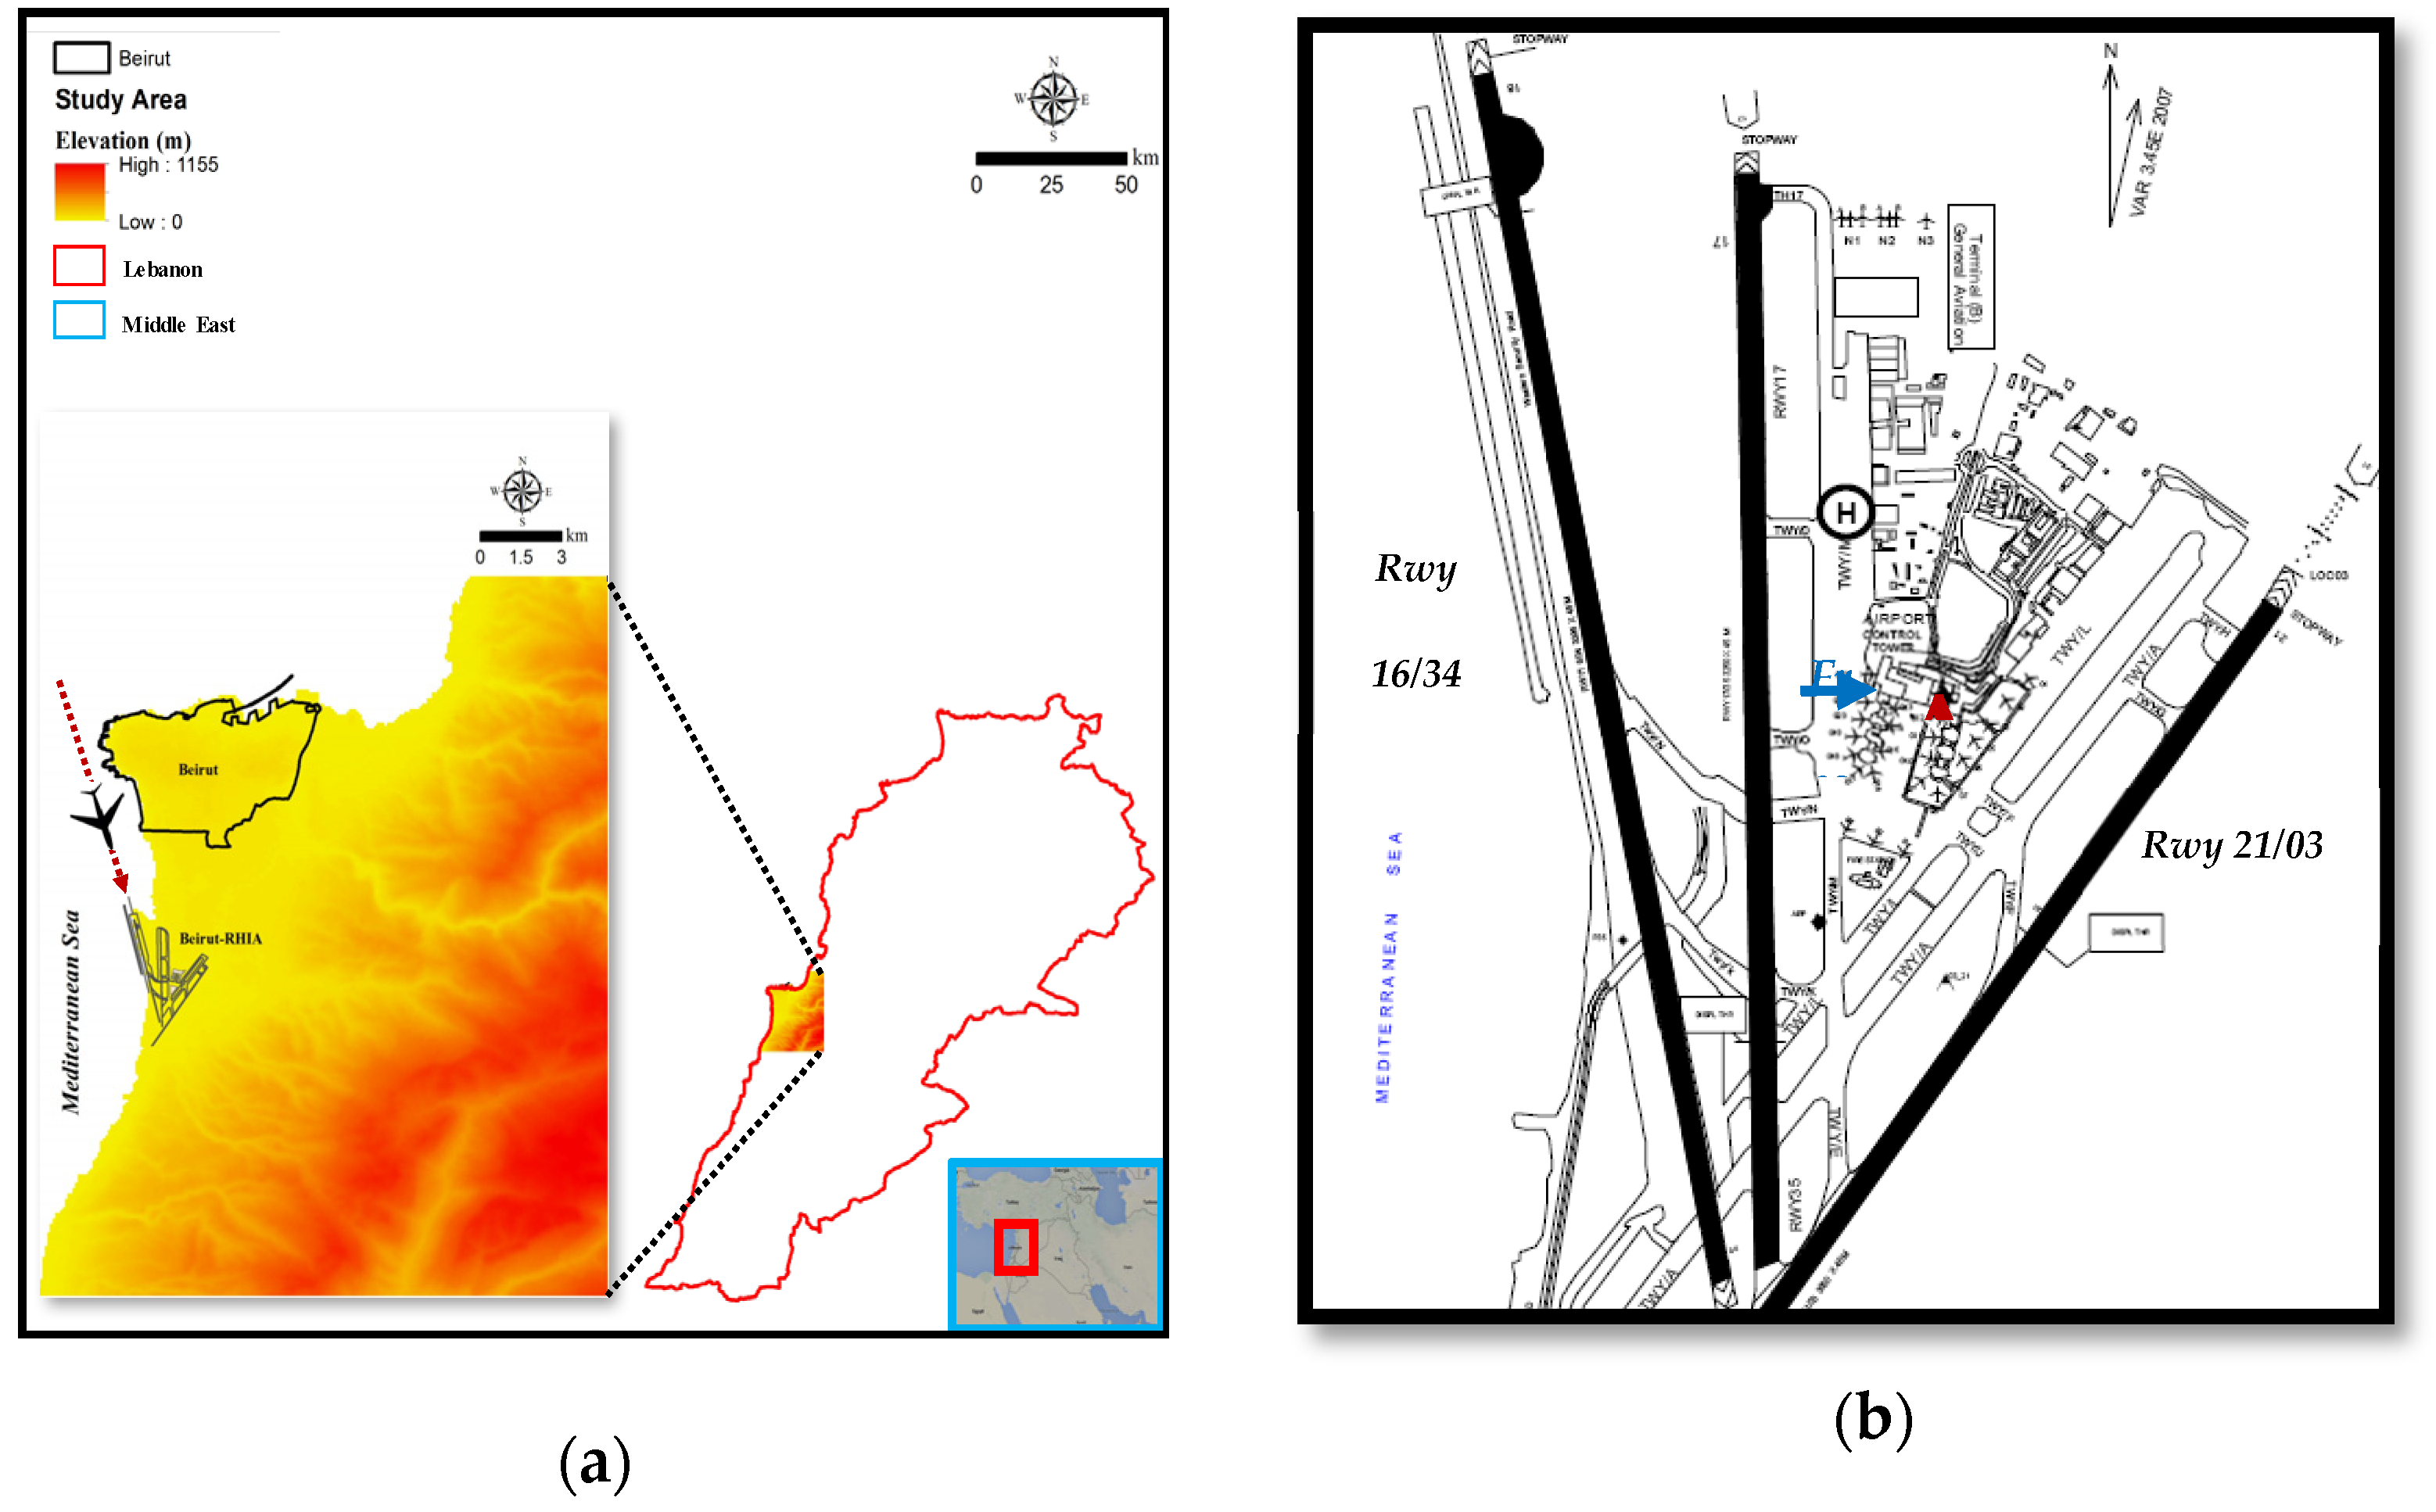
2.1. Study Area
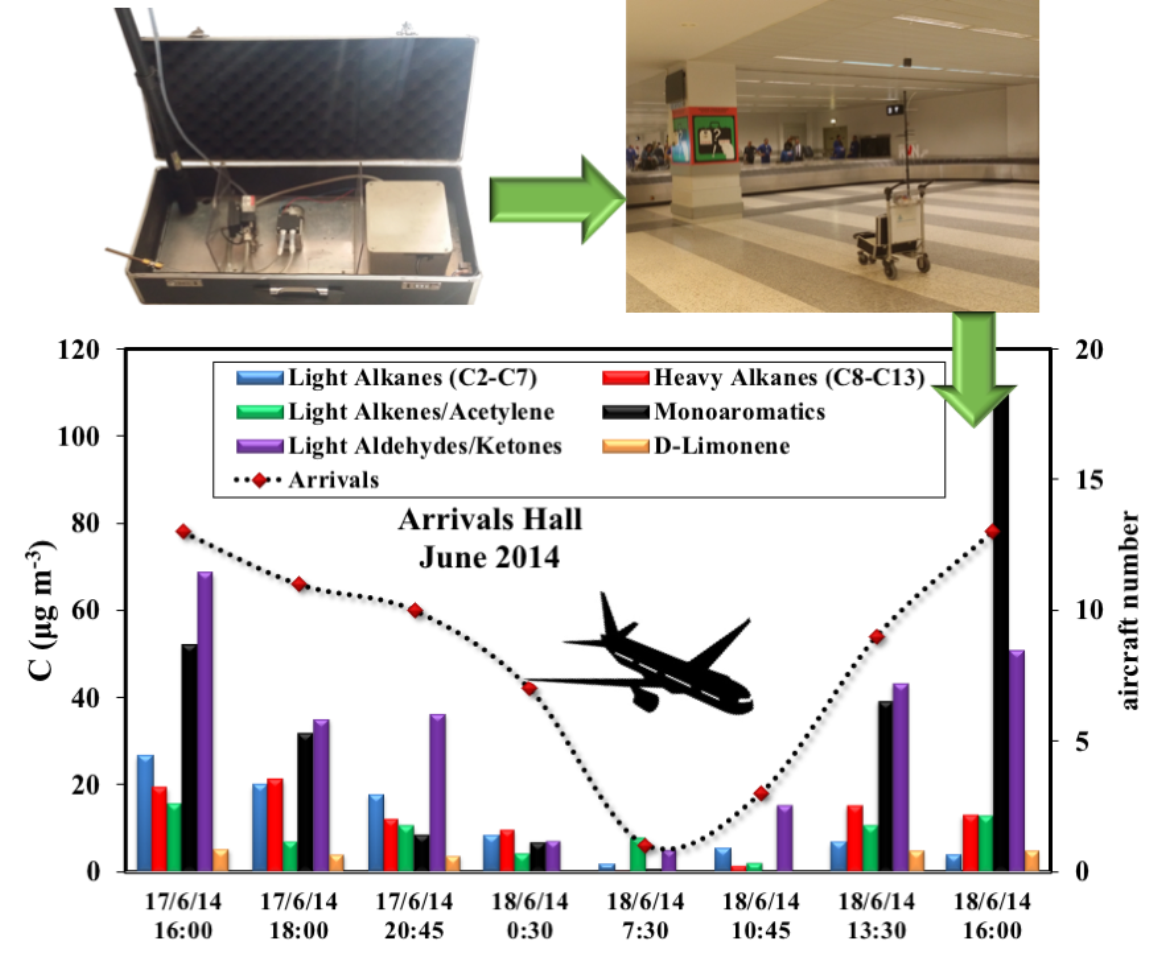
2.2. Sampling Site
2.3. Sampling Methodologies
2.4. Analytical Methods
2.4.1. Chemicals and Materials
2.4.2. Analysis Techniques
- VOC Measurements and Analysis
- Statistical Methods
- Nitrogen Dioxide Measurements and Analysis
3. Results
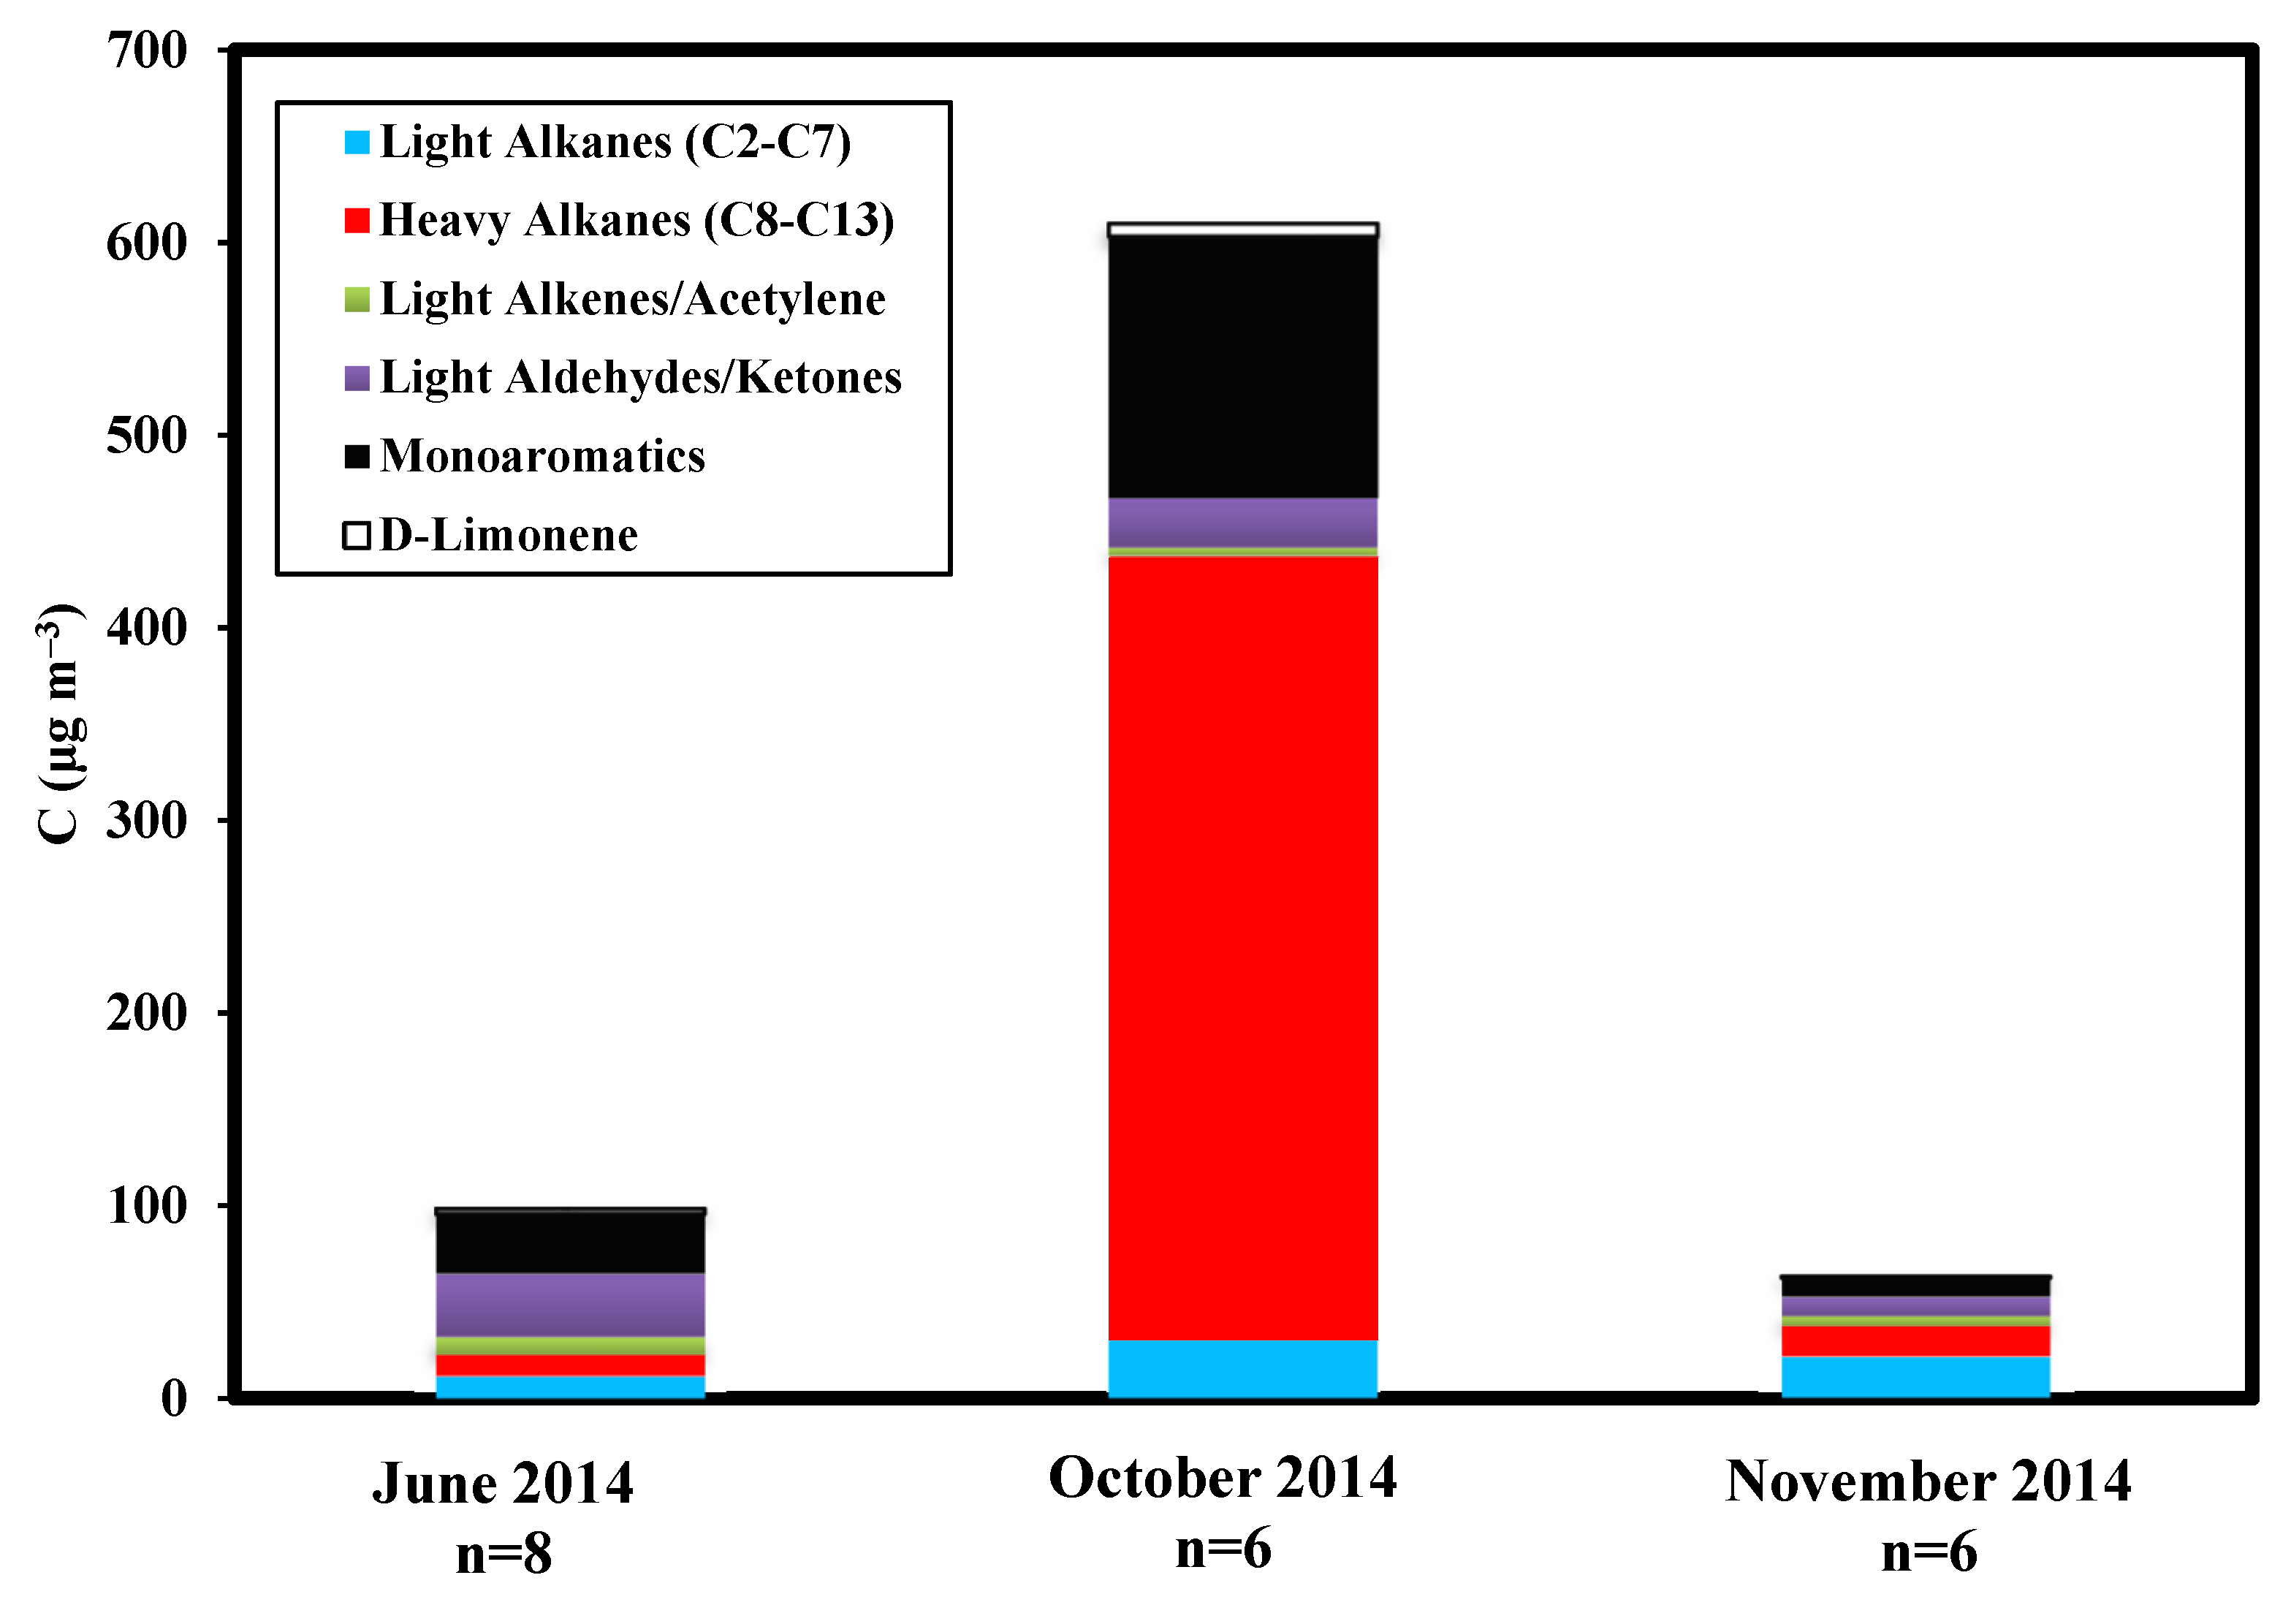
3.1. Variation of TVOCs between the Campaigns
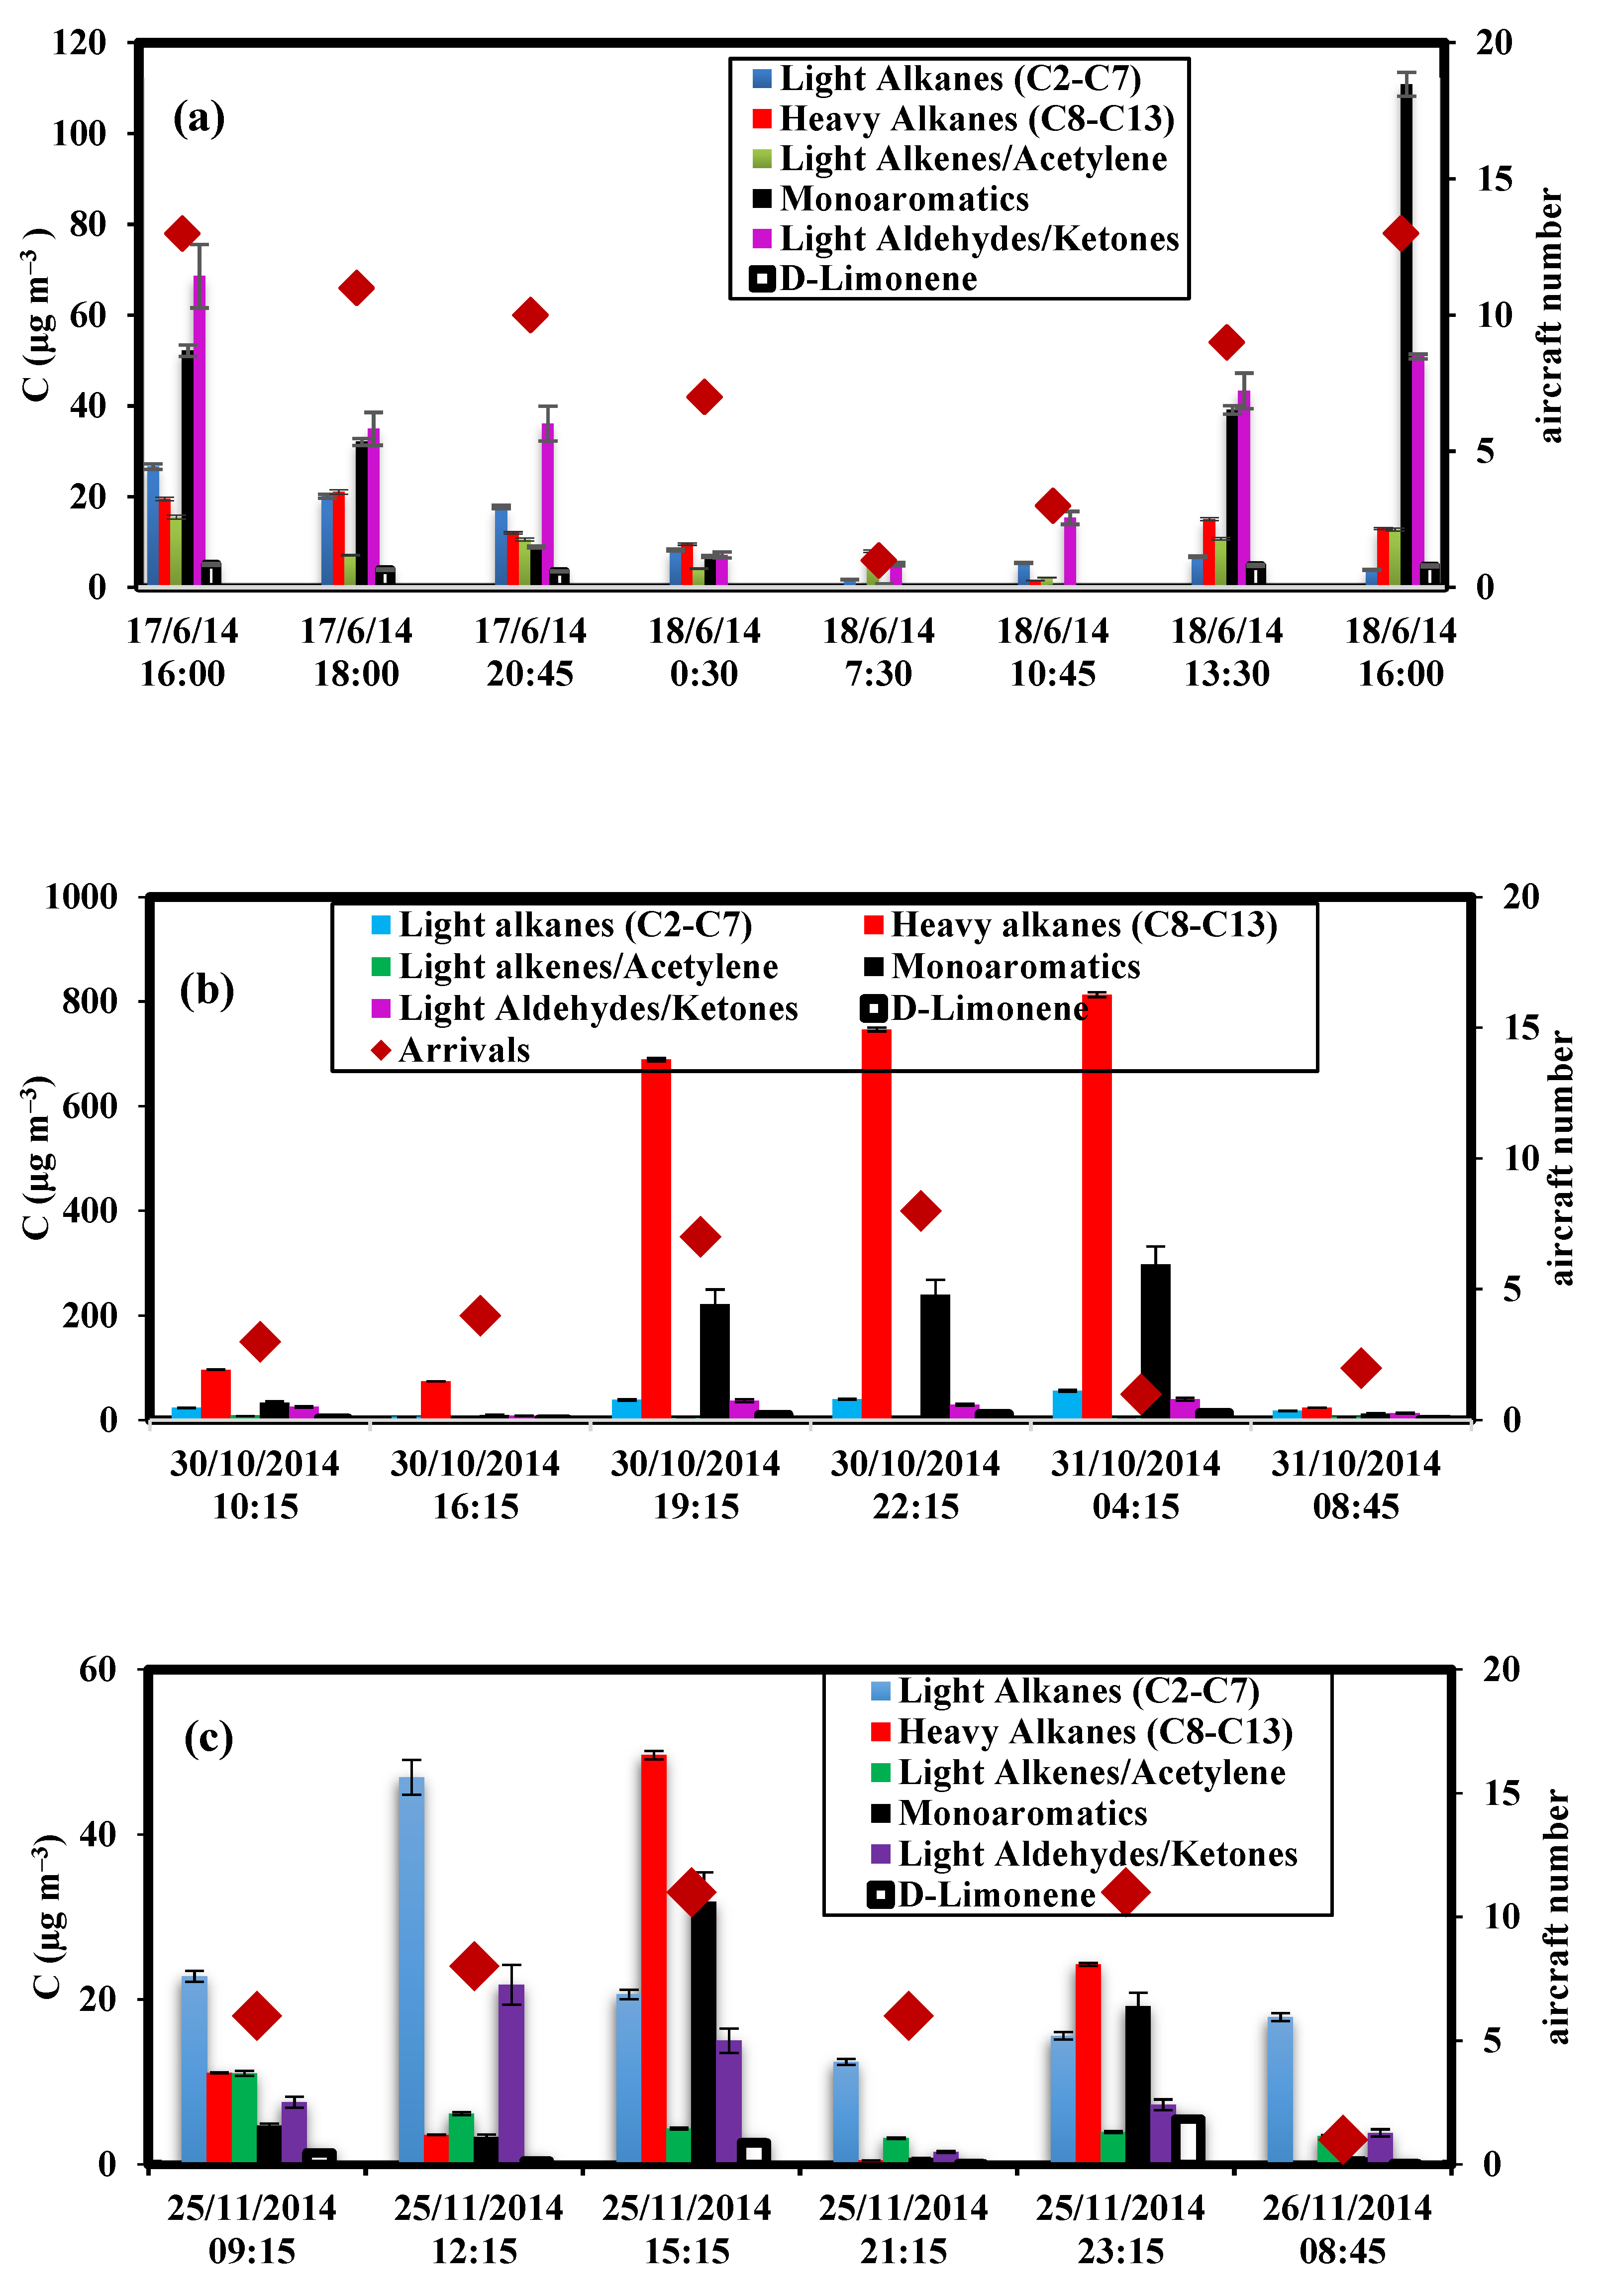
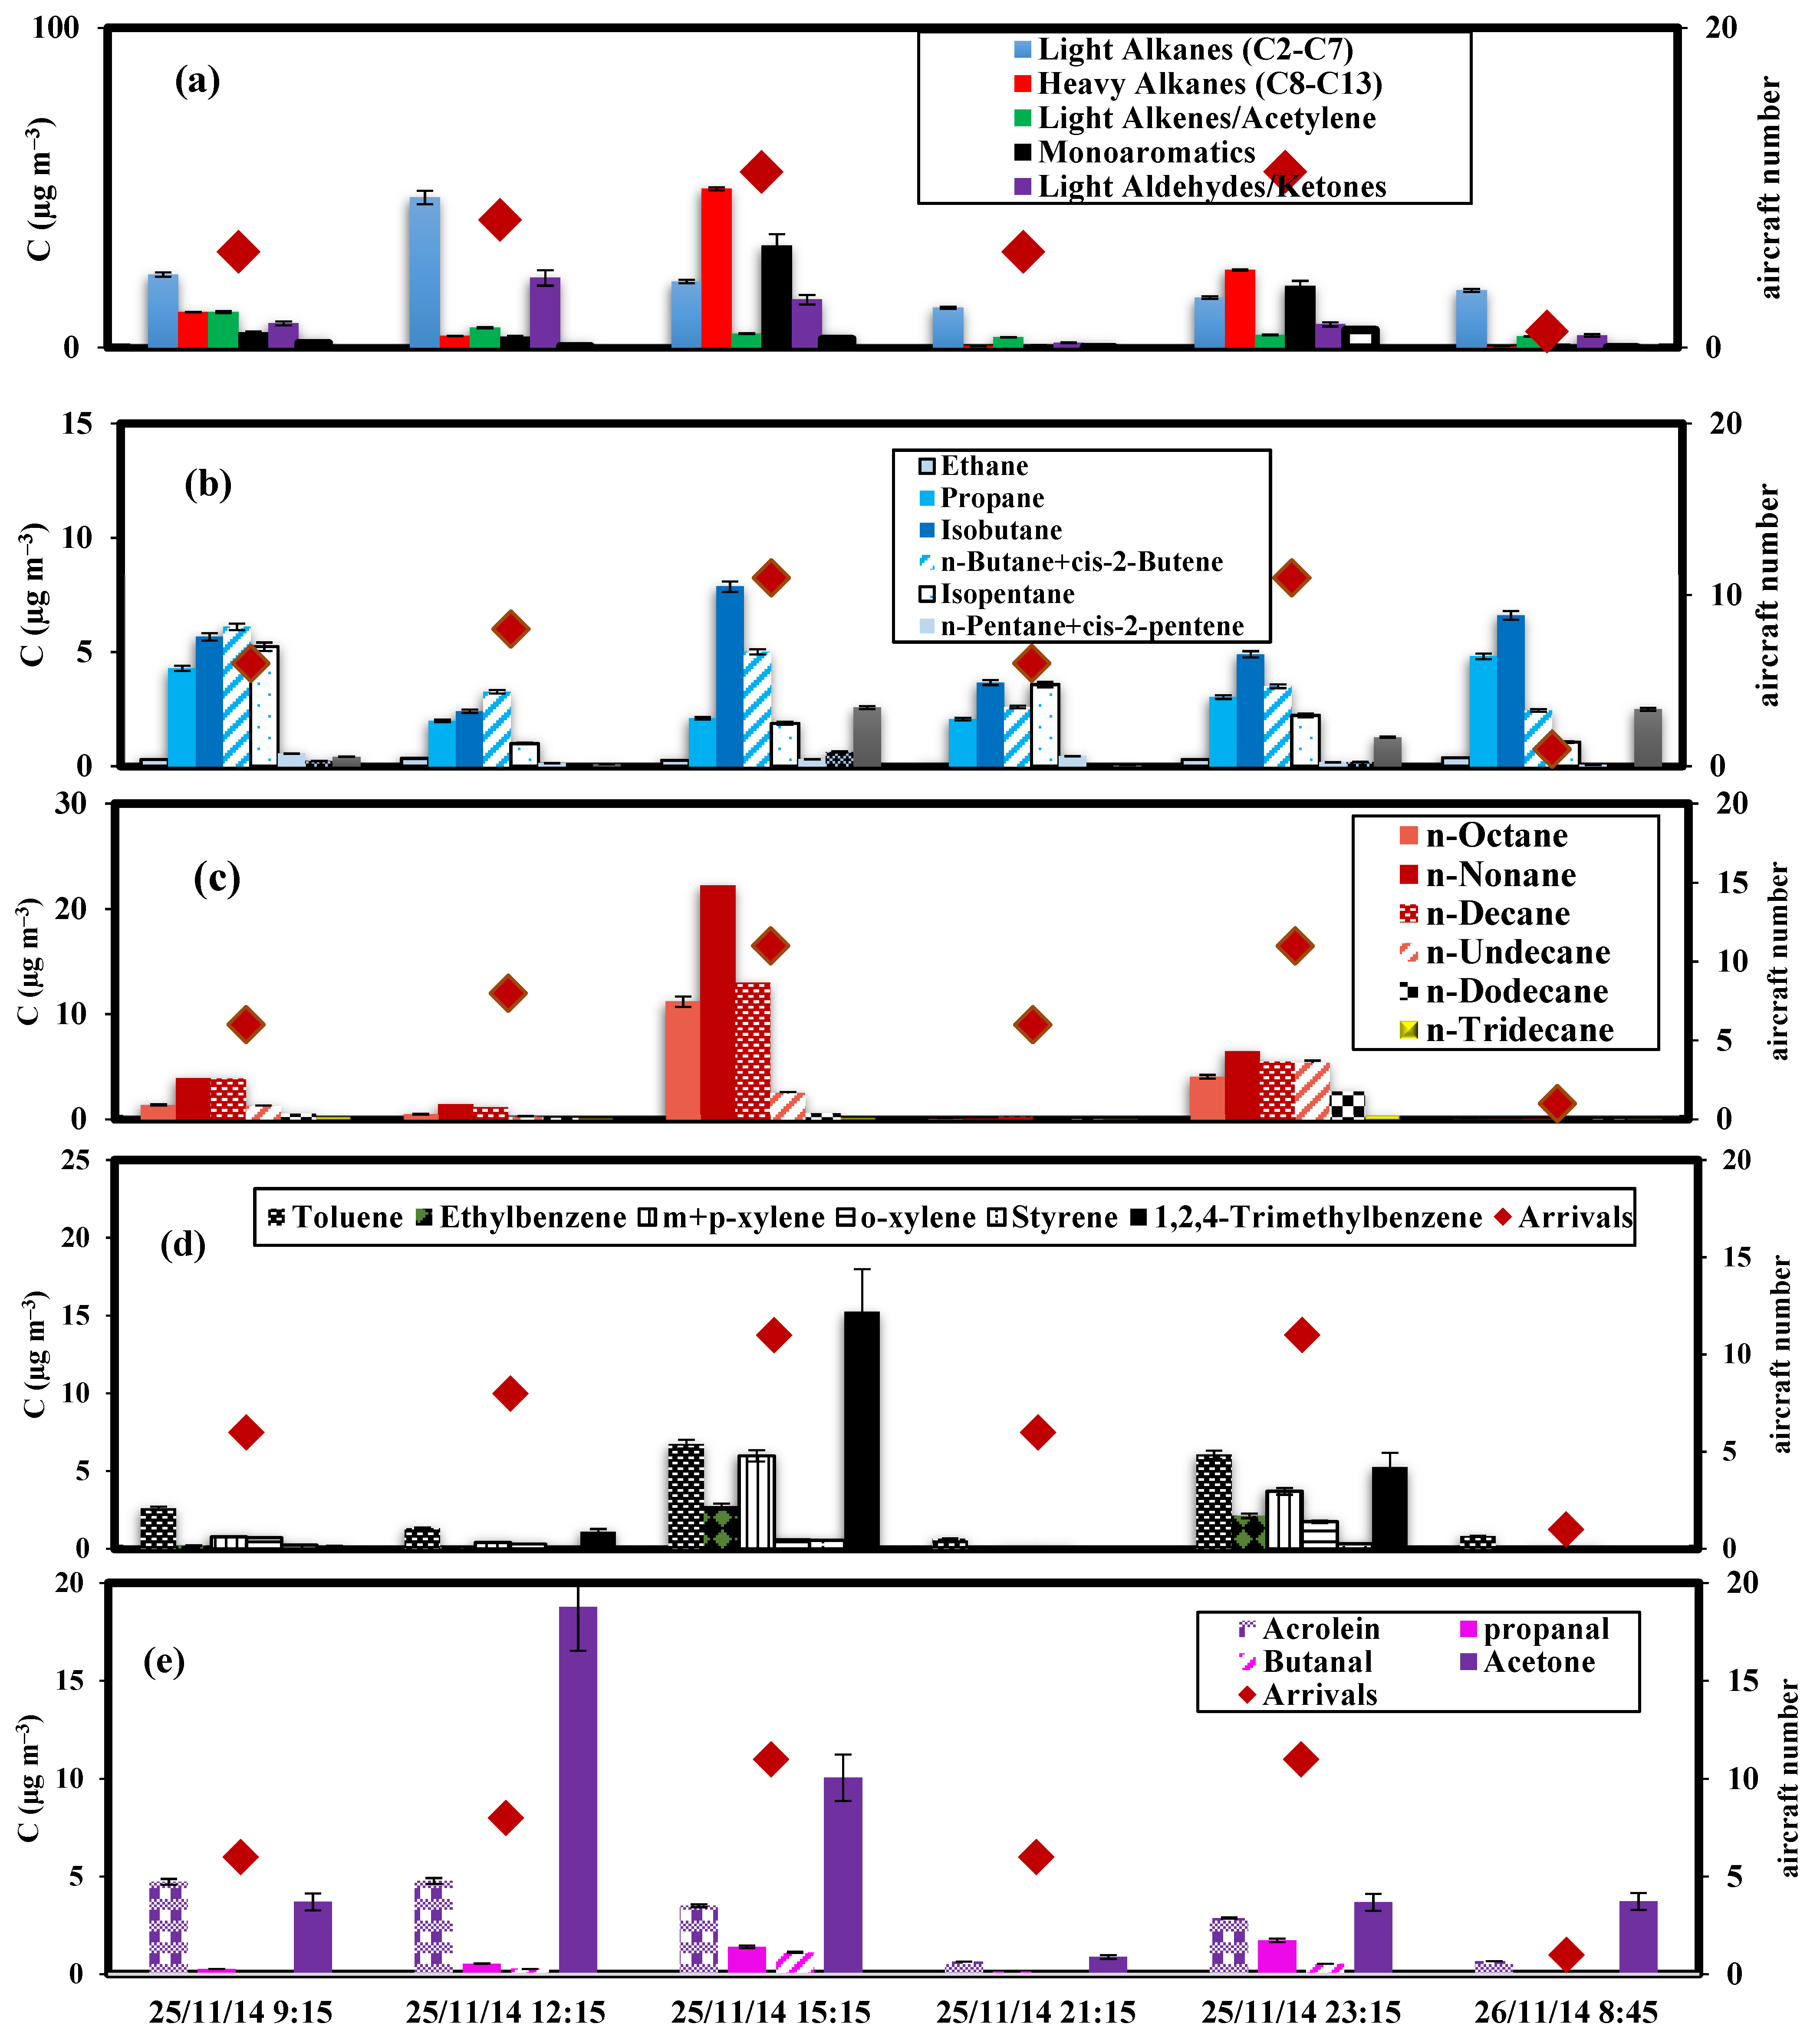
3.2. Temporal Variations of VOC Groups
3.3. VOCs Speciation
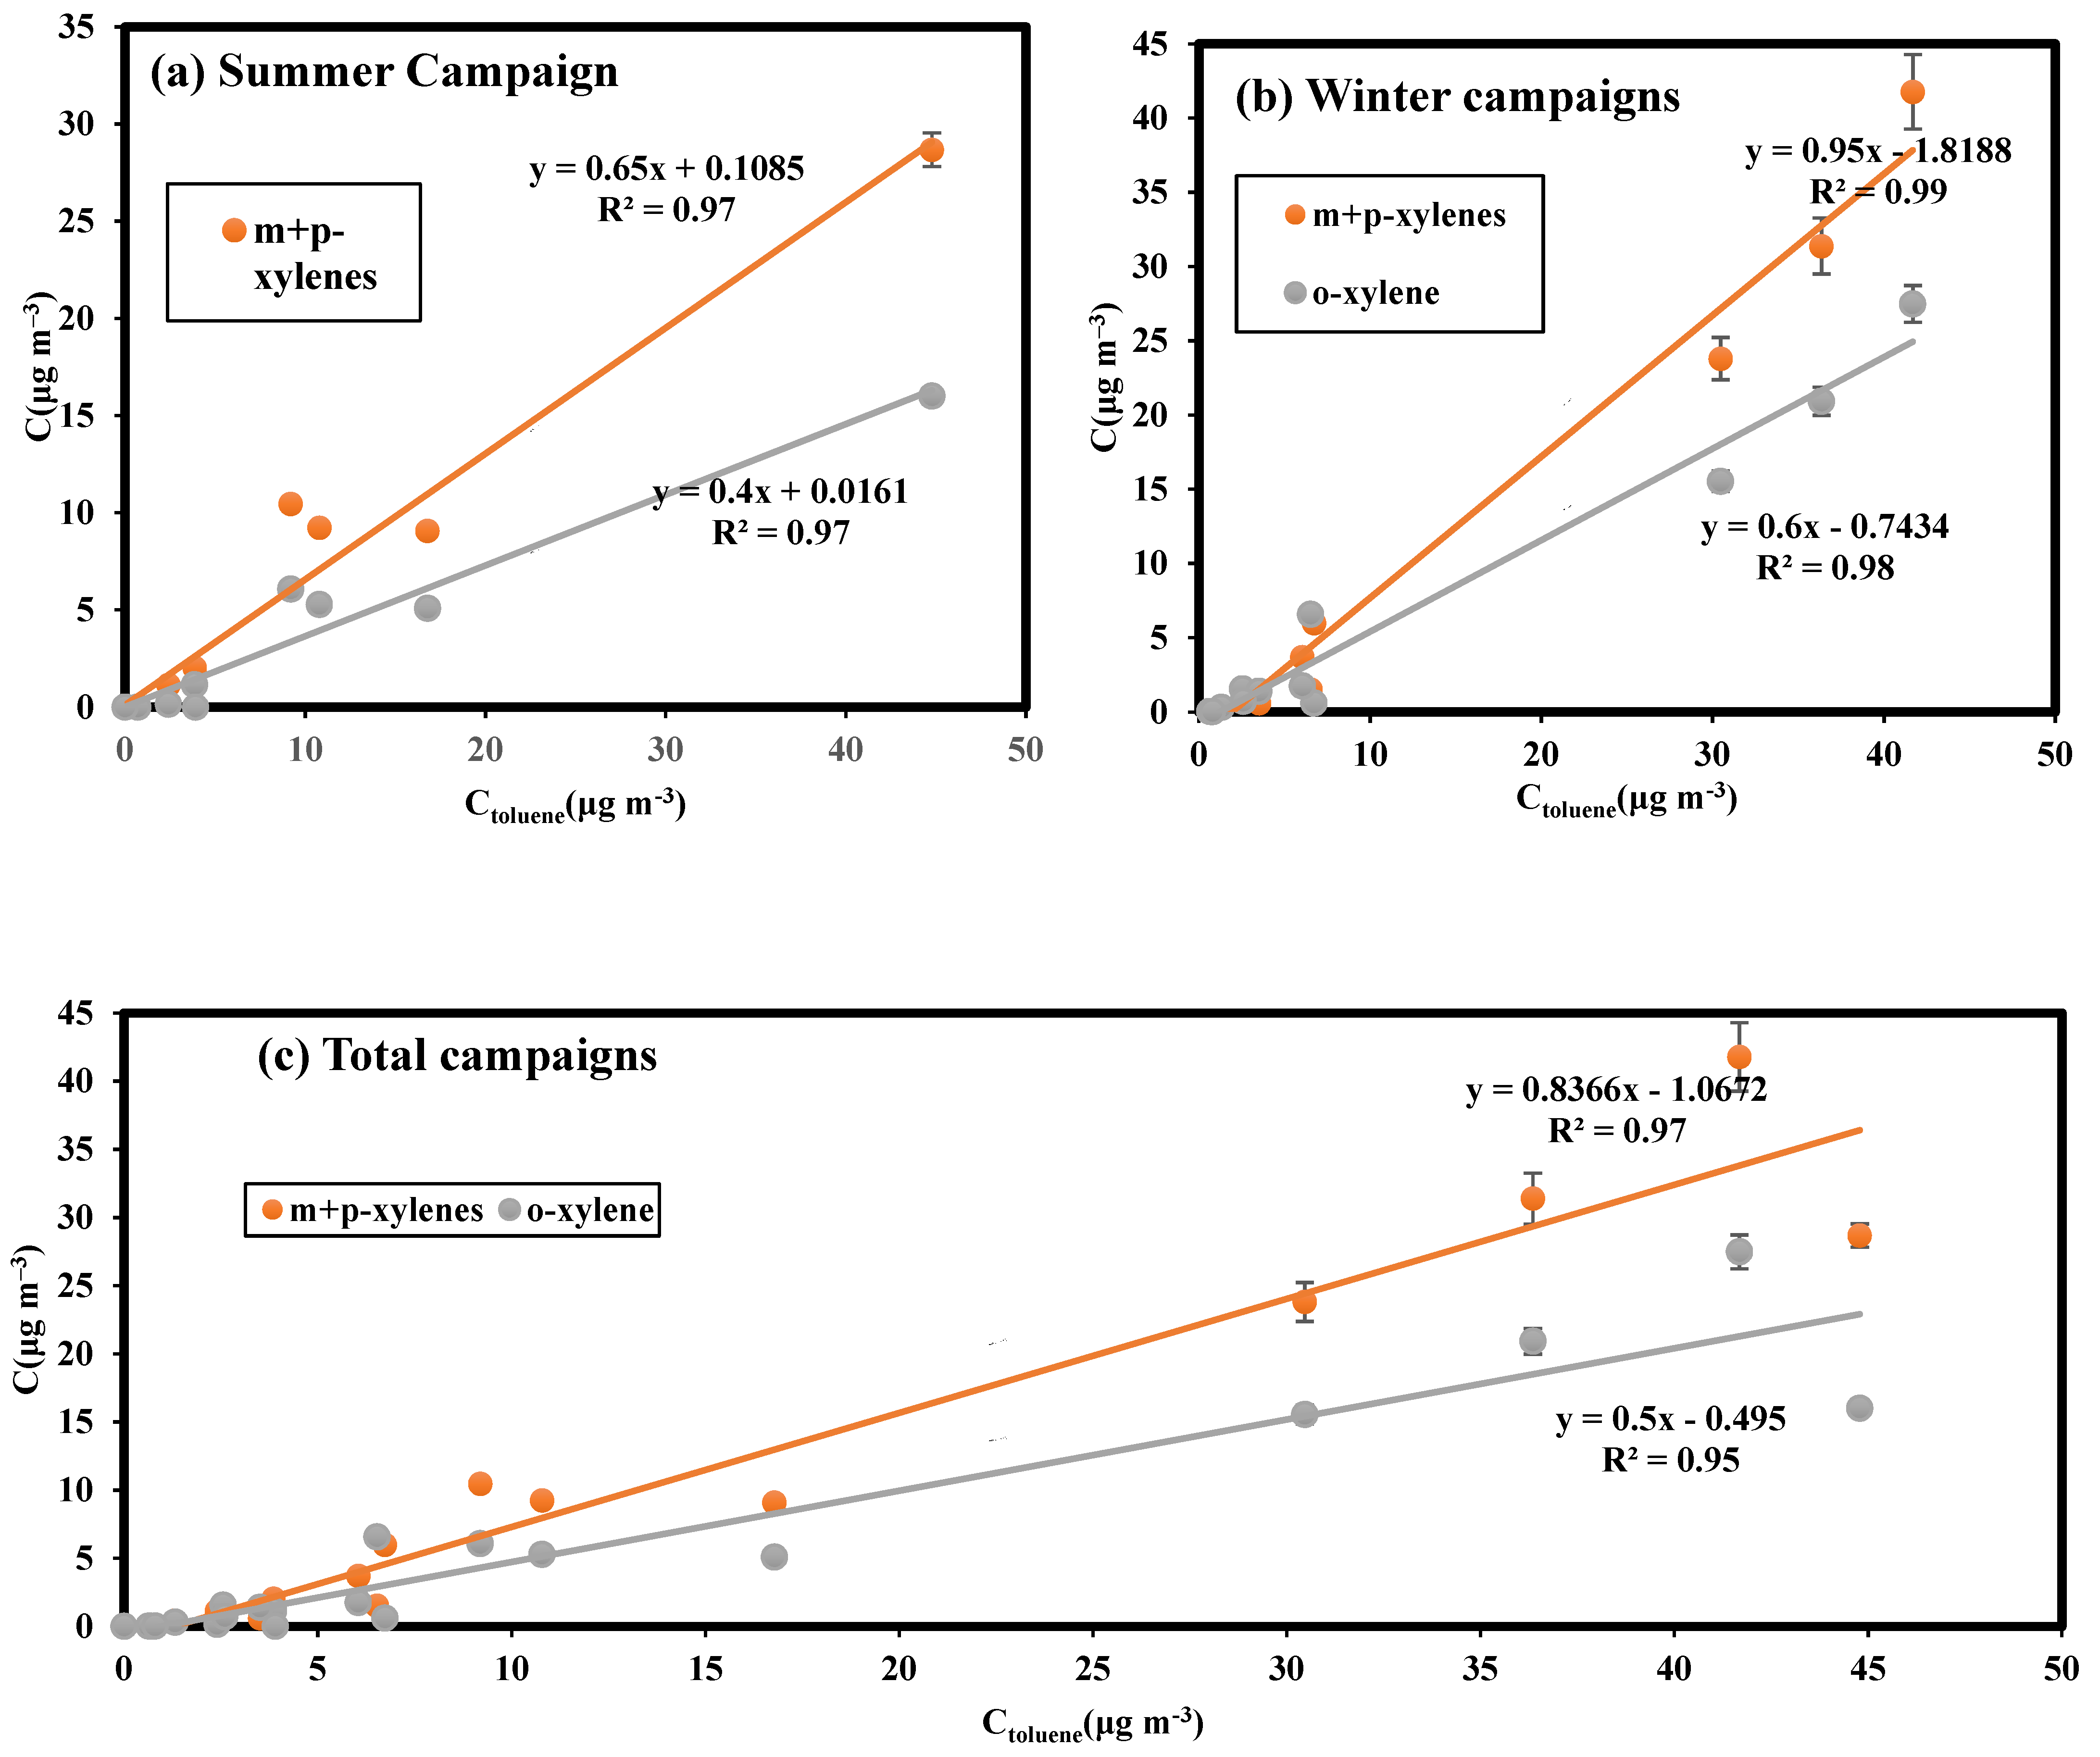
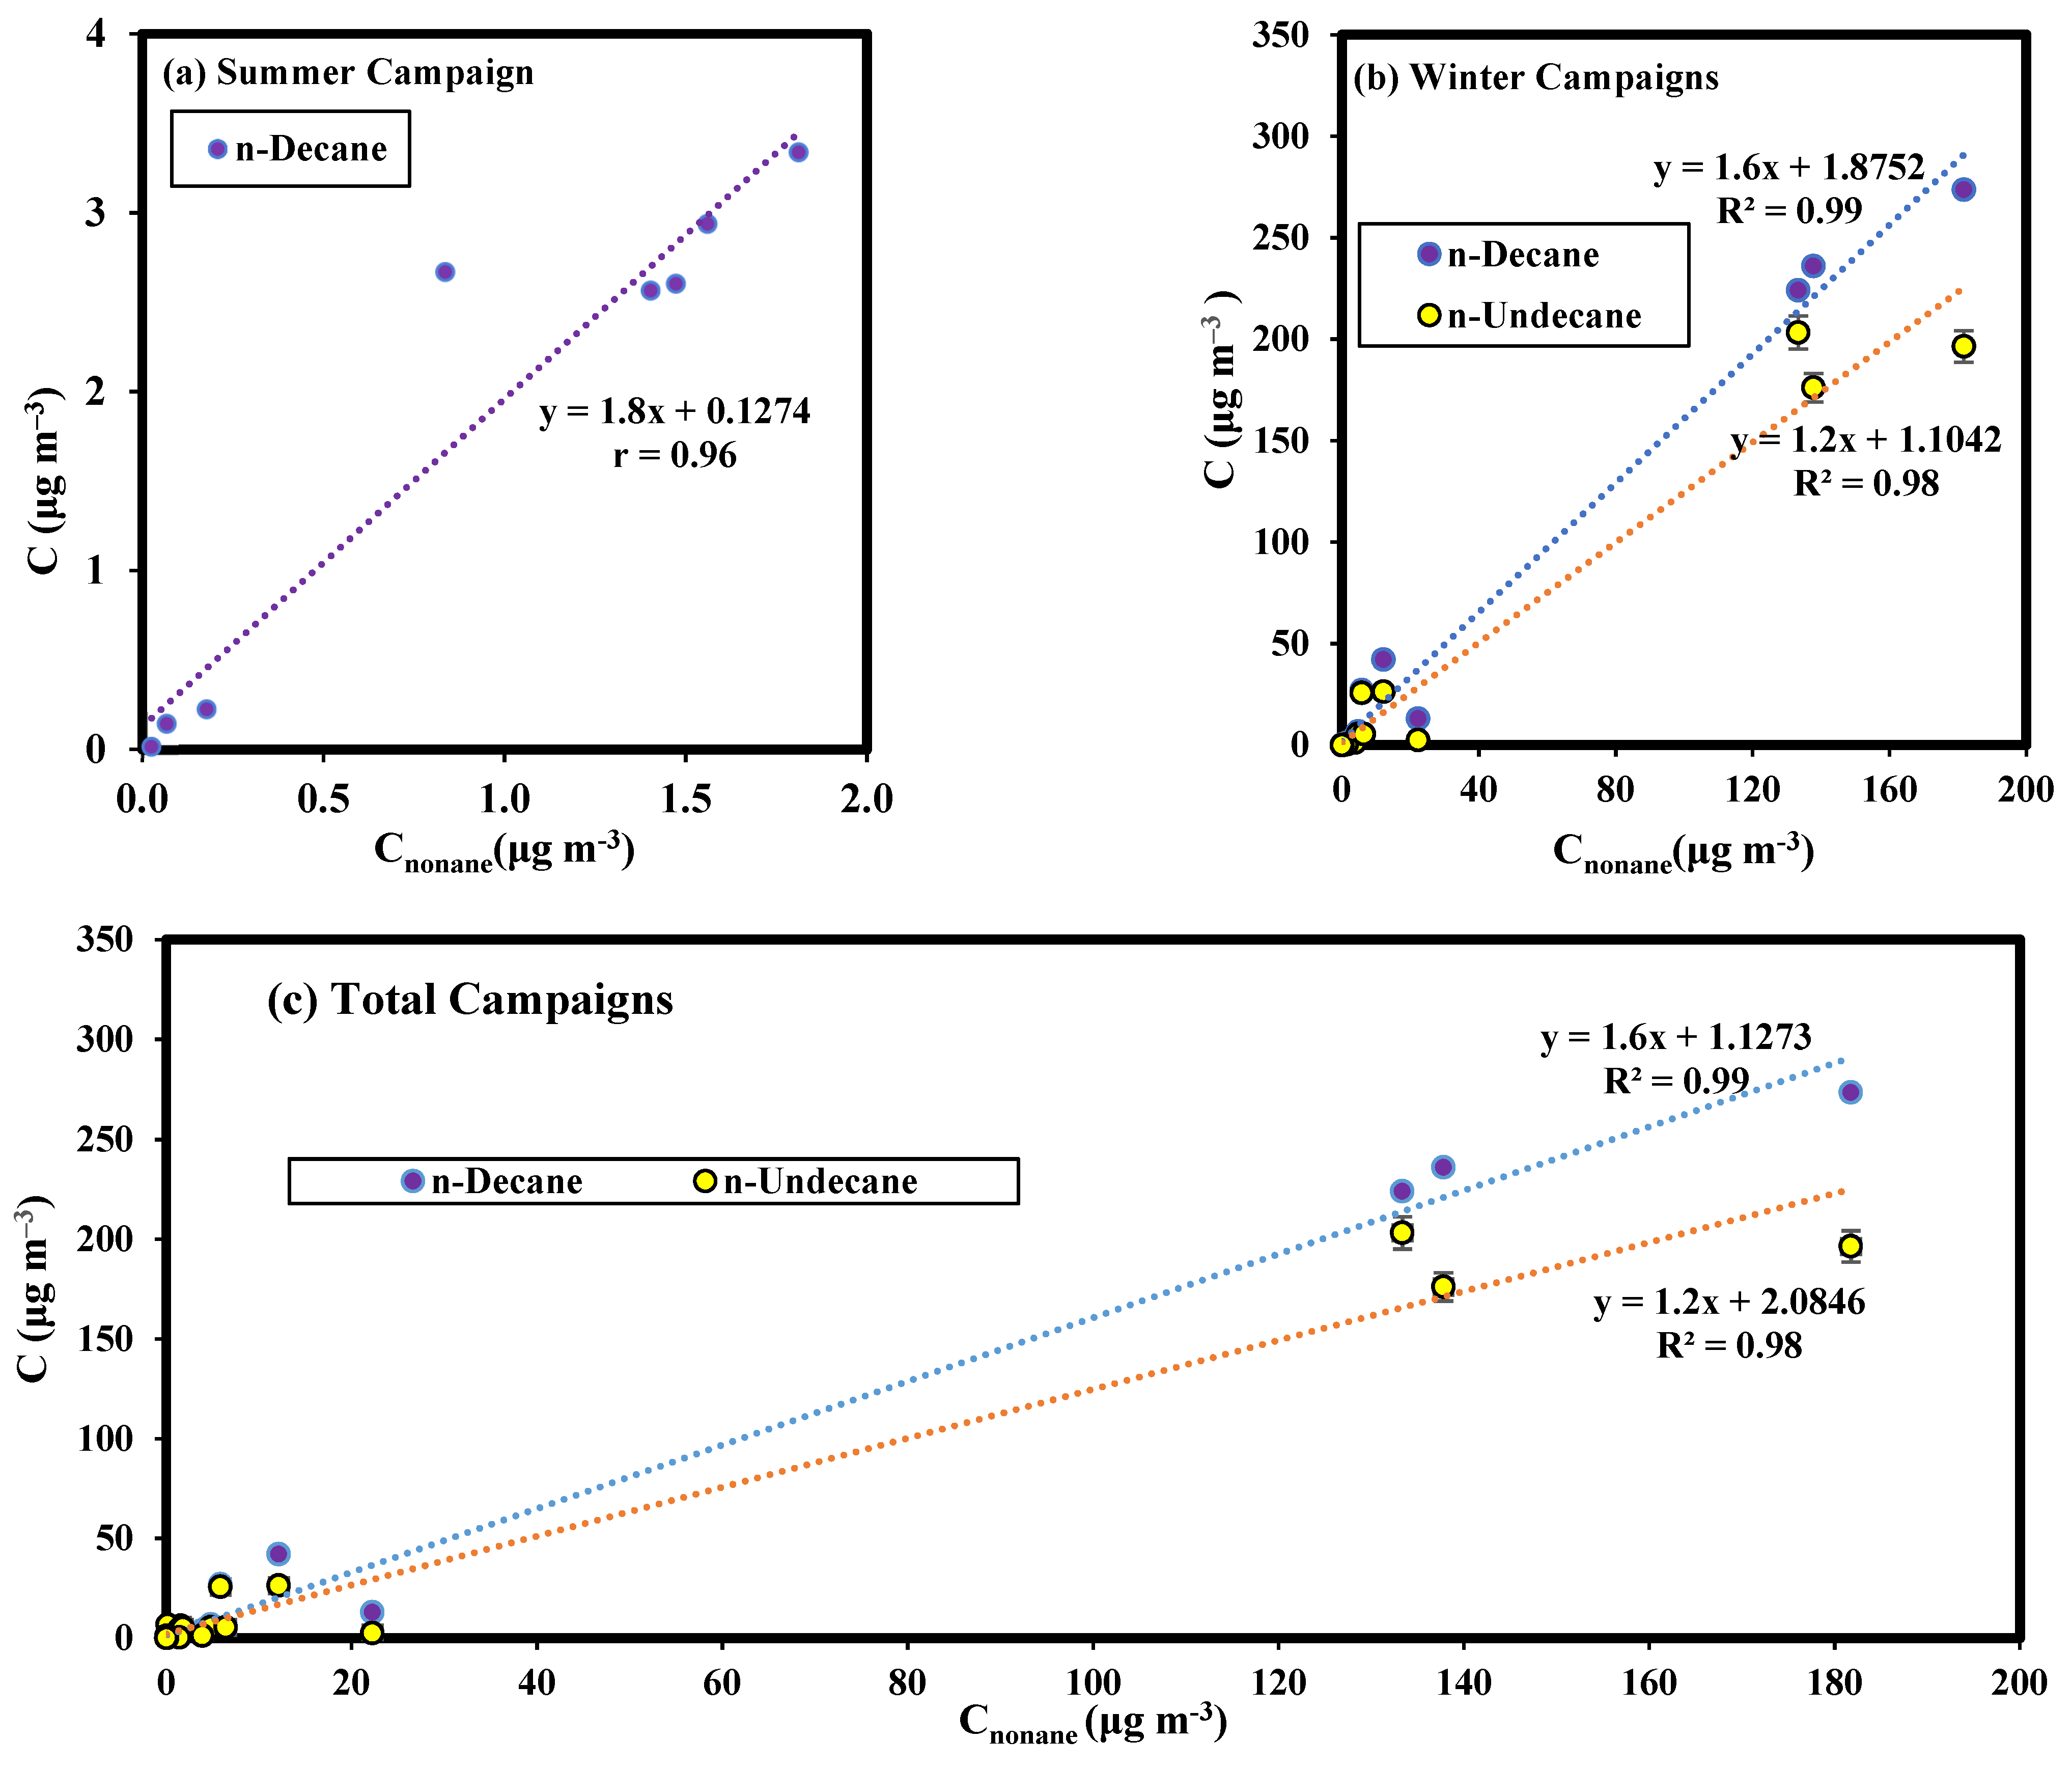
3.4. Correlation Analysis of VOCs Concentrations
3.5. NO2 Concentrations
4. Discussion
5. Conclusions
Supplementary Materials
Author Contributions
Funding
Institutional Review Board Statement
Informed Consent Statement
Data Availability Statement
Acknowledgments
Conflicts of Interest
References
- WHO. 7 Million Premature Deaths Annually Linked to Air Pollution. Available online: http://www.who.int/mediacentre/news/releases/2014/air-pollution/en/ (accessed on 21 June 2017).
- WHO. Health and the Environment: Addressing the Health Impact of Air Pollution. Draft Resolution Proposed by the Delegations of Albania, Chile, Colombia, France, Germany, Monaco, Norway, Panama, Sweden, Switzerland, Ukraine, United States of America, Uruguay and Zambia. Sixty-Eighth World Health Assembly. Agenda Item 14.6. A68/A/CONF./2 Rev.1. 26 May 2015; WHO: Geneva, Switzerland, 2015. [Google Scholar]
- WHO. Household Air Pollution: Health Impacts. Available online: http://www.who.int/airpollution/household/health-impacts/en/ (accessed on 11 March 2021).
- Melymuk, L.; Bohlin-Nizzetto, P.; Kukučka, P.; Vojta, Š.; Kalina, J.; Čupr, P.; Klánová, J. Seasonality and Indoor/Outdoor Relationships of Flame Retardants and PCBs in Residential Air. Environ. Pollut. 2016, 218, 392–401. [Google Scholar] [CrossRef]
- Wang, B.; Liu, Y.; Li, Z.; Li, Z. Association of Indoor Air Pollution from Coal Combustion with Influenza-like Illness in Housewives. Environ. Pollut. 2016, 216, 646–652. [Google Scholar] [CrossRef]
- Oliveira, M.; Slezakova, K.; Delerue-Matos, C.; Pereira, M.d.C.; Morais, S. Assessment of Polycyclic Aromatic Hydrocarbons in Indoor and Outdoor Air of Preschool Environments (3–5 Years Old Children). Environ. Pollut. 2016, 208, 382–394. [Google Scholar] [CrossRef]
- Raysoni, A.U.; Armijos, R.X.; Weigel, M.M.; Montoya, T.; Eschanique, P.; Racines, M.; Li, W.-W. Assessment of Indoor and Outdoor PM Species at Schools and Residences in a High-Altitude Ecuadorian Urban Center. Environ. Pollut. 2016, 214, 668–679. [Google Scholar] [CrossRef] [PubMed]
- Han, Y.; Qi, M.; Chen, Y.; Shen, H.; Liu, J.; Huang, Y.; Chen, H.; Liu, W.; Wang, X.; Liu, J.; et al. Influences of Ambient Air PM2.5 Concentration and Meteorological Condition on the Indoor PM2.5 Concentrations in a Residential Apartment in Beijing Using a New Approach. Environ. Pollut. 2015, 205, 307–314. [Google Scholar] [CrossRef]
- Rehwagen, M.; Schlink, U.; Herbarth, O. Seasonal Cycle of VOCs in Apartments. Indoor Air 2003, 13, 283–291. [Google Scholar] [CrossRef] [PubMed]
- Qi, M.; Zhu, X.; Du, W.; Chen, Y.; Chen, Y.; Huang, T.; Pan, X.; Zhong, Q.; Sun, X.; Zeng, E.Y.; et al. Exposure and Health Impact Evaluation Based on Simultaneous Measurement of Indoor and Ambient PM2.5 in Haidian, Beijing. Environ. Pollut. 2017, 220, 704–712. [Google Scholar] [CrossRef] [PubMed]
- Matysik, S.; Ramadan, A.B.; Schlink, U. Spatial and Temporal Variation of Outdoor and Indoor Exposure of Volatile Organic Compounds in Greater Cairo. Atmos. Pollut. Res. 2010, 1, 94–101. [Google Scholar] [CrossRef]
- Witten, M.L.; Zeiger, E.; Ritchie, G.D. Jet Fuel Toxicology; CRC Press: Boca Raton, FL, USA, 2011; ISBN 978-1-4398-5772-4. [Google Scholar]
- Kim, B.; Nakada, K.; Wayson, R.; Christie, S.; Paling, C.; Bennett, M.; Raper, D.; Raps, V.; Levy, J.; Roof, C.; et al. Understanding Airport Air Quality and Public Health Studies Related to Airports; Transportation Research Board: Washington, DC, USA, 2015; ISBN 978-0-309-30864-9. [Google Scholar]
- Marchand, C.; Bulliot, B.; Le Calvé, S.; Mirabel, P. Aldehyde Measurements in Indoor Environments in Strasbourg (France). Atmos. Environ. 2006, 40, 1336–1345. [Google Scholar] [CrossRef]
- Iavicoli, I.; Carelli, G.; Bergamaschi, A. Exposure Evaluation to Airborne Polycyclic Aromatic Hydrocarbons in an Italian Airport. J. Occup. Environ. Med. Am. Coll. Occup. Environ. Med. 2006, 48, 815–822. [Google Scholar] [CrossRef] [PubMed]
- Tsakas, M.P.; Siskos, P.A. Indoor Air Quality in the Control Tower of Athens International Airport, Greece. Indoor Built Environ. 2011, 20, 284–289. [Google Scholar] [CrossRef]
- Pleil, J.D.; Smith, L.B.; Zelnick, S.D. Personal Exposure to JP-8 Jet Fuel Vapors and Exhaust at Air Force Bases. Environ. Health Perspect. 2000, 108, 183–192. [Google Scholar] [CrossRef] [PubMed]
- Kungskulniti, N.; Charoenca, N.; Peesing, J.; Trangwatana, S.; Hamann, S.; Pitayarangsarit, S.; Chitanondh, H. Assessment of Secondhand Smoke in International Airports in Thailand, 2013. Tob. Control 2015, 24, 532–535. [Google Scholar] [CrossRef]
- Lee, K.; Hahn, E.J.; Robertson, H.E.; Whitten, L.; Jones, L.K.; Zahn, B. Air Quality in and around Airport Enclosed Smoking Rooms. Nicotine Tob. Res. Off. J. Soc. Res. Nicotine Tob. 2010, 12, 665–668. [Google Scholar] [CrossRef]
- Zanni, S.; Lalli, F.; Foschi, E.; Bonoli, A.; Mantecchini, L. Indoor Air Quality Real-Time Monitoring in Airport Terminal Areas: An Opportunity for Sustainable Management of Micro-Climatic Parameters. Sensors 2018, 18, 3798. [Google Scholar] [CrossRef] [PubMed]
- Mokalled, T.; Le Calvé, S.; Badaro-Saliba, N.; Abboud, M.; Zaarour, R.; Farah, W.; Adjizian-Gérard, J. Identifying the Impact of Beirut Airport’s Activities on Local Air Quality—Part I: Emissions Inventory of NO2 and VOCs. Atmos. Environ. 2018, 187, 435–444. [Google Scholar] [CrossRef]
- Yaman, S.H. Aircraft and Vehicle Induced Emissions at the Beirut International Airport a Characterization and Exposure Assessment—By Sarah Hassan Yaman. Master’s Thesis, American University of Beirut, Beirut, Lebanon, 2001. [Google Scholar]
- Lebanese Directorate General of Civil Aviation, Aeronautical Information Publication 2010. Available online: https://www.atc-network.com/atc-organisations/dgca-directorate-general-of-civil-aviation-lebanon (accessed on 20 March 2021).
- Liaud, C. Développement de Méthodes Déchantillonnage Rapides et D’analyses Différées au Laboratoire: Détermination de L’évolution Temporelle des Concentrations des COVs et COSVs et Compréhension des Processus Physico-Chimiques en Air Intérieur. Ph.D. Thesis, Université de Strasbourg, Strasbourg, France, 2014. [Google Scholar]
- EPA Compendium Method TO-17-Compendium of Methods for the Determination of Toxic Organic Compounds in Ambient Air. Determination of Volatile Organic Compounds in Ambient Air Using Active Sampling Onto Sorbet Tubes. Available online: https://www.epa.gov/sites/production/files/2019-11/documents/to-17r.pdf (accessed on 19 March 2021).
- Jochmann, M.A.; Laaks, J.; Schmidt, T.C. Solvent-Free Extraction and Injection Techniques. In Practical Gas Chromatography: A Comprehensive Reference; Dettmer-Wilde, K., Engewald, W., Eds.; Springer: Berlin, Heidelberg, 2014; pp. 371–412. ISBN 978-3-642-54640-2. [Google Scholar]
- Ras, M.R.; Borrull, F.; Marcé, R.M. Sampling and Preconcentration Techniques for Determination of Volatile Organic Compounds in Air Samples. TrAC Trends Anal. Chem. 2009, 28, 347–361. [Google Scholar] [CrossRef]
- Liaud, C.; Nguyen, N.T.; Nasreddine, R.; Le Calvé, S. Experimental Performances Study of a Transportable GC-PID and Two Thermo-Desorption Based Methods Coupled to FID and MS Detection to Assess BTEX Exposure at Sub-Ppb Level in Air. Talanta 2014, 127, 33–42. [Google Scholar] [CrossRef] [PubMed]
- Villanueva, F.; Tapia, A.; Amo-Salas, M.; Notario, A.; Cabañas, B.; Martínez, E. Levels and Sources of Volatile Organic Compounds Including Carbonyls in Indoor Air of Homes of Puertollano, the Most Industrialized City in Central Iberian Peninsula. Estimation of Health Risk. Int. J. Hyg. Environ. Health 2015, 218, 522–534. [Google Scholar] [CrossRef] [PubMed]
- Wang, C.; Yang, X.; Guan, J.; Gao, K.; Li, Z. Volatile Organic Compounds in Aircraft Cabin: Measurements and Correlations between Compounds. Build. Environ. 2014, 78, 89–94. [Google Scholar] [CrossRef]
- Saltzman, B.E. Colorimetric Microdetermination of Nitrogen Dioxide in Atmosphere. Anal. Chem. 1954, 26, 1949–1955. [Google Scholar] [CrossRef]
- Glasius, M.; Funch Carlsen, M.; Stroyer Hansen, T.; Lohse, C. Measurements of Nitrogen Dioxide on Funen Using Diffusion Tubes. Atmos. Environ. 1999, 33, 1177–1185. [Google Scholar] [CrossRef]
- Passam Nitrogen Dioxide—Passam. Available online: http://www.passam.ch/wp/nitrogen-dioxide/ (accessed on 5 June 2017).
- Mokalled, T.; Adjizian Gérard, J.; Abboud, M.; Trocquet, C.; Nassreddine, R.; Person, V.; le Calvé, S. VOC Tracers from Aircraft Activities at Beirut Rafic Hariri International Airport. Atmos. Pollut. Res. 2018. [Google Scholar] [CrossRef]
- Mokalled, T. The Impact of Beirut Rafic Hariri International Airport’s Activities on the Air Quality of Beirut & Its Suburbs: Measurements and Modelling of VOCs and NO2. Ph.D. Thesis, Université de Strasbourg, Strasbourg, France, Université Saint-Joseph, Beirut, Lebanon, 2016. [Google Scholar]
- Conner, T.L.; Lonneman, W.A.; Seila, R.L. Transportation-Related Volatile Hydrocarbon Source Profiles Measured in Atlanta. J. Air Waste Manag. Assoc. 1995, 45, 383–394. [Google Scholar] [CrossRef]
- INRS The French National Research and Safety Institute for the Prevention of Occupational Accidents and Diseases—INRS. Available online: http://en.inrs.fr/ (accessed on 27 August 2017).
- FAA Select Reseource Materials and Annotated Bibliography on the Topic of Hazardous Air Pollutants (HAPs) Associated with Aircraft, Airports, and Aviation. Available online: http://www.faa.gov/regulations_policies/policy_guidance/envir_policy/media/HAPs_rpt.pdf (accessed on 28 February 2016).
- Wood, E. Aircraft and Airport-Related Hazardous Air Pollutants: Research Needs and Analysis; Transportation Research Board: Washington, DC, USA, 2018; ISBN 978-0-309-11745-6. [Google Scholar]
- Atkinson, R. Kinetics and Mechanisms of the Gas-Phase Reactions of the Hydroxyl Radical with Organic Compounds under Atmospheric Conditions. Chem. Rev. 1986, 86, 69–201. [Google Scholar] [CrossRef]
- Hellén, H. Sources and Concentrations of Volatile Organic Compounds in Urban Air. Ph.D. Thesis, University of Helsinki, Helsinki, Finland, 2006. [Google Scholar]
- Atkinson, R. Kinetics of the Gas-Phase Reactions of OH Radicals with Alkanes and Cycloalkanes. Atmos. Chem. Phys. 2003, 3, 2233–2307. [Google Scholar] [CrossRef]
- Atkinson, R.; Aschmann, S.M. Rate Constants for the Gas-Phase Reactions of the OH Radical with a Series of Aromatic Hydrocarbons at 296 ± 2 K. Int. J. Chem. Kinet. 1989, 21, 355–365. [Google Scholar] [CrossRef]
- WHO. Ambient (Outdoor) Air Quality and Health. Available online: http://www.who.int/news-room/fact-sheets/detail/ambient-(outdoor)-air-quality-and-health (accessed on 30 May 2018).


| Pollutants | Concentrations Ranges Mean (min-max) | Time/Number of Samples | Technique | Location | Reference |
|---|---|---|---|---|---|
| Heavy alkanes (nC8-nC12) Light alkanes (nC4, nC7) Monoaromatics Chlorinated Alkenes | 93.49 μg m−3 24.22 μg m−3 23.73 μg m−3 2.15 μg m−3 | July 1997, February 1998 (n = 5) | Canisters/GC-MS | U.S. Air Force Break rooms, offices | Pleil et al. [17] |
| Formaldehyde Acetaldehyde | 10.8 (8.8–13.0) μg m−3 3.5 (2.0–4.3) μg m−3 | June–September 2004 and September 2004– January 2005 (n = 4) | DNPH/HPLC (active sampling) | Strasbourg airport— Arrivals Hall | Marchand et al. [14] |
| Polycyclic aromatic hydrocarbons (PAH) | benzo [b+j+k] fluoranthene a: 9.4 (bDLb–54.2 ng m−3) benzo [a]–pyrene a: 1.5 (bDLb–8.6 ng m−3) | January 2005 (n = 12) | Quartz fiber, a polyurethane foam, and an XAD-2 layer /GC-MS | Italian airport Terminal C Sierra C “Terminal C departure area” | Iavicoli et al. [15] |
| Carbon Monoxide Formaldehyde Total VOCs Benzene | 0.18–6.41 mg m−3 5.5–26.1 μg m−3 bDLc–542 μg m−3 bDLd–379 μg m−3 | April–September 2003 | CO: Automatic infrared analysers HCHO: DNPH/HPLC TVOCs and benzene: Radiello type passive samplers/GC-FID | Control Tower of Athens International Airport | Tsakas and Siskos [16] |
| Odorous Gases * PM2.5 PM1 Total VOC | 0.39 ppm (0.09–2.2) ** 1872 pcs/L (1660–4066) ** 5595 pcs/L (4642–27541) ** 0.11 ppm (0.04–0.73) ** | 2 months (30 days per location) summer 2017 | Gas and PM Sensors | Arrivals and departure areas of Bologna Airport (Italy) | Zanni et al. [20] |
| 8 Light Alkanes (C2-C7) 8 Heavy Alkanes (nC8-nC14) 11 Light Alkenes/Acetylene 8 Monoaromatics 7 Light Aldehydes/Ketones D-Limonene 2 Choloroalkenes NO2 | 11.30–22.70 e μg m−3 11.46–14.86 e μg m−3 5.34–8.85 e μg m−3 10.1–31.37 e μg m−3 9.47–32.67 e μg m−3 0.64–2.77 e μg m−3 1.01–1.07 e μg m−3 34.0–48.4 e μg m−3 | July, October, November 2014 (n = 20) | VOCs: Thermal desorption tubes/GC-FID NO2: Passam tubes/UV-VIS spectrophotometer | Arrivals Hall at Beirut–Rafic Hariri International Airport | This work |
| VOC | 1. n-Octane | 2. n-Nonane | 3. n-Decane | 4. n-Undecane | 5. Toluene | 6. Ethylbenzene | 7. m,p-Xylene | 8. o-Xylene | 9. Styrene | 10. 1,2,4-TMB |
|---|---|---|---|---|---|---|---|---|---|---|
| 1. n-Octane | 1 | |||||||||
| 2. n-Nonane | 0.68 * | 1 | ||||||||
| 3. n-Decane | 0.63 * | 0.96 ** | 1 | |||||||
| 4. n-Undecane | 0.42 * | 0.59 * | 0.59 | 1 | ||||||
| 5. Toluene | 0.13 * | 0.76 | 0.67 | 0.34 | 1 | |||||
| 6. Ethylbenzene | 0.35 * | 0.73 | 0.66 | 0.49 | 0.52 | 1 | ||||
| 7. m,p-Xylene | 0.27 * | 0.81 ** | 0.72 | 0.39 | 0.97 | 0.59 | 1 | |||
| 8. o-Xylene | 0.29 * | 0.83 ** | 0.74 | 0.38 | 0.97 | 0.60 | 1 | 1 | ||
| 9. Styrene | 0.27 * | 0.23 * | 0.12 * | 0.45 * | 0.65 * | 0.07 * | 0.56 * | 0.52 * | 1 | |
| 10. 1,2,4-TMB | 0.08 * | 0.66 | 0.54 | 0.38 | 0.96 ** | 0.38 | 0.92 ** | 0.91 ** | 0.80 ** | 1 |
| 1. n-Octane | 1 | |||||||||
| 2. n-Nonane | 0.99 ** | 1 | ||||||||
| 3. n-Decane | 0.98 ** | 0.99 ** | 1 | |||||||
| 4. n-Undecane | 0.97 ** | 0.98 ** | 0.99 ** | 1 | ||||||
| 5. Toluene | 0.99 ** | 0.99 ** | 0.99 ** | 0.98 ** | 1 | |||||
| 6. Ethylbenzene | 0.99 ** | 0.98 ** | 0.96 ** | 0.96 ** | 0.99 ** | 1 | ||||
| 7. m+p-Xylene | 1 ** | 0.99 ** | 0.97 ** | 0.96 ** | 0.99 ** | 1 ** | 1 | |||
| 8. o-Xylene | 0.99 ** | 0.97 ** | 0.97 ** | 0.97 ** | 0.98 ** | 0.98 ** | 0.98 ** | 1 | ||
| 9. Styrene | 0.71 | 0.75 | 0.79 | 0.75 | 0.72 | 0.62 | 0.66 | 0.72 | 1 | |
| 10. 1,2,4-TMB | 0.99 ** | 1 ** | 0.99 ** | 0.98 ** | 0.99 ** | 0.96 ** | 0.98 ** | 0.96 ** | 0.78 | 1 |
| NO2 (µg m−3) | 30–31 October 2014 | 25–26 November 2014 | 17–24 June 2015 | 24–29 June 2015 |
|---|---|---|---|---|
| Indoor | 41.6 ± 11.7 | 36.1 ± 10.1 | 34.0 ± 6.5 | 48.4 ± 9.2 |
| Outdoor Baggage | 64.2 ± 18.0 | NA | 49.0 ± 9.3 | 49.5 ± 9.4 |
| Fresh Air | 52.3 ± 14.7 | 20.6 ± 5.8 | NA | NA |
| VOC Group | VOC | This Study Arrivals Hall June/November 2014 (n = 14) | Pleil et al., 2000 U.S. Air Force base (AFB) Break rooms, offices July 1997, February 1998 (n = 5) |
|---|---|---|---|
| Heavy Alkanes | n-Octane | 2.92 | 0.85 |
| n-Nonane | 3.31 | 6.33 | |
| n-Decane | 2.89 | 15.94 | |
| n-Undecane | 2.90 | 16.49 | |
| Monoaromatics | Toluene | 6.65 | 9.62 |
| Ethylbenzene | 3.44 | 1.77 | |
| m,p-Xylene | 4.29 | 4.46 | |
| o-Xylene | 2.16 | 3.05 | |
| Styrene | 0.31 | 1.43 | |
| Chloroalkenes | Tetrachloroethene | 0.17 | 0.48 |
| Light Alkanes | n-Butane | 5.17 | 13.85 |
| n-Pentane | 0.53 | 8.28 | |
| n-Hexane | 0.54 | 1.51 | |
| n-Heptane | 1.13 | 0.58 | |
| TVOC (µg m−3) | 36.41 | 84.64 |
Publisher’s Note: MDPI stays neutral with regard to jurisdictional claims in published maps and institutional affiliations. |
© 2021 by the authors. Licensee MDPI, Basel, Switzerland. This article is an open access article distributed under the terms and conditions of the Creative Commons Attribution (CC BY) license (http://creativecommons.org/licenses/by/4.0/).
Share and Cite
Mokalled, T.; Adjizian Gérard, J.; Abboud, M.; Liaud, C.; Nasreddine, R.; Le Calvé, S. An Assessment of Indoor Air Quality in the Arrivals Hall of Beirut–Rafic Hariri International Airport: Monitoring of VOCs and NO2. Atmosphere 2021, 12, 400. https://doi.org/10.3390/atmos12030400
Mokalled T, Adjizian Gérard J, Abboud M, Liaud C, Nasreddine R, Le Calvé S. An Assessment of Indoor Air Quality in the Arrivals Hall of Beirut–Rafic Hariri International Airport: Monitoring of VOCs and NO2. Atmosphere. 2021; 12(3):400. https://doi.org/10.3390/atmos12030400
Chicago/Turabian StyleMokalled, Tharwat, Jocelyne Adjizian Gérard, Maher Abboud, Céline Liaud, Rouba Nasreddine, and Stéphane Le Calvé. 2021. "An Assessment of Indoor Air Quality in the Arrivals Hall of Beirut–Rafic Hariri International Airport: Monitoring of VOCs and NO2" Atmosphere 12, no. 3: 400. https://doi.org/10.3390/atmos12030400
APA StyleMokalled, T., Adjizian Gérard, J., Abboud, M., Liaud, C., Nasreddine, R., & Le Calvé, S. (2021). An Assessment of Indoor Air Quality in the Arrivals Hall of Beirut–Rafic Hariri International Airport: Monitoring of VOCs and NO2. Atmosphere, 12(3), 400. https://doi.org/10.3390/atmos12030400