
Green Roof Enhancement on Buildings of the University of Applied Sciences in Neubrandenburg (Germany) in Times of Climate Change


Abstract
1. Introduction
2. Experiments
- -Building 2 had three commercial growing media, identified as Zi, Blä, and Op, with a 10-cm depth plus a drainage layer. The additional 26 planter boxes with a 30-cm-thick layer of the extensive growing media from two main deliverers of green roof materials, ZinCo and Optigruen with the abbreviation Zi and Op, were the test installations. These materials followed the necessary requirements after [16], such as a granulometric distribution and the minimum water holding capacity. The primary vegetation was similar, using grass seeds and sedum cuttings.
- -Building 3 had the 10-cm growing media Op-2 (product name “Optima Tiefgarage schwer”) and Ulo (expanded slate, grain size 2–11 mm, brand name “Thüringer Blähschiefer”). The vegetation layer on top of the growing media was prefabricated turf mats on the west, north, and south sides while the east side used both growing media with a selection of sedum cuttings on top. An additional 13 planter boxes with a 30-cm media depth of Op-2 were used, representing semi-intensive green roofs with some grass seeds and some herbal plantings in the beginning.
3. Results
3.1. Cluster Analysis 2001–2020: Test Based on Plant Species Observation
- Test 1: Analysis of the first year on building 3 showed the development of the plant species richness in the turf mats in Table 2. The results, supported by the cluster/correlation analyses, are shown in Table 2, with the species mix on all turf mats with no additional treatments being highly significantly similar with 0.896***, as demonstrated by the examples of the turf mats on the Ulo-West and Op-West test plots. Both mats in the year 2020 were also highly significant, with 0.963***.
- Test 2: How did the growing media influence the number of species and the coverage value? In general, this was demonstrated here by the north test plots in 2001. The Op media in all cases showed higher species richness, as shown by way of the example in Table 3, with 25 species on the Ulo medium and 29 species on the Op medium.
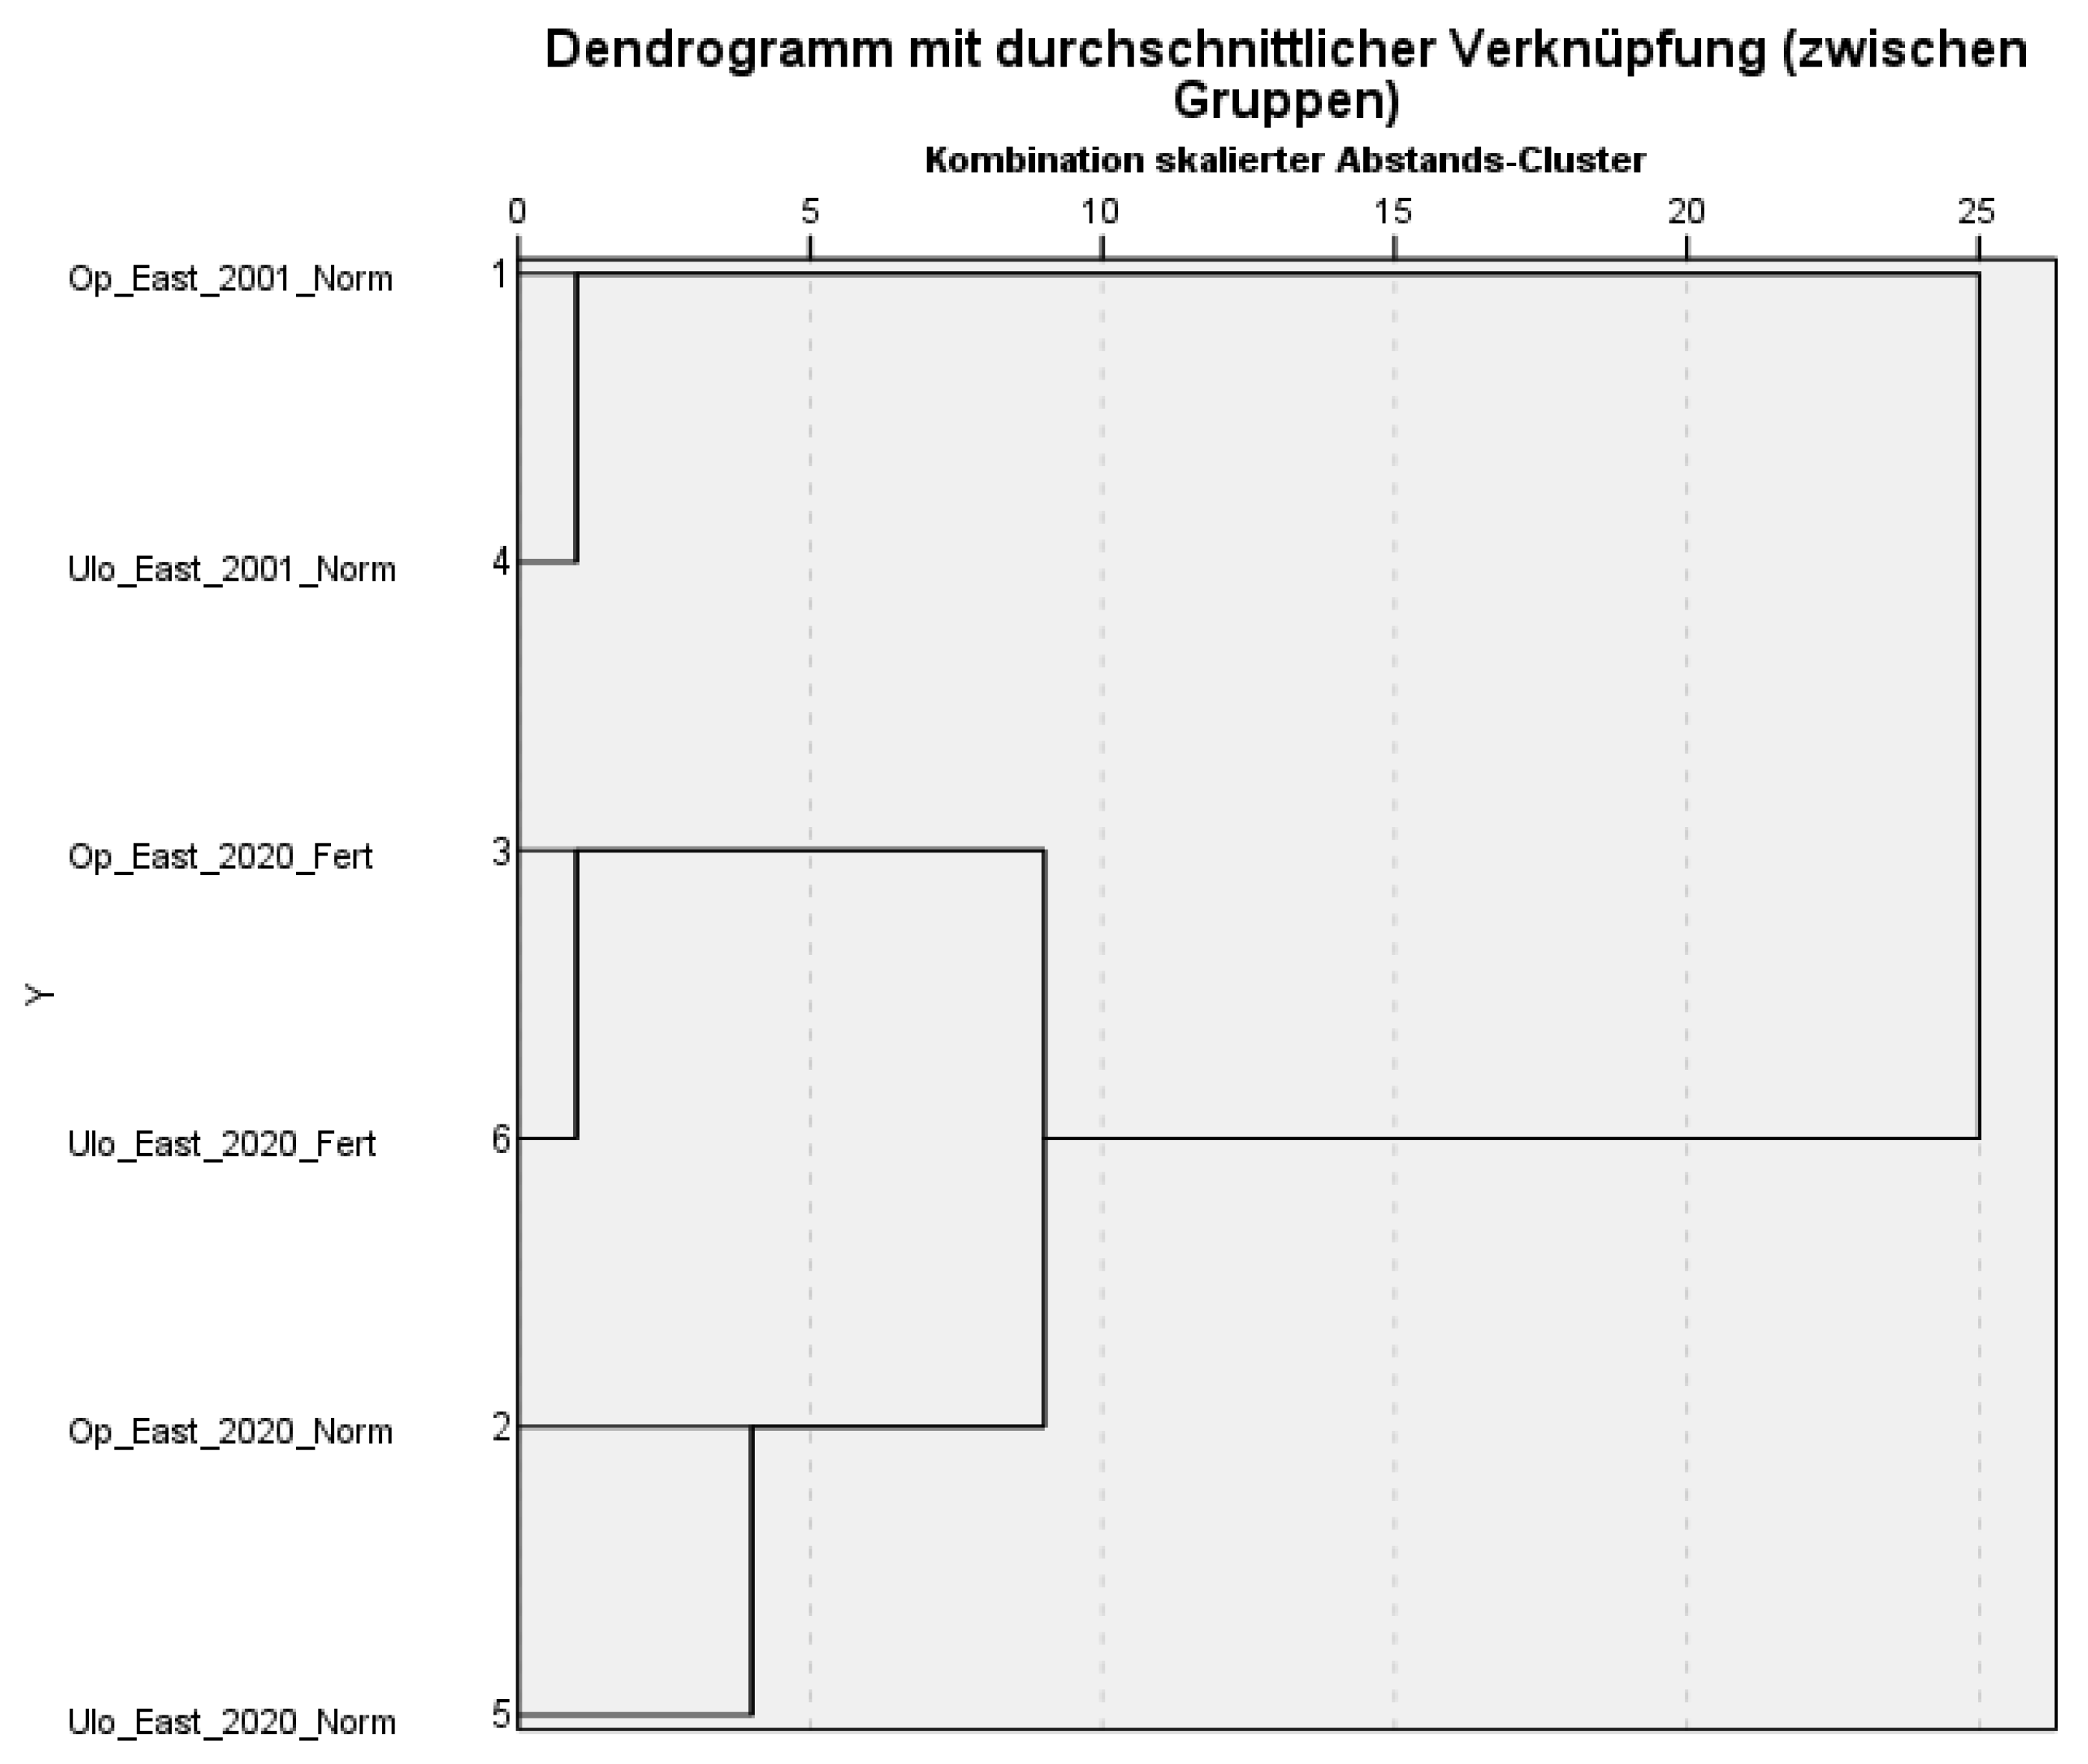
- Test 3: Species development of the cuttings, eastern exposure test plots.
3.2. Phytomass in Relation to the Type of Media and the Media Depth
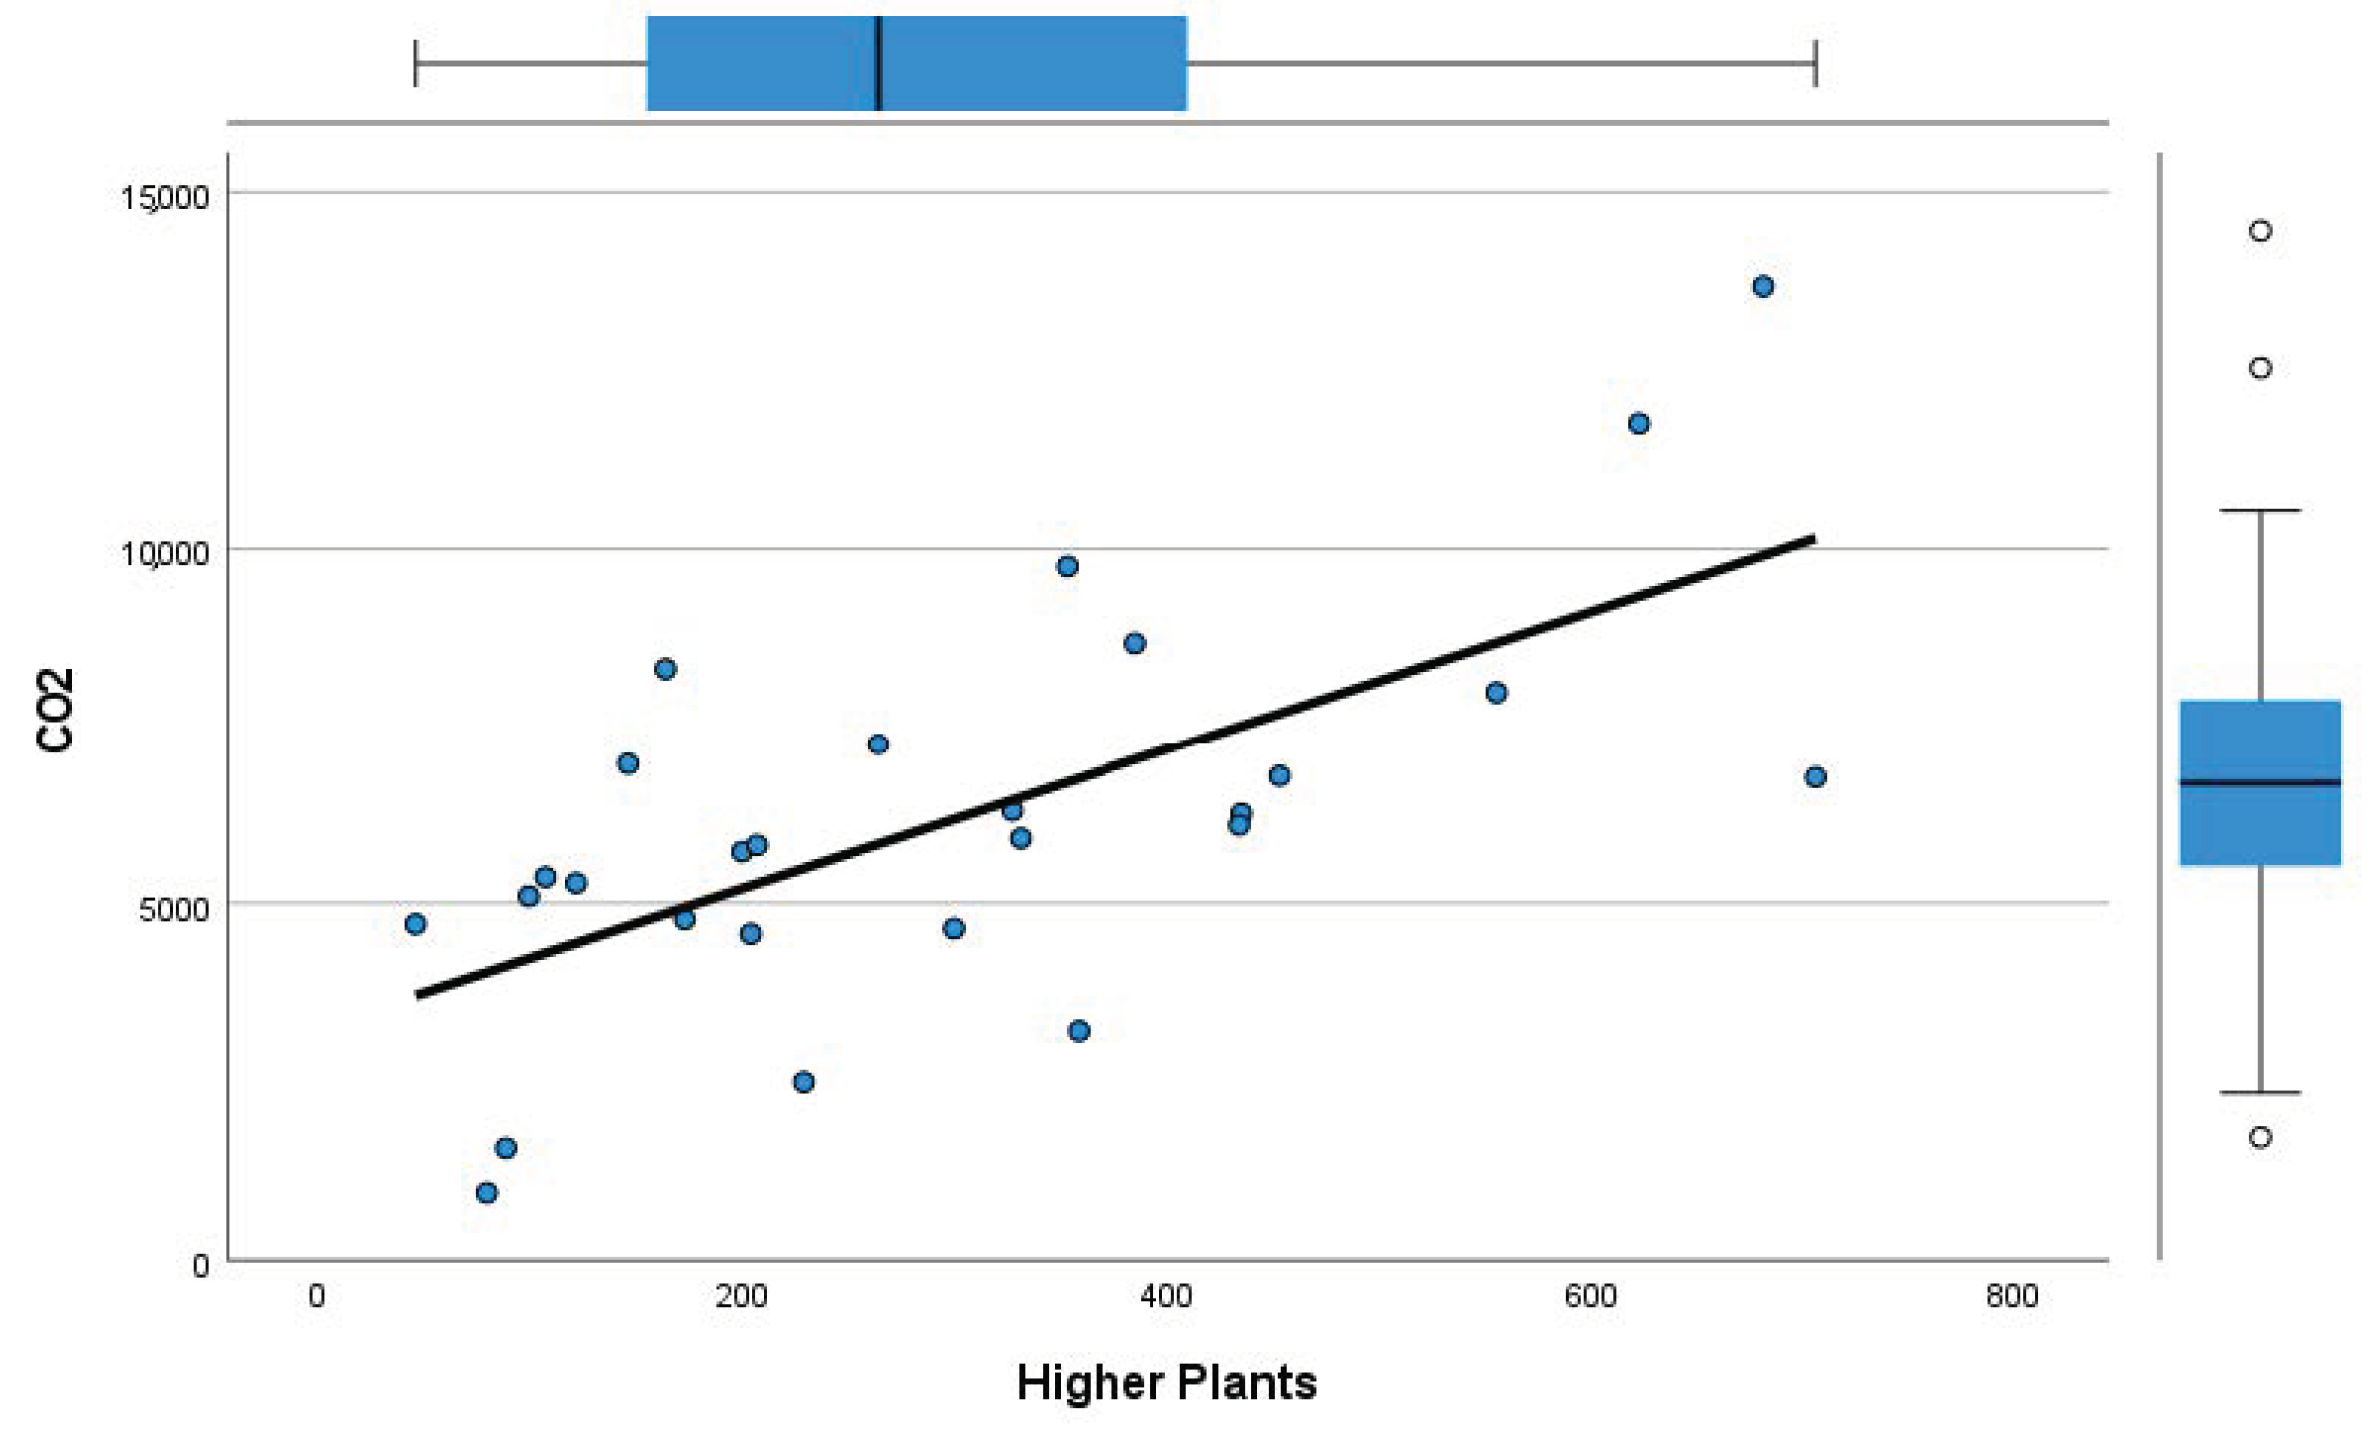
- Test 4: focused on the phytomass on various growing media depths. The question is whether a greater growing media depth supports a higher biomass with better performance, e.g., in regard to CO2 fixation.
3.2.1. The 10-cm Plots
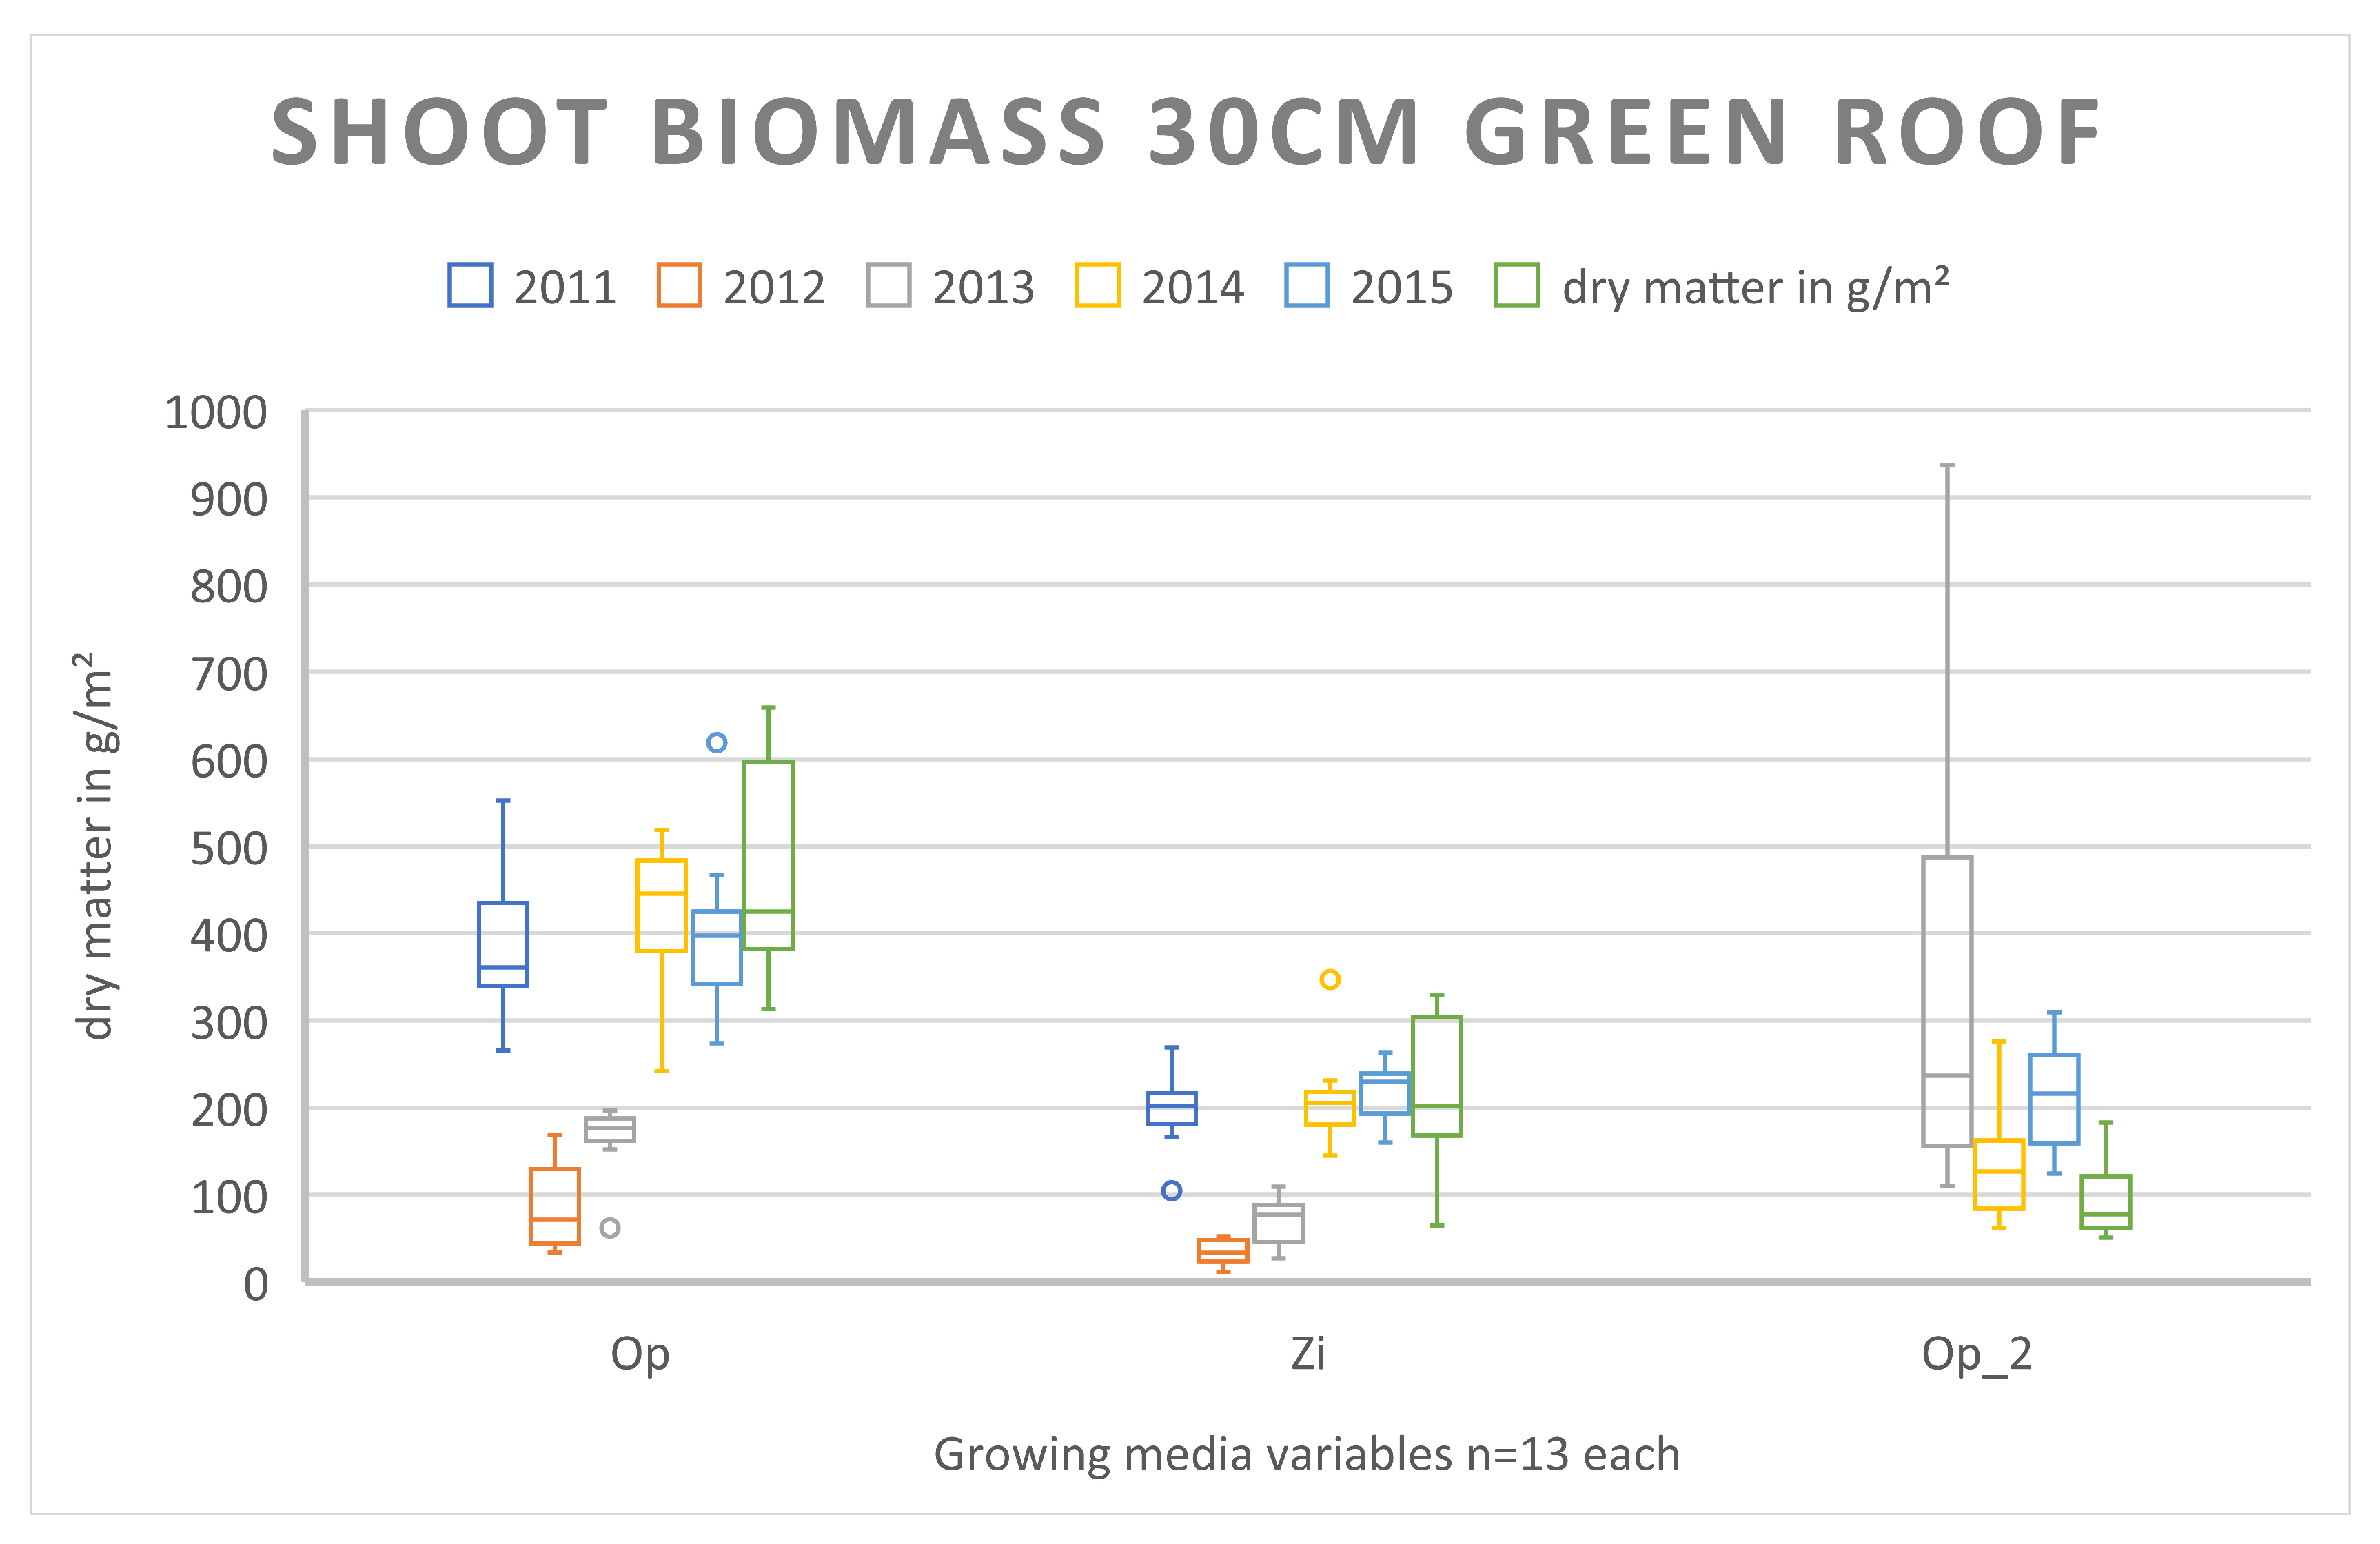
3.2.2. The 30-cm Plots
3.3. Effect of Irrigation and Fertilization on Vegetation Cover and Biodiversity
3.3.1. Eastern Test Plots
3.3.2. Western test plots
3.3.3. Northern Test Plots
3.3.4. Southern Test Plots
4. Discussion
5. Conclusions
Author Contributions
Funding
Informed Consent Statement
Data Availability Statement
Acknowledgments
Conflicts of Interest
References
- Rom, W.N.; Pinkerton, K.E. Introduction: Consequences of Global Warming to Planetary and Human Health. In Climate Change and Global Public Health; Respiratory Medicine. Humana; Pinkerton, K.E., Rom, W.N., Eds.; Springer: Cham, Switzerland, 2021. [Google Scholar] [CrossRef]
- Youl, R. Landcare in Victoria; Spicers Paper: Melbourne, Australia, 2006; p. 194. [Google Scholar]
- Wüstenfrauen. Available online: https://wooxl.wordpress.com/2010/10/23/chinas-wustenfrauen/ (accessed on 28 February 2021).
- The Great Green Wall. Available online: https://www.greatgreenwall.org/about-great-green-wall/ (accessed on 28 February 2021).
- Mutke, J.; Quandt, D. Der Deutsche Wald. Seine Geschichte, seine Ökologie. Wald. Forsch. Lehre 2018, 8, 650–652. [Google Scholar]
- DeFries, R.; Rudel, T.; Uriarte, M.; Hansem, M. Deforestation driven by urban population growth and agricultural trade in the twenty-first century. Nat. Geosci. 2010, 3, 178–181. [Google Scholar] [CrossRef]
- Clinton, N.; Yu, L.; Fu, H.; He, C.; Gong, P. Global-Scale Associations of Vegetation Phenology with Rainfall and Temperature at a High Spatio-Temporal Resolution. Remote Sens. 2014, 6, 7320–7338. [Google Scholar] [CrossRef]
- Kabano, P.; Lindley, S.; Harris, A. Evidence of urban heat island impacts on the vegetation growing season length in a tropical city. Landsc. Urban Plan. 2021, 206. [Google Scholar] [CrossRef]
- Kravcik, M.; Pokorny, J.; Kohutiar, M.; Toth, E. Water for the Recovery of the Climate—A New Water Paradigm; Krupa Print: Žilina, Slovakia, 2007. [Google Scholar]
- Trillion Tree Plantings. Available online: https://trilliontrees.org.au/ (accessed on 1 March 2021).
- Tan, P.Y. Vertical Garden City; Straits Times Press: Singapore, 2013; p. 192. [Google Scholar]
- Loder, A. Greening the City: Exploring Health, Well-Being, Green Roofs, and the Perspective of Nature in the Workplace. Ph.D. Thesis, University of Toronto, Toronto, ON, Canada, 2011. [Google Scholar]
- Mann, G.; Gohlke, R.; Wolff, F. Marktreport Dach-, Fassaden- und Innenraumbegrünung Deutschland; BUGG-Publication: Saarbrücken, Germany, 2020; p. 72. [Google Scholar]
- Dover, J.W. Green Infrastructure; Routledge: London, UK; New York, NY, USA, 2015; p. 337. [Google Scholar] [CrossRef]
- Oberndorfer, E.; Lundholm, J.; Brass, B.; Coffmann, R.; Doshi, H.; Dunnett, N.; Gaffin, S.; Köhler, M.; Liu, K.; Rowe, B. Green Roofs as Urban Ecosystems: Ecological Structures, Functions, and Services. BioScience 2007, 57, 823–833. [Google Scholar] [CrossRef]
- Cristiano, E.; Deidda, R.; Viola, F. The role of green roofs in urban Water-Energy-Food-Ecosystem nexus: A review. Sci. Total. Environ. 2021, 756. [Google Scholar] [CrossRef]
- Andersson, E.; Langemeyer, J.; Borgström, S.; Mcphearson, T.; Haase, D.; Kronenberg, J.; Barton, D.N.; Davis, M.; Naumann, S.; Röschel, L.; et al. Enabling Green and Blue Infrastructure to Improve Contributions to Human Well-Being and Equity in Urban Systems. BioScience 2019, 69, 566–574. [Google Scholar] [CrossRef]
- Cirkel, D.G.; Voortman, B.R.; Van Veen, T.; Bartholomeus, R.P. Evaporation from (Blue-) Green Roofs: Assessing the Benefits of a Storage and Capillary Irrigation System Based on Measurements and Modeling. Water 2018, 10, 1253. [Google Scholar] [CrossRef]
- Cook, L.M.; Larsen, T.A. Towards a performance-based approach for multifunctional green roofs: An interdisciplinary review. Build. Environ. 2021, 188. [Google Scholar] [CrossRef]
- Shafique, M.; Xue, X.; Luo, X. An overview of carbon sequestration of green roofs in urban areas. Urban For. Urban Green. 2020, 47. [Google Scholar] [CrossRef]
- Kuronuma, T.; Watanabe, H.; Ishihara, T.; Kou, D.; Toushima, K.; Ando, M.; Shindo, S. CO2 Payoff of Extensive Green Roofs with Different Vegetation Species. Sustainability 2018, 10, 2256. [Google Scholar] [CrossRef]
- Köhler, M.; Kaiser, D. Evidence of the Climate Mitigation Effect of Green Roofs–A 20-Year Weather Study on an Extensive Green Roof (EGR) in Northeast Germany. Buildings 2019, 9, 157. [Google Scholar] [CrossRef]
- Kaiser, D.; Köhler, M.; Schmidt, M.; Wolf, F. Increasing Evapotranspiration on Extensive Green Roofs by Changing Substrate Depths, Construction, and Additional Irrigation. Buildings 2019, 9, 173. [Google Scholar] [CrossRef]
- Lösken, G.; Ansel, W.; Backhaus, T.; Bartel, Y.-C.; Bornholdt, H.; Bott, P.; Henze, M.; Hokema, J.; Köhler, M.; Krupka, B.W.; et al. Dachbegrünungsrichtlinien–Richtlinien für Planung, Bau und Instandhaltung von Dachbegrünungen; Fll publishing: Bonn, Germany, 2018; p. 150. [Google Scholar]
- Kopecký, K.; Dostálek, J.; Frantík, T. The use of the deductive method of syntaxonomic classification in the system of vegetational units of the Braun-Blanquet approach. Vegetatio 1995, 117, 95–112. [Google Scholar] [CrossRef]
- De Graaf, M.A.; Van Groeninen, K.J.; Six, J.; Hungate, B.; Van Kessel, C. Interactions between plant growth and soil nutrient cycling under elevated CO2: A meta-analysis. Glob. Chang. Biol. 2006, 12, 2077–2091. [Google Scholar] [CrossRef]
- Poorter, H.; Navas, M.L. Plant growth and competition at elevated CO2: On winners, losers and functional groups. New Phytol. 2003, 157, 175–198. [Google Scholar] [CrossRef]
- Körner, C. Plant CO2 responses: An issue of definition, time and resource supply. New Phytol. 2006, 172, 393–411. [Google Scholar] [CrossRef] [PubMed]
- Natureoffice. Wir Realisieren Klimalösungen. Available online: https://www.natureoffice.com/ecocent (accessed on 6 January 2021).
- Hein, J.; Guarin, A.; Frommé, E.; Pauw, P. Deforestation and the Paris climate agreement: An assessment of REDD+ in the national climate action plans. For. Policy Econ. 2018, 90, 7–11. [Google Scholar] [CrossRef]
- Fang, W.; Huang, S.; Huang, Q.; Huang, G.; Wang, H.; Leng, G.; Wang, L.; Li, P.; Ma, L. Bivariate probabilistic quantification of drought impacts on terrestrial vegetation dynamics in mainland China. J. Hydrol. 2019, 577, 10. [Google Scholar] [CrossRef]
- Li, Q.; Zhang, H.; Liu, X.; Huang, J. Urban heat island effect on annual mean temperature during the last 50 years in China. Theor. Appl. Climatol. 2004, 79, 165–174. [Google Scholar] [CrossRef]
- Ward, K.; Lauf, S.; Kleinschmit, B.; Endlicher, W. Heat waves and urban heat islands in Europe: A review of relevant drivers. Sci. Total Environ. 2019, 569, 527–539. [Google Scholar] [CrossRef]
- UNFCCC. Long-Term Low Greenhouse Gas Emission Development Strategy of the EU and Its Member States. 2020. Available online: https://unfccc.int/documents/210328 (accessed on 10 January 2021).
- IDW-News. Rekord Rückggang der Globalen CO2-Immissionen. 2020. Available online: https://nachrichten.idw-online.de/2020/12/11/rekord-rueckgang-der-globalen-CO2-emissionen-dank-corona/ (accessed on 10 January 2021).
- Getter, K.L.; Rowe, D.B.; Robertson, G.P.; Cregg, B.M.; Andersen, J.A. Carbon Sequestration Potential of Extensive Green Roofs. Environ. Sci. Technol. 2009, 43, 7564–7570. [Google Scholar] [CrossRef] [PubMed]
- Heusinger, J.; Weber, S. Surface energy balance of an extensive green roof as quantified by full year eddy-covariance measurements. Sci. Total. Environ. 2017, 577, 220–230. [Google Scholar] [CrossRef] [PubMed]
- Stangl, R.; Medl, A.; Scharf, B.; Pitha, U. Wirkungen der Grünen Stadt. Studie zur Abbildung des Aktuellen Wissenstands im Bereich Städtischer Begrünungsmaßnahmen. In Bundesministerium für Verkehr, Innovation und Technologie (Hrsg.), Berichte aus Energie- und Umweltforschung 12/2019. Available online: https://nachhaltigwirtschaften.at/resources/sdz_pdf/schriftenreihe-2019-12-wirkungen-gruene-stadt.pdf (accessed on 11 January 2021).
- Manso, M.; Teotonio, I.; Silva, C.M.; Cruz, C.O. Green roof and green wall benefits and costs: A review of the quantitative evidence. Renew. Sustain. Energy Rev. 2021, 135, 110111. [Google Scholar] [CrossRef]
- Ksiazek-Mikenas, K.; Herrmann, J.; Menke, S.B.; Köhler, M. If You Build It, Will They Come? Plant and Arthropod Diversity on Urban Green Roofs over Time. Urban Nat. 2018, 1, 52–72. [Google Scholar]
- Filazzola, A.; Shrestha, N.; MacIvor, S. The contribution of constructed green infrastructure to urban biodiversity: A synthesis and meta-analysis. J. Appl. Ecol. 2019, 1–13. [Google Scholar] [CrossRef]
- Heijmans, M.M.P.D.; Arp, W.J.; Chapin, F.S., III. Controls on moss evaporation in a boreal black spruce forest. Glob. Biogeochem. Cycles 2004, 18. [Google Scholar] [CrossRef]
- Drake, P.; Grimshaw-Surette, H.; Heim, A.; Lundholm, J. Mosses inhibit germination of vascular plants on an extensive green roof. Ecol. Eng. 2019, 117, 111–114. [Google Scholar] [CrossRef]
- Baraldi, R.; Neri, L.; Costa, F.; Facini, O.; Rapparini, F.; Carriero, G. Ecophysiological and micromorphological characterization of green roof vegetation for urban mitigation. Urban For. Urban Green. 2019, 37, 24–32. [Google Scholar] [CrossRef]
- Rufí-Salís, M.; Calvo, M.J.; Petit-Boix, A.; Villalba, G.; Gabarrell, X. Exploring nutrient recovery from hydroponics in urban agriculture: An environmental assessment. Resour. Conserv. Recycl. 2020, 155, 104683. [Google Scholar] [CrossRef]
- Schröder, R.; Kiehl, K. Extensive roof greening with native sandy dry grassland species: Effects of different greening methods on vegetation development over four years. Ecol. Eng. 2020, 145, 105728. [Google Scholar] [CrossRef]
- Whittinghill, L.J.; Rowe, B.D.; Schutzki, R.; Cregg, B.M. Quantifying carbon sequestration of various green roof and ornamental landscape systems. Landsc. Urban Plan. 2014, 123, 41–48. [Google Scholar] [CrossRef]
- McAlister, R.; Rott, A.S. Up on the roof and down in the dirt: Differences in substrate properties (SOM, potassium, phosphorus and pH) and their relationships to each other between sedum and wildflower green roofs. PLoS ONE 2019, 14, e0225652. [Google Scholar] [CrossRef]
- Du, P.; Arndt, S.K.; Farrell, C. Is plant survival on green roofs related to their drought response, water use or climate of origin? Sci. Total. Environ. 2019, 667, 25–32. [Google Scholar] [CrossRef]
- Lundholm, J.T.; Marlin, A. Habitat origins and microhabitat preferences of urban plant species. Urban Ecosyst. 2006, 9, 139–159. [Google Scholar] [CrossRef]
- Mechelen, C.; Dutoit, T.; Kattge, J.; Hermy, H. Plant trait analysis delivers an extensive list of potential green roof species for Mediterranean France. Ecol. Eng. 2014, 67, 48–59. [Google Scholar] [CrossRef]
- Heim, A.; Lundholm, J.T. Cladonia lichens on extensive green roofs: Evapotranspiration, substrate temperature, and albedo. F1000Research 2013, 2, 274. [Google Scholar] [CrossRef]
- Liu, J.; Shresth, P.; Skabelund, L.R.; Todd, T.; Decker, A.; Kirkham, M.B. Growth of prairie plants and sedums in different substrates on an experimental green roof in Mid-Continental USA. Sci. Total. Environ. 2019, 697, 134089. [Google Scholar] [CrossRef] [PubMed]
- Vanstockem, J.; Somers, B.; Hermy, M. Weeds and gaps on extensive green roofs: Ecological insights and recommendations for design and maintenance. Urban For. Urban Green. 2019, 46, 126484. [Google Scholar] [CrossRef]
- Catalano, C.; Laudicina, V.A.; Badalucco, L.; Guarino, R. Some European green roof norms and guidelines through the lens of biodiversity: Do ecoregions and plant traits also matter? Ecol. Eng. 2018, 115, 15–26. [Google Scholar] [CrossRef]
- Wiltshire, A.; Gornall, J.; Booth, B.; Dennis, E.; Falloon, P.; Kay, G.; McNeall, D.; McSweeney, C.; Betts, R. The importance of population, climate change and CO2 plant physiological forcing in determining future global water stress. Glob. Environ. Chang. 2013, 23, 1083–1097. [Google Scholar] [CrossRef]
- Li, X.X.; Cao, J.J.; Xu, P.X.; Fei, L.; Dong, Q.; Wang, Z.L. Green roofs: Effects of plant species used on runoff. Land Degrad. Dev. 2018, 1–11. [Google Scholar] [CrossRef]
- Barriuso, F.; Urbano, B. Green roofs and walls design intended to mitigate climate change in urban areas across all continents. Sustainability 2021, 13, 2245. [Google Scholar] [CrossRef]
- Heusinger, J.; Weber, S. Comparative microclimate and dewfall measurements at an urban green roof versus bitumen roof. Build. Environ. 2015, 92, 713–723. [Google Scholar] [CrossRef]
- Cuffe, C. Draft Report on Maximising the Energy Efficiency Potential of the EU Building Stock. 2020. Available online: https://www.euractiv.com/wp-content/uploads/sites/2/2020/04/Cuffe_report.pdf (accessed on 10 January 2021).
- European Commission. A Renovation Wave for Europe -Greening Our Buildings, Creating Jobs, Improving Lives. 2020. Available online: https://ec.europa.eu/energy/sites/ener/files/eu_renovation_wave_strategy.pdf (accessed on 10 January 2021).
- Alizade, B.; Hitchmough, J. A review of urban landscape adaptation to the challenge of climate change. Int. J. Clim. Chang. Strateg. Manag. 2019, 11, 178–194. [Google Scholar] [CrossRef]
- Pradhan, S.; Helal, M.I.; Al-Ghamdi, S.G.; Mackey, H.R. Performance evaluation of various individual and mixed media for greywater treatment in vertical nature-based systems. Chemosphere 2020, 245, 125564. [Google Scholar] [CrossRef] [PubMed]
- Artmann, M.; Sartison, K.; Vavra, J. The role of edible cities supporting sustainability transformation—A conceptual multi-dimensional framework tested on a case study in Germany. J. Clean. Prod. 2020, 255, 120220. [Google Scholar] [CrossRef]
- Bousselot, J.; Russell, V.; Tolderlund, L.; Celik, S.; Retzlaff, B.; Morgan, S.; Buffam, I.; Coffman, R.; Williams, J.; Mitchell, M.E.; et al. Green Roof Research in North America: A Recent History and Future Strategies. J. Living Arch. 2020, 7, 27–64. [Google Scholar] [CrossRef]


| Exposure | Media 1: Ulo | Media 2: Op-2 |
|---|---|---|
| West | 8 | 12 |
| North shaded | 6 | 6 |
| North sun | 6a | 6 |
| South | 5.5 | 5.5 |
| East | 11 | 11 |
| Test Plots | Ulo_West 2001 | Opti_West_ 2001 | Ulo_West 2020 | Op_West 2020 |
|---|---|---|---|---|
| Ulo_West_2001 | 1.000 | 0.896 *** | 0.151 | 0.223 |
| Ulo_West_2020 | 0.151 | 0.131 | 1.000 | 0.963 *** |
| Name | Number of Species | Coverage Value in % |
|---|---|---|
| Ulo_Norm_N_2001 | 25 | 88 |
| Op_Norm_N_2001 | 29 | 94 |
| Ulo_Norm_Shade 2020 | 27 | 94 |
| Ulo_Fert_N_Shade_2020 | 14 | 98 |
| Ulo_Norm_N_Sun_2020 | 15 | 81 |
| Ulo_Fert_N_Sun_2020 | 13 | 96 |
| Name | Criteria | Ulo_Norm _N_ 2001 | Op_Norm _N_ 2001 | Ulo_Norm_N_Shade 2020 | Ulo_Fert_N__Shade_2020 | Ulo_ Norm_N_Sun_2020 | Ulo_Fert_N_Sun 2001 |
|---|---|---|---|---|---|---|---|
| Ulo_ Norm_ N_2001 | Pearson correlation | 1 | 0.948 ** | 0.954 ** | 0.957 ** | 0.259 | 0.210 |
| Sig. | 0.000 | 0.000 | 0.000 | 0.471 | 0.617 | ||
| Species | 25 | 24 | 15 | 8 | 10 | 8 |
| Name | Number of Species | Coverage Values in % |
|---|---|---|
| Ulo_Norm_East_2001 | 9 | 11 |
| Ulo_Norm_East_2020 | 16 | 69 |
| Ulo_Fert_East 2020 | 10 | 98 |
| Op_Norm_East_2001 | 14 | 14 |
| Op_Norm_East_2020 | 18 | 83 |
| Op_Fert_East_2020 | 12 | 88 |
| Name | Criteria | Ulo Norm 2001 | Op Norm 2001 | Ulo Norm 2020 | Ulo Fert 2020 | Op Norm 2020 | Opt Fert 2020 |
|---|---|---|---|---|---|---|---|
| Ulo Norm 2001 | Pearson correlation | 1 | −0.359 | 1 | 1 | 1 | 1 |
| Sig. | 0.342 | 1 | 1 | 1 | 1 | ||
| Species | 9 | 9 | 2 | 1 | 2 | 2 | |
| Ulo Fert 2020 | Pearson correlation | 1 | 1 | 0.821 ** | 1 | 0.862 * | 0.869 * |
| Sig. | 0.004 | 1 | 0.013 | 0.025 | |||
| Species | 1 | 2 | 10 | 10 | 7 | 6 |
| Exposure | Zi 1 | Blä 1 | Opti 1 | Ulo-N-Sun 1 | Ulo-N-Shade 1 | Op-N Sun |
|---|---|---|---|---|---|---|
| Vasc.plants | 109 ± 6.5 | 183 ± 92 | 394 ± 145 | 243 ± 55 | 334 ± 88 | 411 ± 152 |
| Mosses | 1 ± 0.3 | 2 ± 0.5 | 487 ± 234 | 174 ± 135 | 846 ± 339 | 173 ± 94 |
| Lichens | 1448 ± 167 | 1080 ± 357 | 1 ± 0.3 | 444 ± 148 | 8 ± 7 | 721 ± 368 |
| Roots | 1319 ± 156 | 1456 ± 509 | 3301 ± 1740 | 2855 ± 993 | 3157 ± 305 | 2056 ± 415 |
| Dry matter 3 | 2876 ± 43 | 2719 ± 597 | 4182 ± 1656 | 3717 ± 832 | 4345 ± 314 | 3362 ± 177 |
| Total C | 1438 ± 22 | 1359 ± 298 | 2091 ± 828 | 1859 ± 416 | 2173 ± 159 | 1681 ± 88 |
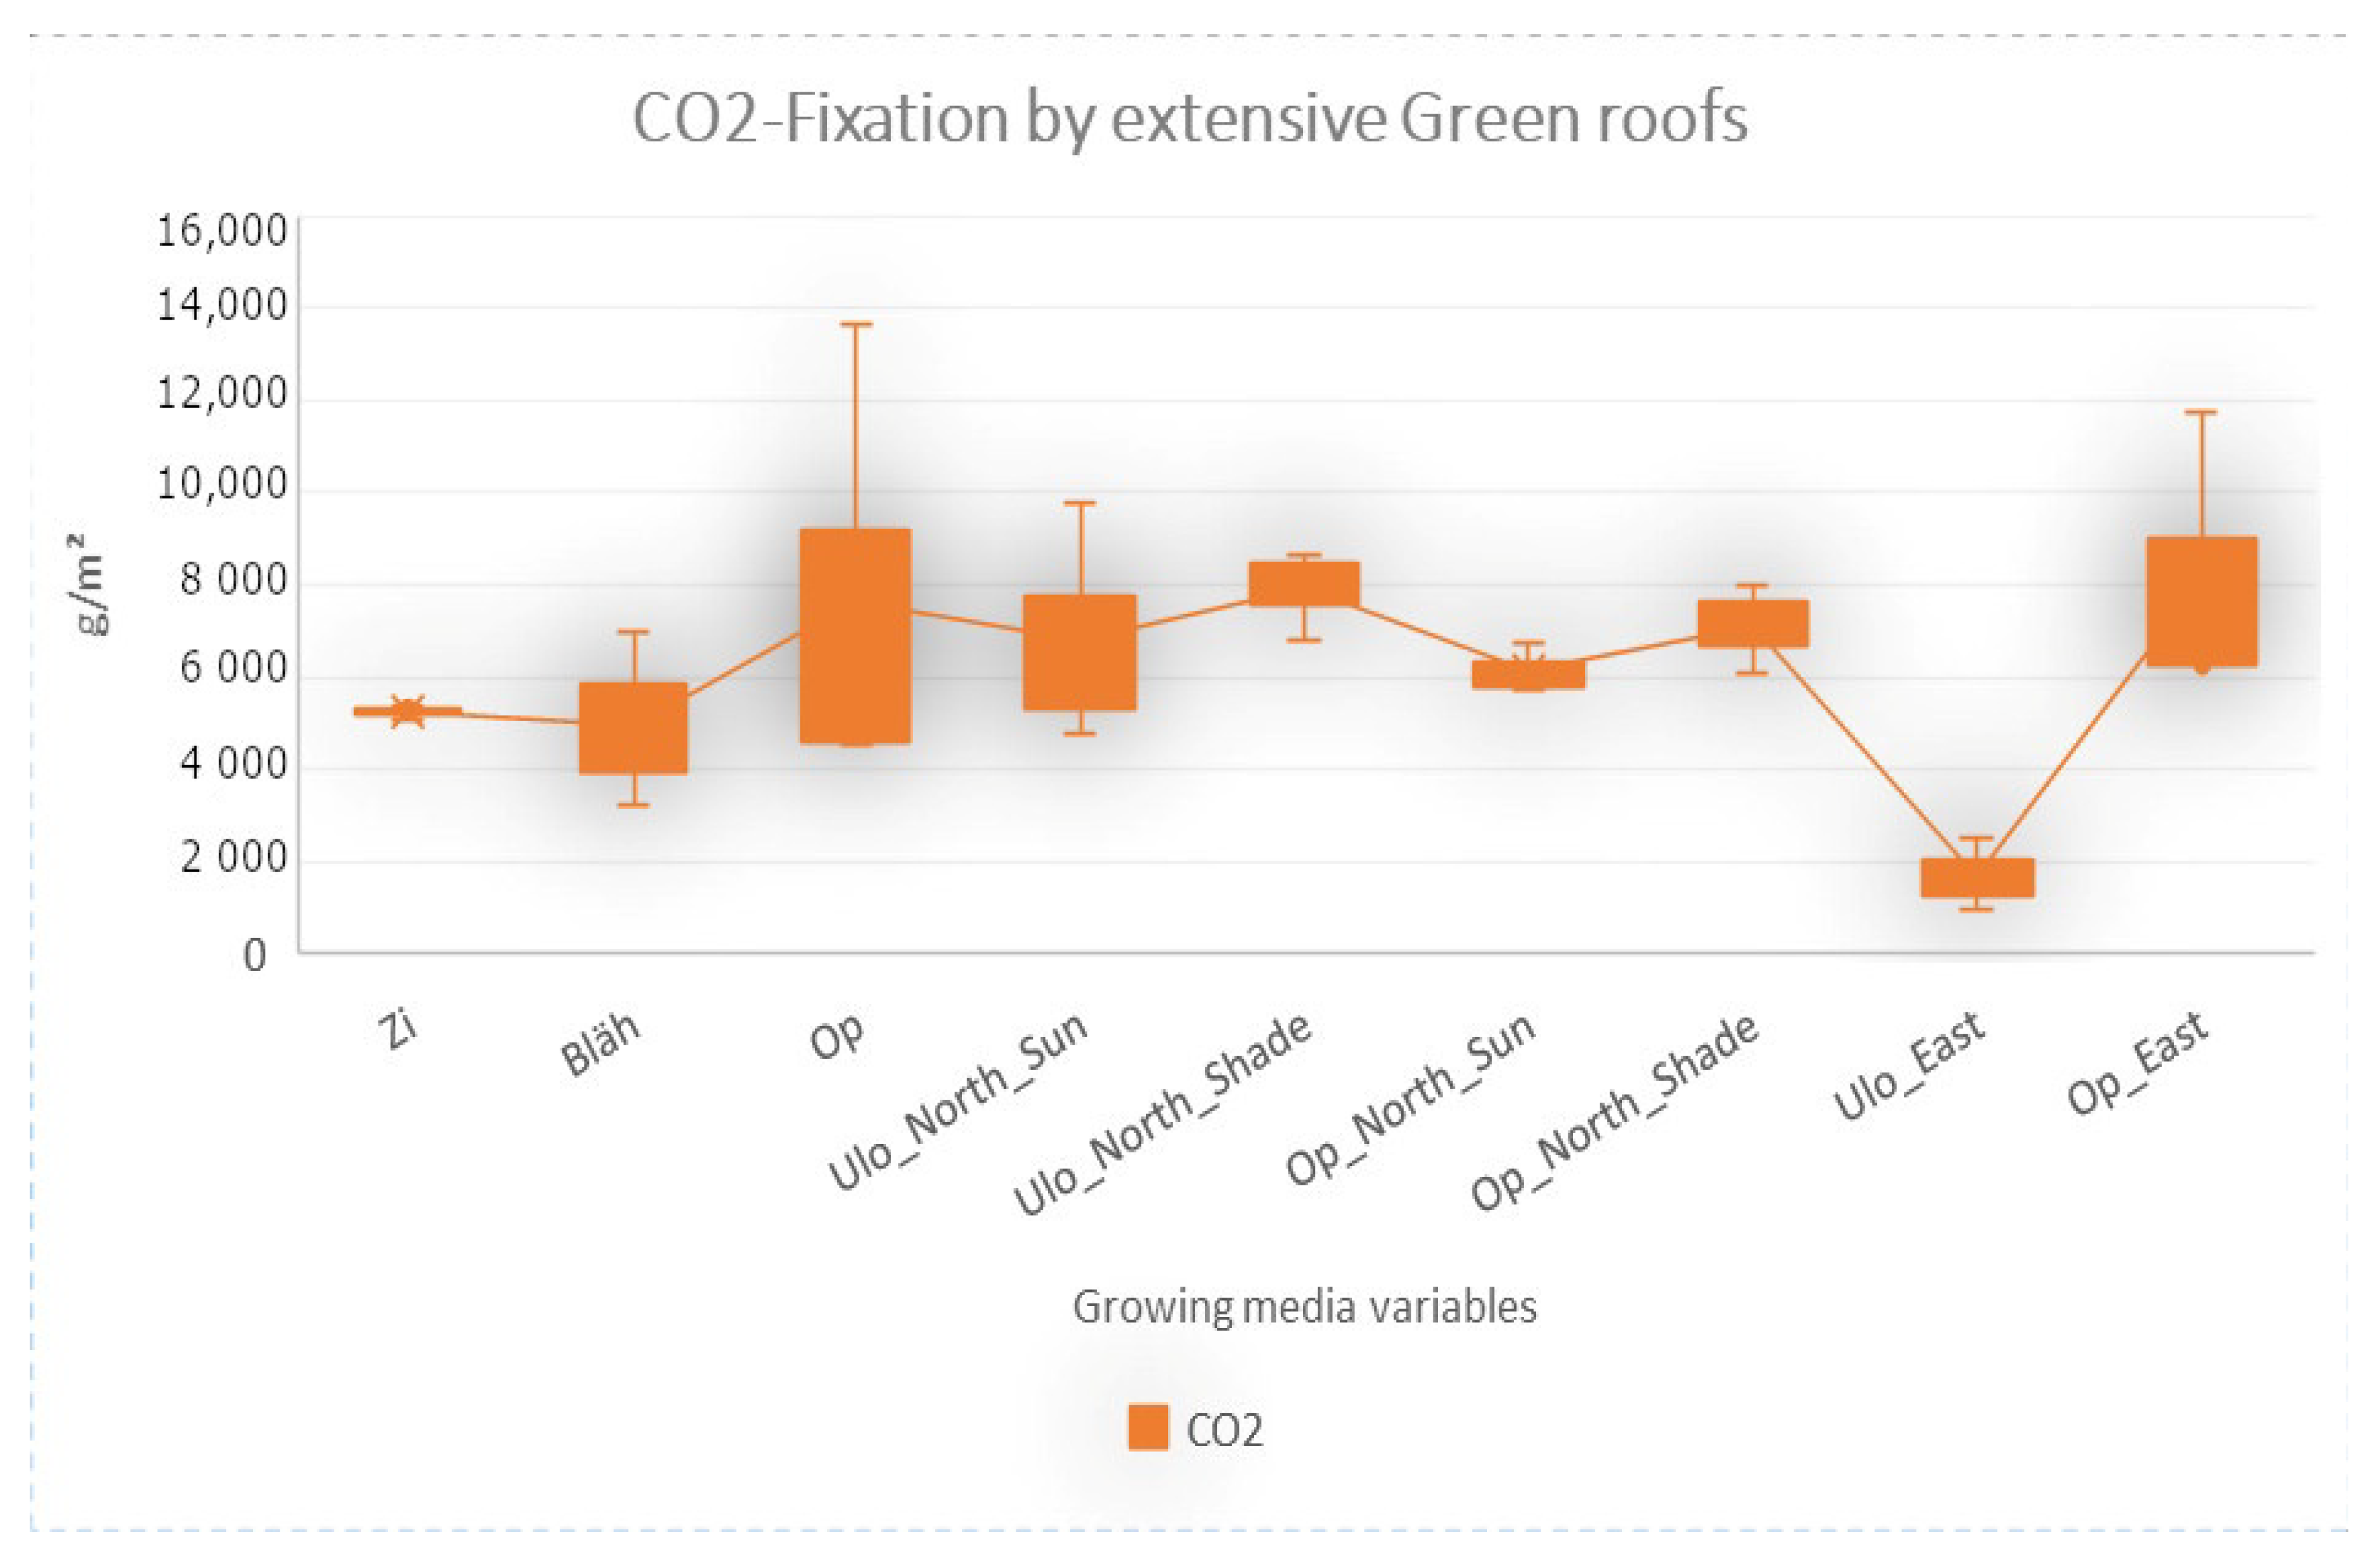
| CO2 | 5249 ± 79 | 4961 ± 1090 | 7633 ± 3023 | 6784 ± 1518 | 7930 ± 579 | 6135 ± 322 |
| Exposure | Op-North Shade 1 | Ulo-East 1 | Op-East | |||
| Vasc.plants | 417 ± 84 | 132 ± 48 | 461 ± 86 | |||
| Mosses | 534 ± 306 | 17 ± 16 | 201 ± 81 | |||
| Lichens | 5 ± 4 | 110 ± 37 | 229 ± 211 | |||
| Roots | 2940 ± 333 | 656 ± 166 | 3550 ± 965 | |||
| Dry matter 3 | 3896 ± 302 | 915 ± 247 | 4442 ± 1001 | |||
| Total C | 1948 ± 151 | 458 ± 123 | 2221 ± 500 | |||
| CO2 | 7110 ± 550 | 1670 ± 450 | 8106 ± 1826 | |||
| Pearson Correlation | CO2 | Vasc. Higher Plants | Mosses | Lichens | Roots |
|---|---|---|---|---|---|
| CO2 fixation | 1.0 | 0.661 | 0.233 | −0.220 | 0.952 |
| Sign. CO2 1-tailed | 0.000 | −0.121 | 0.135 | 0.000 1 |
| Year | Media | N | x-Mean | SD |
|---|---|---|---|---|
| 2011 | Op | 13 | 385 | 72 |
| Zi | 13 | 196 | 44 | |
| 2012 | Op | 13 | 291 | 113 |
| Zi | 13 | 34 | 14 | |
| 2013 | Op | 13 | 168 | 35 |
| Zi | 13 | 70 | 26 | |
| Op-2 | 13 | 344 | 233 | |
| 2014 | Op | 13 | 429 | 76 |
| Zi | 13 | 206 | 50 | |
| Op-2 | 13 | 131 | 58 | |
| 2015 | Op | 13 | 399 | 85 |
| Zi | 13 | 220 | 50 | |
| Op-2 | 13 | 209 | 57 | |
| 2017 | Op | 13 | 476 | 118 |
| Zi | 13 | 223 | 80 | |
| Op-2 | 13 | 95 | 45 |
| Criteria | East Test Plots | x-Mean | SD | Kurtosis |
|---|---|---|---|---|
| Cover | Ulo_Norm 1 | 71.6 | 11.1 | −1.9 |
| Cover | Ulo_Fert 1 | 90.2 | 6.5 | −1.1 |
| Cover | Op_Norm 1 | 90.1 | 7.9 | −1.9 |
| Cover | Op_Fert 1 | 92.3 | 6.2 | −0.2 |
| Species | Ulo_Norm 1 | 14 | 4.2 | −0.2 |
| Species | Ulo_Fert 1 | 8 | 1.5 | −1.1 |
| Species | Op_Norm 1 | 17 | 2.7 | 0.99 |
| Species | Op_Fert 1 | 10 | 2.4 | −1.2 |
| Cover Sedum | Ulo_Norm 1 | 25.5 | 8.5 | −1.2 |
| Cover Sedum | Ulo_Fert 1 | 42.6 | 5.4 | −1.1 |
| Cover Sedum | Op_Norm 1 | 32.6 | 11.9 | −1.5 |
| Cover Sedum | Op_Fert 1 | 40 | 25 | −1.1 |
| Criteria | East Test Plots—Pairs | Mean | T | df | Significance (2-Sided) |
|---|---|---|---|---|---|
| Cover | Ulo_Fert 1 -- Op_Fert 1 | −2.7 | −0.89 | 8 | 0.401 |
| Cover | Ulo_Fert 1 -- Ulo_Norm 1 | 18.7 | 3.55 | 8 | 0.008 *** |
| Cover | Op_Norm 1 -- Op_Fert 1 | −2.1 | −1.04 | 8 | 0.33 |
| Species | Ulo_Fert 1 -- Op_Fert 1 | −1.8 | −2.1 | 8 | 0.07 |
| Species | Ulo_Norm 1 -- Ulo_Fert 1 | 6 | 5.0 | 8 | 0.001 *** |
| Species | Op_Norm 1 --Op_Fert 1 | 8 | 7.7 | 8 | 0.000 *** |
| Cover Sedum | Ulo_Fert 1 -- Op_Fert 1 | 2.6 | 0.32 | 8 | 0.76 |
| Cover Sedum | Ulo_Norm 1 -- Ulo_Fert 1 | −17 | −4.4 | 8 | 0.002 *** |
| Cover Sedum | Op_Norm 1 -- Op_Fert 1 | −7 | −1.6 | 8 | 0.146 |
| Criteria | West Test Plots | x-Mean | SD | Kurtosis |
|---|---|---|---|---|
| Cover | Ulo_Norm 1 | 85.1 | 6.77 | 0.09 |
| Cover | Ulo_Fert 1 | 96.4 | 4.6 | 5.7 |
| Cover | Op_Norm 1 | 92.6 | 3.6 | 0.94 |
| Cover | Op_Fert 1 | 98.1 | 0.93 | 3.3 |
| Species | Ulo_Norm 1 | 20 | 4.6 | −1.6 |
| Species | Ulo_Fert 1 | 12 | 1.7 | −1.6 |
| Species | Op_Norm 1 | 27 | 3.6 | −0.72 |
| Species | Op_Fert 1 | 16 | 2.4 | 0.72 |
| Cover Sedum | Ulo_Norm 1 | 49.9 | 2.6 | 2.6 |
| Cover Sedum | Ulo_Fert 1 | 62.4 | 17.0 | −1.3 |
| Cover Sedum | Op_Norm 1 | 50.3 | 5.6 | −2.1 |
| Cover Sedum | Op_Fert 1 | 58.8 | 10.9 | 1.9 |
| Criteria | West Test Plots Pairs | Mean | T | df | Significance (2-Sided) |
|---|---|---|---|---|---|
| Cover | Ulo_Norm 1 -- Op_Norm 1 | −7.4 | −2.79 | 8 | 0.024 * |
| Cover | Ulo_Fert 1 -- Ulo_Norm 1 | 11.3 | 7.21 | 8 | 0.000 *** |
| Cover | Ulo_Fert 1 -- Op_Fert 1 | −1.67 | −5.53 | 8 | 0.35 |
| Cover | Op_Fert 1 -- Op_Norm 1 | 5.6 | 4.86 | 8 | 0.001 *** |
| Species | Ulo_Fert 1 -- Op_Fert 1 | −4.2 | −4.81 | 8 | 0.001 *** |
| Species | Ulo_Fert 1 - -- Ulo_Norm 1 | −8.78 | −4.25 | 8 | 0.003 *** |
| Species | Op_Fert 1 -- Op_Norm 1 | −11.4 | −8.27 | 8 | 0.000 *** |
| Species | Ulo_Norm 1 -- Op_Norm 1 | −6.89 | −8.04 | 8 | 0.000 *** |
| Cover Sedum | Ulo_Norm 1 --Ulo_Fert 1 | −12.56 | −2.31 | 8 | 0.050 * |
| Cover Sedum | Ulo_Fert 1 -- Op_Fert 1 | 3.67 | 0.734 | 8 | 0.484 |
| Cover Sedum | Op_Norm 1 -- Op_Fert 1 | −8.44 | −1.81 | 8 | 0.11 |
| Criteria | North Test Plots | x-Mean | SD | Kurtosis |
|---|---|---|---|---|
| Cover | Ulo_Norm_Shade 1 | 91.3 | 3.24 | 0.78 |
| Cover | Ulo_Fert_Shade 1 | 91.7 | 3.67 | 0.404 |
| Cover | Op_Norm_Shade 1 | 94.3 | 3.27 | −1.68 |
| Cover | Op_Fert_Shade 1 | 98.2 | 1.19 | 0.77 |
| Species | Ulo_Norm_Shade 1 | 27 | 3.53 | 0.71 |
| Species | Ulo_Fert_Shade 1 | 16 | 3.74 | −0.11 |
| Species | Op_Norm_Shade 1 | 24 | 2.74 | 2.2 |
| Species | Op_Fert_Shade 1 | 16 | 2.6 | 0.05 |
| Cover | Ulo_Norm_Sun 1 | 91.3 | 3.24 | 0.786 |
| Cover | Ulo_Fert_Sun 1 | 90.1 | 5.01 | 0.14 |
| Cover | Op_Norm_Sun 1 | 94.6 | 2.1 | 3.0 |
| Cover | Op_Fert_Sun 1 | 97.6 | 1.24 | 1.52 |
| Species | Ulo_Norm_Sun 1 | 15 | 1.1 | 0.02 |
| Species | Ulo_Fert_Sun 1 | 11 | 1.33 | −1.97 |
| Species | Op_Norm_Sun 1 | 11 | 0.53 | −2.57 |
| Species | Op_Fert_Sun 1 | 11 | 0..53 | −2.57 |
| Criteria | North Test Plot Pairs | Mean | T | df | Significance (2-Sided) |
|---|---|---|---|---|---|
| Cover | Ulo_Fert_Shade 1 --Op_Fert_Shade 1 | −6.6 | −4.8 | 8 | 0.001 *** |
| Cover | Ulo_Fert_Shade 1 -- Ulo_Norm_Shade 1 | 0.33 | 1.1 | 8 | 0.347 |
| Cover | Op_Fert_Shade 1 -- Op_Norm_Shade 1 | 3.89 | 3.0 | 8 | 0.017 ** |
| Cover | Ulo_Fert_Sun 1 -- Op_Fert_Sun 1 | −7.4 | −4.40 | 8 | 0.002 *** |
| Cover | Ulo_Fert_Sun 1 -- Ulo_Norm_Sun 1 | −1.2 | −0.53 | 8 | 0.61 |
| Cover | Op_Fert_Sun 1 -- Op_Norm_Sun 1 | 3.00 | 3.84 | 8 | 0.005 *** |
| Species | Ulo_Norm_Sun 1 -- Ulo_Fert_Sun 1 | 3.8 | 6.34 | 8 | 0.000 *** |
| Species | Op_Norm_Sun 1 -- Op_Fert_Sun 1 | −0.11 | −0.55 | 8 | 0.594 |
| Species | Ulo_Norm_Shade 1 --Ulo_Fert_Shade 1 | 10.78 | 7.07 | 8 | 0.000 *** |
| Species | Ulo_Norm_Shade 1 -- Op_Norm_Shade 1 | 3.11 | 3.18 | 8 | 0.013 ** |
| Species | Op_Norm_Shade 1 --Op_Fert_Shade 1 | 7.67 | 5.84 | 8 | 0.000 *** |
| Species | Ulo_Norm_Sun 1 -- Ulo_Fert_Sun 1 | 3.78 | 6.34 | 8 | 0.000 *** |
| Species | Ulo_Norm_Sun 1 -- Op_Norm_Shade 1 | 3.78 | 9.43 | 8 | 0.000 *** |
| Species | Op_Norm_Sun 1 -- Op_Fert_Sun 1 | −0.11 | 0.56 | 8 | 0.594 |
| Criteria | South Test Plots | x-Mean | SD | Kurtosis |
|---|---|---|---|---|
| Cover | Ulo_Norm 1 | 92.9 | 2.4 | −2.1 |
| Cover | Ulo_Fert 1 | 98.1 | 1.69 | −1.73 |
| Cover | Op_Norm 1 | 93.7 | 2.45 | −1.14 |
| Cover | Op_Fert 1 | 96.9 | 3.2 | 1.5 |
| Species | Ulo_Norm 1 | 13 | 1.7 | −0.008 |
| Species | Ulo_Fert 1 | 9 | 2.1 | −1.91 |
| Species | Op_Norm 1 | 12 | 1.1 | −1.14 |
| Species | Op_Fert 1 | 9 | 2.12 | −1.91 |
| Cover Sedum | Ulo_Norm 1 | 74 | 5.28 | −1.08 |
| Cover Sedum | Ulo_Fert 1 | 80 | 5.5 | −1.23 |
| Cover Sedum | Op_Norm 1 | 72 | 8.12 | 1.4 |
| Cover Sedum | Op_Fert 1 | 81 | 18.4 | −0.54 |
| Criteria | South Test Plot Pairs | Mean | T | df | Significance (2-Sided) |
|---|---|---|---|---|---|
| Cover | Ulo_Fert 1 -- Ulo_Norm 1 | 5.22 | −4.5 | 8 | 0.002 *** |
| Cover | Ulo_Fert 1 -- Op_Fert 1 | 1.22 | 1.4 | 8 | 0.194 |
| Cover | Op_Norm 1 -- Op_Fert 1 | −3.22 | −3.4 | 8 | 0.009 *** |
| Species | Ulo_Norm 1 -- Ulo_Fert 1 | 4.0 | 7.24 | 8 | 0.000 *** |
| Species | Ulo_Norm 1 -- Op_Norm 1 | 0.89 | 1.512 | 8 | 0.169 |
| Species | Op_Norm 1 -- Op_Fert 1 | 1.22 | 2.82 | 8 | 0.023 * |
| Cover Sedum | Ulo_Norm 1 --Ulo_Fert 1 | 5.67 | −3.44 | 8 | 0.009 *** |
| Cover Sedum | Ulo_Fert 1 -- Op_Fert 1 | −1.11 | −0.191 | 8 | 0.853 |
| Cover Sedum | Op_Norm 1 -- Op_Fert 1 | −8.89 | −1.53 | 8 | 0.164 |
| Test Plots | North-Shade | West_East- North-Sun | South—Extreme Dry Hot Conditions |
|---|---|---|---|
| Plant preferences | Grasses | Mix of various life forms | Sedum in many variation |
| Test Plots | Turf Mats | Sedum Cuttings |
|---|---|---|
| Investment | High | Low |
| Energy effort | High | Low |
| Maintenance duties | Irrigation first year | Irrigation first year |
| Vegetation coverage 60% | Immediately | After 2–3 years |
| Plant biodiversity, Year 1 | 25–29 | 9–14 |
| Plant biodiversity, Year 20 | 15–27 | 16–18 |
| CO2 fixation | High | Low |
Publisher’s Note: MDPI stays neutral with regard to jurisdictional claims in published maps and institutional affiliations. |
© 2021 by the authors. Licensee MDPI, Basel, Switzerland. This article is an open access article distributed under the terms and conditions of the Creative Commons Attribution (CC BY) license (http://creativecommons.org/licenses/by/4.0/).
Share and Cite
Köhler, M.; Kaiser, D. Green Roof Enhancement on Buildings of the University of Applied Sciences in Neubrandenburg (Germany) in Times of Climate Change. Atmosphere 2021, 12, 382. https://doi.org/10.3390/atmos12030382
Köhler M, Kaiser D. Green Roof Enhancement on Buildings of the University of Applied Sciences in Neubrandenburg (Germany) in Times of Climate Change. Atmosphere. 2021; 12(3):382. https://doi.org/10.3390/atmos12030382
Chicago/Turabian StyleKöhler, Manfred, and Daniel Kaiser. 2021. "Green Roof Enhancement on Buildings of the University of Applied Sciences in Neubrandenburg (Germany) in Times of Climate Change" Atmosphere 12, no. 3: 382. https://doi.org/10.3390/atmos12030382
APA StyleKöhler, M., & Kaiser, D. (2021). Green Roof Enhancement on Buildings of the University of Applied Sciences in Neubrandenburg (Germany) in Times of Climate Change. Atmosphere, 12(3), 382. https://doi.org/10.3390/atmos12030382