Article

Solar Climate Features Taking into Account the Morphometric Conditions of the Area and the Possibility of Using Them in Heliotherapy on the Example of the Cieplice and Kołobrzeg Health Resorts (Poland)

Institute of Geography, Kazimierz Wielki University, 85-064 Bydgoszcz, Poland
*
Author to whom correspondence should be addressed.
Atmosphere 2021, 12(3), 383; https://doi.org/10.3390/atmos12030383
Submission received: 28 January 2021 / Revised: 8 March 2021 / Accepted: 12 March 2021 / Published: 15 March 2021
(This article belongs to the Section Biometeorology)

Abstract

:
Global solar radiation is an important atmospheric stimulus affecting the human body and has been used in heliotherapy for years. In addition to environmental factors, the effectiveness of global solar radiation is increasingly influenced by human activity. This research was based on the use of heliographic and actinometric data (1996–2015) and the model distribution of global solar radiation to determine the possibility of heliotherapy with the example of two health resorts: Cieplice and Kołobrzeg (Poland). The solar features of health resorts (sunshine duration and global solar radiation) were characterized, and they were correlated with the spatial distribution of global solar radiation data obtained with the use of remote sensing techniques (System for Automated Geoscientific Analyzes-SAGA), including COoRdination and INformation on the Environment (CORINE) land cover (CLC) data. Using the maximum entropy model (MaxEnt), a qualitative and quantitative relationship between morphometric parameters and solar climate features was demonstrated for individual land cover types. Studies have shown that the period of late spring and summer, due to the climate’s solar features, is advisable for the use of heliotherapy. The human activity that determines the land cover is the main element influencing the spatial differentiation of the possibilities of using this form of health treatment. It also affects topographic indicators shown as significant in the MaxEnt predictive model. In general, areas with high openness were shown as predisposed for health treatment using global solar radiation, which is not consistent with areas commonly used for heliotherapy. The conducted research has shown the need for an interdisciplinary approach to the issue of heliotherapy, which will contribute to the optimization of the use of this form of health treatment from the perspective of climate change and human pressure.

1. Introduction

Solar energy is the overriding factor determining all aspects of life on Earth, starting with the photosynthesis process defined by J. Ingen-Housz in 1779 [1] and ending with the technology used in the production of clean energy [2]. The wavelength of solar radiation reaching the upper border of the Earth’s atmosphere ranges from about 0.2 to 4 μm. This range includes ultraviolet, visible, and infrared radiation [3]. Solar radiation reaches the surface of our planet in the form of a stream of direct and diffuse radiation, which together constitute global solar radiation [4,5]. The intensity of global radiation is influenced by several factors, mainly including latitude, time of year and day, terrain, and altitude, as well as the amount and type of cloud cover [6,7,8]. Apart from natural factors, human activity also influences the inflow of radiation to the Earth’s surface, e.g., shading from tall buildings or air pollution [9,10]. The sum of the time for which the direct solar radiation exceeds 120 W·m−2 is called sunshine duration [11]. The sum of actual sunshine duration depends mainly on the length of the day, the amount and type of cloud cover, and the horizon covering [12,13,14]. Also, the aerosol and water vapor concentration influence the sunshine duration, especially at low solar altitude.
The human body is influenced by every solar radiation range, but ultraviolet radiation is the most biologically active. The far-ultraviolet light (UVC, 0.20–0.29 µm) is entirely absorbed by the ozone layer, which also retains 90% of the mid-ultraviolet (UVB, 0.29–0.32 µm) [15]. Thus, the near-ultraviolet (UVA, 0.32–0.40 μm) and part of the mid-ultraviolet reach the Earth’s surface [16]. The share of ultraviolet radiation in the entire solar spectrum is small and amounts to an average of 4% at the Earth’s surface [17].
Ultraviolet radiation has a positive and negative effect on the human body. It stimulates the circulatory system and the activity of endocrine glands, destroys bacteria and microbes in the environment of people [18], initiates the synthesis of vitamin D in the human skin [19,20], which prevents rickets and osteoporosis, and plays a massive role in the human immune system [15]. However, too high doses of solar radiation can cause erythema, sunburn [21], the development of skin cancer, and eye diseases [15,22]. Sunbathing is essential to stay healthy, but the time of safe exposure to direct sunlight is essential, depending on skin pigmentation. Fitzpatrick [23] distinguished six types of skin, considering its sensitivity to the inflow of ultraviolet radiation. This classification is used worldwide to assess the risk of burns and skin cancer from excessive UV doses.
One of the forms of health treatment is heliotherapy, which is defined as treatment with natural sunlight exposure [24]. During sunbathing, the entire spectrum of solar radiation reaches the human body. As previously stated, the most biologically active is ultraviolet radiation, but the influence of visible and infrared radiation on the human body should not be overlooked. Visible radiation stimulates the nervous system and affects the endocrine system [25]. The effect of visible radiation on the functioning of the pineal gland, the gland that produces melatonin, has an impact on sleep patterns [13]. Appropriate dosing of visible radiation promotes the regulation of the body’s daily cycle and is also used in the treatment of depression [26]. Infrared radiation provides the body with thermal energy [13,25]. This range of solar radiation can penetrate deep into the body (up to 3 cm) and significantly improves the blood supply and tissue nutrition, as well as reduces muscle tension [26]. Infrared radiation can be used in the treatment of rheumatic diseases, limb injuries, chronic inflammation of the nasal cavity and paranasal sinuses, post-frostbite conditions, as well as overload syndromes of joints, tendons, and muscles [25,26]. During the First World War, sunlight therapy became known, and several hospitals and clinics were built with exposure to solar radiation in England and Germany [27,28]. Currently, sunbathing is used in the treatment of, among others: psoriasis [24,29,30,31,32,33,34,35,36,37], atopic dermatitis [35,38,39,40], acne vulgaris [38,41], as well as rickets, and other diseases associated with vitamin D deficiency [20,21,42,43]. In heliotherapy, the most important thing is the influence on the human body of the mid-ultraviolet light, whose biological activity is at a solar altitude >30° [13,44].
The research conducted in the field of remote sensing techniques has mainly included biometeorological and urban climate models [45,46,47], simple modeling of bioclimatic conditions using GIS software [48], estimation of radiation fluxes in complex-city structures [49,50] also taking into account the issues of urban heat islands (UHI) [51,52,53]. Long-term trends of solar radiation used satellite datasets were investigated for the Iberian Peninsula by Montero-Martin et al. [54], for the Baltic region by Lindfors et al. [55], and for the territory of Poland by Kulesza [56]. However, none of them analyzed in detail the relationship between the solar features of the climate and the morphometric conditions of the area with the possibility of using them in heliotherapy, which indicates the originality of the presented results.
The concept of health resorts is not understood in the same way in all countries—in many countries, such as Germany, Italy, Slovakia, and Austria, the operation of health resorts is based on the use of natural healing resources, primarily healing mineral waters, and is legally regulated [57,58]. In Germany, Austria, and Switzerland, apart from natural medicinal raw materials, health resorts’ assessment is also influenced by the climate [59]. In Poland, a health resort is defined as an area where health treatment is carried out and has been granted health resort status. According to the Act on health resort treatment, health resorts, and health resort protection areas and on health resort municipalities of 28 July 2005 [60], the status of a health resort may be granted to an area which meets all the following conditions: (i) has deposits of natural medicinal raw materials with proven medicinal properties; (ii) has a climate with healing properties confirmed on the terms specified in the Act; (iii) in its area there are health treatment facilities and health treatment equipment, prepared for the provision of health treatment; (iv) fulfill the environmental requirements specified in the environmental protection regulations; (v) has a technical infrastructure in the field of water and sewage management, energy, collective transport, and also conducts waste management. When assessing the climate of the area which is to be given the health resort status, the number of sunny hours, days with precipitation and fog are taken into account, as well as the frequency of occurrence of atmospheric stimuli that adversely affect the human body related to air temperature and humidity, wind, cloudiness, also the frequency of storms and weather changes [61]. For the conduct of heliotherapy in the health resorts, the standard for the annual total of hours with the sun is essential, which cannot be lower than 1500 [61].
The research aimed to demonstrate the relationship between the solar climate characteristics and the morphometry of the area on the example of two health resorts in terms of suitability for heliotherapy. The following was performed: (i) the solar radiation inflow in the annual and daily course for the period 1996–2015 was assessed based on actual heliographic and actinometric measurements; (ii) using SAGA software, the influence of morphometric conditions (coverage) on the inflow of solar radiation was determined; (iii) based on solar climate features, morphometric parameters significant for heliotherapy were demonstrated using the maximum entropy model; (iv) areas predisposed to heliotherapy were indicated.
The conducted research is important not only from the point of view of the organization of heliotherapy in already functioning health resorts but also opens a discussion on the need to search for new interdisciplinary and implementation research methods to identify future locations for heliotherapy.

2. Materials and Methods

2.1. Study Area

The research area consists of protection zones in two health resorts in Poland (Central Europe). Due to the availability of axonometric data, health resorts with morphometric diversification of protection zones were selected for the study: Cieplice located in the south of Poland—in the outskirts of the Karkonosze Mountains, and Kołobrzeg located in northern Poland—in the zone of the Baltic Sea quays. Cieplice is administratively part of Jelenia Góra and is a health resort district of this city. In the case of Kołobrzeg, the protection zone of the health resort coincides with the city’s administrative boundary. The digital elevation model (DEM) fluctuates respectively in the range of 333.2 m a.s.l. up to 456.8 m a.s.l for Cieplice and from 0.0 (the water level in the Baltic Sea) to 75.3 m a.s.l. for Kołobrzeg (Figure 1). The longitudinal length between the spas, amounting to 3°19′, determines the angle of incidence of sunlight in Cieplice, which is higher by this value throughout the year, and also affects the differences in the length of the day between health resorts. In Kołobrzeg, the first day of winter is 36 min shorter than in Cieplice, while the first day of summer is longer for the same time.
Cieplice is located in the foothill area, in the Jelenia Góra Valley, where the altitude above sea level and the topography significantly affect the climate. Due to the altitude (Figure 1a), the average air temperature, both in winter and summer, is relatively low and ranges from −2.2 °C in January to 16.3 °C in July [12]. Due to its location in a depression, the amount of frost days is significant, which in this health resort is on average 107 in a year [12]. Cieplice is located in the bioclimatic region of Sudetes, where, like the Carpathian Region, the sums of sunshine are slightly higher in the winter season and much lower in summer than in the other bioclimatic regions [13]. Kołobrzeg represents the climate of the western part of the Polish Baltic coast, where the sea’s influence determines relatively small annual fluctuations in air temperature. In the years 1951–2000, the average temperature in July was 16.8 °C, while in January, it was −0.4 °C [12]. Taking into account the division of Poland into bioclimatic regions, Kołobrzeg is located in the Seaside Region, where the radiation stimulus varies greatly throughout the year—in summer the sums of sunshine are the highest compared to other regions in Poland, while in winter the values are among the lowest [13].
In Poland, there is a relatively large variation in the annual sums of sunshine duration. The highest average annual values, calculated based on weather stations’ data, are characteristic for the eastern part of the Polish Baltic coast, exceeding 1800 h. Relatively high values are also found south of mentioned above area, up to the Silesian Lowland, as well as in the central-eastern part of Poland. The smallest annual sums of 1460–1500 h are characteristic of mountain areas located in Poland’s southern part [14]. For the spatial distribution of annual sums of solar radiation in Poland, the highest values, exceeding 4000 MJ·m−2, are characteristic for the Silesian Lowland, the Kielce Upland, the Nidziańska Basin, and the Lublin Upland. The smallest sums, of the order of 3600–3800 MJ·m−2, are found in the Pomeranian and Masurian Lake District, as well as in some mountain regions in southern Poland [62].
Health resorts are internally diversified in terms of types of land cover. According to COoRdination and INformation on the Environment (CORINE) Land Cover (CLC) database for 2018, several cover types were designated, respectively 8 for Cieplice and 11 for Kołobrzeg at the third (European) level nomenclature (Figure 1). In the case of Cieplice health resort, the largest area was occupied by non-irrigated arable land—2.1.1 type (6.52 km2). Whereas for the Kołobrzeg health resort, the dominant type of land cover was the discontinuous urban fabric—1.1.2 (8.70 km2). It should also be noted, for Kołobrzeg, the occurrence of the 5.2.3 type (0.27 km2) is associated with the zonal occurrence of the Baltic Sea.
Land cover, combined with morphometry, determined as the diversity of terrain relief, has a decisive influence on the sky visibility, sky view factor (SVF) [63], strongly related to the possibility of exposure to solar radiation. The average values of the index mentioned above were 0.780 in the case of Cieplice and 0.720 for Kołobrzeg.

2.2. Materials

2.2.1. Heliographic and Actinometric Data

The study included heliographic data (concerning sunshine duration) and actinometric data (concerning sums of solar radiation) from the meteorological station in Jelenia Góra (50°54′ N, 15°47′ E, 342 m a.s.l.) and Kołobrzeg (54°11′ N, 15°35′ E, 3 m a.s.l.). Both stations belong to the Institute of Meteorology and Water Management—National Research Institute, which performs the State Hydrological and Meteorological Service, performing tasks in the field of hydrological and meteorological protection of the society, environment, and economy [64]. The hourly sums of actual sunshine duration and global solar radiation for the years 1996–2015 were used. The sunshine duration values were published in hours to one decimal place, while the sums of solar radiation in J·cm−2, which were converted into kWh·m−2. At both weather stations, sunshine duration measurements from 1996 to 2014 were carried out using Campbell–Stokes sunshine recorders. In September 2014, these instruments were replaced by the CSD3 sunshine duration sensors from Kipp & Zonen B.V., which could affect the data’s homogeneity at the end of the research period. The global solar radiation measurements were made with the use of Kipp & Zonen B.V. pyranometers [65]. Ultraviolet radiation, which is important from the point of view of heliotherapy, has not been measured for the considered health resorts. There is a relationship between the intensity of global solar radiation and ultraviolet radiation described in several models [66,67,68]. However, the authors concluded that the impact on the human body of the entire spectrum of solar radiation and they limited themselves to the analysis of the value of global solar radiation and sunshine duration significantly influencing its possibility of conducting heliotherapy.

2.2.2. Digital Elevation Model

The basis for spatial analyses was a numerical model of land cover with 1 m × 1 m spatial resolution obtained from the Head Office of Geodesy and Cartography resources in Poland. Data in the form of ASCII XYZ GRID files in the national coordinate system “1992” were obtained.

2.2.3. Corine Land Cover Database

Land cover data were obtained from the resources of the Copernicus Land Monitoring Service (CLMS). The Coordination and Information on the Environment (CORINE) Land Cover (CLC) database for 2018 was used. It was decided to use the CORINE CLC data due to the only official source of land cover classification data applicable to all EU countries. Characteristics of CLC, e.g., land cover nomenclature, identification methodology, and quality of the data, are in the research of Feranec et al. [69]. CORINE CLC uses a minimum mapping unit (MMU) of 25 ha for area phenomena and a minimum width of 100 m for linear phenomena.

2.3. Methods

2.3.1. Processing Heliographic and Actinometric Data

Based on hourly sums of actual sunshine duration, average daily sums in particular months, as well as seasonal and annual sums, were calculated. The analysis of annual sums allowed for drawing of a trend line, the statistical significance of which was tested using the Student’s t-test, at the significance level p = 0.05. The average values of the relative sunshine duration in the consecutive days of the year were also calculated as a percentage ratio of the actual sunshine duration to the maximum possible sunshine duration. The maximum possible sunshine duration (in hours), which approximately corresponds to the length of the day, was calculated using the formula [2]:
S 0 = 2 15   cos 1 tan δ · tan φ ,
where δ is the declination of the sun and φ is the latitude.
Then, the annual course of average monthly values of relative sunshine duration was analyzed. The number of days for five classes of relative sunshine duration was also calculated, adopting the commonly used division proposed by Podstawczyńska [17], according to which the days were grouped with the following values: 0%—sunless days, 0.1–25%—cloudy days, 25.1–50%—moderately sunny days, 50.1–75%—sunny days, >75%—very sunny days. Moreover, the number of compact sunless periods of at least 5 days was determined by dividing them into four classes of lengths: 5–7 days, 8–10 days, 11–13 days, and 14–16 days.
Using the hourly sums of global solar radiation, the daily, monthly, and yearly sums were calculated. The multi-year variability of annual sums was analyzed, as well as the annual course of monthly mean global radiation sums. Selected statistical characteristics of monthly sums of global radiation, such as extreme values, standard deviation (SD), and coefficient of variation (CV), were calculated. Similar characteristics were calculated for the daily totals, supplemented with the skewness factor (A). To show the asymmetry of the distribution of values for the selected months, a histogram of daily sums of global radiation was made. The daily course of the hourly average global radiation sums was analyzed in June when the day is the longest, and the highest solar altitude is observed, and in December when the inflow of radiation is the lowest. The maximum height of the sun in the consecutive days of the year in both spas was also calculated using the formula [70]:
sin h = sin δ · sin φ + cos δ · cos φ · cos Θ ,
where h is the height of the sun, δ is the declination of the sun, φ is the latitude, and Θ is the hour angle of the sun.

2.3.2. Calculation of Potential Incoming Solar Radiation

Based on the provisions of the local law for Cieplice [71] and Kołobrzeg [72], with the usage of the open-source geographic information system software QuantumGIS (version 3.4.12), the digitization of the spatial extent of protection zones of health resorts was conducted. Using a tool (geoprocessing tool—Clip), the digital elevation model (DEM) was cropped to the survey area’s extent. Then, using the System for Automated Geoscientific Analyzes—SAGA software (version 2.3.2), the global solar radiation (in kWh·m−2) calculations for monthly periods were made using the Potential Incoming Solar Radiation tool. The time step of the model was 5 days, in 1-hour resolution for every time step period calculation. Apart from DEM, the parameters feeding the formula were: local sky view factor [63] with reference level from DTM altitude, including Solar Constant (1367 W·m−2), latitude location calculated from GRID system, a trace of the whole cell’s shadow, and Lumped Atmospheric Transmittance in 70%. The feed and output data corresponded to a resolution of 1 m × 1 m spatial resolution. The calculated data made it possible to determine global solar radiation’s spatial distribution within the health resorts. Considering the CORINE CLC data—chopped with the geoprocessing tools—Clip mentioned above, it was possible to determine the course of the average monthly global solar radiation sums for individual land cover types at the third (European) level nomenclature [73].

2.3.3. Maximum Entropy Model

To explore the spatial probability distribution of the solar features of the climate in terms of heliotherapy, we used the Maximum Entropy Method (MaxEnt) [74,75]. MaxEnt using a presence-only algorithm is suitability for research on habitat suitability and environmental modeling [76,77]. The preprocessing analysis was performed using the SAGA. In total, 25 indicators were derived from the DEM. However, only 4 of them were qualified for the final model’s input data after checking for autocorrelation (Table 1). The data feeding the model were the developed topographic parameters in ASCII grid format.
The MaxEnt results made it possible to determine each parameter’s contribution to the model in terms of the importance of the variable. The MaxEnt model is applied to predict the spatial distribution of occurrence probabilities describing the susceptibility of a particular location for solar characteristics of climate in terms of heliotherapy.
The validation process in MaxEnt subsists in analyzing the presences with the background points where the value of presence/absence is unknown. As pointed out in the research of Phillips et al. [81], these situations are titled pseudo-absences, and they are only selected to show the conditions in the study area. Change in the pseudo-absence sample size affects the MaxEnt model’s results regarding variable selection, prediction skills, and probability distribution. Using the Random points inside polygons in QuantumGIS software (version 3.4.12) tool, 30,000 pseudo-absences values were separated. Phillips and Dudík [75] proved that the number of 10,000 background points is sufficient to provide a good performance of the model. In our research, we use 3 times larger pseudo-absence sample to ensure correct calibration. Sample data corresponded to the CORINE CLC types identified in health resorts. We validate the MaxEnt model using randomly: a training sample of the presence data (80% of data) and a test sample of the presence data (20% of data). This process allows accepting sample variability and representativity at the validation time. Two methods were used: (i) cross-validation, where samples were divided into replicated folds and each fold was used in turns for the test data; and (ii) bootstrapping, where replicated sample sets, which were chosen by sampling with replacement fold, were used in turns for the test data. Datasets were replicated 10 times to estimate the stability of the models for every validation method.
The model results were validated with the receiver operator characteristics (ROC), also called the area under curve (AUC), to evaluate predictive efficiency. The AUC integral plots allow a single measurement of model output [82], in the values range from 0.5 (randomness) to 1.0 (predictability). In our research, we modify the AUC values classification of Hosmer and Lemeshow [83] to a poor (AUC < 0.5), an acceptable (0.5 < AUC < 0.75), and an excellent (AUC > 0.75) prediction.

3. Results

3.1. Analysis of Heliographic and Actinometric Data

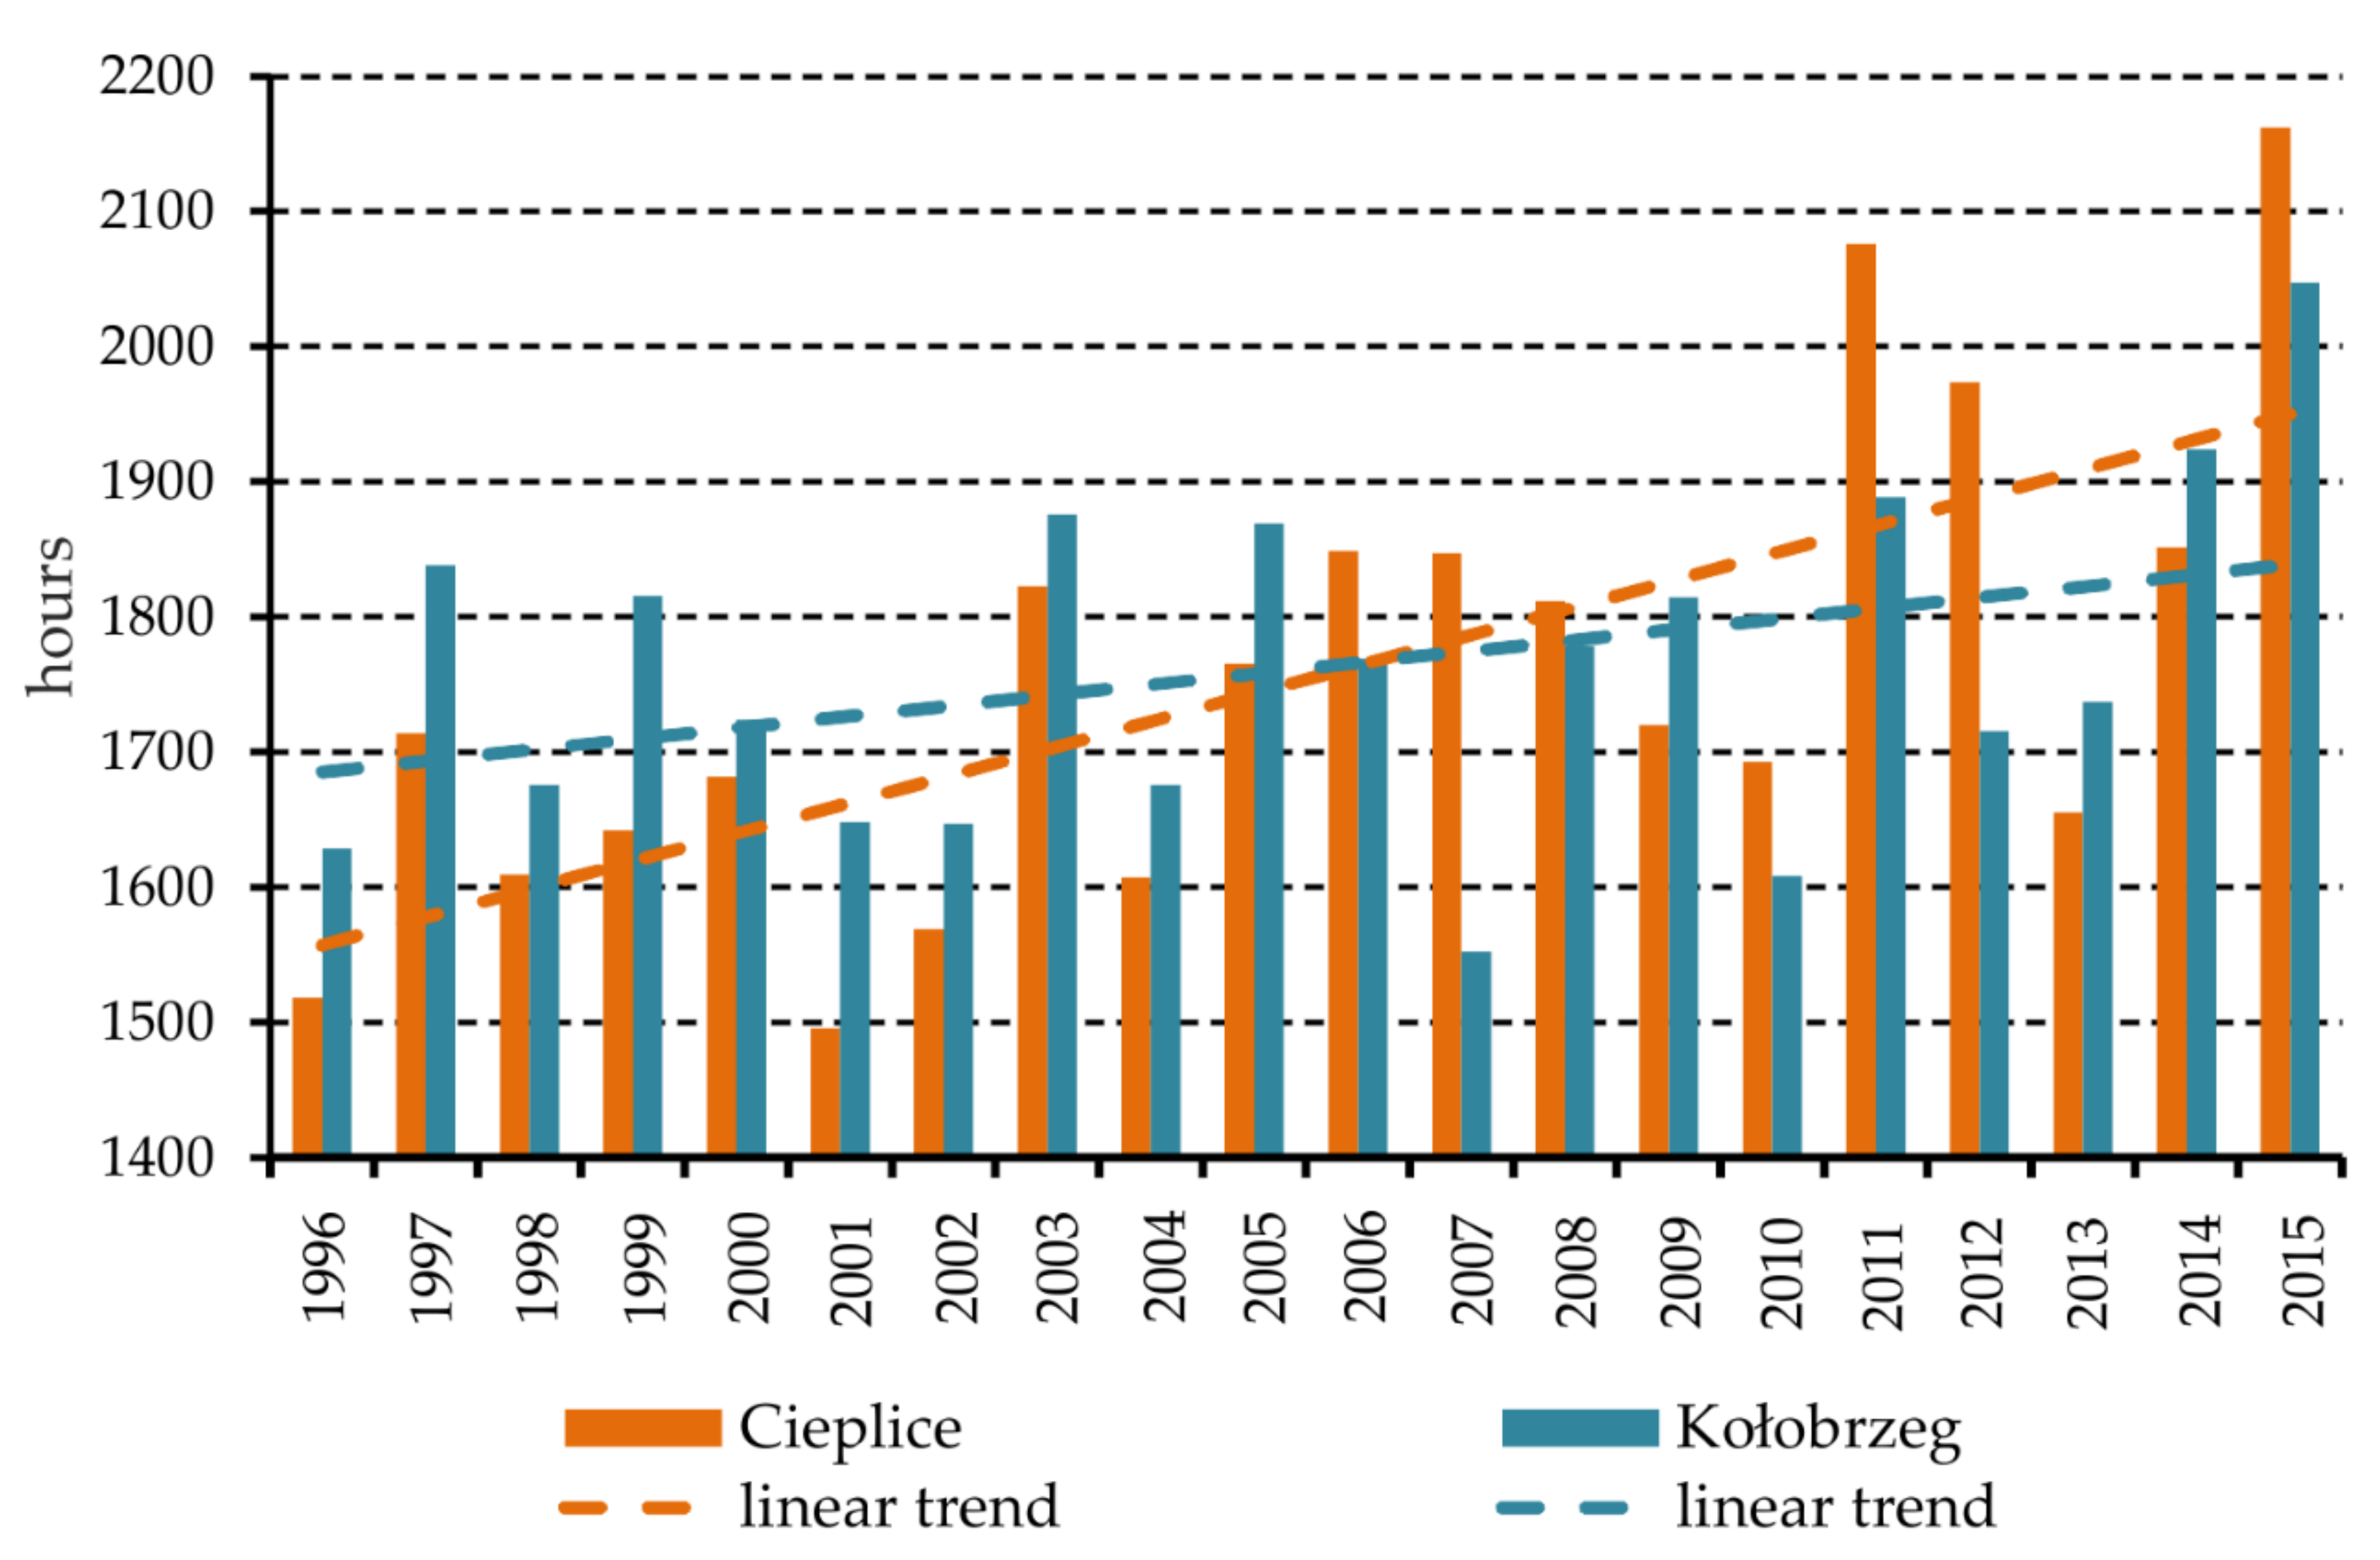
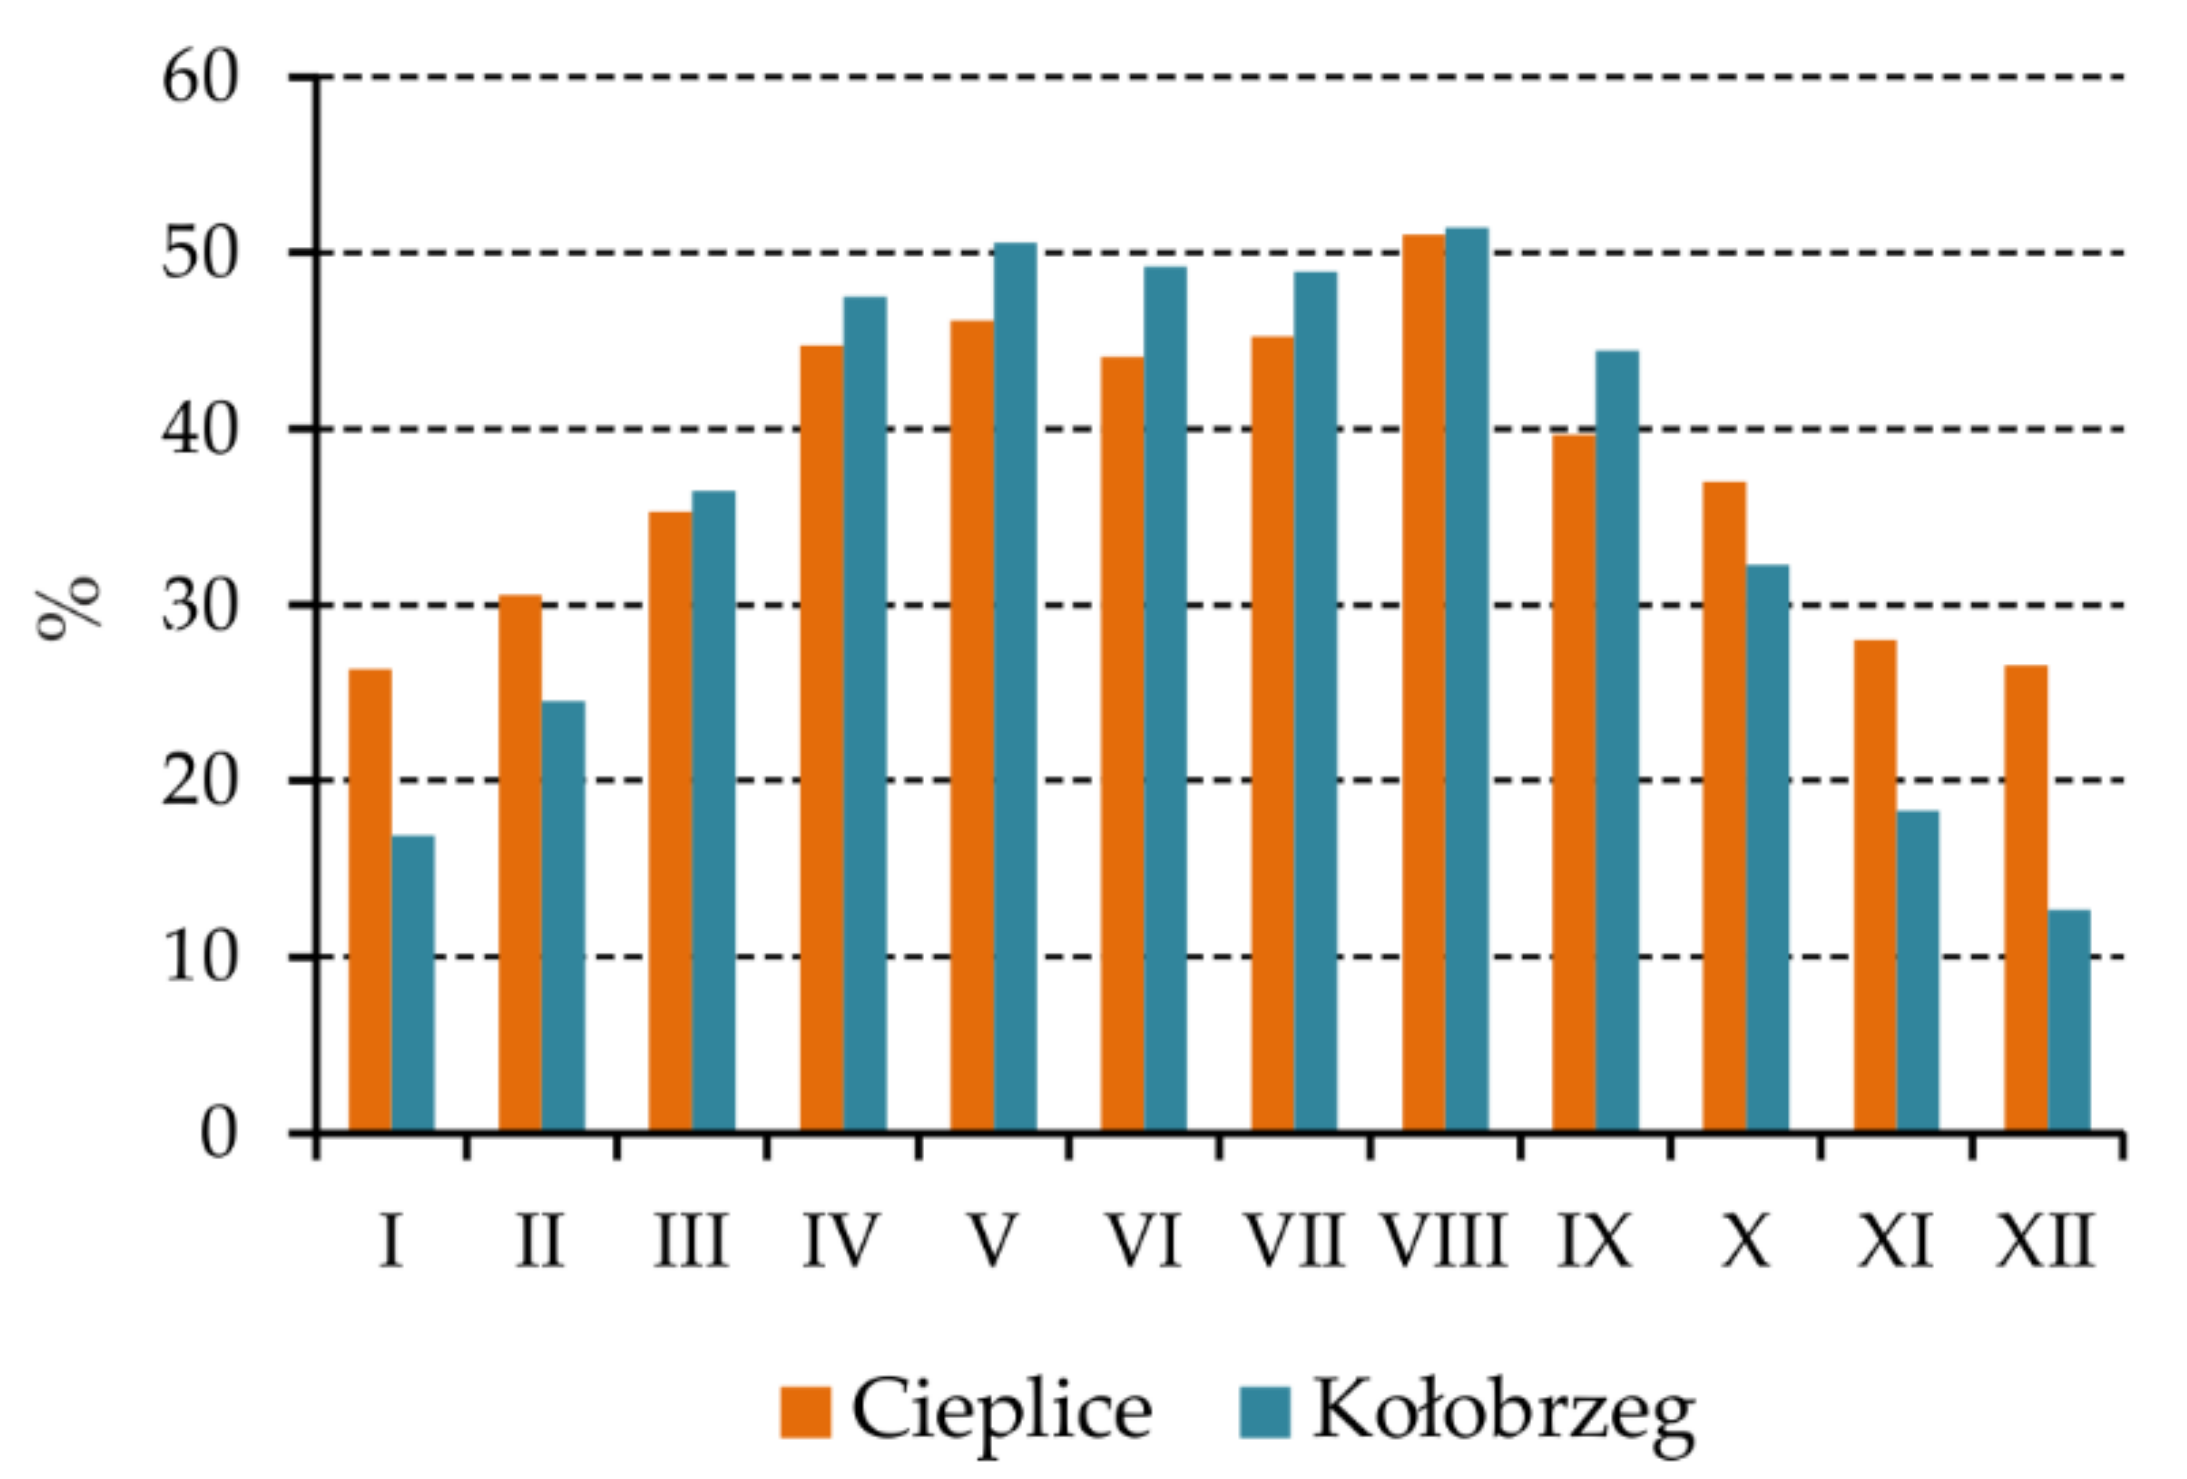
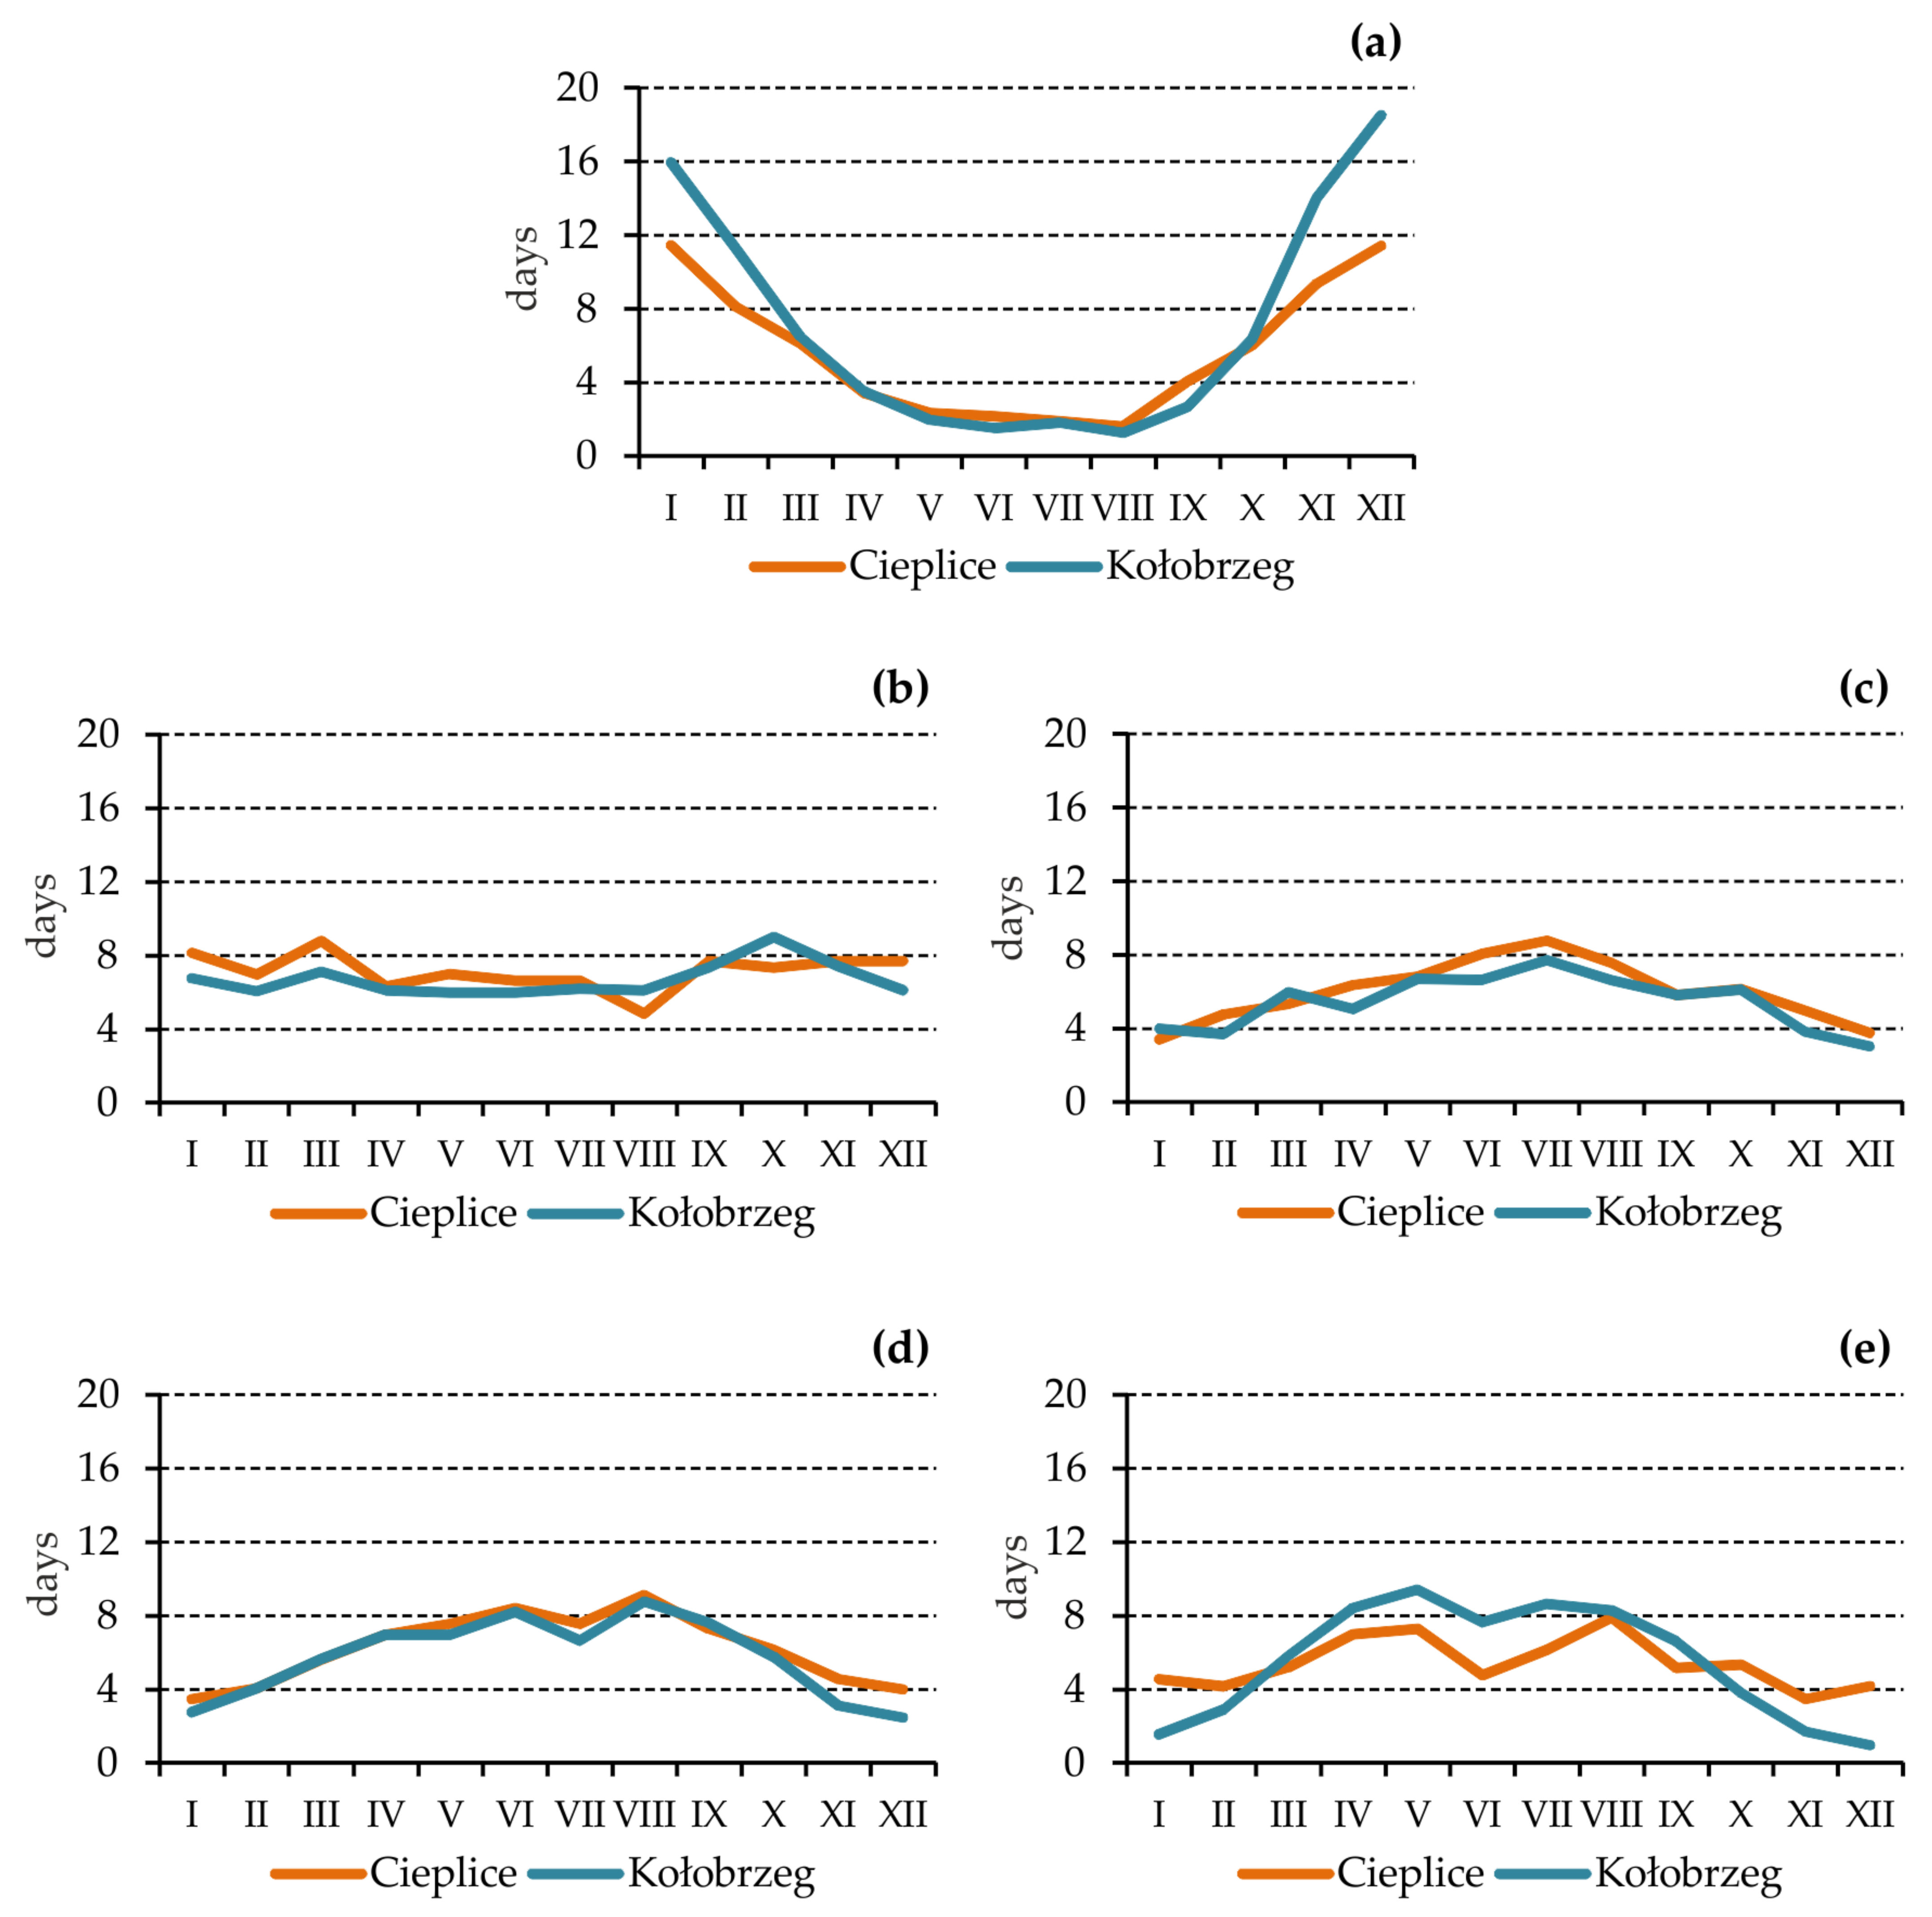
3.1.1. Actual and Relative Sunshine Duration in Cieplice and Kołobrzeg in the Years 1996–2015

In the years 1996–2015, the annual sums of actual sunshine duration in Cieplice ranged from 1495.4 h in 2001 up to 2162.4 h in 2015 (Figure 2), and the difference between the extreme values is 667 h. Only once the annual sum of sunshine duration was less than 1500 h, and in two years, it exceeded the value of 2000 h. A statistically significant growing trend was demonstrated for Cieplice in the analyzed twenty years. The average annual sum of sunshine duration for this health resort was 1753.3 h and is slightly lower than in Kołobrzeg (1761.7 h). In a seaside health resort, the difference between extreme annual sums is smaller and amounts to less than 495 h. The maximum value occurred in 2015 (2047.4 h) and the minimum value in 2007 (1552.7 h).
In the annual course, the highest sums of actual sunshine duration occur in summer and spring (Figure 3). The total amount of hours with sunshine in summer and spring in Cieplice is on average 68% of the annual total, while in Kołobrzeg, it is over 74%. The sums of actual sunshine duration in winter are very small, especially in Kołobrzeg, where direct sunlight reaches the Earth’s surface for only 135 h on average, which is less than 8% of the annual total.
The very uneven inflow of direct solar radiation to the ground during the year is shown by analyzing the annual course of the average daily sums of actual sunshine duration (Figure 4). In Cieplice, the highest daily totals occur in August (on average 7.3 h), but the values exceeding 7 h are also characteristic of May, June, and July. The lowest daily totals are observed in December and January when the time of inflow of direct solar radiation during the day only slightly exceeds 2 h. In Kołobrzeg, the range of daily total fluctuations in the annual course is greater than in Cieplice. In the months from May to July, the average daily totals are about 8 h (maximum in June, 8.3 h). In Kołobrzeg, the sums of the actual sunshine duration fewer than 2 h occured from November to January with a minimum in December (only 0.9 h).
Values of relative sunshine duration in Cieplice and Kołobrzeg are relatively low. In Cieplice, only in August did the relative sunshine duration exceed 50% (Figure 5). In Kołobrzeg, values of up to 50% or more occured from April to August. In turn, in the months from November to February, the relative sunshine duration reached the lowest values. In the months mentioned above, this indicator is significantly higher in the Cieplice health resort than in Kołobrzeg. The differences between Cieplice and Kołobrzeg are particularly large in December when the relative sunshine duration in these health resorts amounts to 26.6% and 12.7%, respectively.
From November to January, sunless days in Kołobrzeg account for about half of the days a month, and in December, their number exceeds 18 (Figure 6a). In the months from November to March, both spas may experience longer, at least five-day periods of sunlessness (Table 2 and Table 3), and the highest number is observed in December. The total number of all sunless periods is twice as high in Kołobrzeg as in Cieplice. In November, there was even a fifteen-day sunless period in the seaside health resort. No sunless periods longer than nine days were observed in Cieplice. In the course of the year, the number of cloudy days in both spas was very similar (Figure 6b), usually in the range of 6–8 days. Sunless days are rare from May to August, with an average of 1 to 2 such days. In the months from April to September, the frequency of sunny days (Figure 6d) and very sunny days (Figure 6e) was significantly greater. In Kołobrzeg, such days make up about half of all days in this period of the year. Compared to Cieplice, Kołobrzeg is distinguished by a significantly greater number of very sunny days in this period of the year, especially from May to July.

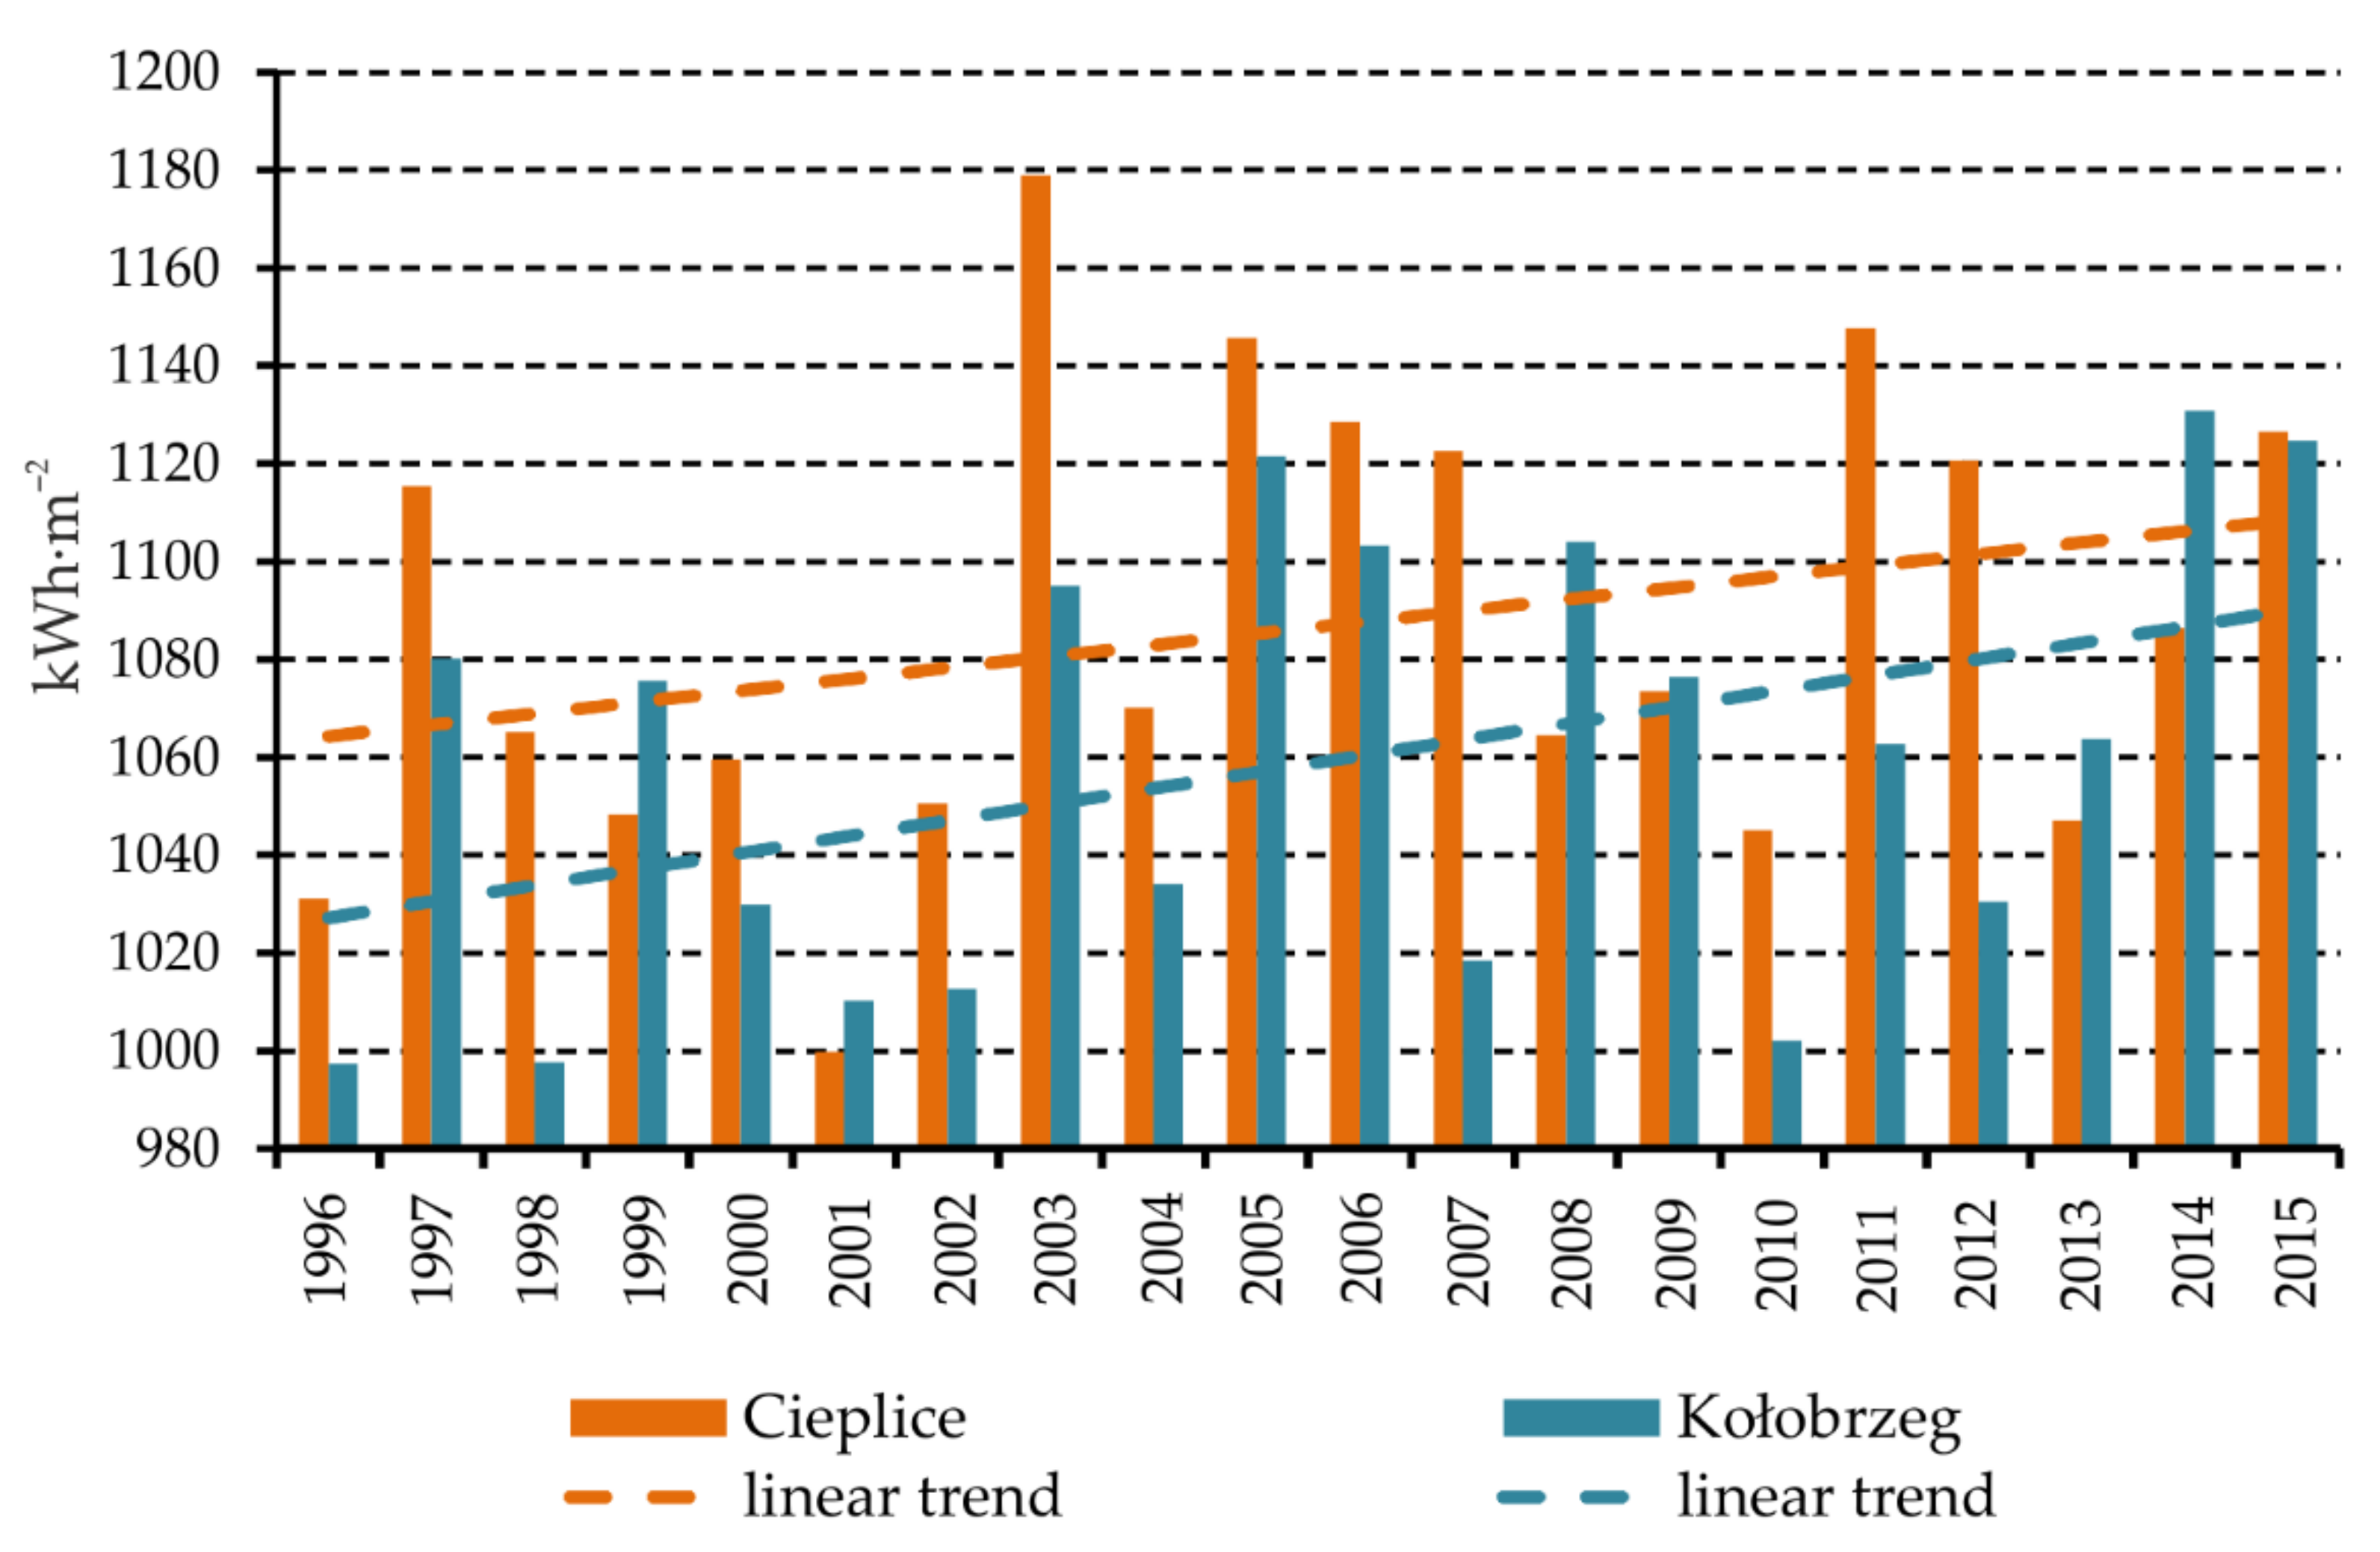
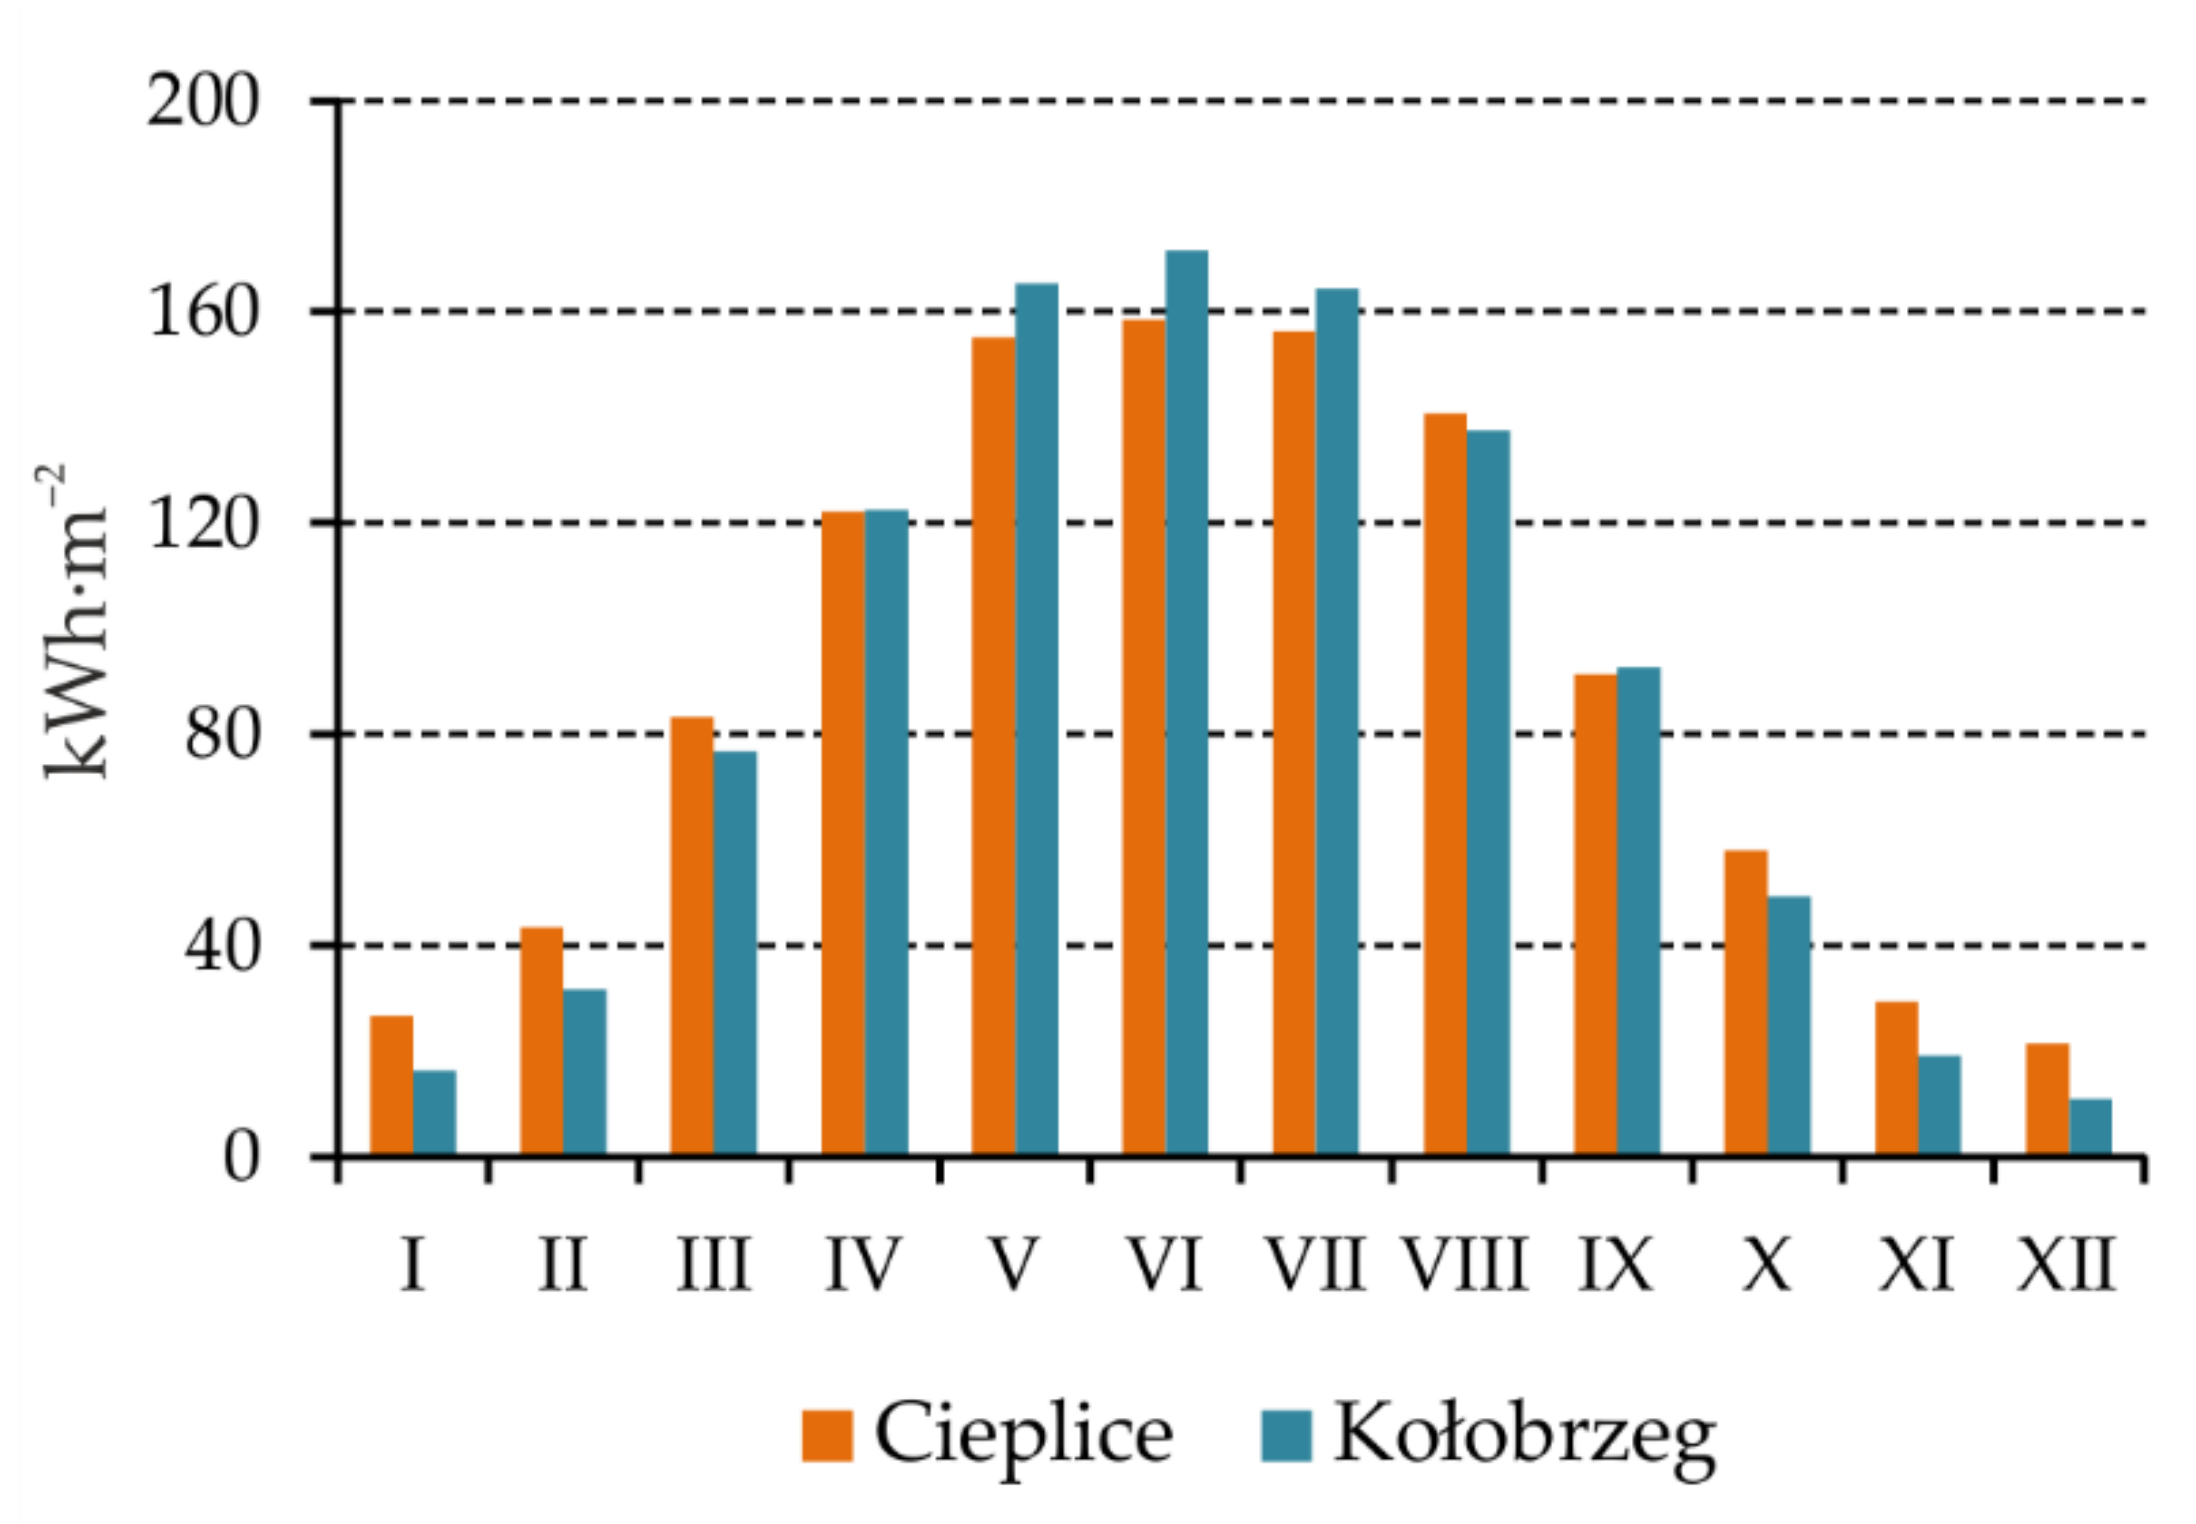
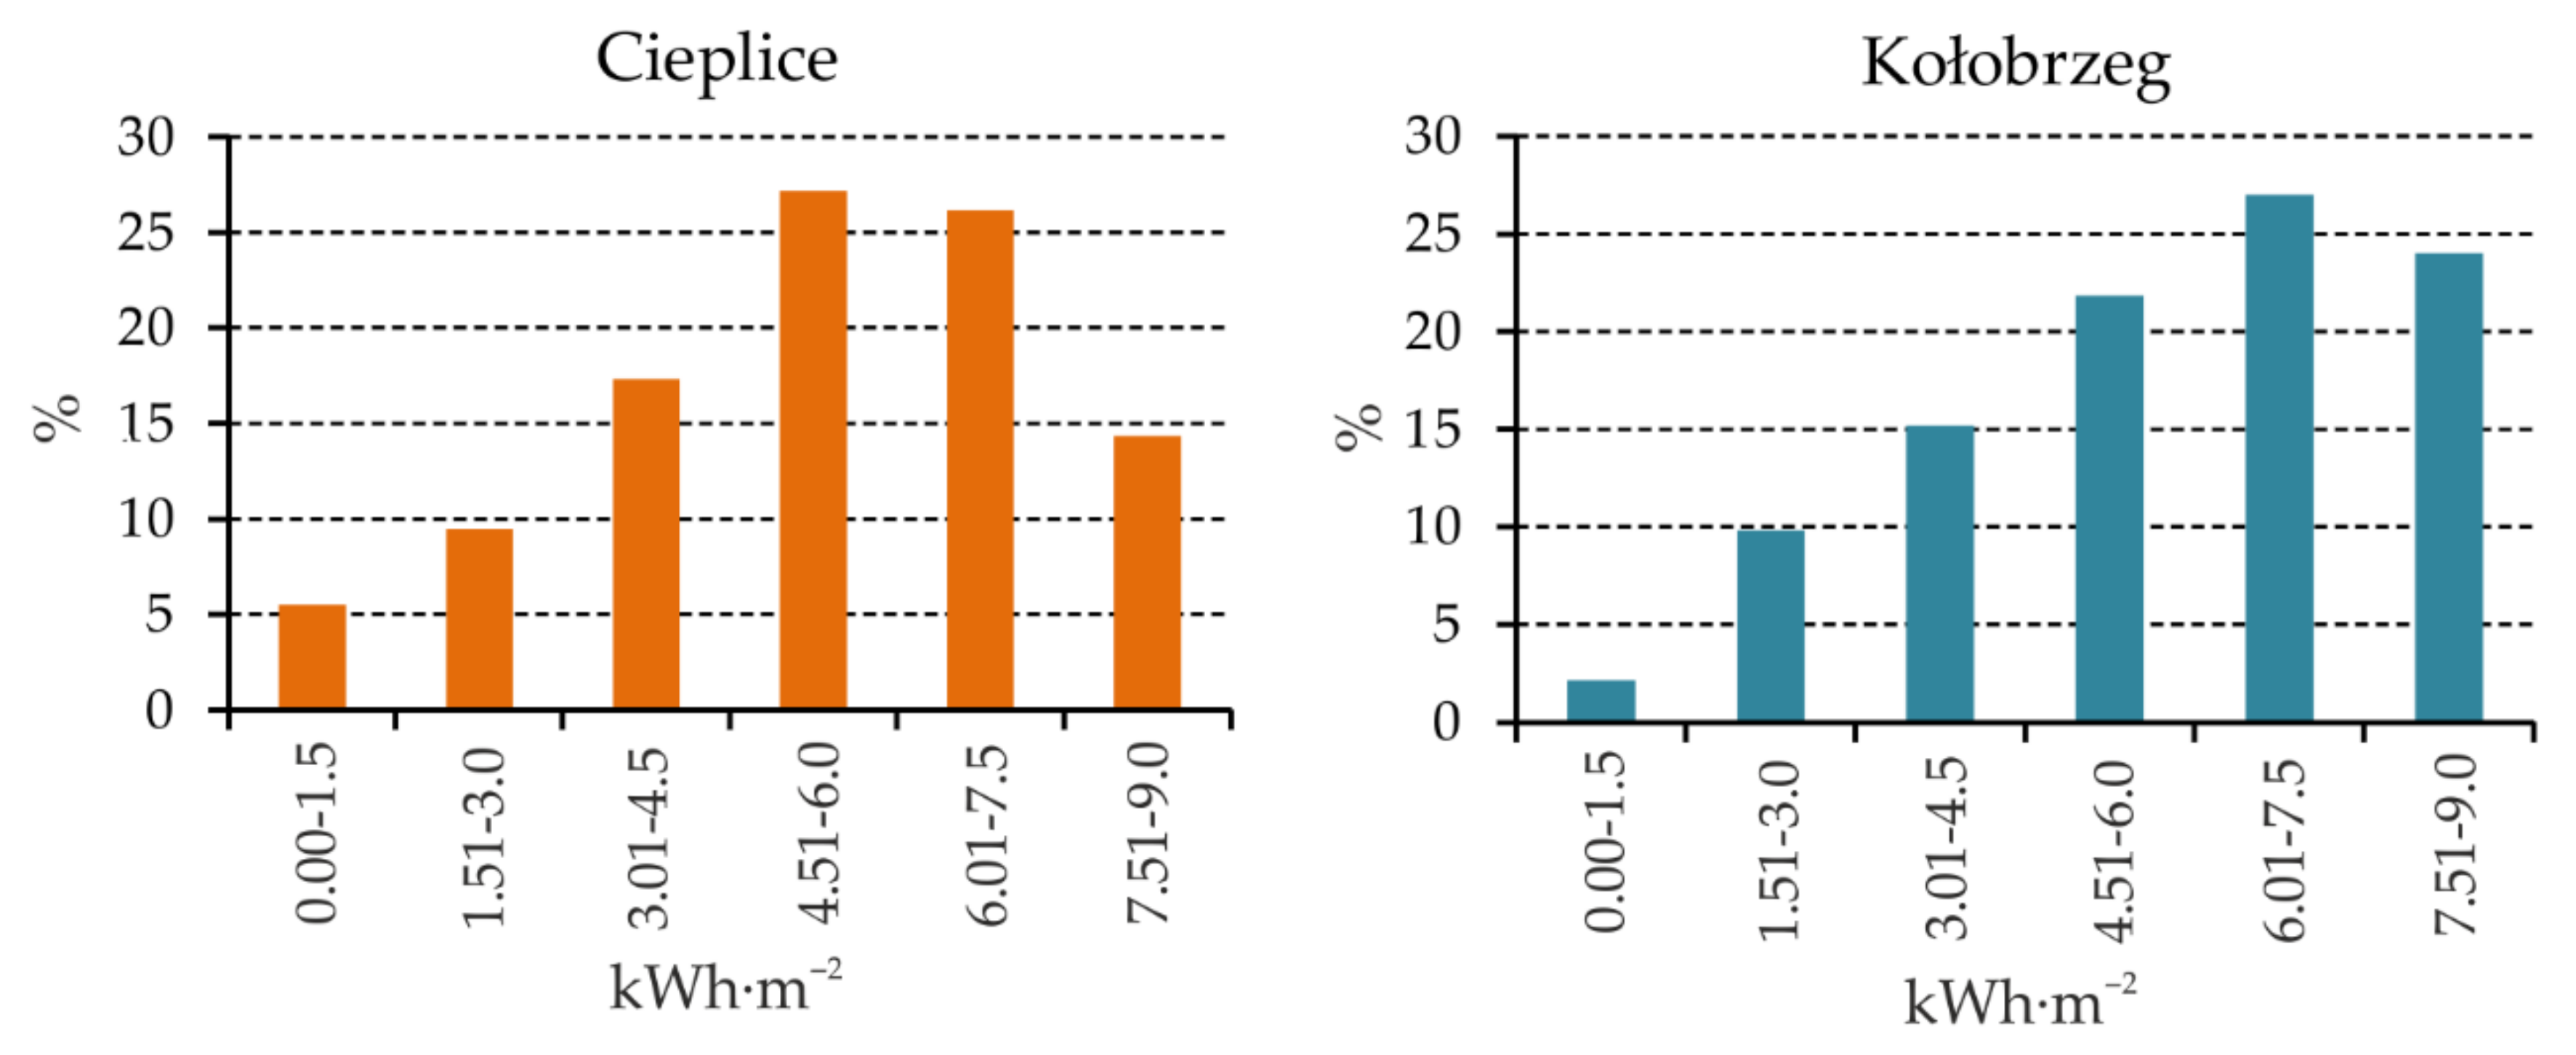
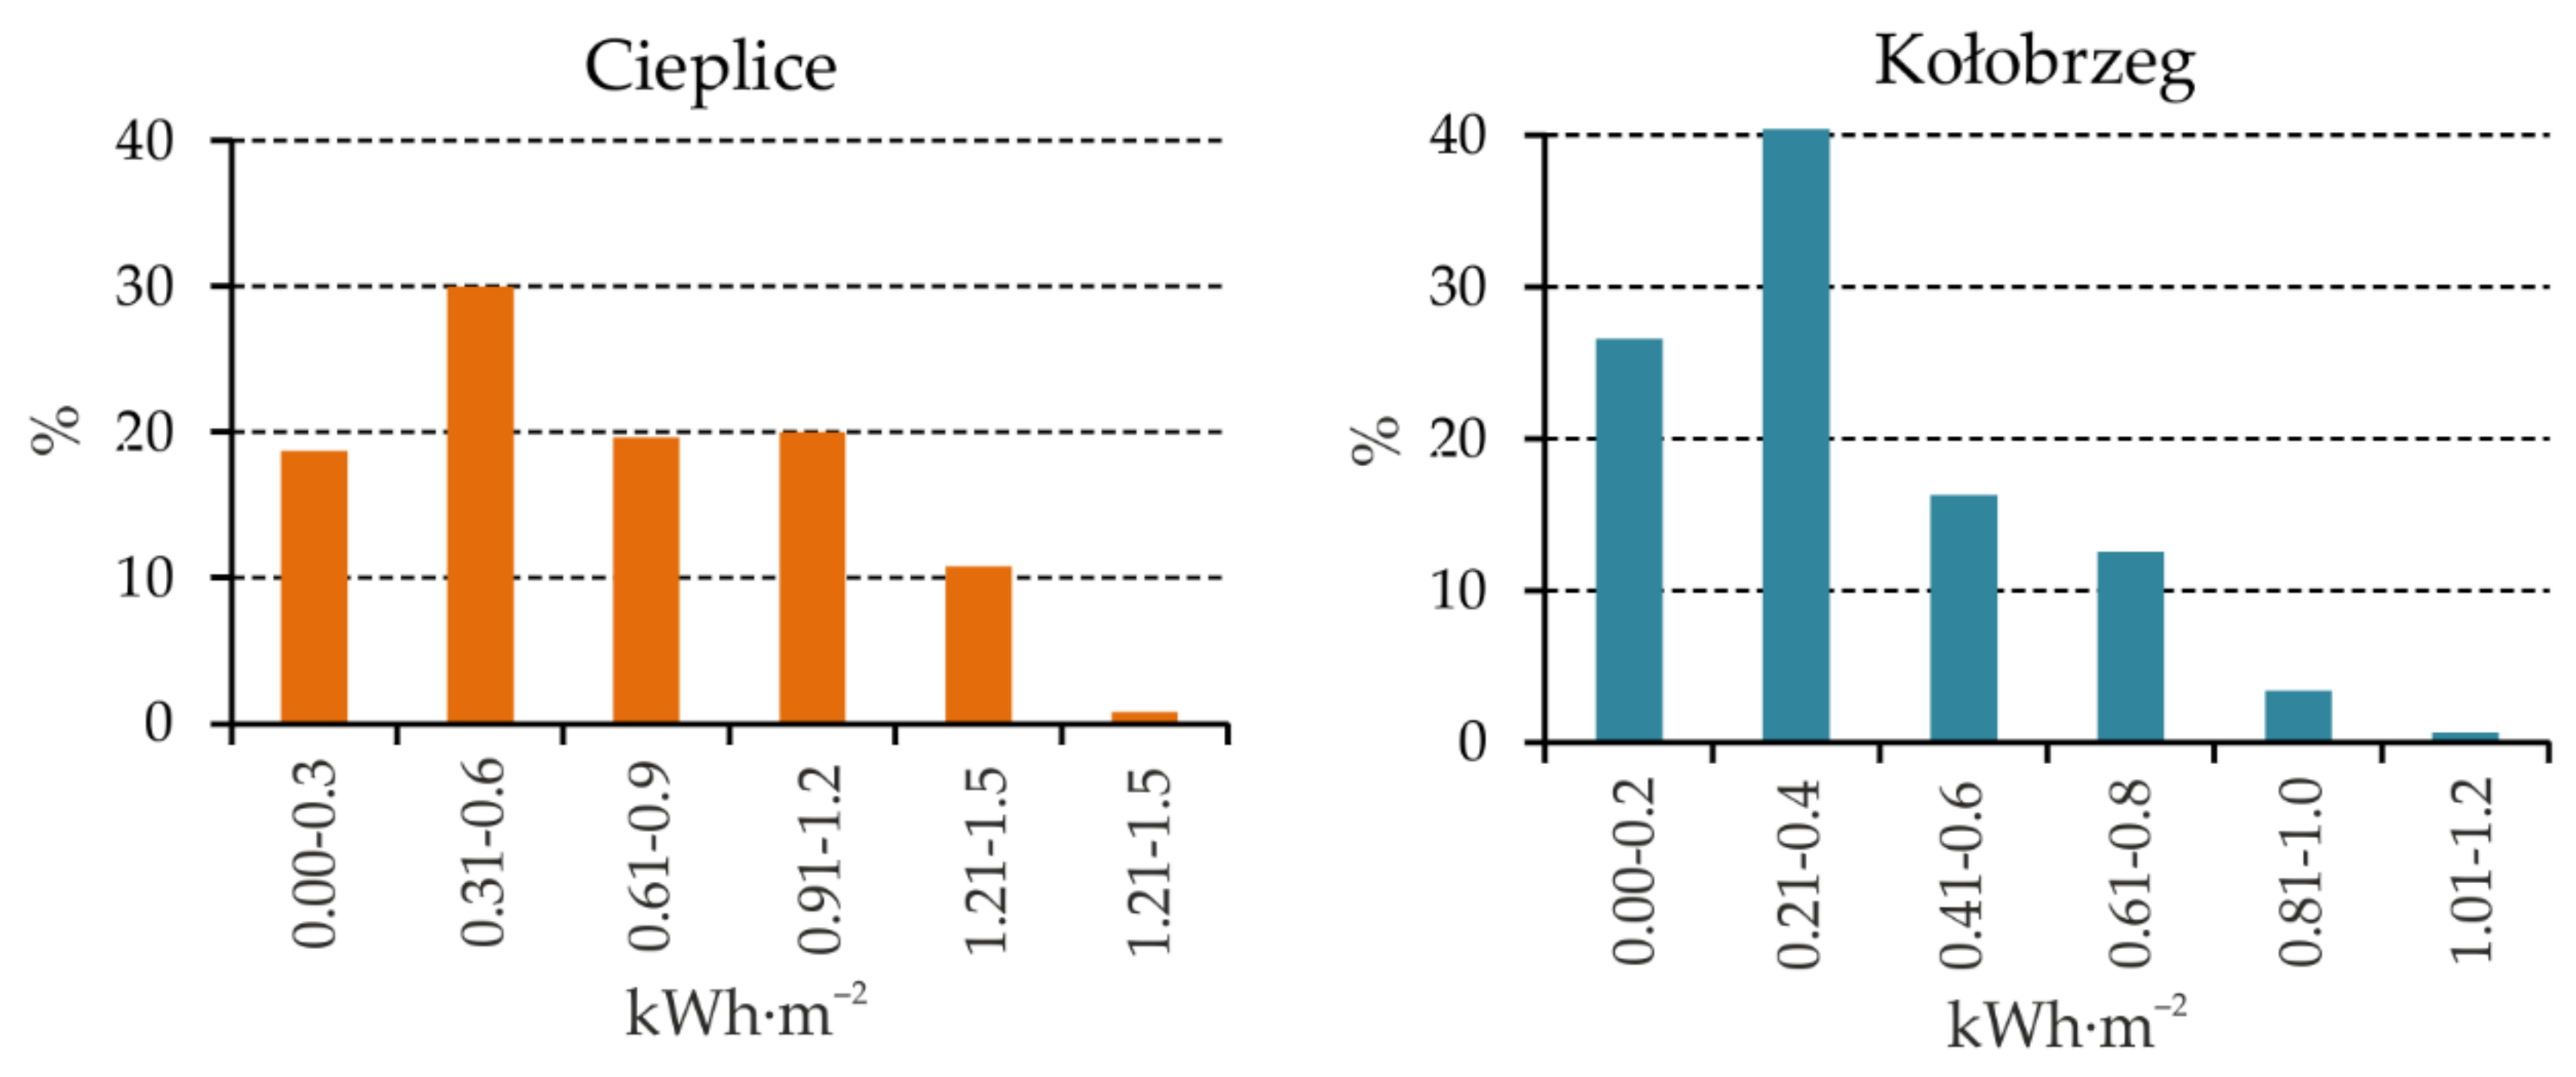
3.1.2. Global Solar Radiation in Cieplice and Kołobrzeg in the Years 1996–2015

The average annual sum of global radiation in Cieplice is 1086.4 kWh·m−2, and the range of annual sums fluctuations in 1996–2015 did not exceed 180 kWh·m−2. In Kołobrzeg, the average annual value is lower and amounts to 1058.5 kWh·m−2. In this health resort, the annual sums range from about 997.3 kWh·m−2 in 1996 to almost 1130.8 kWh·m−2 in 2014. A statistically insignificant growing trend was noted in both health resorts in the analyzed twenty years (Figure 7).
In the annual course, the highest monthly sums of global radiation occur in June and amount to approximately 170 kWh·m−2 in Kołobrzeg and over 158 kWh·m−2 in Cieplice (Figure 8). Higher values in Kołobrzeg than in Cieplice persist from April to September, when Kołobrzeg has a longer day, and more often, there are very sunny days. In Kołobrzeg, the sum of global radiation from these months accounts for almost 81% of the annual total, while in Cieplice, about 76%. In the months from April to September, there are large differences between the maximum monthly amounts and the minimum amounts (Table A1) in both health resorts. The standard deviation’s large values also show that the monthly sums observed from year to year in the warm half-year are highly differentiated. The lowest monthly sums of global radiation are characteristic for December, when the average sum in Cieplice is over 21 kWh·m−2, while in Kołobrzeg, it is twice as low and does not exceed 11 kWh·m−2. Average monthly sums in Kołobrzeg are lower than in Cieplice in the whole cold half-year. During this period of the year, the days in Kołobrzeg are shorter than in southern Poland, and the number of sunless days is also significantly greater.
Average daily sums of global radiation in Cieplice range from 0.69 kWh·m−2 in December to 5.28 kWh·m−2 in June. Greater diversification of daily sums in the annual course is observed in Kołobrzeg, where in December the average sum is 0.35 kWh·m−2, while in June it increases to 5.72 kWh·m−2 (Table A2) Both in Cieplice and Kołobrzeg, there is a large variation from day to day in the sums of global radiation. The maximum daily totals are many times greater than the minimum totals. The high variability of the daily sums of global radiation is evidenced by the significant values of the coefficient of variation (percentage of the standard deviation in the average value of a given series), which in the cold half-year in Cieplice are in the range of 50%–56%. An even greater variance occurs in Kołobrzeg, where in the months from November to February, the values exceed 60%. It is due to the high variability of the amount of cloud cover in the months of the cold half-year, which is determined by the circulation factors. In both health resorts, the skewness coefficient values in the months from April to September are negative, which proves the left-hand asymmetry of the distribution (extended left arm of the distribution). Such a distribution is characterized by the grouping of values in ranges with values higher than the average, it is visible on the example of the histogram of daily sums of global radiation in June (Figure 9). The left-hand asymmetry in Kołobrzeg is clearly greater than in Cieplice in the months from April to July. In the cold half-year, the skewness coefficient values are positive, which indicates a right-skewed distribution and grouping of values in ranges with values below the average. An example is a histogram of daily sums of global radiation in December (Figure 10). In the months from October to February, the skewness coefficient values are higher in Kołobrzeg compared to Cieplice.
The daily course of the hourly sums of global radiation in June and December shows a substantial variation in values (Figure 11) conditioned by the height of the sun, the length of the day, and the amount of sky cloud cover. In June, solar radiation’s inflow begins in the early morning hours and ends around 9:00 p.m. The highest values at noon in Kołobrzeg are about 0.6 kWh·m−2. In this health resort, despite the lower altitude of the Sun (Figure 12), slightly higher values are noted in the diurnal course, associated with less cloudiness in this month. In December, the inflow of solar radiation lasts much shorter, and the hourly sums of global radiation are minimal, especially in Kołobrzeg. In this town, at the end of December, the height of the sun at noon only exceeds 12° (Figure 12), and there is a greater proportion of sunless days there than in Cieplice. In a seaside health resort in December, even in the afternoon hours, global radiation sums are lower than 0.1 kWh·m−2.

3.2. Morphometric—Bioclimatic Analyses

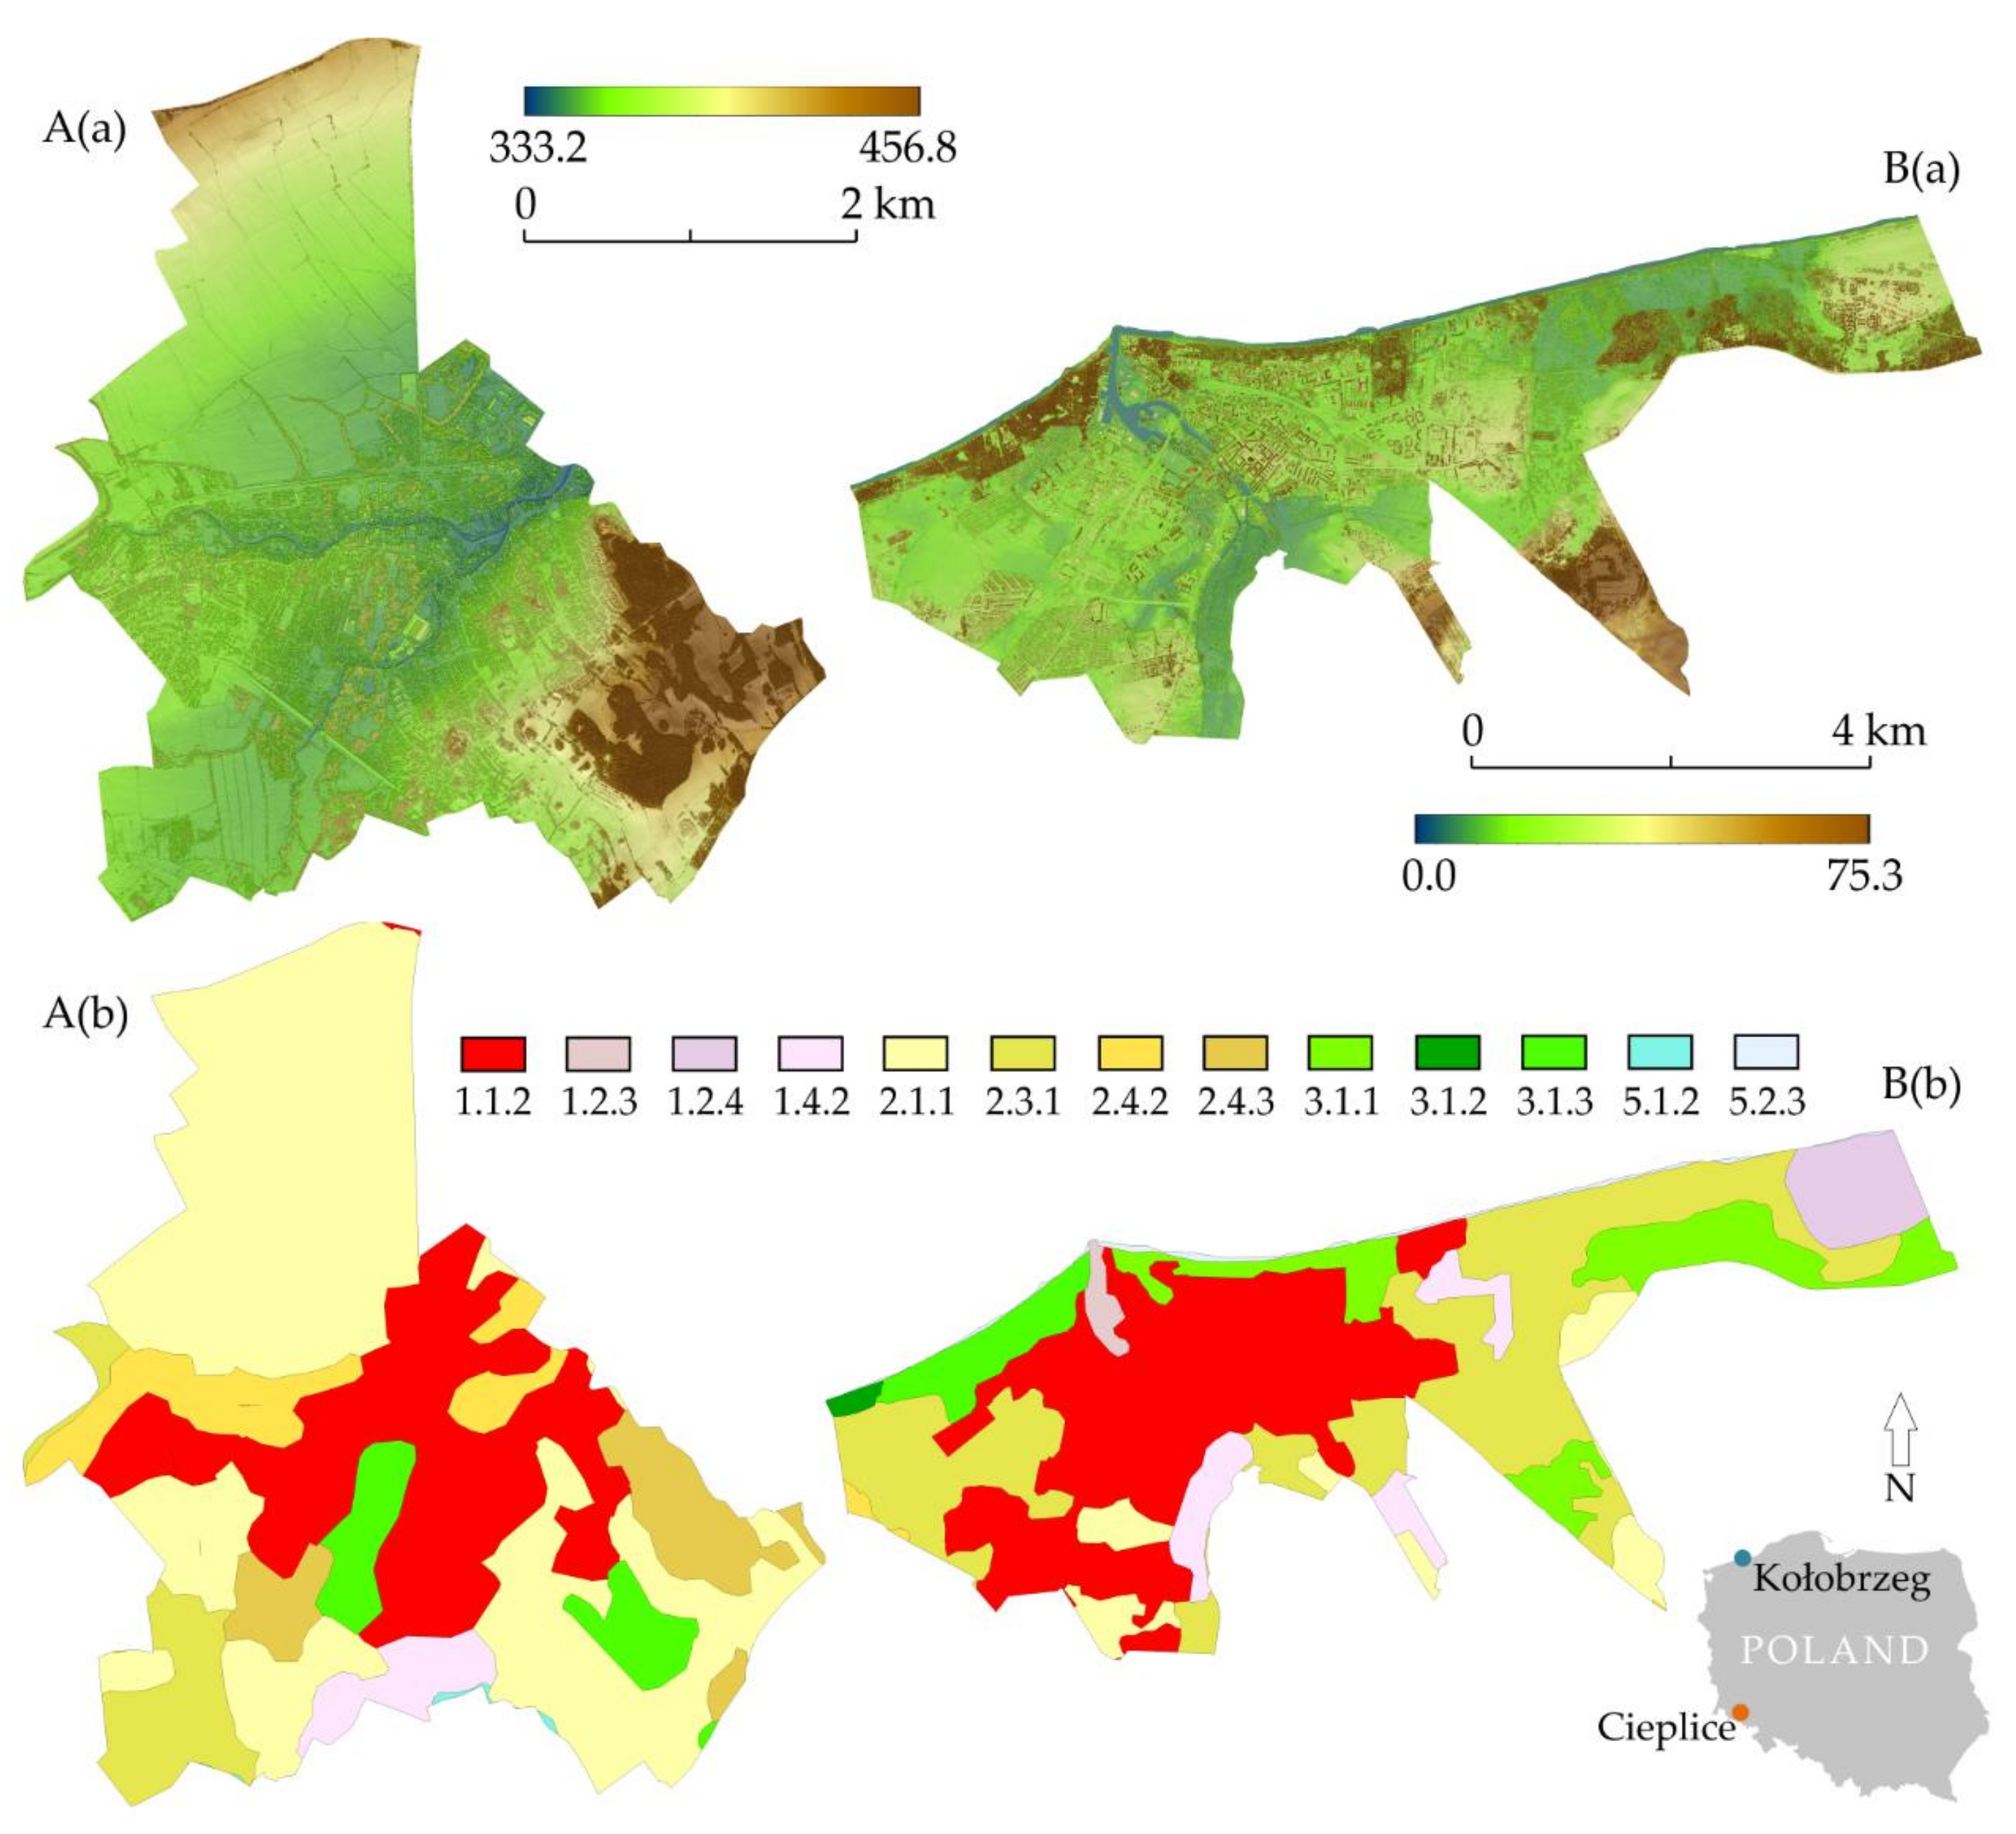
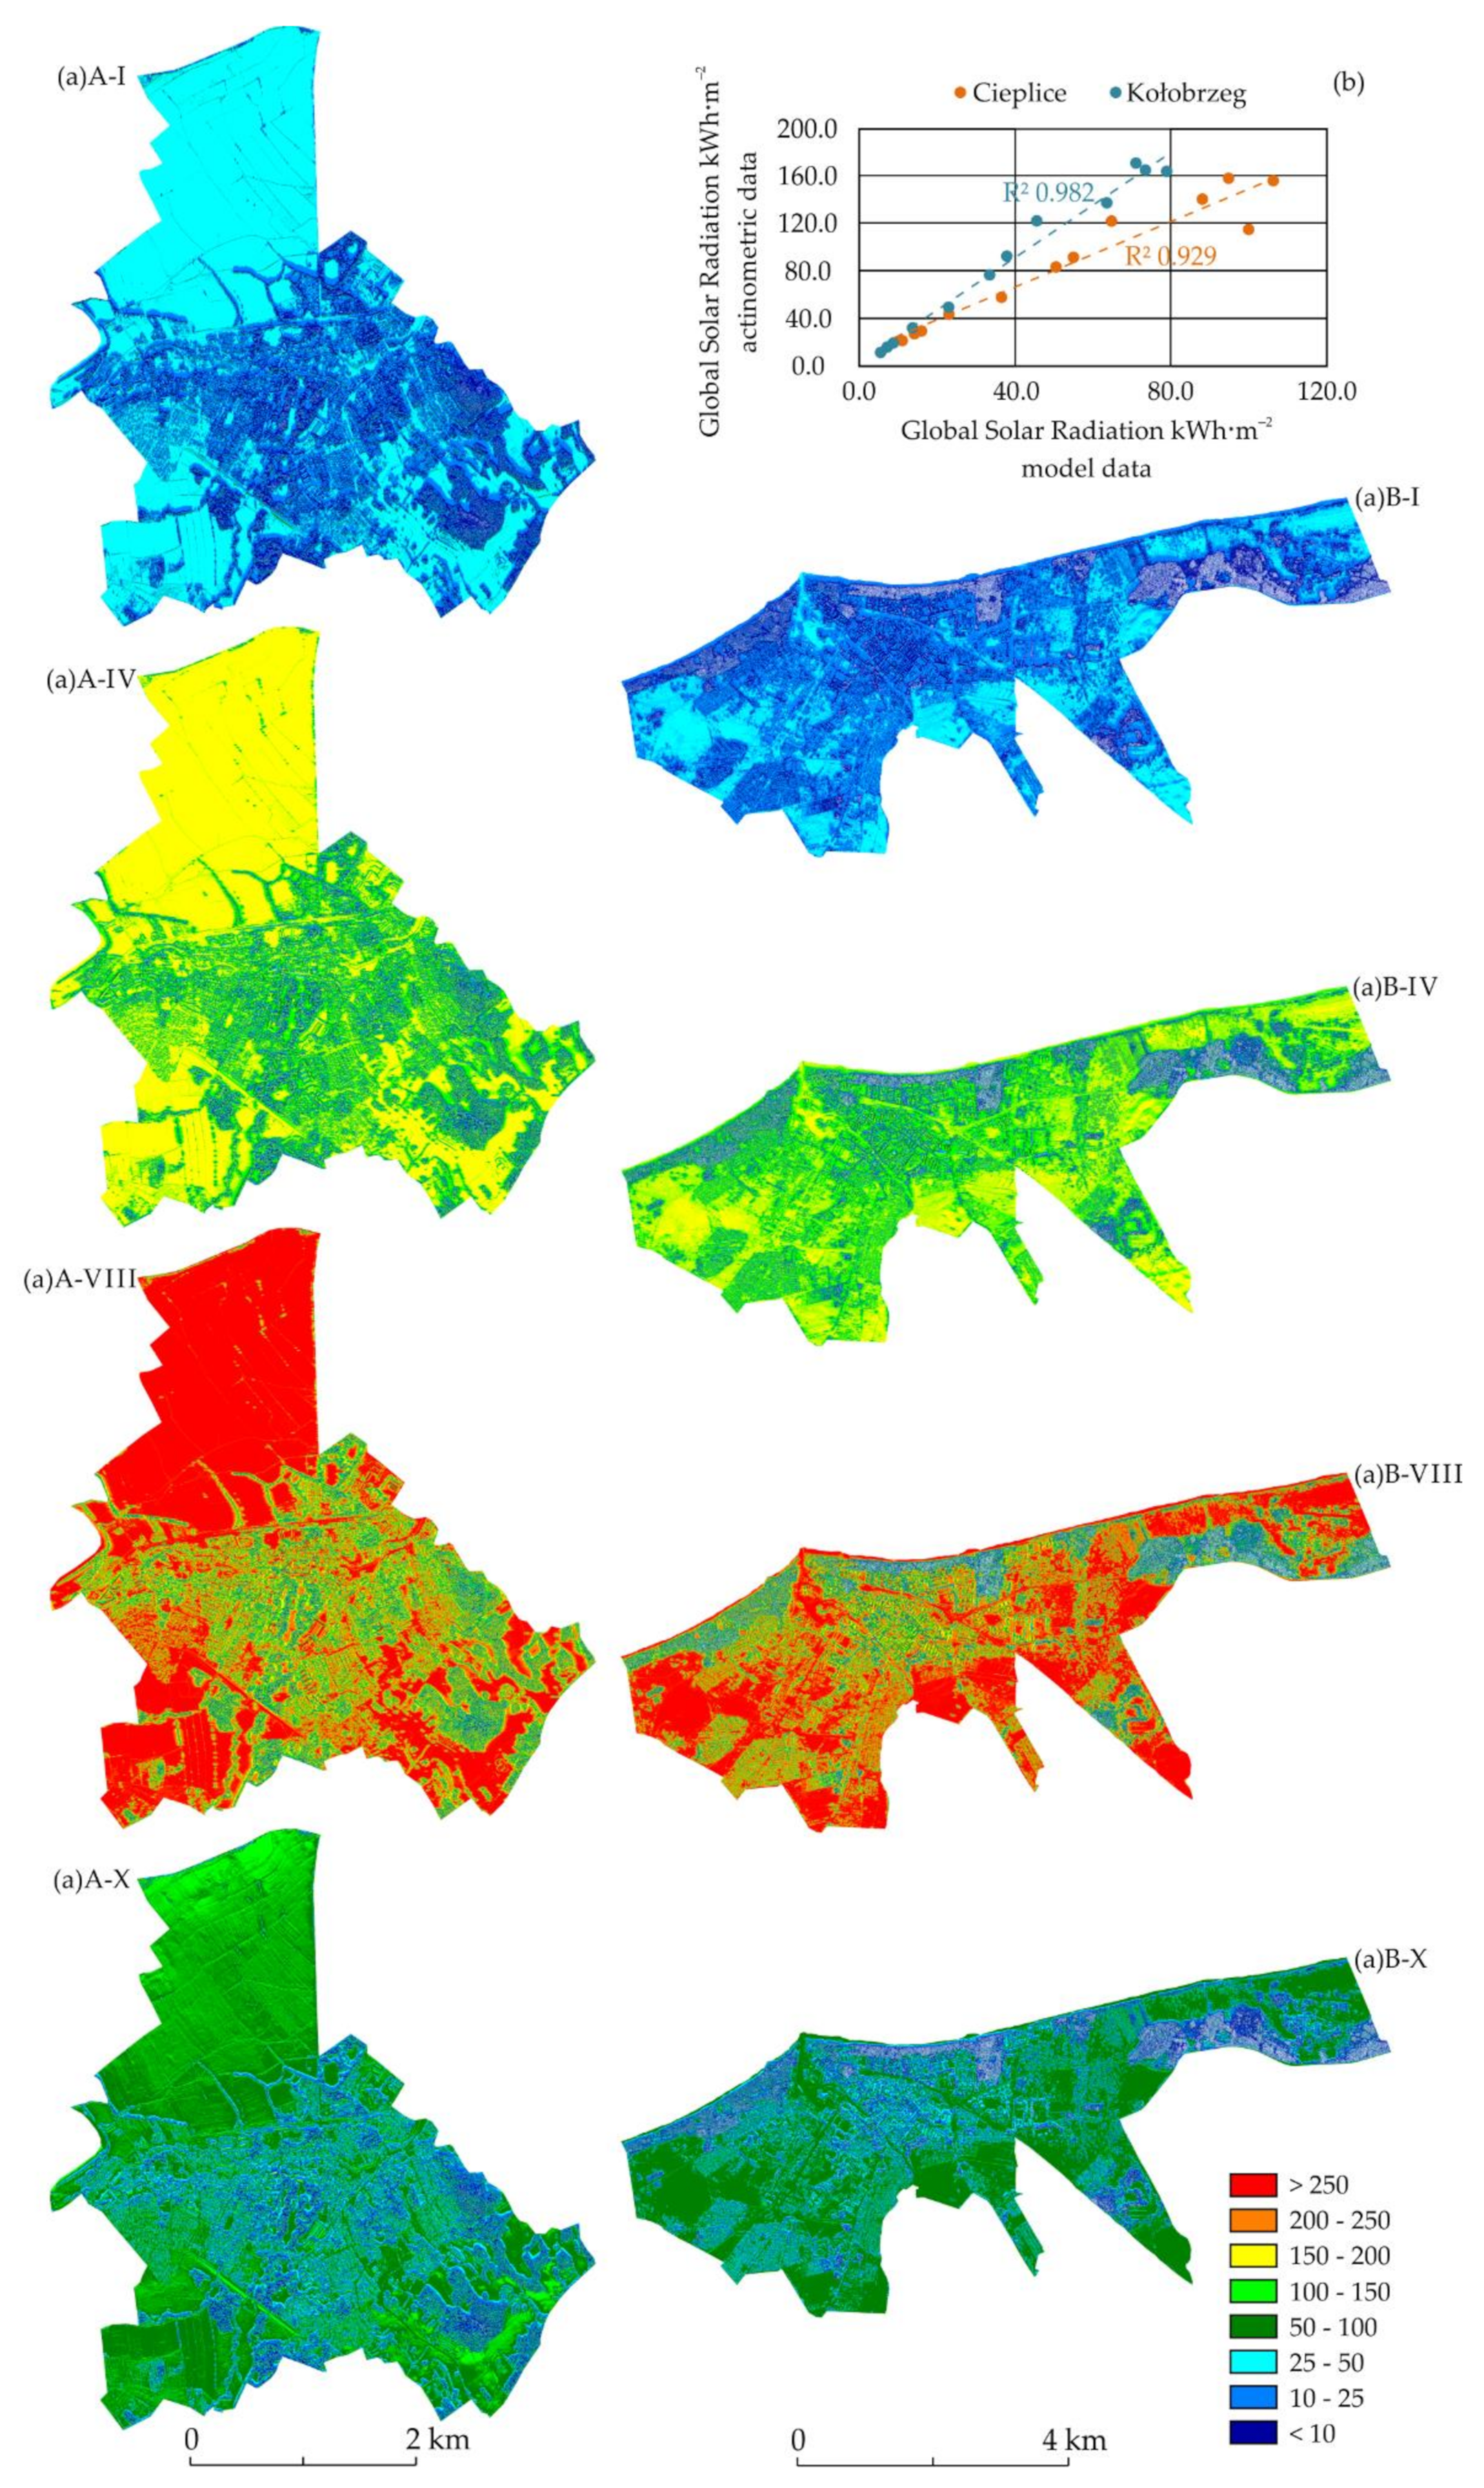
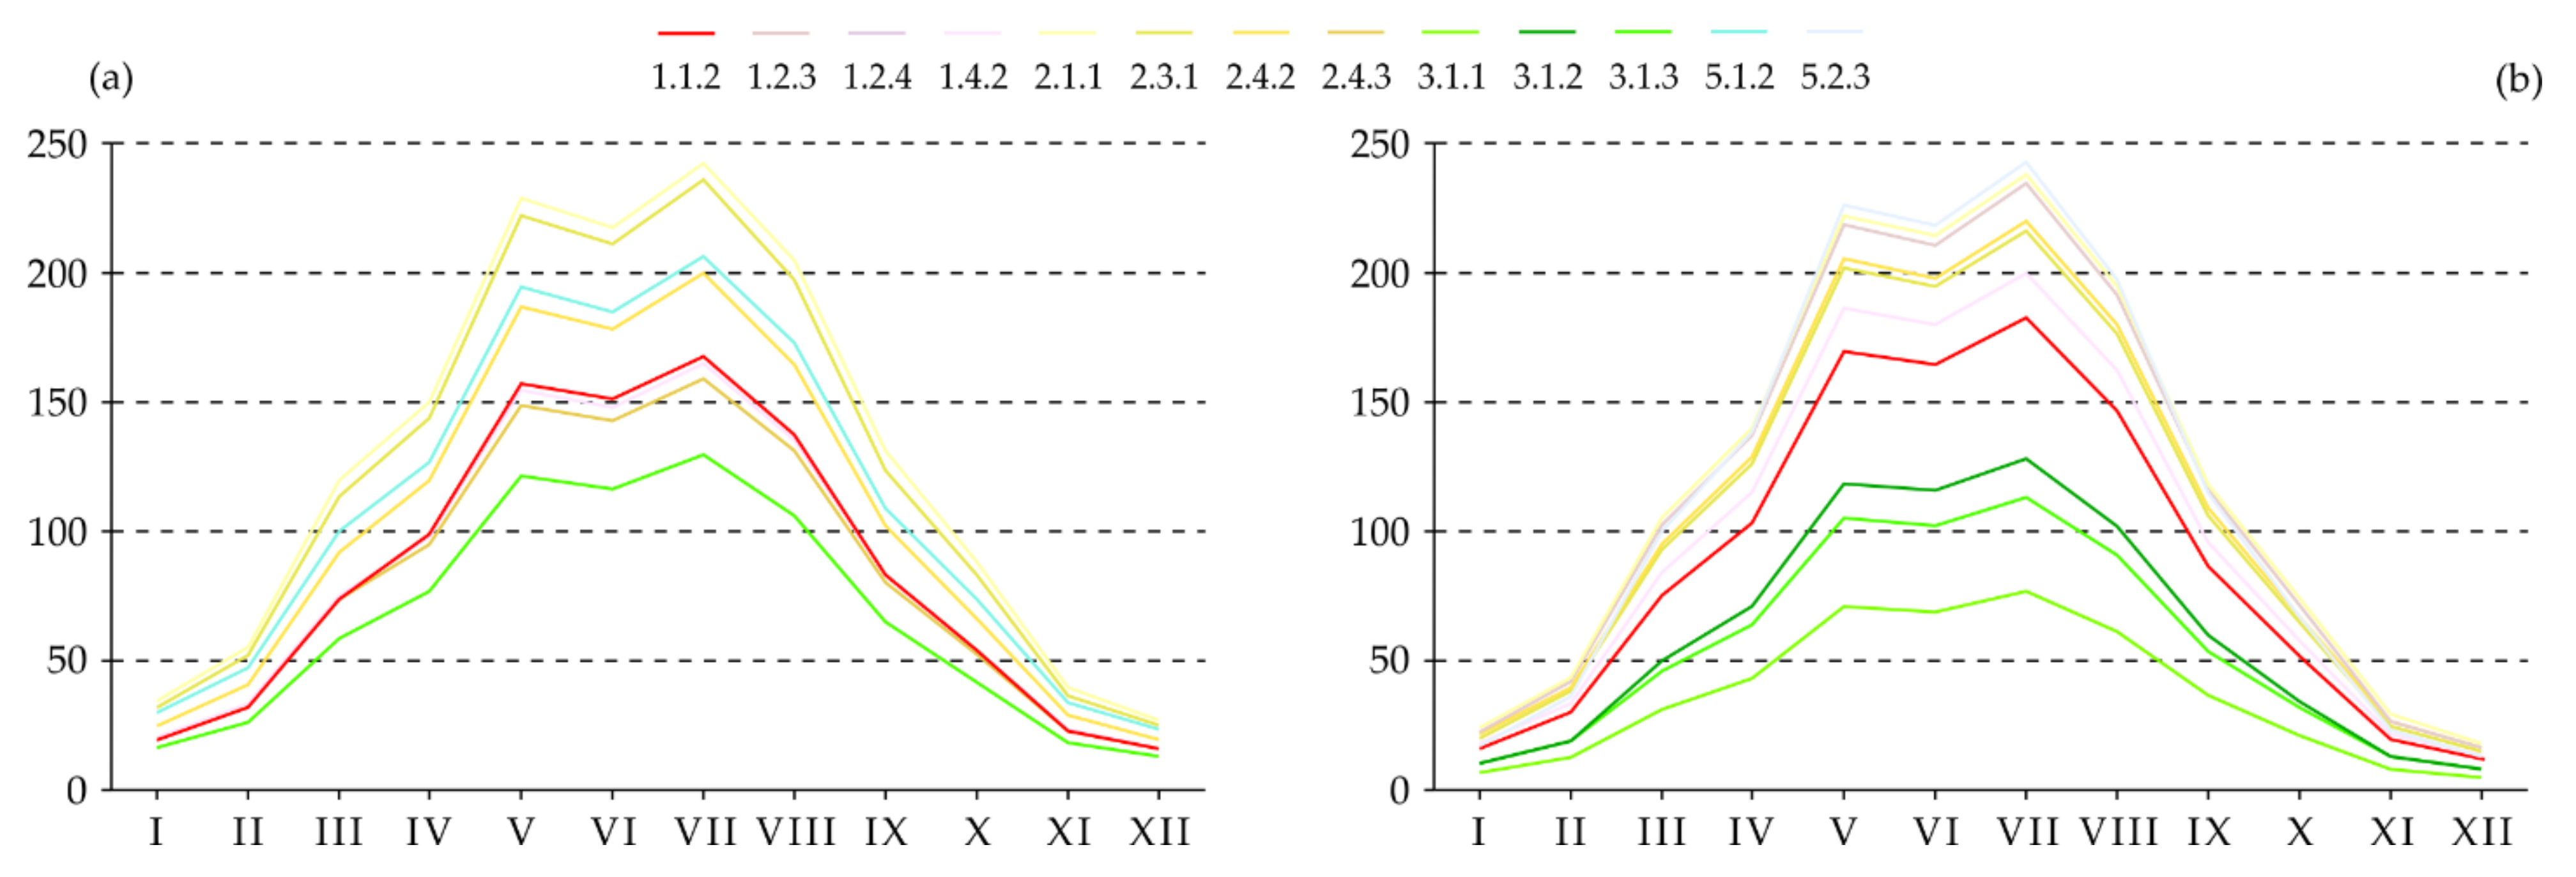
3.2.1. Global Solar Radiation—SAGA Distribution

The course of monthly changes in global solar radiation sums for Cieplice and Kołobrzeg, determined using the digital elevation model (DEM), correlates with the values of actinometric data measured at weather stations (Figure 13). Average monthly values of global solar radiation oscillate respectively in the range from 11.062 kWh·m−2 to 106.316 kWh·m−2 for Cieplice and from 5.452 kWh·m−2 to 78.957 kWh·m−2 for Kołobrzeg (Figure 13). The period from May to August is characterized by the highest global solar radiation sums for the studied health resorts, while the months from November to January are characterized by the lowest values of the analyzed index.
There are differences in the absolute values of global solar radiation sums for the two analyzed health resorts. The average annual global solar radiation value for Cieplice (55.046 kWh·m−2) is higher than for Kołobrzeg (38.520 kWh·m−2). This trend is also present in the case of the global solar radiation maximum values, as in the case of Cieplice and Kołobrzeg, where they occur in July, amounting to 280.226 kWh·m−2 and 274.152 kWh·m−2, respectively (Figure 13).
The spatial distribution of global solar radiation sums for the analyzed health resorts is strongly diversified (Figure 14). The type of land cover, which is characterized by the annual course of the highest monthly global solar radiation totals in both analyzed locations, is non-irrigated arable land (type 2.1.1). The average monthly global solar radiation sums for this type of land cover oscillate in the range from 26.724 to 243.328 kWh·m−2 in the case of Cieplice and from 17.550 to 239.117 kWh·m−2 for Kołobrzeg (Figure 14). The equally high level of the average monthly global solar radiation sums was determined for the pastures type of cover (type 2.3.1). In the case of the Kołobrzeg health resort, the equally high course of the average monthly global solar radiation sums is characteristic of two unique types of cover—ports (type 1.2.3) and sea (type 5.2.3), which results from the city’s location on the shores of the Baltic Sea. For the first type, the values range from 16.907 to 235.206 kWh·m−2, and for the second type, they range from 12.758 to 243.334 kWh·m−2 (Figure 14). Type 1.4.2 (non-agricultural vegetated areas) is characterized by the values of the monthly average global solar radiation sums at a much lower level, for which the maximum values are 168.179 kWh·m−2 for Cieplice and 183.097 kWh·m−2 for Kołobrzeg. The type of cover with the lowest course of monthly global solar radiation sums is forests (types 3.1.1–3.1.3) (Figure 14). The values range from 12.811 to 130.020 kWh·m−2 in mixed forests for Cieplice and from 5.358 to 76.924 kWh·m−2 for broad-leaved forests of the Kołobrzeg health resort.

3.2.2. Maximum Entropy Model

The validation achieved excellent AUC values, and the results are in line with the overall model results. The mean value of the AUC test does not differ significantly from AUC training for both methods that were used (Table A3). The strongest connections were recorded in the case of land cover (CLC type): 5.1.2 for Cieplice and 3.1.2 for Kołobrzeg, for both used methods. A detailed summary of the average values of AUC training and test for cross-validation method and bootstrap method is presented in Table A3. Even the lowest mean values of AUC training and test indicate a good correlation (AUC > 0.5) between the results and the data feeding the model, which is in line with the criteria proposed by Hosmer and Lemeshow [83].
For additional model verification, the probability index values between monthly global solar radiation sums and topographic parameters feeding the final model were determined. For AHM and SLP parameters, it takes values inversely proportional for both analyzed health resorts, at a level indicating the existence of a strong statistical relationship. Respectively, AHM from −0.619 to −0.800 and SLP from −0.530 to −0.852 for Kołobrzeg and AHM from −0.579 to −0.826 and SLP from −0.401 to −0.829 for Cieplice (Figure 15). For the CONV-IND parameter, the values are directly proportional—from 0.113 to 0.190 for Cieplice and from 0.085 to 0.160 for Kołobrzeg. The ASP parameter takes values inversely proportional for the Cieplice health resort (−0.059 to −0.072) and directly proportional for the Kołobrzeg health resort (from 0.010 to 0.043). For the last two parameters, no strong relationship was established, however, these are significant indicators due to the model results for selected land cover types. A characteristic feature of the correlation index is the fact that the strength of the statistical correlation increases in the summer months (for parameters showing an inversely proportional correlation) and in the winter months (for parameters showing a directly proportional correlation) (Figure 15).
The percentage share of the examined parameters in the model was determined for each type of land cover, which is presented in Figure 16. In the case of both analyzed spas, AHM and SLP dominate in most cases. The total share of these parameters in the model ranges from 60.6% for type 2.1.1 to 89.5% for type 3.1.3 in the case of the Cieplice health resort. However, the domination of the indicators mentioned above in the model for the Kołobrzeg health resort is not so clear, assuming the total percentage share in the range from 51.5% for type 2.4.2 to 84.5% for type 3.1.3.
In the case of Cieplice health resort, the AHM parameter is dominant for the following land cover types: 1.1.2—57.7%, 2.4.2—52.6%, and 5.1.2—52.9%. In the case of the SLP parameter, the maximum shares are characteristic of the coverage types: 3.1.3—51.9%, 2.4.3—45.7%, and 1.4.2—43.6%. The remaining parameters (ASP and CONV-IND) do not achieve a significant percentage share in the model, i.e., the maximum values are ASP—28.2% for type 2.3.1 and CONV-IND—11.7% for type 2.1.1 (Figure 16).
In the case of the Kołobrzeg health resort, the AHM parameter is dominant for the following land cover types: 1.1.2—46.5% and 2.3.1—41.5%. In the case of the SLP parameter, the maximum shares are characteristic for the coverage types: 3.1.1—54.7% and 3.1.3—49.5%. As in the case of Cieplice health resort, the CONV-IND parameter does not reach a significant percentage of the share in the model—maximum CONV-IND value is 15.0% for type 2.4.2. On the other hand, due to the smaller vertical differentiation of the area, the ASP parameter takes high percentages of the model for the following types of land cover: 1.2.3—29.5%, 2.1.1—28.8%, and 33.5%—2.4.2 (Figure 16).
The total area of the health resort corresponding to AUC > 0.75 is respectively 35.1 km2 for Cieplice (2.7% of the entire spa zone) and 14.9 km2 for Kołobrzeg (0.6% of the entire health resort). On the other hand, the total share of health resorts with the values of AUC > 0.50 amounts to 49.8% for Cieplice and 33.8% for Kołobrzeg, respectively. The types of cover that characterize the largest spa area with AUC > 0.75 are 3.1.3 for Cieplice and 1.2.3 for Kołobrzeg (Figure 16). Taking into account the average percentage of AUC > 0.50, a more favorable distribution of the model results was observed for Cieplice (37.4% of the entire health resort) than for Kołobrzeg (23.2% of the entire health resort). The types of cover that predispose the model’s results are respectively 2.1.1 for Cieplice (60.8% of the AUC > 0.50) and 1.1.2 for Kołobrzeg (42.0% of the AUC > 0.50). The spatial distribution of AUC for the Cieplice and Kołobrzeg health resorts and the percentage of the area in the separated AUC ranges are presented in Figure 16.

4. Discussion

The effectiveness of heliotherapy is conditioned by many complex factors, which can be classified as: direct (e.g., latitude, cloud cover, etc.) and indirect—widely related to land development). Human activity has an influence primarily on factors included in the second group.
The average annual sum of actual sunshine duration in the Cieplice and Kołobrzeg health resorts for the years 1996–2015 exceeds the minimum norm of 1500 h for health resort operations in Poland (Figure 2). In the case of both health resorts, a growing trend is observed in the annual sum of hours with the sun, which improves the conditions for heliotherapy (Figure 2). Other authors [14,84,85] also draw attention to the growing annual sums of actual sunshine duration in Poland and other regions of Europe in the 1990s and at the beginning of the 21st century.
The distribution of actual sunshine duration throughout the year is primarily influenced by latitude [44,86], which determines the length of the day in the annual course—in summer, as the latitude increases, the day becomes longer, and in winter, the other way round. Therefore, the most favorable conditions for heliotherapy are from April to September, when the average daily sums of actual sunshine duration in the analyzed health resorts vary from about 6 to 8 h (Figure 4). It is also influenced by the amount of cloud cover in Poland that changes throughout the year, where lower values are observed in the warm half-year [12,87,88]. In these months, the use of heliotherapy is also facilitated by the daily sums of global radiation, which is several times greater than in the autumn and winter months (Table A2), which means that to achieve the desired therapeutic effect, the exposure time to direct solar radiation may be shorter. The histogram of the daily sums of total insolation (Figure 9) shows that the probability of daily values exceeding 4.5 kWh·m−2 in June exceeds 65% in both health resorts.
In the months from April to September, there is also an appropriate height of the sun for heliotherapy (Figure 12), which affects not only the intensity and sum of global radiation but also the intensity and range of ultraviolet radiation reaching the ground. At a time when the height of the sun is low, the path length of the solar radiation through the atmosphere increases, and the radiation with the shortest wavelengths are absorbed and scattered more strongly. For heliotherapy, the key factor is the inflow of UVB, the biological impact of which is visible starting from >30° of solar altitude [13,44]. In the period from April to September, it is possible in Poland to conduct heliotherapy in terms of increasing the production of vitamin D3 in the human body. In the late spring and summer, it is also possible to conduct effective anti-psoriasis heliotherapy [36]. For safe and effective heliotherapy, it is necessary to take specific daily solar radiation doses [20]. Before starting therapy, it is also important to exclude possible contraindications for this form of treatment [24].
Comparing the research results obtained for Cieplice and Kołobrzeg, it can be concluded that in the warm half-year, especially in May-July, the conditions for sunbathing are more favorable in Kołobrzeg, located in the north of Poland, where the day is longer and the sunny days are more frequent (Figure 6), which results in a greater number of hours with sun and greater sums of global radiation. Czerwińska and Krzyścin [20] indicate the favorable solar features of the climate for anti-psoriasis heliotherapy in the summer season on the Baltic coast. According to Krzyścin et al. [89], the contact of human skin with seawater enhances the effectiveness of anti-psoriasis heliotherapy, which also indicates the great potential of seaside health resorts in Poland to conduct this form of health treatment.
In the rest of the year, the climatic conditions are less favorable for heliotherapy in the analyzed health resorts. A particularly unfavorable situation occurs in Kołobrzeg in the months from November to February, when the daily sums of actual sunshine duration range from 1 to 2 h (Figure 4), and approximately half of the days in each of these months are sunless days (Figure 6). During this time, there are also multi-day sunless periods, the length of which may be up to 15 days (Table 3). Longer periods of weather with complete cloudiness adversely affect the human body’s psyche and biological functions [13]. In Kołobrzeg, from the beginning of October to the first days of March, the height of the sun at noon does not exceed 30°, which prevents the synthesis of vitamin D3 in the human skin. For the proper functioning of the body, vitamin D supplementation is recommended at this time because the consumption of foods containing large amounts of it is usually insufficient [19,42]. On the other hand, from the beginning of November to the first days of February, the height of the sun at noon does not exceed 20°, which limits the possibility of biological effects of UVA [44]. In Cieplice, the duration of these unfavorable periods is 2–3 weeks shorter.
The remote sensing results determined based on the DEM were correlated with the actual actinometric characteristics of the studied health resorts (Figure 13b). Generally, they indicate more favorable conditions for heliotherapy in the summer months, reflecting the direct factors described above. The summer period on the Baltic Sea was also indicated in their research by Krzyścin et al. [89] as a way to support UV cabinet exposures during the treatment of psoriasis.
Terrain morphometry, less and less untransformed into urbanized areas, affects the solar inflow. There is an increase in the area of built-up and urbanized land in the city [90], which confirms the thesis about the urbanization process [91], leading to the intensification of the urban heat island phenomenon [92].
In the microscale, areas with appropriate exposure (S at the expense of N) are predisposed. Research of Ali-Toudert and Mayer [93] pointed out that the E-W orientation of canyons has high stressful thermal comfort, indirectly dependent on solar radiation conditions. The element that strongly differentiates the inflow of solar radiation, and thus the effectiveness of heliotherapy, is the land cover. The presence of buildings (especially tall or compact) shades the area. Buildings intercept the direct and reduce the diffuse solar radiation, yet they may also enhance irradiance by reflecting sunlight [94,95]. An equally important parameter is the building’s location concerning the world’s directions, the building’s shape, or the number of floors (height). These differences generate contrast in energy budgets that lead to interactions in radiative exchange [95]. Urban structures modify the visible horizon and influence the incoming radiation fluxes [50]. Advantageous solar features are characteristic for areas with high terrain openness, and therefore high SVF values. As confirmed in the research of Barring et al. [96], street geometry influences the surface temperature (indirect solar radiance) using SVF analyses.
On a macroscale, the land cover type characteristics determine the possibility of an inflow of solar radiation. Urban areas, in comparison with rural areas, have distinctive biophysical features [97]. Based on the conducted studies, the most favorable areas from the point of view of heliotherapy were: non-irrigated arable land (type 2.1.1), pastures (type 2.3.1), and sea (type 5.2.3)—only for Kołobrzeg (Figure 14). Here, the range of areas predisposed for heliotherapy should be noted—designated by health resorts’ boundaries. Arable lands (type 2.1.1) are areas with a different function, so their suitability for heliotherapy is negligible. Only pastures (type 2.3.1) as walking areas meet the functional assumptions. Attention should be paid to the zonal type of land cover—sea area (type 5.2.3), which is associated with the beach. Due to its environmental features (flat, with large openness, no buildings), it is extremely beneficial for heliotherapy. On the other side of the scale, there are forest areas (types 3.1.1–3.1.3), the least favorable from the analyzed angle. This is a kind of paradox because these areas are very often used for health activities (e.g., walking areas in spa parks, hiking trails in forests, etc.), however, in the case of heliotherapy, they are not of significant importance. They often fall within the range of health resorts. Sunny glades, which were shown by the research of Thorsson et al. [98], are characterized by good thermal outdoor environment conditions for human behavior, including the usage of heliotherapy. Equally weak solar characteristics are in type 1.4.2 (non-agricultural vegetated areas), where health resorts (spa houses) are usually located and where the patients spend most of their time. These areas are also (obligatorily) included in the health resorts. Similar results in their research on bioclimatic comfort were shown by Zeren-Cetin and Sevik [99], preferring agricultural land and natural and semi-natural areas over settlement areas.
The usage of the MaxEnt model made it possible to determine the influence of morphometric parameters on the effectiveness of heliotherapy. From several parameters tested, the most important turned out to be AHM and SLP (Figure 16). Their values are directly related to the configuration of actinometric factors, morphometry, and land cover. The inversely proportional correlation noted in the results, stronger in the summer period (Figure 15), shows that the increase in the intensity of the relief or coverage and the season of the year reduces the inflow of solar radiation—and thus the effectiveness of heliotherapy.
Analyzing in detail the results of the MaxEnt model for Cieplice and Kołobrzeg, it can be concluded that AHM limits the effectiveness of heliotherapy for urbanized areas (including type 1.1.2). On the other hand, the SLP parameter determines heliotherapy in semi-natural areas (including type 2.4.3) and natural areas (including type 3.1.1 and 3.1.3, which subjects the less use of this cover type due to the shading of the dense surface of trees for heliotherapy). Additionally, in the area of Kołobrzeg, the ASP was an essential parameter for some types of land cover, which indicates that in relatively flat areas (Plain of Poland), the exposure of the area is more critical than in mountain areas (Cieplice).
The analyzed health resorts are predisposed for health resort activities focused on heliotherapy (the total area with AUC > 0.75 was 2.7% for Cieplice and 0.6% for Kołobrzeg). Taking AUC > 0.50 into account, the area increases to 49.8% and 33.8%, respectively. Much more advantageous for the analyzed form of health activity are high mountain areas [100] or marine areas located in subtropical latitudes, e.g., Black Sea Coast [99]. The types of land cover shown in the model, environmentally predisposed for heliotherapy (AUC > 0.50), characterized by the highest percentage (2.1.1 for Cieplice and 1.1.2 for Kołobrzeg), due to the way of use, are not indicated for heliotherapy. On the other hand, the types preferred both in terms of the environment (AUC > 0.50) and utility (possible real health resorts use), i.e., pastures (type 2.3.1—about 25% for Cieplice and about 35% for Kołobrzeg) and sea-beach (type 5.2.3—about 5% for Kołobrzeg) (Figure 16) do not occupy large areas of the health resort.

5. Conclusions

Based on the results of conducted studies and the connections between solar climate features, terrain morphometry, and land cover in terms of the usage of heliotherapy, the following conclusions were drawn:
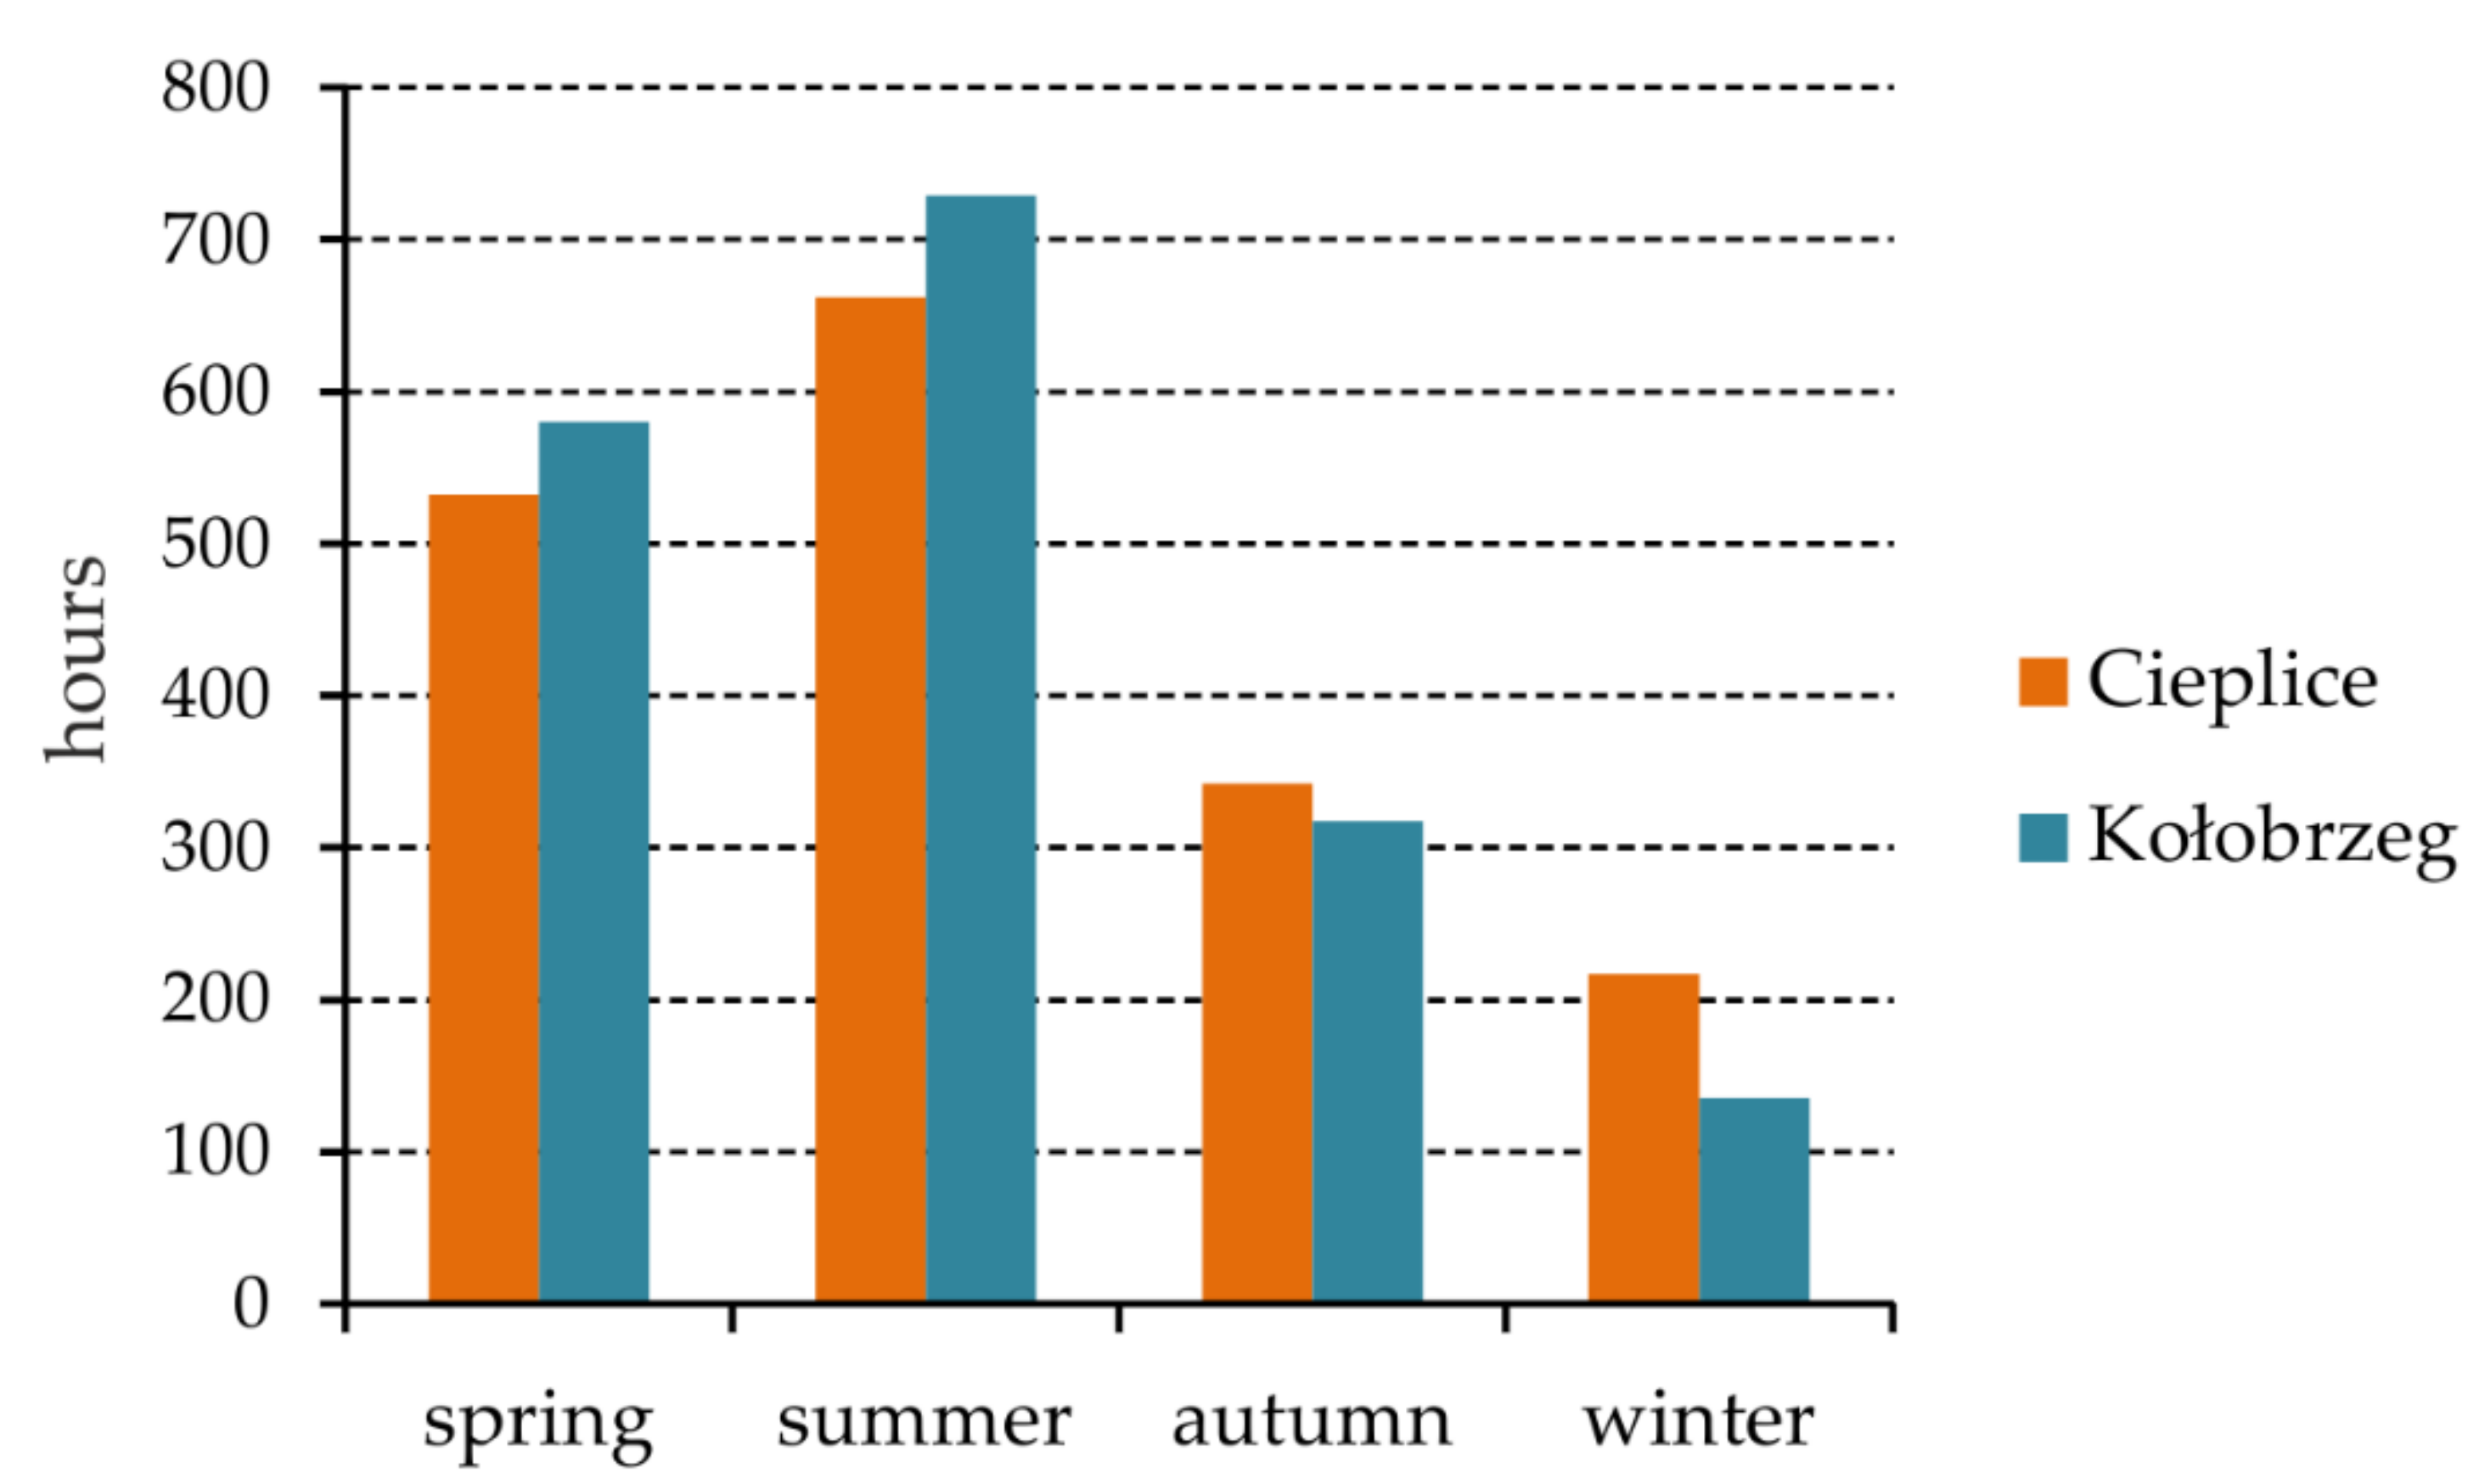
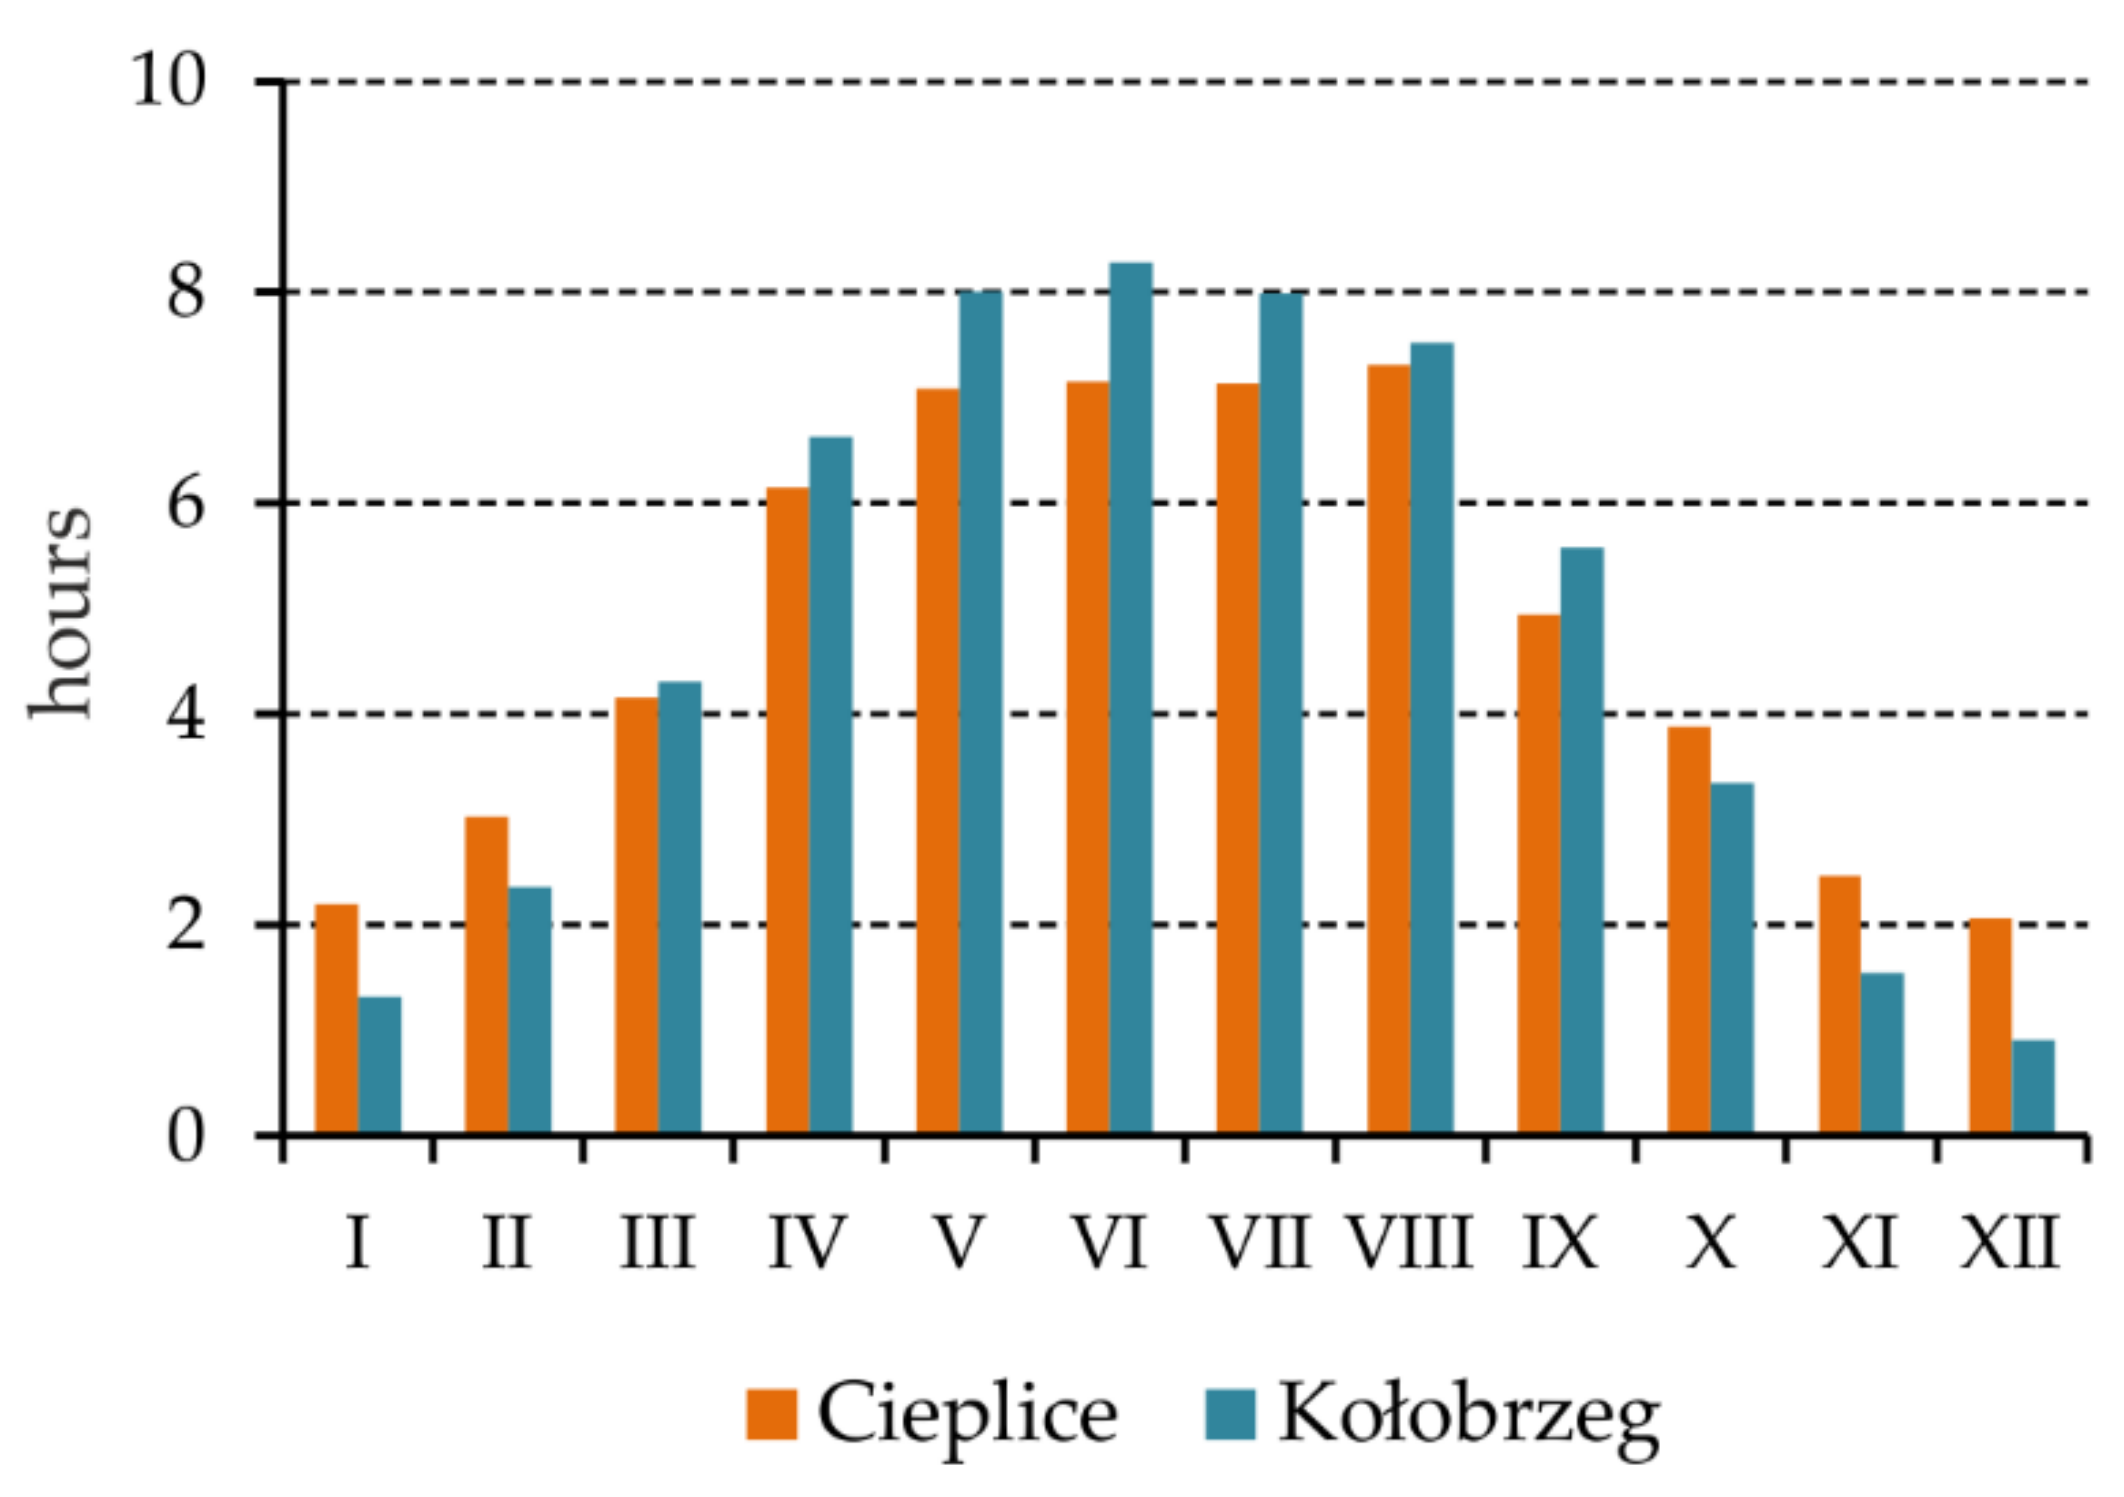
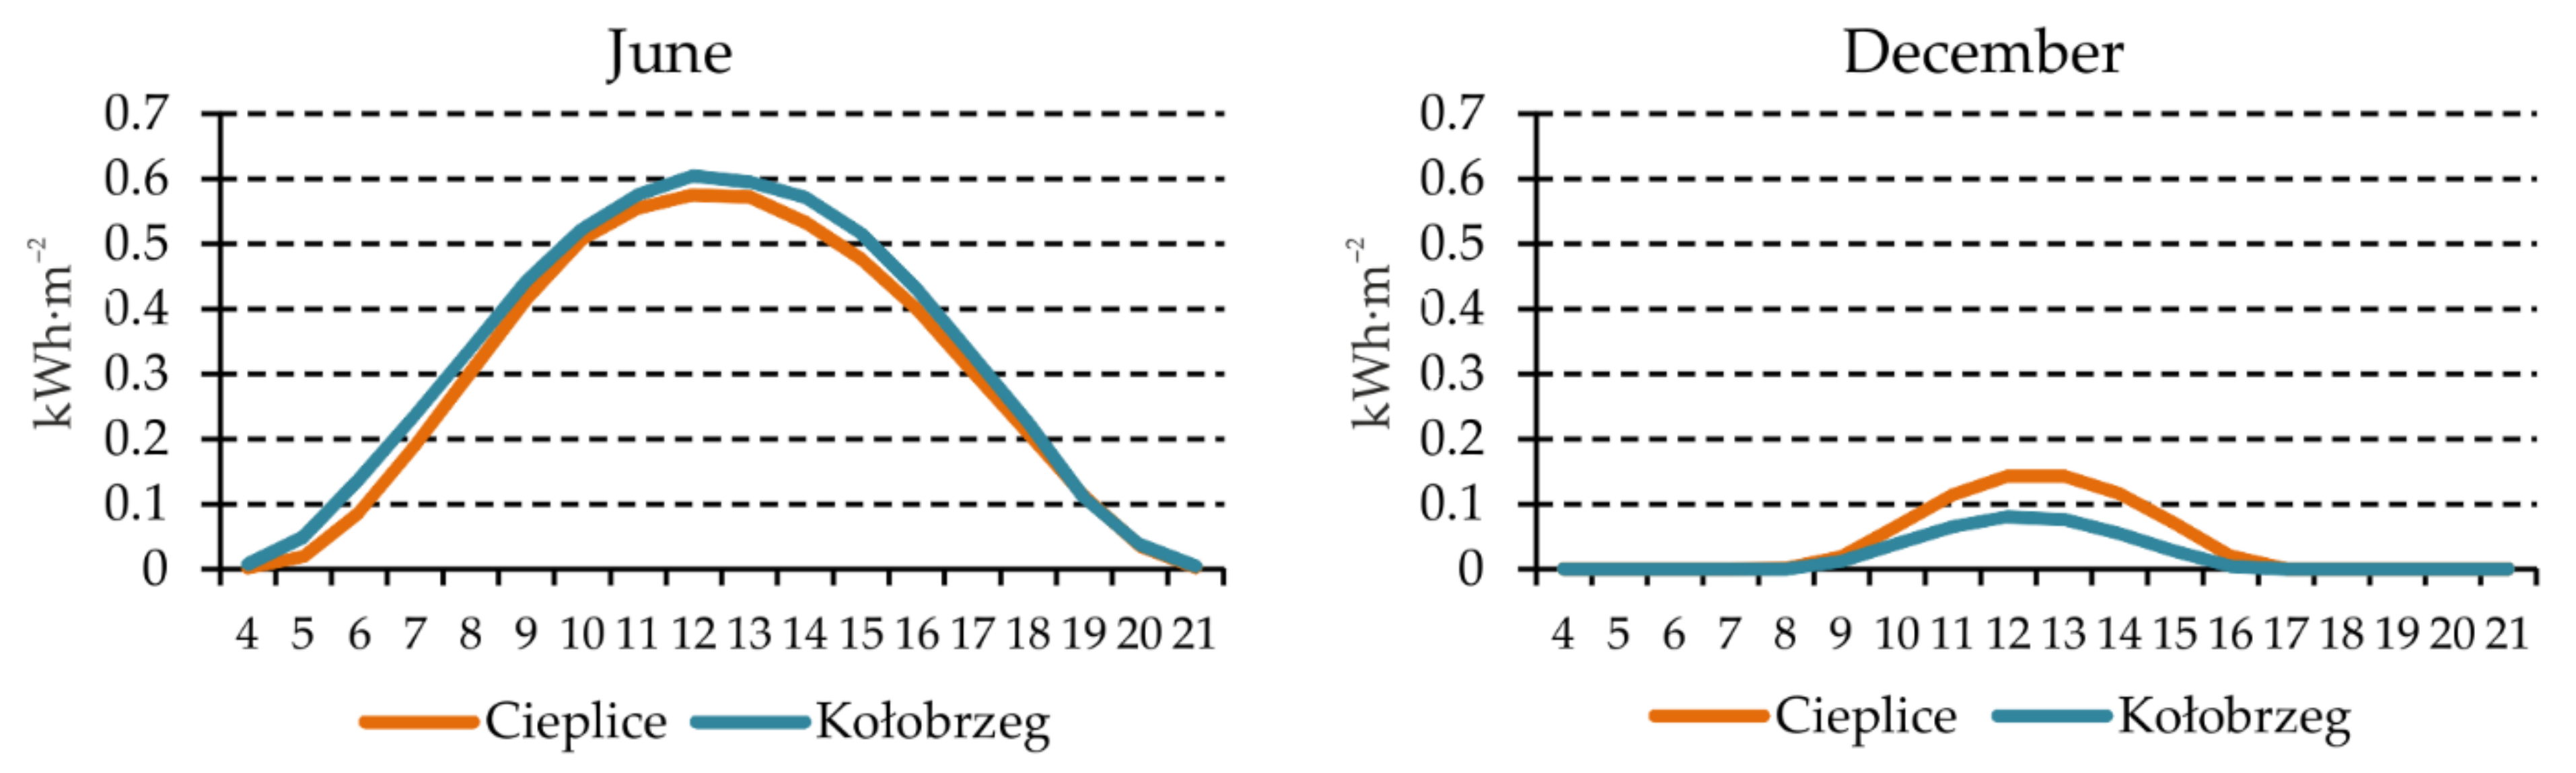
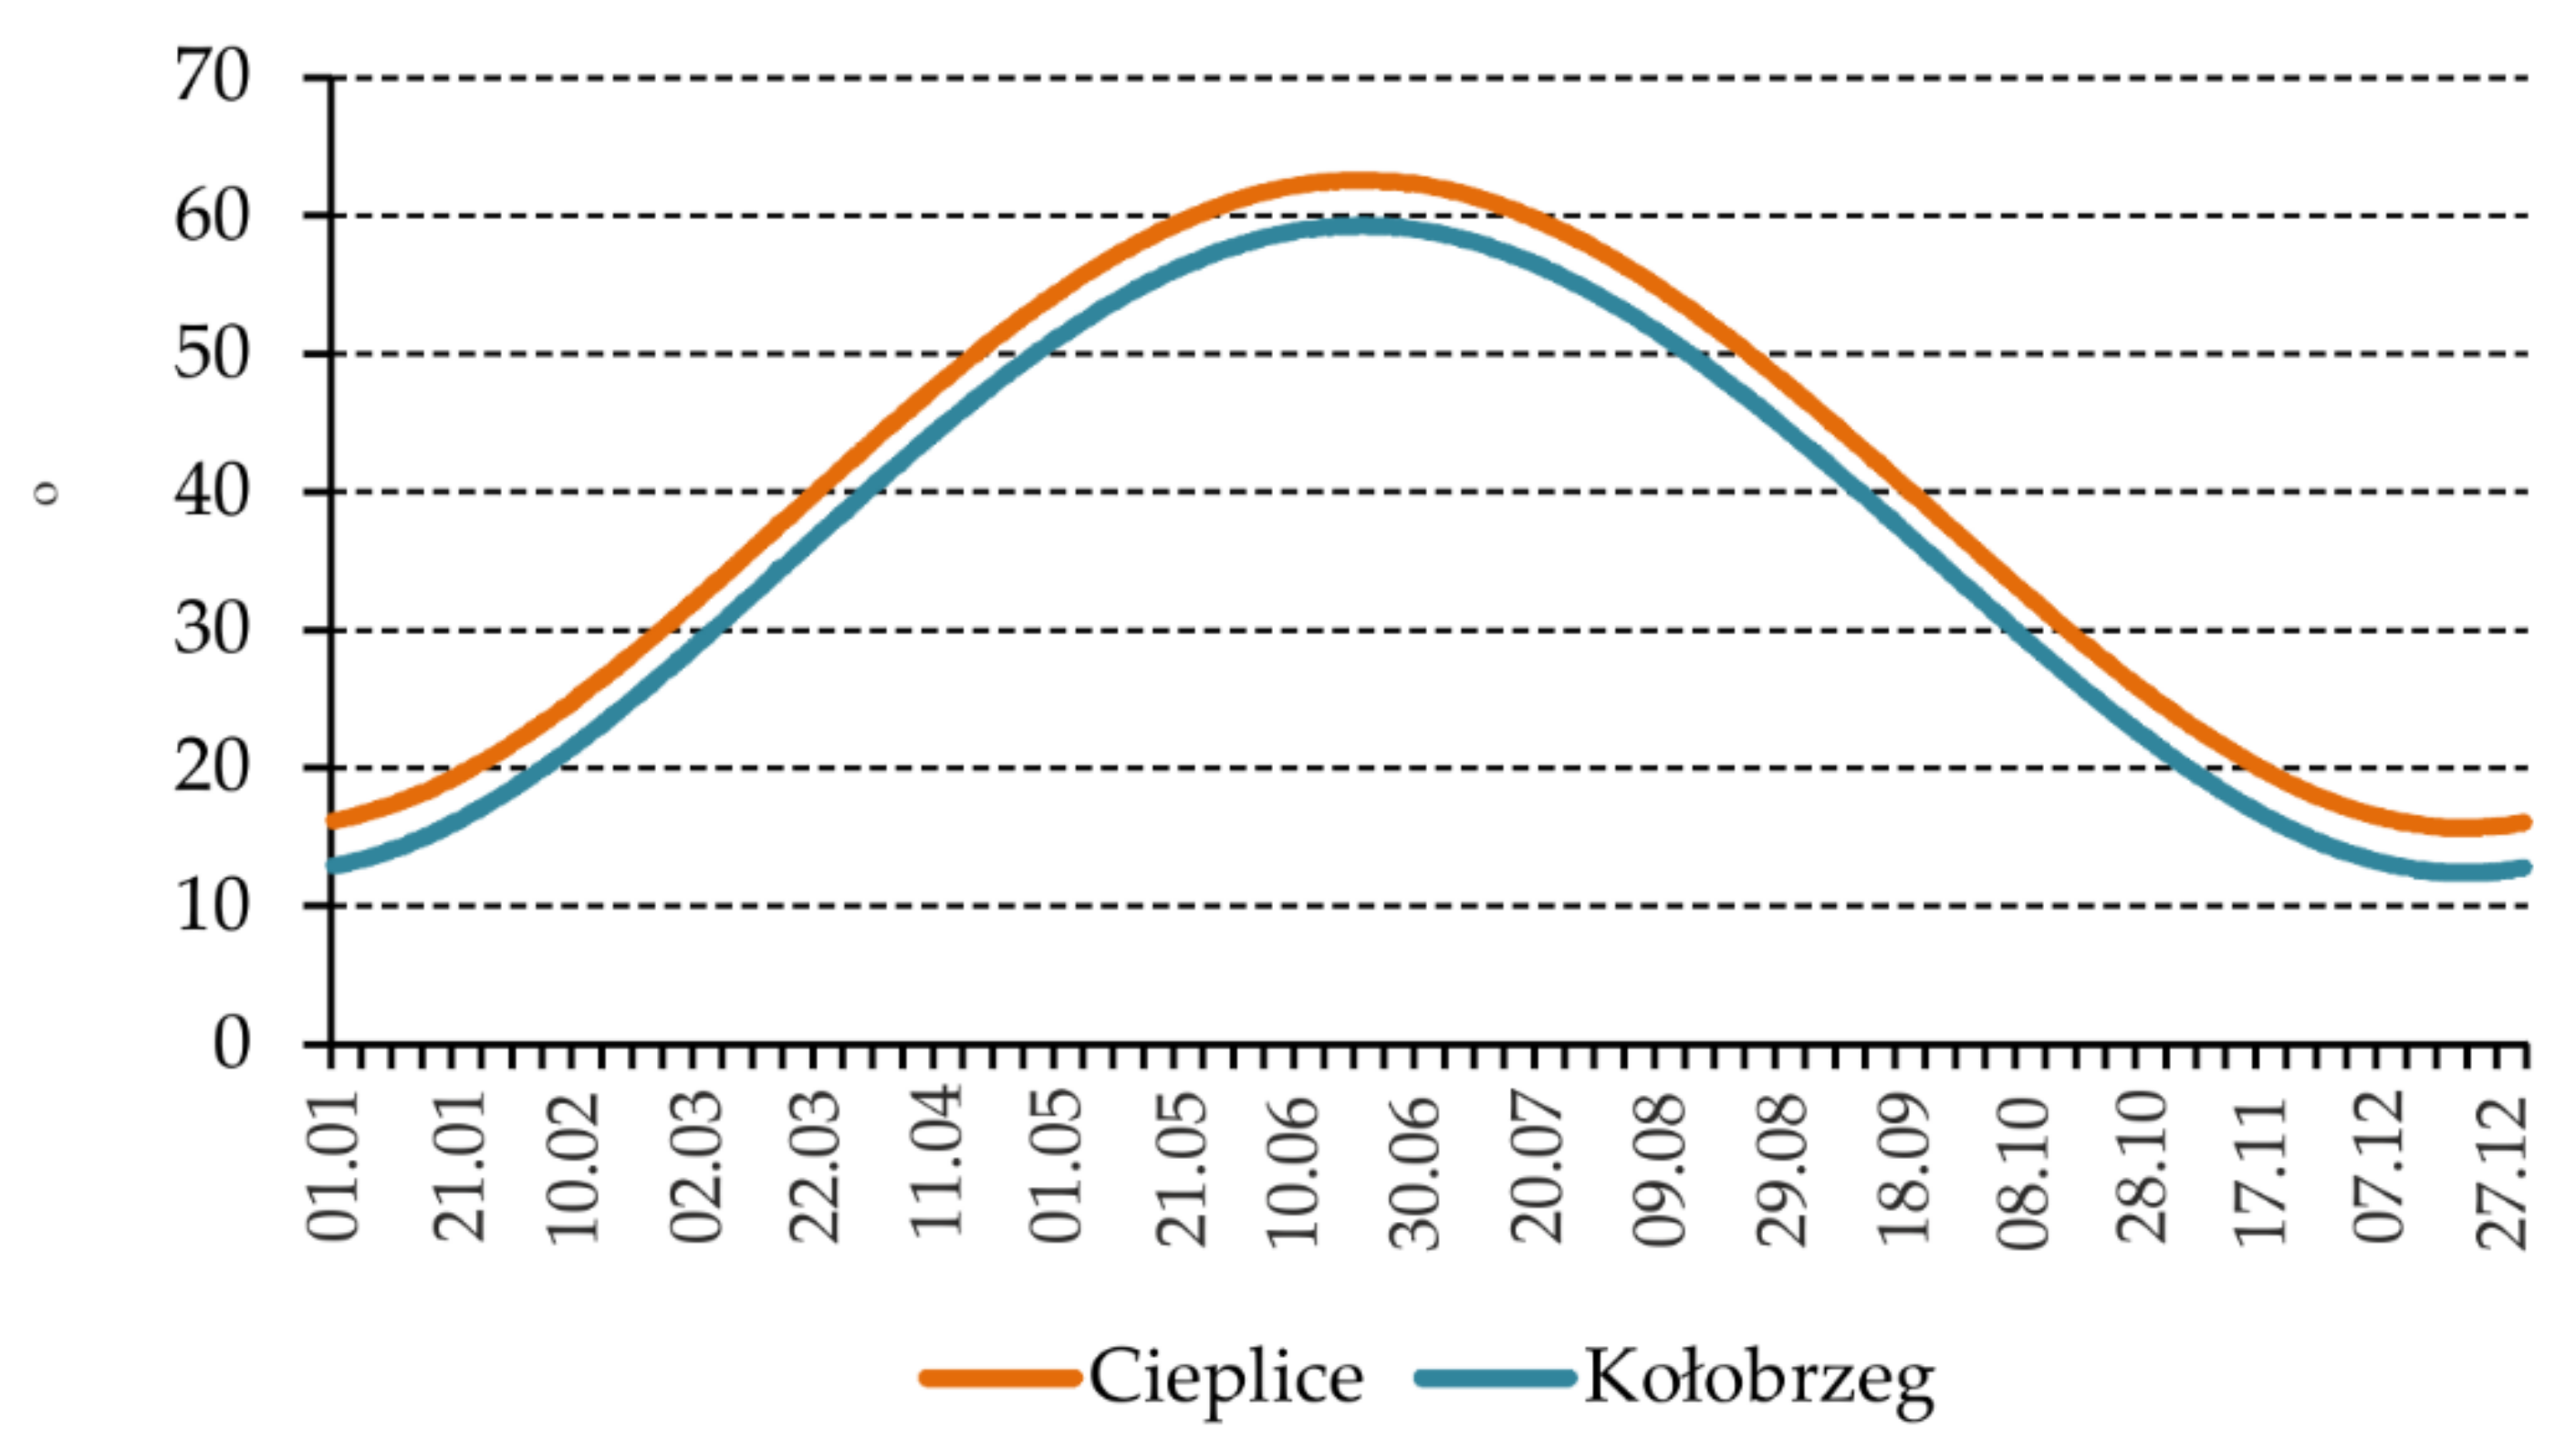
  • Solar features of the climate of the research area, defined by the number of hours with the sun (sunshine duration), the sum of global solar radiation, and the height of the sun, indicate that the best conditions for heliotherapy are from April to September. The months from November to February are a particularly inadvisable period of the year when the unfavorable influence of astronomical factors for heliotherapy is combined with greater cloudiness.
  • In late spring and summer, Kołobrzeg is a health resort with more favorable conditions for curative sunbathing, where less cloud cover and a longer day determine the occurrence of greater daily amounts of actual sunshine duration and global radiation than in Cieplice.
  • The spatial distribution of global solar radiation, obtained with the use of remote sensing tools (SAGA), correlates with the actual actinometric measurements (Cieplice—0.929; Kołobrzeg—0.982). Micro- and macroscale morphometry, combined with the type of land cover (CLC), determines heliotherapy’s effectiveness.
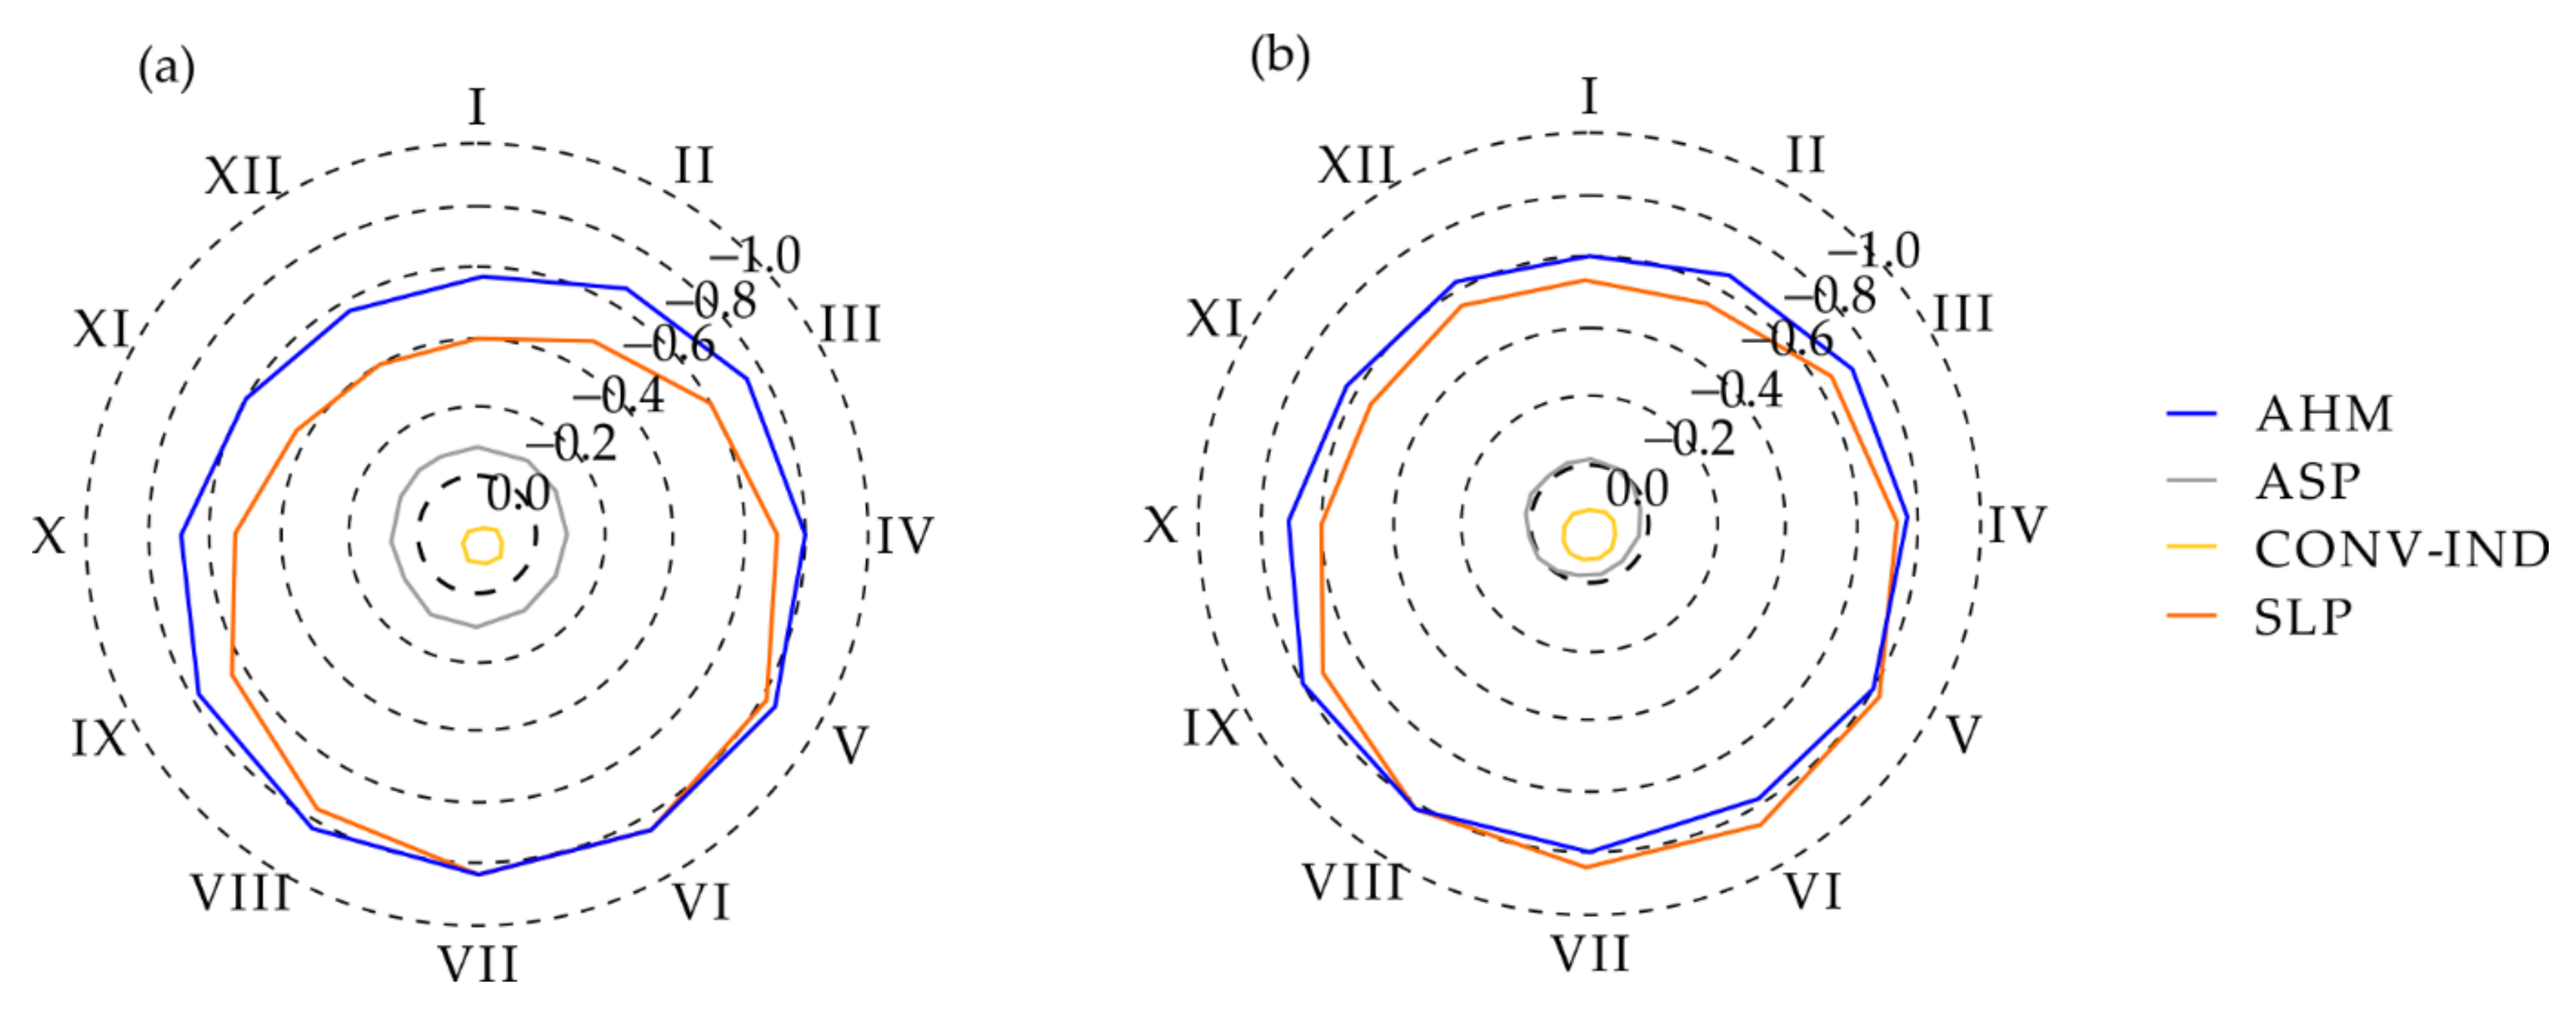
  • Topographic indicators that had a significant impact on heliotherapy’s effectiveness using the MaxEnt Model were AHM and SLP. The observed correlation, inversely proportional, stronger in the summer period, indicates that the increase in the intensity of the relief or the presence of high-exposure land cover and the season of the year affects the balance of solar radiation supply—thus the effectiveness of heliotherapy.
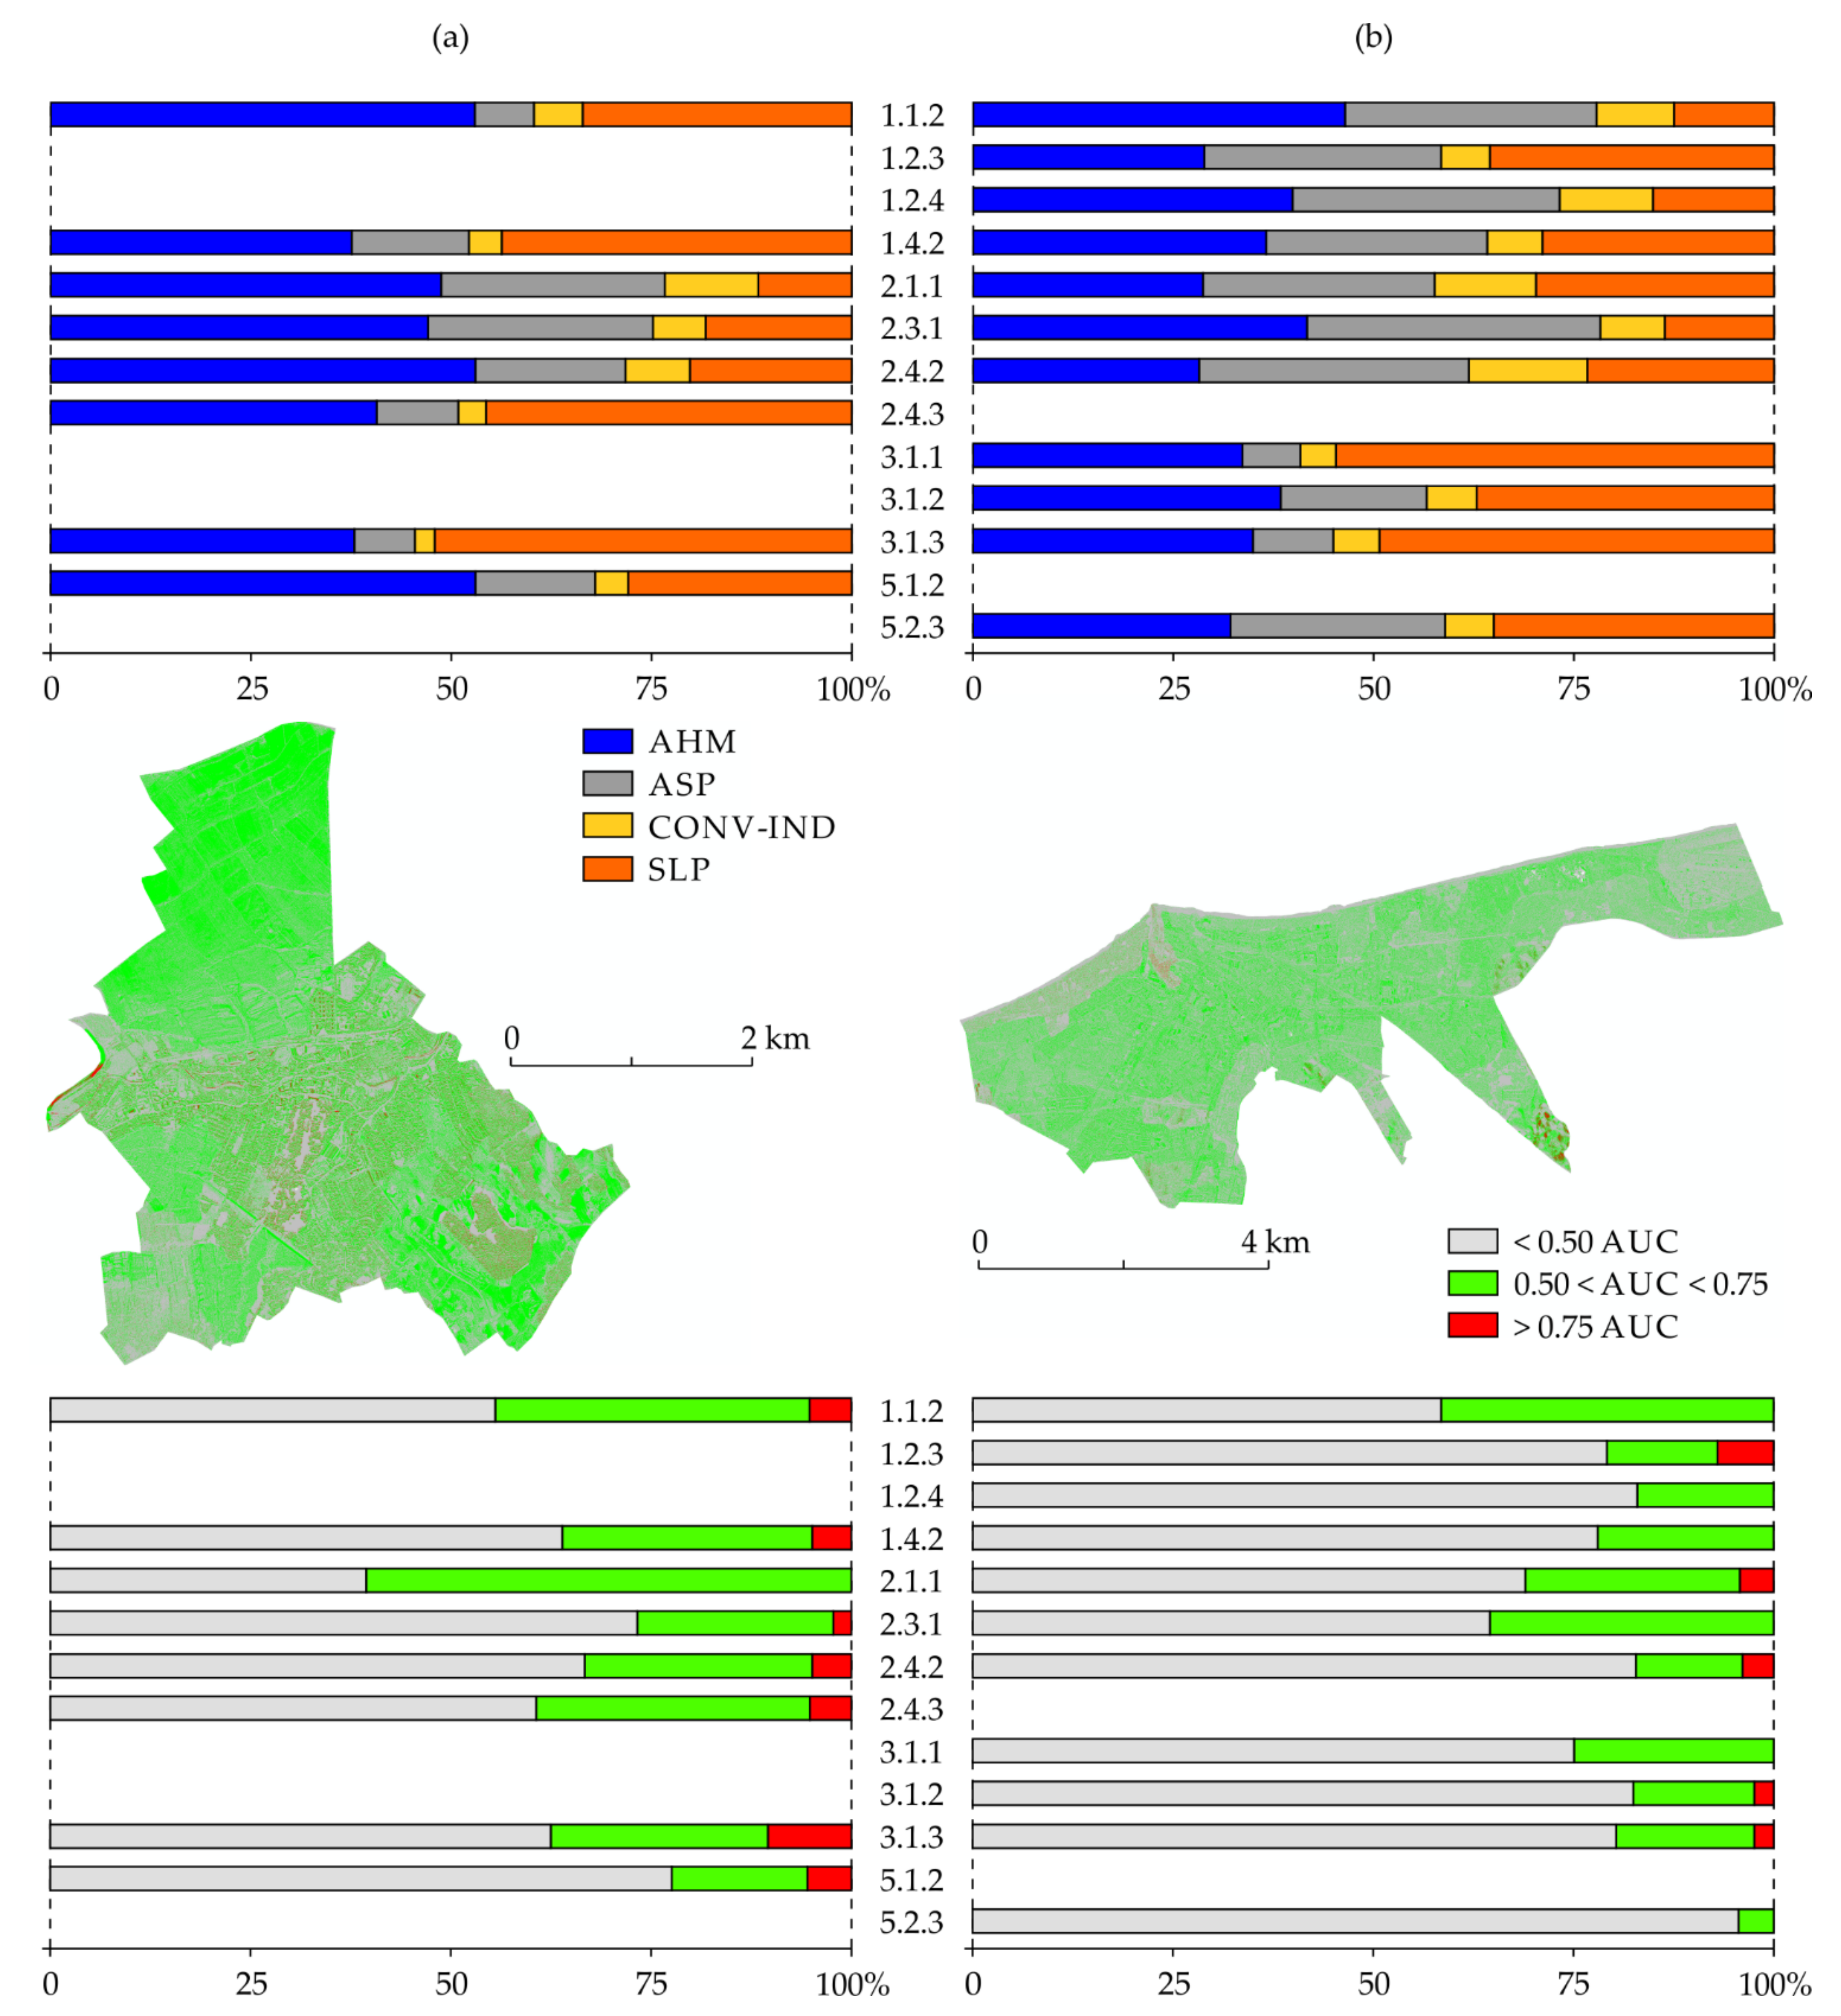
  • The results of the MaxEnt Model showed that non-irrigated arable land (CLC type 2.1.1), pastures (2.3.1), and the sea zone (5.2.3)—in Kołobrzeg are the most favorable types of land cover in terms of heliotherapy. Considering the actual development of the areas mentioned above, only the last two seem to meet health treatment requirements. The percentage of the health resorts’ area favorable for heliotherapy (AUC > 0.50) was 49.8% for Cieplice and 33.8% for Kołobrzeg, respectively. This indicates that their area is right predisposed for the analyzed type of treatment. The least favorable type of land cover for heliotherapy is forests (CLC type 3.1.1–3.1.3), which are often used in health treatment because of their suitability to another climate therapy method, i.e., aerotherapy.
  • The applied interdisciplinary research (bioclimatology and remote sensing) with the use of MaxEnt modeling makes it possible to determine the degree of heliotherapy effectiveness in already functioning health resorts and constitutes key elements in the future decision-making cycle to indicate future locations of such health resort. Our research shows the need to implement new research methods aimed at optimizing the organization of treatment based on environmental features influenced by climate change and anthropogenic pressure.

Author Contributions

Conceptualization, D.S. and M.W.; methodology, D.S. and M.W.; software, D.S. and M.W.; validation, M.W. and D.S.; formal analysis, M.W. and D.S.; investigation, D.S. and M.W.; resources, M.W. and D.S.; data curation, D.S. and M.W.; writing—original draft preparation, D.S. and M.W.; writing—review and editing, M.W. and D.S.; visualization, M.W. and D.S.; supervision, D.S. and M.W.; project administration, D.S. and M.W.; funding acquisition, D.S. All authors have read and agreed to the published version of the manuscript.

Funding

This research and APC was funded by the Project Supporting Maintenance of Research Potential of the Institute of Geography at Kazimierz Wielki University [grant number BS/2016/N2].

Institutional Review Board Statement

Not applicable.

Informed Consent Statement

Not applicable.

Data Availability Statement

Publicly available datasets were analyzed in this study. This data can be found here: (i) heliographic and actinometric data [https://danepubliczne.imgw.pl/ (accessed on 17 August 2020)]; (ii) Digital Elevation Model data [https://mapy.geoportal.gov.pl]; (iii) Corine Land Cover Database [https://land.copernicus.eu/pan-european/corine-land-cover (accessed on 16 June 2020)].

Acknowledgments

We would like to thank the three anonymous reviewers for constructive comments that substantially improved our paper.

Conflicts of Interest

The authors declare no conflict of interest.

Appendix A

Table A1. Selected statistical characteristics of monthly sums of global solar radiation in Cieplice and Kołobrzeg. Data for the years 1996–2015.
Months
IIIIIIIVVVIVIIVIIIIXXXIXII
Cieplice
MinkWh·m−221.5630.8662.28101.0493.43125.64109.91101.9160.6940.9722.1715.05
Max32.5857.8796.50163.06186.57180.12205.20165.32115.1675.5344.2725.61
Av26.7643.3283.31122.20155.19158.55156.25140.8091.3157.9429.3921.34
SD2.796.359.3515.9821.0316.5319.4615.9515.069.344.882.78
CV%10.4214.6611.2313.0813.5510.4212.4611.3316.4916.1316.5913.03
Kołobrzeg
MinkWh·m−213.0523.3863.0599.75112.52150.62130.32109.1864.6539.3414.538.54
Max21.6040.1490.99158.41211.12196.67211.72169.36108.2165.1325.7613.72
Av16.2831.5776.73122.51165.34171.67164.47137.5492.8049.2219.1810.96
SD2.284.648.2015.6221.1514.3221.3815.179.896.072.631.32
CV%14.0214.6810.6812.7512.798.3413.0011.0310.6612.3413.7312.04
Table A2. Selected statistical characteristics of daily sums of global solar radiation in Cieplice and Kołobrzeg. Data for the years 1996–2015.
Months
IIIIIIIVVVIVIIVIIIIXXXIXII
Cieplice
MinkWh·m−20.100.210.330.410.580.430.490.370.280.170.090.08
Max2.193.665.657.348.339.018.618.965.834.122.961.79
Av0.861.552.694.075.015.285.044.543.041.870.980.69
A0.530.440.20−0.22−0.29−0.45−0.30−0.47−0.130.170.480.35
CV%54.8152.7749.7643.1540.4038.0238.1335.5146.1850.3556.2255.10
Kołobrzeg
MinkWh·m−20.070.140.140.130.580.600.410.600.420.160.080.05
Max1.643.155.156.918.308.738.437.245.743.701.931.09
Av0.531.132.484.085.335.725.314.443.091.590.640.35
A0.920.620.12−0.36−0.58−0.54−0.45−0.39−0.130.360.910.97
CV%64.3861.6151.2441.2634.4334.1336.0934.1640.3552.2162.9960.76
Table A3. Validated averages of AUC values for Cieplice and Kołobrzeg using cross-validation and bootstrapping methods.
CLC TypeCiepliceKołobrzeg
Cross-ValidationBootstrapCross-ValidationBootstrap
TrainingTestTrainingTestTrainingTestTrainingTest
1.1.20.7030.7020.7130.7090.6770.6760.6870.683
1.2.3----0.8650.8510.8730.868
1.2.4----0.8220.8180.8290.821
1.4.20.8480.8410.8560.8490.8470.8410.8530.850
2.1.10.6340.6330.6450.6440.8310.8280.8390.840
2.3.10.7940.7890.8000.7930.6990.6980.7100.711
2.4.20.7690.7650.7740.7710.8960.8730.9180.870
2.4.30.8240.8220.8310.823----
3.1.1----0.8310.8300.8410.840
3.1.2----0.9140.8910.9280.901
3.1.30.8390.8350.8430.8390.8850.8820.8930.890
5.1.20.8920.8450.9110.843----
5.3.2----0.8880.8750.8970.887

References

  1. Gest, H. Bicentenary homage to Dr Jan Ingen-Housz, MD (1730–1799), pioneer of photosynthesis research. Photosynth. Res. 2000, 63, 183–190. [Google Scholar] [CrossRef]
  2. Zhang, J.; Zhao, L.; Deng, S.; Xu, W.; Zhang, Y. A critical review of the models used to estimate solar radiation. Renew. Sustain. Energy Rev. 2017, 70, 314–329. [Google Scholar] [CrossRef]
  3. Niedźwiedź, T. Słownik Meteorologiczny; Polskie Towarzystwo Geofizyczne, Instytut Meteorologii i Gospodarki Wodnej: Warsaw, Poland, 2003; p. 495. [Google Scholar]
  4. Lam, J.C.; Li, D.H.W. Correlation between global solar radiation and its direct and diffuse components. Build. Environ. 1996, 31, 527–535. [Google Scholar] [CrossRef]
  5. Wild, M. Global dimming and brightening: A review. J. Geophys. Res. 2009, 114, D00D16. [Google Scholar] [CrossRef] [Green Version]
  6. Roupioz, L.; Jia, L.; Nerry, F.; Menenti, M. Estimation of daily solar radiation budget at kilometer resolution over the Tibetan Plateau by integrating MODIS data products and a DEM. Remote Sens. 2016, 8, 504. [Google Scholar] [CrossRef] [Green Version]
  7. Campbell, G.S.; Norman, J.M. Radiation Basics an Introduction to Environmental Biophysics; Springer: New York, NY, USA, 1998; pp. 147–165. [Google Scholar]
  8. Liu, J.; Linderholm, H.; Chen, D.; Zhou, X.; Flerchinger, G.N.; Yu, Q.; Wu, D.; Shen, Y.; Yang, Z. Changes in the relationship between solar radiation and sunshine duration in large cities of China. Energy 2015, 82, 589–600. [Google Scholar] [CrossRef]
  9. Koronakis, P.S.; Sfantos, G.K.; Paliatsos, A.G.; Kaldellis, J.K.; Garofalakis, J.E.; Koronaki, I.P. Interrelations of UV-global/global/diffuse solar irradiance components and UV-global attenuation on air pollution episode days in Athens, Greece. Atmos. Environ. 2002, 36, 3173–3181. [Google Scholar] [CrossRef]
  10. Zhao, N.; Zeng, X.; Han, S. Solar radiation estimation using sunshine hour and air pollution index in China. Energy Convers. Manag. 2013, 76, 846–851. [Google Scholar] [CrossRef]
  11. WMO. Guide to Instruments and Methods of Observation. Measurement of Meteorological Variables; World Meteorological Organization (WMO): Geneva, Switzerland, 2018; Volume 1, p. 573. [Google Scholar]
  12. Woś, A. Klimat Polski w Drugiej Połowie XX Wieku; Wydawnictwo Naukowe UAM: Poznan, Poland, 2010; p. 489. [Google Scholar]
  13. Błażejczyk, K.; Kunert, A. Bioklimatyczne Uwarunkowania Rekreacji i Turystyki w Polsce, 2nd ed.; PAN IGiPZ: Warsaw, Poland, 2011; p. 370. [Google Scholar]
  14. Matuszko, D.; Bartoszek, K.; Soroka, J.; Węglarczyk, S. Zmienność i zróżnicowanie usłonecznienia w Polsce w latach 1917–2018, na podstawie danych naziemnych i satelitarnych. In Współczesne Problemy Klimatologii Polski; Chojnacka-Ożga, L., Lorenc, H., Eds.; Instytut Meteorologii i Gospodarki Wodnej, Państwowy Instytut Badawczy: Warsaw, Poland, 2019; pp. 53–66. [Google Scholar]
  15. Lucas, R.; McMichael, T.; Smith, W.; Armstrong, B. Solar Ultraviolet Radiation. In Global Burden of Disease from Solar Ultraviolet Radiation; Environmental Burden of Disease Series; WHO, Public Health and the Environment: Geneva, Switzerland, 2006; p. 258. [Google Scholar]
  16. World Health Organization; World Meteorological Organization; United Nations Environment Programme; International Commission on Non-Ionizing Radiation Protection. Global Solar UV Index: A Practical Guide; World Health Organization: Geneva, Switzerland, 2002; p. 28. [Google Scholar]
  17. Podstawczyńska, A. Cechy solarne klimatu Łodzi. Acta Univ. Lodz. Folia Geogr. Phys. 2007, 7, 294. [Google Scholar]
  18. Kozłowska-Szczęsna, T.; Błażejczyk, K.; Krawczyk, B. Bioklimatologia Człowieka. Metody i ich Zastosowania w Badaniach Bioklimatu Polski; Monografie IGiPZ PAN: Warsaw, Poland, 1997; p. 202. [Google Scholar]
  19. Kmieć, P.; Sworczak, K. Korzyści i zagrożenia wynikające z suplementacji witaminą D. Forum Med. Rodz. 2017, 11, 38–46. [Google Scholar]
  20. Czerwińska, A.E.; Krzyścin, J.W. Analysis of Measurements and Modelling of the Biologically Active UV Solar Radiation for Selected Sites in Poland—Assessment of Photo-Medical Effects; Polska Akademia Nauk, Instytut Geofizyki: Warsaw, Poland, 2020; p. 116. [Google Scholar]
  21. Sieniawska, J.; Lesiak, A.; Segerbäck, D.; Young, A.R.; Woźniacka, A.; Narbutt, J. Wakacyjna ekspozycja na słońce zwiększa stężenie witaminy D oraz dimerów tymidynowych u dzieci przebywających na obozie. Forum Dermatol. 2016, 2, 73–80. [Google Scholar]
  22. Błażejczyk, K.; Błażejczyk, A. Changes in UV radiation intensity and their possible impact on skin cancer in Poland. Geogr. Pol. 2012, 85, 57–64. [Google Scholar] [CrossRef]
  23. Fitzpatrick, T.B. The validity and practicality of sun-reactive skin type I through VI. Arch. Dermatol. 1988, 124, 869–871. [Google Scholar] [CrossRef]
  24. Matos, T.R.; Ling, T.C.; Sheth, V. Ultraviolet B radiation therapy for psoriasis: Pursuing the optimal regime. Clin. Dermatol. 2016, 34, 587–593. [Google Scholar] [CrossRef] [PubMed]
  25. Kozłowska-Szczęsna, T.; Krawczyk, B.; Kuchcik, M. Wpływ Środowiska Atmosferycznego na Zdrowie i Samopoczucie Człowieka; IG&SO Polish Academy of Sciences: Warsaw, Poland, 2004; p. 198. [Google Scholar]
  26. Kasprzak, W.; Mańkowska, A. Fizykoterapia, Medycyna Uzdrowiskowa i SPA; Wydawnictwo Lekarskie PZWL: Warsaw, Poland, 2009; p. 604. [Google Scholar]
  27. Hartung, J. Ultraviolet therapy at the North Sea coast. In The Biologic Effects of Ultraviolet Radiation; Urbach, F., Ed.; Pergamon Press: Oxford, UK, 1969; pp. 657–661. [Google Scholar]
  28. Hobday, R.A. Sunlight therapy and solar architecture. Med. Hist. 1997, 41, 455–472. [Google Scholar] [CrossRef] [Green Version]
  29. Boreham, D.R.; Gasmann, H.C.; Mitchel, R.E. Water bath hyperthermia is a simple therapy for psoriasis and also stimulates skin tanning in response to sunlight. Int. J. Hyperth. 1995, 11, 745–754. [Google Scholar] [CrossRef] [PubMed]
  30. Alora, M.B.T.; Fitzpatrick, T.B.; Taylor, C.R. Total body heliotherapy. Photodermatol. Photoimmunol. Photomed. 1997, 13, 178–180. [Google Scholar] [CrossRef]
  31. Kushelevsky, A.P.; Harari, M.; Kudish, A.I.; Hristakieva, E.; Ingber, A.; Shani, J. Safety of solar phototherapy at the Dead Sea. J. Am. Acad. Dermatol. 1998, 38, 447–452. [Google Scholar] [CrossRef]
  32. Snellman, E.; Maljanen, T.; Aromaa, A.; Reunanen, A.; Jyrkinen-Pakkasvirta, T.; JLuoma, J. Effect of heliotherapy on the cost of psoriasis. Br. J. Dermatol. 1998, 138, 288–292. [Google Scholar] [CrossRef] [PubMed]
  33. Cohen, A.D.; Shapiro, J.; Michael, D.; Hodak, E.; Van-Dijk, D.; Naggan, L.; Vardy, D.A. Out-come of “short-term” Dead Sea climatotherapy for psoriasis. Acta Derm. Venereol. 2008, 88, 90–91. [Google Scholar] [CrossRef]
  34. Kazandjieva, J.; Grozdev, I.; Darlenski, R.; Tsankov, N. Climatotherapy of psoriasis. Clin. Dermatol. 2008, 26, 477–485. [Google Scholar] [CrossRef]
  35. Karppinen, T.; Ylianttila, L.; Kautiainen, H.; Reunala, T.; Snellman, E. Empowering heliotherapy improves clinical outcome and quality of life of psoriasis and atopic dermatitis patients. Acta Derm. Venereol. 2015, 95, 579–582. [Google Scholar] [CrossRef] [PubMed] [Green Version]
  36. Krzyścin, J.W.; Narbutt, J.; Lesiak, A.; Jarosławski, J.; Sobolewski, P.S.; Rajewska-Więch, B.; Szkop, A.; Wink, J.; Czerwińska, A. Perspectives of the antipsoriatic heliotherapy in Poland. J. Photochem. Photobiol. B Biol. 2014, 140, 111–119. [Google Scholar] [CrossRef] [PubMed]
  37. Krzyścin, J.W.; Guzikowski, J.; Czerwińska, A.; Lesiak, A.; Narbutt, J.; Jarosławski, J.; Sobolewski, P.S.; Rajewska-Więch, B.; Wink, J. 24 hour forecast of the surface UV for the antipsoriatic heliotherapy in Poland. J. Photochem. Photobiol. B Biol. 2015, 148, 136–144. [Google Scholar] [CrossRef]
  38. Bowszyc-Dmochowska, M. Fototerapia w dermatologii. Przew. Lek. 2006, 7, 85–91. [Google Scholar]
  39. Vähävihu, K.; Ylianttila, L.; Salmelin, R.; Lamberg-Allardt, C.; Viljakainen, H.; Tuohimaa, P.; Reunala, T.; Snellman, E. Heliotherapy improves vitamin D balance and atopic dermatitis. Br. J. Dermatol. 2008, 158, 1323–1328. [Google Scholar] [CrossRef]
  40. Kudish, A.; Marsakova, A.; Jahn, I.; Gkalpakiotis, S.; Arenberger, P.; Harari, M. Dead Sea ultraviolet climatotherapy for children with atopic dermatitis. Photodermatol. Photoimmunol. Photomed. 2016, 32, 254–261. [Google Scholar] [CrossRef] [PubMed]
  41. Kuchcik, M.; Błażejczyk, K.; Szmyd, J.; Milewski, P.; Błażejczyk, A.; Baranowski, J. Potencjał Leczniczy Klimatu Polski; Wydawnictwo Akademickie SEDNO, Instytut Geografii i Przestrzennego Zagospodarowania PAN: Warsaw, Poland, 2013; p. 272. [Google Scholar]
  42. Holick, M.F. Vitamin D deficiency. N. Engl. J. Med. 2007, 357, 266–281. [Google Scholar] [CrossRef]
  43. Baggerly, C.A.; Cuomo, R.E.; French, C.B.; Garland, C.F.; Gorham, E.D.; Grant, W.B.; Heaney, R.P.; Holick, M.F.; Hollis, B.W.; McDonnell, S.L.; et al. Sunlight and vitamin D: Necessary for public health. J. Am. Coll. Nutr. 2015, 34, 359–365. [Google Scholar] [CrossRef] [Green Version]
  44. Kuczmarski, M. Usłonecznienie Polski i jego przydatność dla helioterapii. Dok. Geogr. 1990, 4, 67. [Google Scholar]
  45. Matzarakis, A.; Rutz, F.; Mayer, H. Modelling radiation fluxes in simple and complex environments: Basics of the RayMan model. Int. J. Biometeorol. 2010, 54, 131–139. [Google Scholar] [CrossRef] [Green Version]
  46. Krüger, E.L.; Minella, F.O.; Rasia, F. Impact of urban geometry on outdoor thermal comfort and air quality from field measurements in Curitiba, Brazil. Build. Environ. 2011, 46, 621–634. [Google Scholar] [CrossRef]
  47. Perini, K.; Magliocco, A. Effects of Vegetation, Urban Density, Building Height, and Atmospheric Conditions on Local Temperatures and Thermal Comfort. Urban For. Urban Green. 2014, 13, 495–506. [Google Scholar] [CrossRef]
  48. Cetin, M.; Adiguzel, F.; Kaya, O.; Sahap, A. Mapping of bioclimatic comfort for potential planning using GIS in Aydin. Environ. Dev. Sustain. 2018, 20, 361–375. [Google Scholar] [CrossRef]
  49. Roth, M.; Oke, T.R.; Emery, W.J. Satellite-derived urban heat island from three coastal cities and the utilization of such data in urban climatology. Int. J. Remote Sens. 1989, 10, 1699–1720. [Google Scholar] [CrossRef]
  50. Matzarakis, A.; Matuschek, O. Sky view factor as a parameter in applied climatology—Rapid estimation by the SkyHelios model. Meteorol. Z. 2011, 20, 39–45. [Google Scholar] [CrossRef]
  51. Eliasson, I. Infrared thermography and urban temperature patterns. Int. J. Remote Sens. 1992, 13, 869–879. [Google Scholar] [CrossRef]
  52. Parlow, E. Remotely-sensed heat fluxes of urban areas. In Biometeorologzy and Urban Climatology at the Turn of the Millennium; de Dear, R.J., Kalma, J.D., Oke, T.R., Auliciems, A., Eds.; World Meteorological Organization Tech. Doc.: Geneva, Switzerland, 1999; Volume 1026, pp. 523–528. [Google Scholar]
  53. Voogt, J.A.; Grimmond, C.S.B. Modeling surface sensible heat flux using surface radiative temperatures in a simple urban area. J. Appl. Meteorol. 2000, 39, 1679–1699. [Google Scholar] [CrossRef]
  54. Montero-Martín, J.; Antón, M.; Vaquero-Martínez, J.; Sanchez-Lorenzo, A. Comparison of long-term solar radiation trends from CM SAF satellite products with ground-based data at the Iberian Peninsula for the period 1985–2015. Atmos. Res. 2020, 236, 104839. [Google Scholar] [CrossRef]
  55. Lindfors, A.V.; Hertsberg, A.; Riihelä, A.; Carlund, T.; Trentmann, J.; Müller, R. On the Land-Sea Contrast in the Surface Solar Radiation (SSR) in the Baltic Region. Remote Sens. 2020, 12, 3509. [Google Scholar] [CrossRef]
  56. Kulesza, K. Spatiotemporal variability and trends in global solar radiation over Poland based on satellite-derived data 1986–2015. Int. J. Climatol. 2020, 40, 6526–6543. [Google Scholar] [CrossRef]
  57. Dryglas, D. Kształtowanie Produktu Turystycznego Uzdrowisk w Polsce; Wydawnictwo Uniwersytetu Jagiellońskiego: Krakow, Poland, 2006; pp. 63–65. [Google Scholar]
  58. Golba, J.; Rymarczyk-Wajda, K. (Eds.) Europejskie Ustawy Uzdrowiskowe; Stowarzyszenie Gmin Uzdrowiskowych RP: Krynica-Zdrój, Poland, 2008. [Google Scholar]
  59. Golba, J. Stan prawny uzdrowisk polskich w porównaniu ze stanem prawnym uzdrowisk w krajach Unii Europejskiej - wyzwania, jakie stoją przed Rządem i środowiskiem uzdrowiskowym. Biul. Inf. SGU RP 2003, 2–3, 16. [Google Scholar]
  60. Ustawa z Dnia 28 lipca 2005 r. o Lecznictwie Uzdrowiskowym, Uzdrowiskach i Obszarach Ochrony Uzdrowiskowej Oraz o Gminach Uzdrowiskowych, Dz.U. 2005, Nr 167, Poz. 1399. Available online: isap.sejm.gov.pl (accessed on 14 December 2020).
  61. Rozporządzenie Ministra Zdrowia z Dnia 13 Kwietnia 2006 r. w Sprawie Zakresu Badań Niezbędnych do Ustalenia Właściwości Leczniczych Naturalnych Surowców Leczniczych i Właściwości Leczniczych Klimatu, Kryteriów ich Oceny Oraz Wzoru Świadectwa Potwierdzającego te Właściwości, Dz.U. 2006, Nr 80, poz. 565. Available online: isap.sejm.gov.pl (accessed on 14 December 2020).
  62. Kulesza, K. Wpływ Cyrkulacji Atmosferycznej na ilość Promieniowania Słonecznego Docierającego do Powierzchni Ziemi w Polsce. Ph.D. Thesis, Warsaw University, Warsaw, Poland, 2019. [Google Scholar]
  63. Boehner, J.; Antonić, O. Land Surface Parameters Specific to Topo-Climatology. In Geomorphometry—Concepts, Software, Applications; Hengl, T., Reuter, H.I., Eds.; Elsevier Science: Amsterdam, The Netherlands, 2009; Volume 33, pp. 195–226. [Google Scholar]
  64. Ustawa z Dnia 20lipca 2017 r.—Prawo Wodne, Dz.U. 2017, Poz. 1566. Available online: isap.sejm.gov.pl (accessed on 14 December 2020).
  65. The Weather Station Employee; (The Institute of Meteorology and Water Management—National Research Institute, Kołobrzeg-Dźwirzyno, Poland). Personal communication, 2021.
  66. Barbero, F.J.; López, G.; Batlles, F.J. Determination of daily solar ultraviolet radiation using statistical models and artificial neural networks. Ann. Geophys. 2006, 24, 2105–2114. [Google Scholar] [CrossRef] [Green Version]
  67. Bilbao, J.; Miguel, A. Estimation of UV-B irradiation from total global solar meteorological data in central Spain. J. Geophys. Res. 2010, 115, D00I09. [Google Scholar] [CrossRef] [Green Version]
  68. Habte, A.; Sengupta, M.; Gueymard, C.A.; Narasappa, R.; Rosseler, O.; Burns, D.M. Estimating Ultraviolet Radiation From Global Horizontal Irradiance. IEEE J. Photovolt. 2018, 99, 1–8. [Google Scholar] [CrossRef]
  69. Feranec, J.; Hazeu, G.; Christensen, S.; Jaffrain, G. Corine land cover change detection in Europe (case studies of the Netherlands and Slovakia). Land Use Policy 2007, 24, 234–247. [Google Scholar] [CrossRef]
  70. Kalagirou, S.A. Solar Energy Engineering. Processes and Systems, 2nd ed.; Elsevier: Oxford, UK, 2014; p. 819. [Google Scholar]
  71. Uchwała Nr 260.XXVIII.2012 Rady Miejskiej Jeleniej Góry z dnia 9 lipca 2012 r.w Sprawie Nadania Statutu Uzdrowiska Cieplice. Available online: www.bip.um-jeleniagora.dolnyslask.pl (accessed on 14 December 2020).
  72. Uchwała Nr XL/526/13 Rady Miasta Kołobrzeg z dnia 26 listopada 2013 r.w sprawie uchwalenia Statutu Uzdrowiska Kołobrzeg D.U. Woj. Zachodniopomorskiego Nr 4481 z dnia 13 grudnia 2013. Available online: e-dziennik.szczecin.uw.gov.pl (accessed on 14 December 2020).
  73. Heymann, Y.; Steenmans, C.; Croisille, G.; Bossard, M. CORINE Land Cover. Technical Guide; Office for Official Publications of the European Communities: Luxembourg, 1994; p. 136. [Google Scholar]
  74. Phillips, S.J.; Anderson, R.P.; Schapire, R.E. Maximum entropy modeling of species geographic distributions. Ecol. Model. 2006, 190, 231–259. [Google Scholar] [CrossRef] [Green Version]
  75. Phillips, S.J.; Dudik, M. Modeling of species distributions with Maxent: New extensions and a comprehensive evaluation. Ecography 2008, 31, 161–175. [Google Scholar] [CrossRef]
  76. Saatchi, S.; Buermann, W.; Steege, H.; Mori, S.; Smith, T.B. Modeling distribution of Amazonian tree species and diversity using remote sensing measurements. Remote Sens. Environ. 2008, 112, 2000–2017. [Google Scholar] [CrossRef]
  77. Bosino, A.; Giordani, P.; Queneherve, G.; Maerker, M. Assessment of calanchi and rill-interrill erosion susceptibilities using terrain analysis and geostochastics: A case study in the Oltrepo Pavese, Northern Apennines, Italy. Earth Surf. Process. Landf. 2020, 45, 3025–3041. [Google Scholar] [CrossRef]
  78. Tarini, M.; Cignoni, P.; Montani, C. Ambient Occlusion and Edge Cueing to Enhance Real Time Molecular Visualization. IEEE Trans. Vis. Comput. Graph. 2006, 12, 1237–1244. [Google Scholar] [CrossRef] [PubMed]
  79. Zevenbergen, L.W.; Thorne, C.R. Quantitative analysis of land surface topography. Earth Surf. Process. Landf. 1987, 12, 47–56. [Google Scholar] [CrossRef]
  80. Koethe, R.; Lehmeier, F. SARA—System zur Automatischen Relief-Analyse. User Manual, 2nd ed.; unpublished.
  81. Phillips, S.J.; Dudík, M.; Elith, J.; Graham, C.H.; Lehmann, A.; Leathwick, J.; Ferrier, S. Sample selection bias and presence-only distribution models: Implications for background and pseudo-absence data. Ecol. Appl. 2009, 19, 181–197. [Google Scholar] [CrossRef] [PubMed] [Green Version]
  82. Fielding, A.H.; Bell, J.F. A Review of Methods for the Assessment of Prediction Errors in Conservation Presence/Absence Models. Environ. Conserv. 1997, 24, 38–49. [Google Scholar] [CrossRef]
  83. Hosmer, D.W.; Lemeshow, S. Applied Logistic Regression, 3rd ed.; Wiley: New York, NY, USA, 2000; p. 528. [Google Scholar]
  84. Sanchez-Lorenzo, A.; Brunetti, M.; Calbo, J.; Martin-Vide, J. Recent spatial and temporal variability and trends of sunshine duration over the Iberian Peninsula from a homogenized data set. J. Geophys. Res. 2007, 112, D20115. [Google Scholar] [CrossRef] [Green Version]
  85. Matuszko, D. Usłonecznienie w miastach na przykładzie wybranych stacji w Europie. Acta Geogr. Lodz. 2016, 104, 45–56. [Google Scholar]
  86. Matuszko, D.; Celiński-Mysław, D.; Soroka, J. Usłonecznienie w Arktyce Europejskiej i Grenlandii na podstawie danych z wybranych stacji strefy polarnej. Probl. Klimatol. Polarn. 2015, 25, 127–138. [Google Scholar]
  87. Żmudzka, E. Wybrane cechy zmienności zachmurzenia nad Polską. Pr. Studia Geogr. 2014, 56, 231–249. [Google Scholar]
  88. Sypniewska, L.; Szyga-Pluta, K. Zmienność czasowa i zróżnicowanie przestrzenne zachmurzenia w Polsce w latach 2001–2016. Bad. Fizjogr. 2018, IX, 193–213. [Google Scholar]
  89. Krzyścin, J.W.; Jarosławski, J.; Rajewska-Więch, B.; Sobolewski, P.S.; Narbutt, J.; Lesiak, A.; Pawlaczyk, M. Effectiveness of heliotherapy for psoriasis clearance in low and mid-latitudinal regions: A theoretical approach. J. Photochem. Photobiol. B Bio. 2012, 115, 35–41. [Google Scholar] [CrossRef] [PubMed]
  90. Harańczyk, A. Przemiany w użytkowaniu gruntów w miastach wojewódzkich w latach 2010 i 2014. Studia Miej. 2015, 18, 131–146. [Google Scholar]
  91. Rudewicz, J. Zmiany kierunków użytkowania gruntów ze szczególnym uwzględnieniem terenów przemysłowych w wielkich miastach Polski i ich otoczeniu w latach 2005 i 2009–2014. Prace Kom. Geogr. Przem. Pol. Tow. Geogr. 2016, 30, 122–141. [Google Scholar]
  92. Voogt, J.A.; Oke, T.R. Thermal remote sensing of urban climates. Remote Sens. Environ. 2003, 86, 370–384. [Google Scholar] [CrossRef]
  93. Ali-Toudert, F.; Mayer, H. Effects of asymmetry, galleries, overhanging façades and vegetation on thermal comfort in urban street canyons. Solar Enger. 2007, 81, 742–754. [Google Scholar] [CrossRef]
  94. Mills, G. The radiative effects of building groups on single structures. Energy Build. 1997, 25, 51–61. [Google Scholar] [CrossRef]
  95. Arnfield, A.J. Two decades of urban climate research: A review of turbulence, exchanges of energy and water, and the urban heat island. Int. J. Climatol. 2003, 23, 1–26. [Google Scholar] [CrossRef]
  96. Bärring, L.; Mattsson, J.O.; Lindqvist, S. Canyon geometry, street temperatures and urban heat island in malmö, sweden. J. Climatol. 1985, 5, 433–444. [Google Scholar] [CrossRef]
  97. Bridgman, H.; Warner, R.; Dodson, J. Urban Biophysical Environment; Oxford University Press: Oxford, UK, 1995; p. 152. [Google Scholar]
  98. Thorsson, S.; Lindqvist, M.; Lindqvist, S. Thermal bioclimatic conditions and patterns of behaviour in an urban park in Göteborg, Sweden. Int. J. Biometeorol. 2004, 48, 149–156. [Google Scholar] [CrossRef]
  99. Zeren-Cetin, I.; Sevik, H. Investigation of the relationship between bioclimatic comfort and land use by using GIS and RS techniques in Trabzon. Environ. Monit. Assess. 2020, 192, 71. [Google Scholar] [CrossRef]
  100. Schuh, A. Climatotherapy. Experientia 1993, 49, 947–956. [Google Scholar] [CrossRef] [Green Version]
Figure 1. Study area: (A)—Cieplice, (B)—Kołobrzeg: (a) numerical land cover model, in m a.s.l.; (b) CORINE CLC, types: 1.1.2 Discontinuous urban fabric; 1.2.3 Port areas; 1.2.4 Airports; 1.4.2 Sport and leisure facilities; 2.1.1 Non-irrigated arable land; 2.3.1 Pastures; 2.4.2 Complex cultivation patterns; 2.4.3 Land principally occupied by agriculture, with significant areas of natural vegetation; 3.1.1 Broad-leaved forest; 3.1.2 Coniferous forest; 3.1.3 Mixed forest; 5.1.2 Water bodies; 5.2.3 Sea and ocean.
Atmosphere 12 00383 g001
Figure 2. Annual sums of actual sunshine duration in Cieplice and Kołobrzeg in the years 1996–2015.
Atmosphere 12 00383 g002
Figure 3. Actual sunshine duration sums in the seasons. Average values for Cieplice and Kołobrzeg for the years 1996–2015.
Atmosphere 12 00383 g003
Figure 4. The annual course of the average daily amounts of actual sunshine duration in Cieplice and Kołobrzeg. Average values for months for the years 1996–2015.
Atmosphere 12 00383 g004
Figure 5. The annual course of relative sunshine duration in Cieplice and Kołobrzeg. Average values for the years 1996–2015.
Atmosphere 12 00383 g005
Figure 6. The annual course of the number of days for 5 classes of relative sunshine duration in Cieplice and Kołobrzeg. Average values for the years 1996–2015: (a)—sunless days, (b)—cloudy days, (c)—moderately sunny days, (d)—sunny days, (e)—very sunny days.
Atmosphere 12 00383 g006
Figure 7. Annual sums of global solar radiation in Cieplice and Kołobrzeg in the years 1996–2015.
Atmosphere 12 00383 g007
Figure 8. The annual course of the monthly mean sums of global solar radiation in Cieplice and Kołobrzeg. Data for the years 1996–2015.
Atmosphere 12 00383 g008
Figure 9. Histogram of daily sums of global solar radiation in June in Cieplice and Kołobrzeg. Data for the years 1996–2015.
Atmosphere 12 00383 g009
Figure 10. Histogram of daily sums of global solar radiation in December in Cieplice and Kołobrzeg. Data for the years 1996–2015.
Atmosphere 12 00383 g010
Figure 11. Daily course of hourly sums of global solar radiation in Cieplice and Kołobrzeg. Average values for December and June for the years 1996–2015.
Atmosphere 12 00383 g011
Figure 12. The maximum height of the sun in the following days of the year in Cieplice and Kołobrzeg.
Atmosphere 12 00383 g012
Figure 13. Spatial distribution of monthly sums of global solar radiation [in kWh·m−2] calculated based on DEM: (a) for distinct periods (I, IV, VIII, X) against the background of the annual course (b) and correlation with actual actinometric data, for Cieplice (A) and Kołobrzeg (B).
Atmosphere 12 00383 g013
Figure 14. The course of average monthly sums of global solar radiation [in kWh·m−2] for individual types of land cover (CLC) for the Cieplice (a) and Kołobrzeg (b) health resorts.
Atmosphere 12 00383 g014
Figure 15. The annual course of the values of the probability index between the parameters supplying the model (AHM, ASP, CONV-IND, SLP) and the average monthly values of global solar radiation [in kWh·m−2] for Cieplice (a) and Kołobrzeg (b).
Atmosphere 12 00383 g015
Figure 16. Percentage share in the model of topographic indicators (A) and spatial distribution of AUC values (B) along with the percentage of the area in the given AUC ranges (C) for (a) Cieplice and (b) Kołobrzeg.
Atmosphere 12 00383 g016
Table 1. Model of topographic indicators and related references.
No.PredictorCodeUnitMeanReferences
1Analytical Hillshading max *AHMRad0.781[78]
2AspectASPRad3.063[79]
3Convergence IndexCONV-IND-−0.002[80]
4SlopeSLPRad0.367[79]
* taking into account the maximum solar altitude.
Table 2. The number of compact sunless periods of at least 5 days in Cieplice in the years 1996–2015.
MonthsSunless Period (Days)Amount of Sunless Periods (>5 Days)
5–78–1011–1314–16
I22004
II50005
III20002
IV00000
V00000
VI00000
VII00000
VIII00000
IX00000
X20002
XI40004
XII1100011
2620028
Table 3. The number of compact sunless periods of at least 5 days in Kołobrzeg in the years 1996–2015.
MonthsSunless Period (Days)Amount of Sunless Periods (>5 Days)
5–78–1011–1314–16
I1041015
II730010
III10001
IV00000
V00000
VI00000
VII00000
VIII00000
IX00000
X30003
XI820111
XII1631020
45122160
Publisher’s Note: MDPI stays neutral with regard to jurisdictional claims in published maps and institutional affiliations.

