Abstract
Stratospheric water vapor (SWV) changes play an important role in regulating global climate change, and its variations are controlled by tropopause temperature. This study estimates the impacts of tropopause layer ozone changes on tropopause temperature by radiative process and further influences on lower stratospheric water vapor (LSWV) using the Whole Atmosphere Community Climate Model (WACCM4). It is found that a 10% depletion in global (mid-low and polar latitudes) tropopause layer ozone causes a significant cooling of the tropical cold-point tropopause with a maximum cooling of 0.3 K, and a corresponding reduction in LSWV with a maximum value of 0.06 ppmv. The depletion of tropopause layer ozone at mid-low latitudes results in cooling of the tropical cold-point tropopause by radiative processes and a corresponding LSWV reduction. However, the effect of polar tropopause layer ozone depletion on tropical cold-point tropopause temperature and LSWV is opposite to and weaker than the effect of tropopause layer ozone depletion at mid-low latitudes. Finally, the joint effect of tropopause layer ozone depletion (at mid-low and polar latitudes) causes a negative cold-point tropopause temperature and a decreased tropical LSWV. Conversely, the impact of a 10% increase in global tropopause layer ozone on LSWV is exactly the opposite of the impact of ozone depletion. After 2000, tropopause layer ozone decreased at mid-low latitudes and increased at high latitudes. These tropopause layer ozone changes at different latitudes cause joint cooling in the tropical cold-point tropopause and a reduction in LSWV. Clarifying the impacts of tropopause layer ozone changes on LSWV clearly is important for understanding and predicting SWV changes in the context of future global ozone recovery.
1. Introduction
As an important greenhouse gas (GHG), stratospheric water vapor (SWV) changes have attracted much attention [1,2,3] and play an important role in regulating the global radiation budget, energy balance, stratospheric temperature and chemical process, and global climate change [4,5,6]. This is highlighted by studies such as the work of Solomon et al. [7], which showed how SWV fluctuations may modulate decadal global surface warming. Therefore, understanding the variations and controlling processes of SWV is critically important for predicting global climate change.
It has been recognized that SWV may respond to tropospheric and surface climate changes through a variety of mechanisms. Tropical tropopause temperature is the main factor controlling tropical SWV through dehydration [1, 8, 9, 10, 11], as determined by radiative, chemical, and dynamical processes in the tropical tropopause layer (TTL) [12,13]. These coupling processes are largely related to the exchange of air masses and minor constituents (e.g., water vapor and ozone) across the tropopause layer. The water vapor in the lower and middle stratosphere mainly comes from the transport of water vapor in the troposphere into the stratosphere through upwelling from the TTL in the tropics [14,15]. It is widely agreed that the water vapor entering the stratosphere mainly in the tropics is limited to a few parts per million by volume (ppmv) due to the intense dehydration process that occurs in the TTL due to the extremely low temperatures near the tropical tropopause [16]. The tropopause temperature is driven by radiative processes [17,18], equatorial planetary waves, including tropical Rossby and Kelvin waves [10], variations in the stratospheric Brewer–Dobson (BD) circulation driven by extratropical stratospheric waves [19,20], and so forth.
Many studies have investigated the variations and direct controlling factors of tropopause temperature, including the El Niño–Southern Oscillation (ENSO), sea surface temperature (SST) of the tropical central Pacific, and quasi-biennial oscillation (QBO). ENSO and QBO can act as the primary perturbation of TTL temperature, influencing lower stratospheric water vapor (LSWV) on interannual time scales [21,22,23]. During El Niño phases, enhanced tropical upwelling warms the upper troposphere and cools the lower stratosphere in the tropics [24,25], thus influencing large-scale tropical water vapor concentrations [11,26,27]. Due to the different propagation and dissipation patterns of ultralong Rossby waves in the middle-latitude stratosphere, ENSO Modoki can cause changes in the tropopause temperature and induce SWV anomalies, although the influences of ENSO Modoki are smaller than those of canonical ENSO events [10,27]. The tropopause temperature variations associated with the QBO drive a ~2-year cycle of interannual water vapor anomalies near the TTL, and these anomalies propagate vertically and latitudinally with mean stratospheric transport circulation (in a manner similar to the seasonal “tape recorder”) [28]. In addition, Ding and Fu [29] found that SST warming in the tropical central Pacific cools the TTL by enhancing equatorial-wave-induced upward motion near the tropopause, thereby reducing the amount of water vapor entering the stratosphere.
There are also some studies on the effects of chemical composition changes on tropopause temperature. As an important GHG, ozone absorbs ultraviolet and terrestrial infrared radiation through radiative processes, and adjusting its distribution can change the mean temperatures of both the stratosphere and troposphere [30]. Steinbrecht et al. [31] showed that a high tropopause is correlated with a low total ozone, and a low tropopause is correlated with a high total ozone, as well as tropopause temperature [32,33]. Xie et al. [34] showed that a 15% global ozone decrease can induce lower tropopause temperatures and hence decrease stratospheric water vapor using a general circulation model. However, these studies mainly focused on the responses of global ozone variations to TTL temperature and LSWV. The effect of regional ozone changes has received less attention. Approximately 90% of ozone is found in the stratosphere and only 10% in the troposphere. The distributions of tropospheric ozone strongly impact radiative heating fields and stratospheric dynamics, which have been demonstrated to be important for long-range weather forecasts and climate change predictions [35,36]. In particular, changes in tropopause layer ozone most directly affect the tropopause temperature.
Chipperfield et al. [37] showed that global ozone started to recover gradually and was able to return to its original level after 2000 using 3D chemistry–climate models. It is necessary to investigate the percentage change in ozone per decade for the period of 2000–2020. Figure 1a shows that during the 2010–2019 period, ozone increased by ~7% in the polar tropopause layer and decreased by ~7% in the tropopause layer at mid-low latitudes compared to that observed in 2000–2009. It is worth noting that the radiative forcing per molecule of ozone is greatest in the upper troposphere. Although tropopause layer ozone increased and decreased at different latitudes after 2000, it will eventually return to its original levels in the coming decades. It is well known that tropopause temperature is the main factor controlling tropical SWV through dehydration. Many studies have investigated the impact factors of tropopause temperature variations by dynamical processes, including ENSO [24], SST of the tropical central Pacific [29], and QBO [28]. However, radiation processes can also affect the tropopause temperature; for example, changes of tropopause layer ozone can directly affect the tropopause temperature. Some studies researched the effects of global uniform ozone changes on tropopause temperature and SWV [34]. However, the tropopause ozone variability at different latitudes is not uniform, and the effect of regional ozone changes on tropopause temperature and SWV has received less attention. Here, we study the effects of changes in tropopause layer ozone at different latitude under three cases (tropopause layer ozone depletion, recovery, and actual change after 2000). This will further help us to understand the mechanism of SWV change. We perform a series of time-slice runs to investigate the potential impacts of tropopause layer ozone changes on TTL temperature and LSWV using the Whole Atmosphere Community Climate Model (WACCM4) in this paper. A change in tropopause layer ozone will affect TTL temperature via feedback, thus circulating by changing the radiative heating rate and the temperature gradient. We will focus on the radiative–dynamic effect of tropopause layer ozone on TTL temperature and LSWV; its chemical effect and associated feedbacks are not considered. To understand the potential impact of tropopause layer ozone changes on TTL temperature and LSWV, we use different prescribed changes in tropopause layer ozone. Climate responses to prescribed ozone changes are compared to corresponding responses to clarify the relative importance of tropopause layer ozone changes. The paper is organized as follows: Section 2 gives a brief description of the data, models, and numerical experiments. Section 3 presents the TTL temperature and LSWV responses to prescribed tropopause layer ozone changes, while Section 4 gives our conclusions.
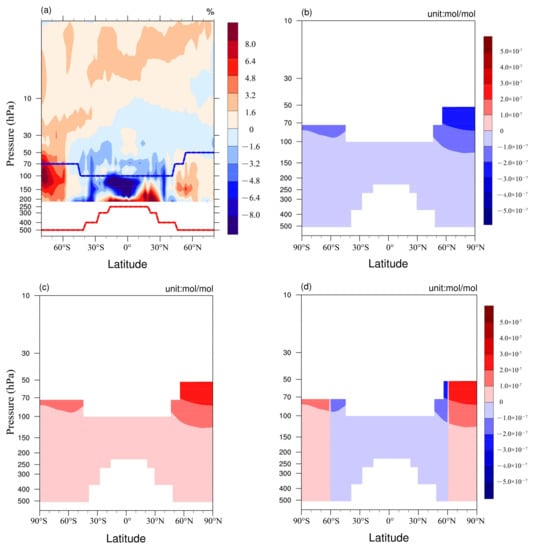
Figure 1.
(a) Percentage change in ozone for the period of 2010–2019 relative to 2000–2009 based on SWOOSH data; the range of tropopause height (between CPT (blue line) and LRM (red line)) is calculated from 1979 to 2019 based on NCEP2 data, (b) tropopause layer ozone decreased by 10% in WACCM4 model, (c) tropopause layer ozone increased by 10% in WACCM4 model, (d) tropopause layer ozone decreased by 10% at mid-low latitudes and increased by 10% at high latitudes in WACCM4 model. Percentage change is obtained by .
2. Data and Simulations
Monthly mean ozone is taken from the Stratospheric Water and Ozone Satellite Homogenized (SWOOSH) dataset, which is a merged record of stratospheric ozone and water vapor measurements taken by several limb-sounding and solar occultation satellites over the period from 1984 to 2013 [38]. Its primary product is a monthly mean zonal–mean gridded dataset (2.5° from 89° S to 89° N) containing ozone and water vapor data from the SAGE-II/III, UARS HALOE, UARS MLS, and Aura MLS instruments. The vertical pressure range of the ozone data is 316–1 hPa (31 levels). For more information, see Davis et al. [38].
The monthly mean meteorological fields used in this study are derived from the National Centers for Environmental Predictions, version 2 (NCEP2) reanalysis dataset, with a resolution of 2.5° latitude × 2.5° longitude, from 1979 to 2019 [39]. NCEP2 reanalysis data are an improved version of the NCEP1 model with more up-to-date physics and corrections of known errors in NCEP1 [39,40].
WACCM4 is part of the Community Earth System Model (CESM) framework developed by the National Center for Atmospheric Research [41]. In this study, we use version CESM1.0.6. WACCM4 also encompasses the Community Atmospheric Model version 4 (CAM4) and as such includes all of its physical parameterizations [42]. This improved version of WACCM uses a coupled system made up of four components, namely, atmosphere, ocean [43], land, and sea ice [44]. WACCM4 uses a finite-volume dynamical core, with 66 vertical levels extending from the ground to 5.1 × 10⁻⁶ hPa (~145 km geometric altitude) and a vertical resolution of 1.1–1.4 km in the tropical tropopause layer and lower stratosphere (located below a height of 30 km). The simulations presented in this paper are performed at a horizontal resolution of 1.9° × 2.5° and include the specified chemistry [45]. More details about WACCM4 are available in Marsh et al. [46].
Adopting the same definition as Gettelman et al. [47], the tropopause layer can be defined in the following three ways: cold-point tropopause (CPT), lapse-rate tropopause (LRT), and lapse-rate minimum (LRM). The temperature of the tropospheric atmosphere decreases with increasing altitude, but the stratospheric atmosphere temperature changes in the opposite direction. At the altitude where the troposphere and stratosphere meet, there is bound to be a minimum temperature, which is referred to as the cold point. This altitude is defined as the CPT, which is the upper boundary of the tropopause layer. LRT is defined by the World Meteorological Organization (WMO) as the lowest altitude at which the lapse rate of temperature does not exceed 2 K·km−1, and the lapse rate of temperature within 2 km of that altitude does not exceed 2 K·km−1 (). LRM is the height at which the minimum rate of potential temperature change () is located and represents the lower boundary of the tropopause layer. Figure 1a shows the range of tropopause layer heights (between the blue line and red line) from 1979 to 2019 based on the NCEP2 data. Eight time-slice runs were performed for this study, and the tropopause layer (see the range in Figure 1b–d) ozone change scenarios in each experiment are listed in Table 1. R0 is the control experiment, and R1 to R7 are the sensitive experiments. The experiments (R1 to R3) estimate the influence of pasted tropopause layer ozone depletion. R4 to R6 are used to analyze the response of future tropopause layer ozone recovery. R7 is used to observe anomalies caused by tropopause layer ozone changes after 2000 based on SWOOSH data (Figure 1a,d). Eight time-slice experiments (R0 to R7) are run for 43 years, with the first 3 years excluded for model spin-up; only the last 40 years are used.

Table 1.
CESM-WACCM4 experiments with various specified ozone forcings.
The following approximation [48] determines the effective number () of degrees of freedom (Bretherton et al. [49]) in this paper:
where N is the sample size and and are the autocorrelations of two sampled time series, X and Y, at time lag j, respectively.
3. Results
3.1. LSWV Responses to Tropopause Layer Ozone Depletion
Since atmospheric ozone has been depleting over the past few decades, we designed experiments (R1 to R3, see Table 1) to explore the influence of pasted tropopause layer ozone depletion on the tropopause and LSWV. Ozone absorbs ultraviolet and infrared radiation [50,51], so changes in ozone concentrations may directly influence atmospheric temperature through radiative processes. Figure 2 shows the responses of the cold-point tropopause temperature between 45° N and 45° S to prescribed tropopause layer ozone changes (decreased by 10%). A 10% depletion in global tropopause layer ozone (R1) causes significant cooling in the tropopause with a maximum cooling of 0.3 K at mid-low latitudes of both hemispheres; moreover, the cold-point tropopause temperature decreases more dramatically at approximately 30° S and 30° N, even exceeding 0.3 K (Figure 2a).
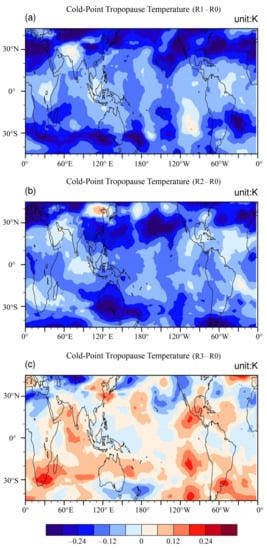
Figure 2.
Cold-point tropopause temperature differences at 45° N–45° S (a) between R1 and R0, (b) between R2 and R0, and (c) between R3 and R0. The values in the upper right corner are the units. Hatching indicates areas that are statistically significant at the 95% confidence level. Here, the statistical significance is estimated by Student’s t-statistic, which tests whether two sample populations have significantly different means (the same as follows).
It is worth noting that the impact of tropopause layer ozone depletion at mid-low latitudes may not be the same as that at high latitudes. Therefore, we designed R2 and R3 to analyze the impacts of tropopause layer ozone depletion on tropopause and LSWV at mid-low latitudes and high latitudes, respectively. Compared to experiment R0, in which tropopause layer ozone concentrations at mid-low latitudes are reduced by 10% (R2), the cold-point tropopause cooling in Figure 2b is stronger than that in Figure 2a between 30° S and 30° N. For experiment R3, only the polar tropopause layer ozone decreases by 10% compared with R0. It is interesting to note that aside from a few areas at approximately 30° N, the cold-point tropopause temperature increases in most areas and even more in the Southern Hemisphere (Figure 2c). A comparison of Figure 2a–c reveals that the depletion in tropopause layer ozone at mid-low latitudes leads to the most drastic cooling of the tropical cold-point tropopause, and the effect of polar tropopause layer ozone depletion on the tropical cold-point tropopause temperature is reversed and weaker compared to the effect of tropopause layer ozone depletion at mid-low latitudes.
It is well known that tropopause temperature is the main factor controlling tropical SWV through dehydration [1,8,9]. Figure 3 shows the change in LSWV at 100–10 hPa caused by prescribed tropopause layer ozone changes (decreased by 10%) from R1 to R3. A 10% reduction in global tropopause layer ozone (R1) leads to a maximum reduction in LSWV of approximately 0.06 ppmv with a greater reduction in the Northern Hemisphere, exceeding 0.06 ppmv (Figure 3a). In experiment R2 (tropopause layer ozone concentrations at mid-low latitudes decreased by 10%), a similar reduction in LSWV occurred in Figure 3b, which is even greater than that in Figure 3a compared to R1. Polar tropopause layer ozone decreases by 10% (R3), leading to an increase in LSWV (Figure 3c). Evidently, the magnitude of LSWV anomalies (Figure 3c) caused by polar tropopause layer ozone depletion is opposite to and smaller than that of LSWV changes influenced by the tropopause layer ozone changes in R2 (Figure 3b,c). Thus, the combined effect of tropopause layer ozone depletion at mid-low latitudes and high latitudes causes a decrease in LSWV. Here, we question how tropopause layer ozone depletion at mid-low latitudes and polar regions influences tropical cold-point tropopause temperatures and why the effects are opposite.
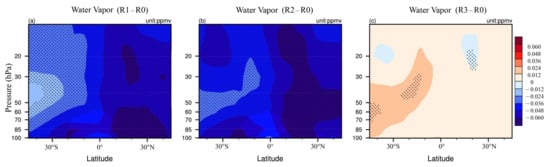
Figure 3.
Water vapor concentration differences at 100–10 hPa (a) between R1 and R0, (b) between R2 and R0, and (c) between R3 and R0. The values in the upper right corner are the units. Hatching indicates areas that are statistically significant at the 95% confidence level.
The weakening of shortwave radiation caused by the reduction in tropopause layer ozone at mid-low latitudes could be the direct cause of tropical cold-point tropopause cooling. The causes of tropical cold-point tropopause warming due to polar tropopause layer ozone depletion need to be analyzed in detail. Figure 4a shows the temperature anomalies at 150–10 hPa affected by a 10% reduction in polar tropopause layer ozone (R3), and there are negative anomalies at high latitudes and positive anomalies at mid-low latitudes (Figure 4a). These temperature anomalies in Figure 4a lead to a larger temperature gradient from the poles to the tropics. According to the thermal wind balance, the vertical shear of zonal wind is proportional to the horizontal temperature gradient. The westerly wind circumpolar circulations at both poles became stronger (Figure 4b). Figure 5a,b shows the modeled planetary wave 1 and wave 2 climatologies from the control experiment R0. The anomalies of planetary wave 1 (Figure 5c) and wave 2 (Figure 5d) are negative at high latitudes compared to the climatologies presented in Figure 5a,b, while the negative anomalies of planetary wave 1 are stronger (Figure 5c). Weakening of the activity of planetary waves 1 and 2 will lead to weakening of the vertical transport. It is well known that vertical transport may also have important effects on LSWV changes in the tropics, and stronger upwelling transports more water vapor into the stratosphere [10,52,53]. It is necessary here to examine the potential impact of tropopause layer ozone changes on vertical transport. The vertical transport process weakens (Figure 5e) due to the strengthening of the westerly wind circumpolar circulations (Figure 4b) that reduce planetary waves 1 and 2 entering the stratosphere (Figure 5c,d). The weaker diabatic expansion process around the tropopause layer resulting from weaker vertical transport (Figure 5e) causes tropical cold-point tropopause warming (Figure 2c), which then leads to an increase in tropical LSWV (Figure 3c).
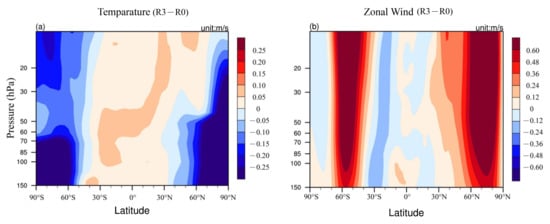
Figure 4.
(a) Temperature differences and (b) zonal wind differences at 150–10 hPa between R3 and R0. The values in the upper right corner are the units.
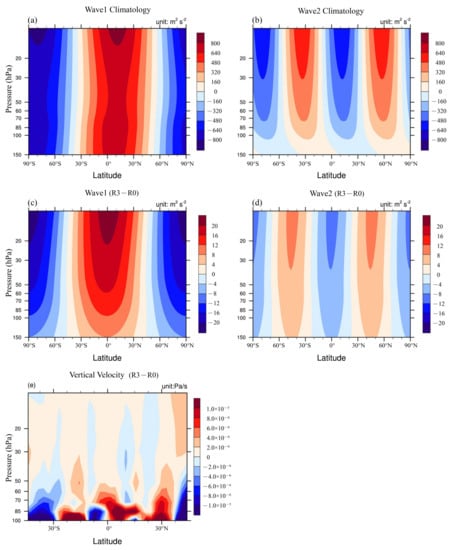
Figure 5.
(a) Planetary wave 1 climatology, (b) planetary wave 2 climatology from the control experiment R0, (c) planetary wave 1 differences, (d) planetary wave 2 differences at 150–10 hPa, (e) velocity variations ω (omega) differences at 100–10 hPa between R3 and R0. The values in the upper right corner are the unit.
3.2. LSWV Responses to Tropopause Layer Ozone Recovery
In the coming decades, global ozone will eventually return to its original level and increase thereafter [54], including tropopause layer ozone. The experiments (R4 to R6, see Table 1) estimate the impact of specified tropopause layer ozone recovery on the tropopause and LSWV. Figure 6 shows the differences in the cold-point tropopause temperature between 45° N and 45° S influenced by forced future tropopause layer ozone recovery (R4 to R6). A 10% recovery in global tropopause layer ozone (R4) results in warming in the cold-point tropopause at 45° N–45° S with a maximum value of 0.3 K (Figure 6a). Similarly, we designed R5 to explore the impacts of a 10% increase in tropopause layer ozone at mid-low latitudes on the tropopause and LSWV. When tropopause layer ozone concentrations at the mid-low latitudes are increased by 10% (R5), the pattern of cold-point tropopause temperature is consistent with that in Figure 6a, which shows a stronger warming of cold-point tropopause (Figure 6b) within the same range compared to Figure 6a. Comparing Figure 6a,b, the change in cold-point tropopause temperature is dominated by the increase in tropopause layer ozone at mid-low latitudes.
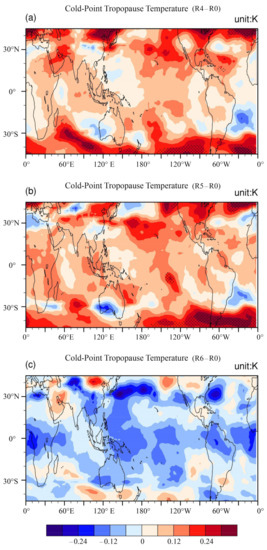
Figure 6.
Same as in Figure 2 but (a) between R4 and R0, (b) R5 and R0, and (c) R6 and R0.
Additionally, experiment R6 was designed to analyze the influence of increased polar tropopause layer ozone. Figure 6c shows that the cold-point tropopause temperature is reduced in most of the region, which is exactly opposite to the patterns of cold-point tropopause temperature shown in Figure 6a,b. The cooling in the cold-point tropopause in Figure 6c is relatively small (Figure 6c). A combined comparison of cold-point tropopause temperature anomalies in Figure 6a–c implies that cold-point tropopause temperatures are slated to significantly increase when global tropopause layer ozone is increased by 10% (R4). Tropopause layer ozone changes at polar and mid-low latitudes have the opposite effects on cold-point tropopause temperature, and polar tropopause layer ozone recovery has weaker effects on cold-point tropopause temperature. The previous analysis has shown that global tropopause layer ozone depletion leads to tropopause layer cooling and then causes a decrease in LSWV, so what will result when the global tropopause layer ozone increases?
Figure 7 shows the differences in LSWV concentrations at 100–10 hPa forced by specific tropopause layer ozone recoveries (R4 to R6). A 10% increase in global tropopause layer ozone (R4) leads to an increase in LSWV with a maximum value of 0.048 ppmv (Figure 7a). The warming of the tropopause layer allows more water vapor to enter the stratosphere. The results are consistent with Xia et al. [20], which indicated that tropopause layer warming would result in an increase in water vapor in the lower stratosphere. A 10% increase in tropopause layer ozone concentrations at mid-low latitudes (R5) leads to an increase in LSWV in all regions (Figure 7b). It is noted that the LSWV increases more in the Northern Hemisphere. A comparison of R4 to R5 shows that tropopause layer ozone recovery in specific regions would lead to an increase in LSWV by warming the cold-point tropopause. It also implies that the tropopause layer ozone changes at mid-low latitudes induce most LSWV anomalies (Figure 7b). In experiment R6 (polar tropopause layer ozone concentrations increased by 10%), decreases in LSWV in most areas were the response to polar tropopause layer ozone recovery (Figure 7c). The polar tropopause layer ozone recovery evidently contributes less to LSWV (Figure 7c), and the effects on LSWV are opposite to those on tropopause layer ozone recovery in R4 and R5 (Figure 7a,b).
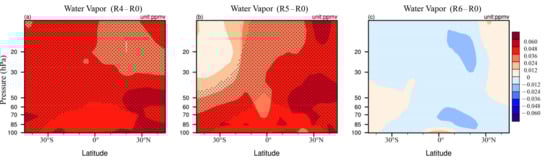
Figure 7.
Same as in Figure 3 but (a) between R4 and R0, (b) between R5 and R0, and (c) between R6 and R0.
The increase in tropopause layer ozone at mid-low latitudes leads to enhanced shortwave radiation, causing cold-point tropopause warming. Next, we further analyze the mechanism of the effect of polar tropopause layer ozone recovery on cold-point tropopause temperature. Notably, a 10% increase in polar tropopause layer ozone (R6) causes warming in polar regions and cooling at mid-low latitudes (Figure 8a), which results in a weaker temperature gradient and then leads to weaker westerly wind circumpolar circulations (Figure 8b). Then, planetary waves 1 and 2 enter the stratosphere more completely (Figure 9c,d) than those under the climatologies presented in Figure 9a,b, which leads to a stronger vertical transport process (Figure 9e). Then, the enhanced vertical transport strengthens the diabatic expansion process around the tropopause layer. Finally, the tropical cold-point tropopause temperature decreases (Figure 6c), hence leading to a decrease in tropical LSWV (Figure 7c).
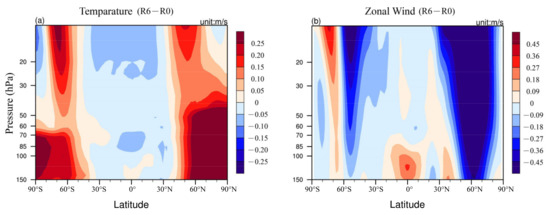
Figure 8.
Same as in Figure 4 but between R6 and R0.
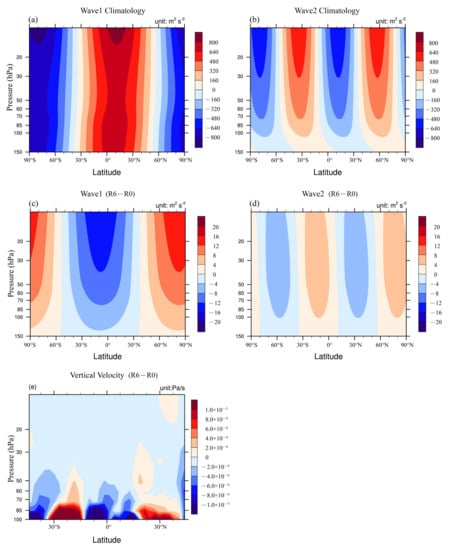
Figure 9.
Same as in Figure 5 but between R6 and R0.
3.3. LSWV Responses to Tropopause Layer Ozone Changes after 2000
Ozone-Depleting Substances (ODSs) led to a decline in stratospheric ozone starting in 1950 until they were banned by the Montreal Protocol, and since 1998, ozone in the upper stratosphere has been rising. During the 21st century, emissions of ozone precursor species, ODSs, and long-lived GHGs are expected to be the main factors controlling ozone changes and their distribution in the troposphere and stratosphere [55,56]. During the 2010–2019 period, tropopause layer ozone increased by at least 7% in the polar regions and decreased by 7% at mid-low latitudes relative to the 2000–2009 period based on the SWOOSH data (Figure 1a,d). Experiment R7 was designed to estimate the influence of tropopause layer ozone changes after 2000 on the tropopause and LSWV.
Figure 10a shows the cold-point tropopause temperature differences forced by the tropopause layer ozone changes after 2000 (R7). It is evident that the 10% decrease in tropopause layer ozone at mid-low latitudes and 10% increase in polar tropopause layer ozone caused substantial cold-point tropopause cooling between 45° S and 45° N (Figure 10a). It is worth noting that the reduction in cold-point tropopause temperature in Figure 10a is stronger than the effect of the reduction in global tropopause layer ozone on cold-point tropopause temperature (Figure 2a), and there is a maximum cold-point tropopause temperature reduction of more than 0.3 K at approximately 30° N (Figure 10a). This is likely due to the joint effect of decreased tropopause layer ozone at mid-low latitudes and increased tropopause layer ozone at high latitudes on the cold-point tropopause temperature (Figure 2b and Figure 6c). Figure 10c shows the linear addition of cold-point tropopause temperature differences in Figure 2b and Figure 6c. In general, the pattern in Figure 10c agrees with that in Figure 10a.
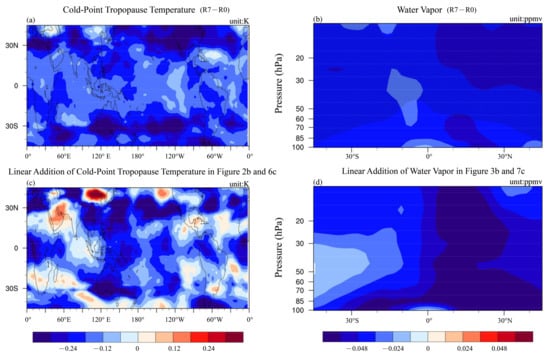
Figure 10.
(a) Cold-point tropopause temperature differences; (b) water vapor concentration differences between R7 and R0; (c) the linear addition of cold-point tropopause temperature differences in Figure 2b and Figure 6c; (d) the linear addition of water vapor concentration differences in Figure 3b and Figure 7c. The values in the upper right corner are the units.
Figure 10b shows the response of water vapor concentration differences at 100–10 hPa to the tropopause layer ozone changes after 2000 (R7). When tropopause layer ozone varies by 10% in the same tropopause range, as shown in Figure 1a,d (decreased by 10% at mid-low latitudes and increased by 10% at high latitudes), LSWV decreases with a maximum value of 0.048 ppmv (Figure 10b). The reduction in LSWV is stronger in the Northern Hemisphere than in other regions (Figure 10b); this is most likely due to the polar tropopause layer ozone increase causing a greater reduction in LSWV in the Northern Hemisphere (Figure 7c). We calculate the linear addition of water vapor concentration differences in Figure 3b and Figure 7c (Figure 10d), which show the same reduction in LSWV as in Figure 10b. In summary, the tropopause layer ozone after 2000 caused cold-point tropopause cooling, which then reduced the LSWV.
4. Conclusion and Discussion
Using the WACCM4 model, this study performs a series of time-slice runs to investigate the potential impacts of tropopause layer ozone changes on the tropopause and LSWV. A 10% depletion in global tropopause layer ozone causes significant cooling in the tropical cold-point tropopause with a maximum cooling of 0.3 K, even exceeding 0.3 K at approximately 30° S and 30° N (Figure 2a). The cold-point tropopause temperature is the main factor controlling tropical SWV. The global tropopause layer ozone depletion (decreased by 10%) leads to a maximum reduction in LSWV of approximately 0.06 ppmv, which exceeds 0.06 ppmv in the Northern Hemisphere (Figure 3a). The depletion of tropopause layer ozone at mid-low latitudes results in tropical cold-point tropopause cooling and a decrease in LSWV. It is worth noting that polar tropopause layer ozone depletion increases LSWV by warming the tropical cold-point tropopause and is weaker than the effect of tropopause layer ozone depletion at mid-low latitudes. The weakening of shortwave radiation caused by the reduction in tropopause layer ozone at mid-low latitudes is the direct cause of cold-point tropopause cooling. The causes of cold-point tropopause warming due to polar tropopause layer ozone depletion do not occur through shortwave radiation processes. The enhancement of the polar zonal wind caused by the larger temperature gradient leads to a strengthened westerly wind circumpolar circulation and weakens the activity of planetary waves 1 and 2 (Figure 5c,d). The vertical transport weakens (Figure 5e) due to the strengthening of the westerly winds that reduce the planetary waves entering the stratosphere from middle latitudes, leading to a weaker diabatic expansion process around the tropopause layer affecting tropical cold-point tropopause warming (Figure 2c). Finally, tropical LSWV is increased (Figure 3c). In the coming decades, global ozone will eventually return to its original level and increase [54], and we have estimated the impacts of specified tropopause layer ozone recovery on tropopause and LSWV. However, the changes in tropical cold-point tropopause temperature and LSWV forced by future tropopause layer ozone recovery are exactly opposite those of pasted tropopause layer ozone depletion.
Steinbrecht et al. [31] showed that a high tropopause is correlated with a low total ozone, and a low tropopause is correlated with a high total ozone, as well as tropopause temperature. There are also some studies on the effects of ozone changes on tropopause temperature. Xia et al. [20] indicated that tropopause layer warming with increased ozone would result in an increase in water vapor in the lower stratosphere. Xie et al. [34] showed that a 15% global ozone decrease will lead to lower tropopause temperatures and lower stratospheric water vapor using a general circulation model. The results of previous studies are consistent with our results. Ding and Fu [29] showed that the tropical LSWV amount exhibited a stepwise transition to a dry phase in 2000, and the enhanced equatorial waves associated with convection caused steady lowered stratospheric drying after 2000. Hegglin et al. [57] indicated that long-term trends in lower and middle stratospheric water vapor are negative. The influence of tropopause layer ozone changes after 2000 on tropopause and LSWV is also analyzed in experiment R7. When tropopause layer ozone at mid-low latitudes is decreased by 10% and polar tropopause layer ozone is increased by 10% relative to that in R0 (Figure 1d), the joint effect cools the tropical cold-point tropopause and decreases LSWV. However, the exact status of the contribution of tropopause layer ozone changes to tropical LSWV is not known. Additionally, the joint effect of tropopause layer ozone at mid-low latitudes and polar latitudes is sometimes strong (Figure 3a) and sometimes weak (Figure 7a), and the reasons are not clear. We will continue to study the problems presented in this article in the future.
Author Contributions
Formal analysis, J.L. (Jinpeng Lu); Funding acquisition, F.X., H.T., and J.L. (Jiali Luo); Methodology, J.L. (Jinpeng Lu), and F.X.; Writing—original draft, J.L. (Jinpeng Lu); Writing—review & editing, J.L. (Jinpeng Lu), F.X., H.T., and J.L. (Jiali Luo). All authors have read and agreed to the published version of the manuscript.
Funding
This work is supported by the National Natural Science Foundation of China (41875046, 41975047, and 42075060).
Institutional Review Board Statement
Not applicable.
Informed Consent Statement
Not applicable.
Data Availability Statement
The SWOOSH data analyzed during the current study are publicly available at https://www.esrl.noaa.gov/csd/groups/csd8/swoosh (accessed on 19 February 2021). The NCEP2 data is available at https://psl.noaa.gov/data/gridded/data.ncep.reanalysis2.gaussian.html (accessed on 19 February 2021). The WACCM4 data is available at https://zenodo.org/record/4556906#.YDUX1jSwPIU (accessed on 19 February 2021).
Acknowledgments
The authors thank NCAR for providing the WACCM4 model (https://www2.cesm.ucar.edu/models/current (accessed on 19 February 2021)).
Conflicts of Interest
The authors declare no conflict of interest.
References
- Dessler, A.; Schoeberl, M.; Wang, T.; Davis, S.; Rosenlof, K. Stratospheric Water Vapor Feedback. Proc. Natl Acad. Sci. USA 2013, 110, 18087–18091. [Google Scholar] [CrossRef]
- Forster, P.M. Radiative Forcing Due to Stratospheric Ozone Changes 1979–1997, Using Updated Trend Estimates. J. Geophys. Res. Atmos. 1999, 104, 24395–24399. [Google Scholar] [CrossRef]
- Banerjee, A.; Chiodo, G.; Previdi, M.; Ponater, M.; Conley, A.J.; Polvani, L.M. Stratospheric Water Vapor: An Important Climate Feedback. Clim. Dyn. 2019, 53, 1697–1710. [Google Scholar] [CrossRef]
- Forster, P.M.; Shine, K. Assessing the Climate Impact of Trends in Stratospheric Water Vapor. Geophys. Res. Lett. 2002, 29, 10-11–10-14. [Google Scholar] [CrossRef]
- Stenke, A.; Grewe, V. Simulation of Stratospheric Water Vapor Trends: Impact on Stratospheric Ozone Chemistry. Atmos. Chem. Phys. 2005, 5, 1257–1272. [Google Scholar] [CrossRef]
- Avery, M.A.; Davis, S.M.; Rosenlof, K.H.; Ye, H.; Dessler, A.E. Large Anomalies in Lower Stratospheric Water Vapour and Ice During the 2015–2016 El Niño. Nat. Geosci. 2017, 10, 405. [Google Scholar] [CrossRef]
- Solomon, S.; Rosenlof, K.H.; Portmann, R.W.; Daniel, J.S.; Davis, S.M.; Sanford, T.J.; Plattner, G.K. Contributions of Stratospheric Water Vapor to Decadal Changes in the Rate of Global Warming. Science 2010, 327, 1219–1223. [Google Scholar] [CrossRef] [PubMed]
- Rosenlof, K.H.; Reid, G.C. Trends in the Temperature and Water Vapor Content of the Tropical Lower Stratosphere: Sea Surface Connection. J. Geophys. Res. Atmos. 2008, 113. [Google Scholar] [CrossRef]
- Wang, W.; Matthes, K.; Tian, W.; Park, W.; Shangguan, M.; Ding, A. Solar Impacts on Decadal Variability of Tropopause Temperature and Lower Stratospheric (LS) Water Vapour: A Mechanism through Ocean-Atmosphere Coupling. Clim. Dyn. 2019, 52, 5585–5604. [Google Scholar] [CrossRef]
- Lu, J.; Xie, F.; Sun, C.; Luo, J.; Cai, Q.; Zhang, J.; Li, J.; Tian, H.J. Analysis of Factors Influencing Tropical Lower Stratospheric Water Vapor during 1980–2017. NPJ Clim. Atmos. Sci. 2020, 3, 35. [Google Scholar] [CrossRef]
- Fueglistaler, S.; Haynes, P. Control of Interannual and Longer-Term Variability of Stratospheric Water Vapor. J. Geophys. Res. Atmos. 2005, 110. [Google Scholar] [CrossRef]
- Gettelman, A.; Forster, P.M.; Fujiwara, M.; Fu, Q.; Vömel, H.; Gohar, L.K.; Johanson, C.; Ammerman, M. Radiation Balance of the Tropical Tropopause Layer. J. Geophys. Res. Atmos. 2004, 109. [Google Scholar] [CrossRef]
- Fueglistaler, S.; Dessler, A.; Dunkerton, T.; Folkins, I.; Fu, Q.; Mote, P.W. Tropical Tropopause Layer. Rev. Geophys. 2009, 47. [Google Scholar] [CrossRef]
- Tian, W.; Chipperfield, M.P.; Gray, L.J.; Zawodny, J.M. Quasi-Biennial Oscillation and Tracer Distributions in a Coupled Chemistry-Climate Model. J. Geophys. Res. Atmos. 2006, 111. [Google Scholar] [CrossRef]
- Randel, W.J.; Jensen, E.J. Physical Processes in the Tropical Tropopause Layer and Their Roles in a Changing Climate. Nat. Geosci. 2013, 6, 169. [Google Scholar] [CrossRef]
- Fueglistaler, S.; Bonazzola, M.; Haynes, P.; Peter, T. Stratospheric Water Vapor Predicted from the Lagrangian Temperature History of Air Entering the Stratosphere in the Tropics. J. Geophys. Res. Atmos. 2005, 110. [Google Scholar] [CrossRef]
- Hardiman, S.C.; Boutle, I.A.; Bushell, A.C.; Butchart, N.; Cullen, M.J.; Field, P.R.; Furtado, K.; Manners, J.C.; Milton, S.F.; Morcrette, C.J. Processes Controlling Tropical Tropopause Temperature and Stratospheric Water Vapor in Climate Models. J. Clim. 2015, 28, 6516–6535. [Google Scholar] [CrossRef]
- Fu, Q.; Smith, M.; Yang, Q.J. The Impact of Cloud Radiative Effects on the Tropical Tropopause Layer Temperatures. Atmosphere 2018, 9, 377. [Google Scholar] [CrossRef]
- Holton, J.R.; Haynes, P.H.; McIntyre, M.E.; Douglass, A.R.; Rood, R.B.; Pfister, L. Stratosphere-Troposphere Exchange. Rev. Geophys. 1995, 33, 403–439. [Google Scholar] [CrossRef]
- Xia, Y.; Huang, Y.; Hu, Y.; Yang, J. Impacts of Tropical Tropopause Warming on the Stratospheric Water Vapor. Clim. Dyn. 2019, 53, 3409–3418. [Google Scholar] [CrossRef]
- Son, S.-W.; Lim, Y.; Yoo, C.; Hendon, H.; Kim, J. Stratospheric Control of Madden-Julian Oscillation and Its Teleconnection. In Proceedings of the 19th EGU (EGU2017), Vienna, Austria, 23–28 April 2017; p. 4190. [Google Scholar]
- Kumar, V.; Dhaka, S.; Reddy, K.; Gupta, A.; Prasad, S.S.; Panwar, V.; Singh, N.; Ho, S.-P.; Takahashi, M. Impact of Quasi-Biennial Oscillation on the Inter-Annual Variability of the Tropopause Height and Temperature in the Tropics: A Study Using Cosmic/Formosat-3 Observations. Atmos. Res. 2014, 139, 62–70. [Google Scholar] [CrossRef]
- Calvo, N.; Giorgetta, M.A.; Garcia-Herrera, R.; Manzini, E. Nonlinearity of the Combined Warm ENSO and QBO Effects on the Northern Hemisphere Polar Vortex in MAECHAM5 Simulations. J. Geophys. Res. Atmos. 2009, 114. [Google Scholar] [CrossRef]
- Free, M.; Seidel, D.J. Observed El Niño-Southern Oscillation Temperature Signal in the Stratosphere. J. Geophys. Res. Atmos. 2009, 114. [Google Scholar] [CrossRef]
- Randel, W.J.; Garcia, R.R.; Calvo, N.; Marsh, D. ENSO Influence on Zonal Mean Temperature and Ozone in the Tropical Lower Stratosphere. Geophys. Res. Lett. 2009, 36. [Google Scholar] [CrossRef]
- Scaife, A.A.; Butchart, N.; Jackson, D.R.; Swinbank, R. Can Changes in ENSO Activity Help to Explain Increasing Stratospheric Water Vapor? Geophys. Res. Lett. 2003, 30. [Google Scholar] [CrossRef]
- Xie, F.; Li, J.; Tian, W.; Feng, J.; Huo, Y. Signals of El Niño Modoki in the Tropical Tropopause Layer and Stratosphere. Atmos. Chem. Phys. 2012, 12, 5259–5273. [Google Scholar] [CrossRef]
- Randel, W.J.; Wu, F.; Oltmans, S.J.; Rosenlof, K.; Nedoluha, G.E. Interannual Changes of Stratospheric Water Vapor and Correlations with Tropical Tropopause Temperatures. J. Atmos. Sci. 2004, 61, 2133–2148. [Google Scholar] [CrossRef]
- Ding, Q.; Fu, Q. A Warming Tropical Central Pacific Dries the Lower Stratosphere. Clim. Dyn. 2018, 50, 2813–2827. [Google Scholar] [CrossRef]
- McFarlane, N.J. Connections between Stratospheric Ozone and Climate: Radiative Forcing, Climate Variability, and Change. Atmos. Ocean. 2008, 46, 139–158. [Google Scholar] [CrossRef]
- Steinbrecht, W.; Claude, H.; Köhler, U.; Hoinka, K.J. Correlations between Tropopause Height and Total Ozone: Implications for Long-Term Changes. J. Geophys. Res. 1998, 103, 19183–19192. [Google Scholar] [CrossRef]
- Son, S.-W.; Polvani, L.M.; Waugh, D.W.; Birner, T.; Akiyoshi, H.; Garcia, R.R.; Gettelman, A.; Plummer, D.A.; Rozanov, E. The Impact of Stratospheric Ozone Recovery on Tropopause Height Trends. J. Clim. 2009, 22, 429–445. [Google Scholar] [CrossRef]
- Austin, J.; Reichler, T.J. Long-Term Evolution of the Cold Point Tropical Tropopause: Simulation Results and Attribution Analysis. J. Geophys. Res. 2008, 113. [Google Scholar] [CrossRef]
- Xie, F.; Tian, W.; Chipperfield, M.P. Radiative Effect of Ozone Change on Stratosphere-Troposphere Exchange. J. Geophys. Res. Atmos. 2008, 113. [Google Scholar] [CrossRef]
- Roff, G.; Thompson, D.W.; Hendon, H.J. Does Increasing Model Stratospheric Resolution Improve Extended-Range Forecast Skill? Geophys. Res. Lett. 2011, 38. [Google Scholar] [CrossRef]
- Sigmond, M.; Scinocca, J.F.; Kushner, P.J. Impact of the Stratosphere on Tropospheric Climate Change. Geophys. Res. Lett. 2008, 35. [Google Scholar] [CrossRef]
- Chipperfield, M.P.; Bekki, S.; Dhomse, S.; Harris, N.R.; Hassler, B.; Hossaini, R.; Steinbrecht, W.; Thiéblemont, R.; Weber, M.J. Detecting Recovery of the Stratospheric Ozone Layer. Nature 2017, 549, 211–218. [Google Scholar] [CrossRef]
- Davis, S.M.; Rosenlof, K.H.; Hassler, B.; Hurst, D.F.; Read, W.G.; Vömel, H.; Selkirk, H.; Fujiwara, M.; Damadeo, R. The Stratospheric Water and Ozone Satellite Homogenized (SWOOSH) Database: A Long-Term Database for Climate Studies. Earth Syst. Sci. Data 2016, 8, 461. [Google Scholar] [CrossRef]
- Kanamitsu, M.; Ebisuzaki, W.; Woollen, J.; Yang, S.-K.; Hnilo, J.; Fiorino, M.; Potter, G.J. NCEP–DOE AMIP-II Reanalysis (R-2). Bull. Am. Meteorol. Soc. 2002, 83, 1631–1644. [Google Scholar] [CrossRef]
- Roads, J.J. The NCEP-NCAR, NCEP-DOE, and TRMM tropical atmosphere hydrologic cycles. J. Hydrometeor. 2003, 4, 826–840. [Google Scholar] [CrossRef]
- Hurrell, J.W.; Holland, M.M.; Gent, P.R.; Ghan, S.; Kay, J.E.; Kushner, P.J.; Lamarque, J.-F.; Large, W.G.; Lawrence, D.; Lindsay, K. The Community Earth System Model: A Framework for Collaborative Research. Bull. Am. Meteor. Soc. 2013, 94, 1339–1360. [Google Scholar] [CrossRef]
- Neale, R.B.; Richter, J.; Park, S.; Lauritzen, P.H.; Vavrus, S.J.; Rasch, P.J.; Zhang, M. The Mean Climate of the Community Atmosphere Model (CAM4) in Forced Sst and Fully Coupled Experiments. J. Clim. 2013, 26, 5150–5168. [Google Scholar] [CrossRef]
- Danabasoglu, G.; Bates, S.C.; Briegleb, B.P.; Jayne, S.R.; Jochum, M.; Large, W.G.; Peacock, S.; Yeager, S.G. The CCSM4 Ocean Component. J. Clim. 2012, 25, 1361–1389. [Google Scholar] [CrossRef]
- Holland, M.M.; Bailey, D.A.; Briegleb, B.P.; Light, B.; Hunke, E. Improved Sea Ice Shortwave Radiation Physics in CCSM4: The Impact of Melt Ponds and Aerosols on Arctic Sea Ice. J. Clim. 2012, 25, 1413–1430. [Google Scholar] [CrossRef]
- Garcia, R.; Marsh, D.; Kinnison, D.; Boville, B.; Sassi, F. Simulation of Secular Trends in the Middle Atmosphere, 1950–2003. J. Geophys. Res. Atmos. 2007, 112. [Google Scholar] [CrossRef]
- Marsh, D.R.; Mills, M.J.; Kinnison, D.E.; Lamarque, J.-F.; Calvo, N.; Polvani, L.M. Climate Change from 1850 to 2005 Simulated in CESM1 (WACCM). J. Clim. 2013, 26, 7372–7391. [Google Scholar] [CrossRef]
- Gettelman, A.; Birner, T.; Eyring, V.; Akiyoshi, H.; Bekki, S.; Brühl, C.; Dameris, M.; Kinnison, D.E.; Lefèvre, F.; Lott, F.J.; et al. The Tropical Tropopause Layer 1960–2100. Atmos. Chem. Phys. 2009, 9, 1621–1637. [Google Scholar] [CrossRef]
- Xie, F.; Li, J.; Tian, W.; Zhang, J.; Sun, C. The Relative Impacts of El Niño Modoki, Canonical El Niño, and QBO on Tropical Ozone Changes since the 1980s. Environ. Res. Lett. 2014, 9, 064020. [Google Scholar] [CrossRef]
- Bretherton, C.S.; Widmann, M.; Dymnikov, V.P.; Wallace, J.M.; Bladé, I. The Effective Number of Spatial Degrees of Freedom of a Time-Varying Field. J. Clim. 1999, 12, 1990–2009. [Google Scholar] [CrossRef]
- Chipperfield, M.P.; Dhomse, S.S.; Feng, W.; McKenzie, R.; Velders, G.J.; Pyle, J.A. Quantifying the Ozone and Ultraviolet Benefits Already Achieved by the Montreal Protocol. Nat. Commun. 2015, 6, 7233. [Google Scholar] [CrossRef]
- Xie, F.; Li, J.; Tian, W.; Fu, Q.; Jin, F.-F.; Hu, Y.; Zhang, J.; Wang, W.; Sun, C.; Feng, J. A Connection from Arctic Stratospheric Ozone to El Niño-Southern Oscillation. Environ. Res. Lett. 2016, 11, 124026. [Google Scholar] [CrossRef]
- Brewer, A. Evidence for a World Circulation Provided by the Measurements of Helium and Water Vapour Distribution in the Stratosphere. Q. J. R. Meteorol. Soc. 1949, 75, 351–363. [Google Scholar] [CrossRef]
- Rosenlof, K.H. How Water Enters the Stratosphere. Science 2003, 302, 1691–1692. [Google Scholar] [CrossRef] [PubMed]
- Austin, J.; Wilson, R.J. Ensemble Simulations of the Decline and Recovery of Stratospheric Ozone. J. Geophys. Res. 2006, 111. [Google Scholar] [CrossRef]
- Revell, L.E.; Tummon, F.; Salawitch, R.J.; Stenke, A.; Peter, T.J. The Changing Ozone Depletion Potential of N2O in a Future Climate. Geophys. Res. Lett. 2015, 42, 10047–10055. [Google Scholar] [CrossRef]
- Fiore, A.M.; Naik, V.; Leibensperger, E.M.; Association, W.M. Air Quality and Climate Connections. J. Air. Waste. Manag. 2015, 65, 645–685. [Google Scholar] [CrossRef]
- Hegglin, M.; Plummer, D.; Shepherd, T.; Scinocca, J.; Anderson, J.; Froidevaux, L.; Funke, B.; Hurst, D.; Rozanov, A.; Urban, J. Vertical Structure of Stratospheric Water Vapour Trends Derived from Merged Satellite Data. Nat. Geosci. 2014, 7, 768. [Google Scholar] [CrossRef]
Publisher’s Note: MDPI stays neutral with regard to jurisdictional claims in published maps and institutional affiliations. |
© 2021 by the authors. Licensee MDPI, Basel, Switzerland. This article is an open access article distributed under the terms and conditions of the Creative Commons Attribution (CC BY) license (http://creativecommons.org/licenses/by/4.0/).