Abstract
This study aims to explore the contrasting characteristics of large-scale circulation that led to the precipitation anomalies over the northern parts of Sumatra Island. Further, the impact of varying the Asian–Australian Monsoon (AAM) was investigated for triggering the precipitation variability over the study area. The moisture budget analysis was applied to quantify the most dominant component that induces precipitation variability during the JJA (June, July, and August) period. Then, the composite analysis and statistical approach were applied to confirm the result of the moisture budget. Using the European Centre for Medium-Range Weather Forecasts (ECMWF) Re-Anaysis Interim (ERA-Interim) from 1981 to 2016, we identified 9 (nine) dry and 6 (six) wet years based on precipitation anomalies, respectively. The dry years (wet years) anomalies over the study area were mostly supported by downward (upward) vertical velocity anomaly instead of other variables such as specific humidity, horizontal velocity, and evaporation. In the dry years (wet years), there is a strengthening (weakening) of the descent motion, which triggers a reduction (increase) of convection over the study area. The overall downward (upward) motion of westerly (easterly) winds appears to suppress (support) the convection and lead to negative (positive) precipitation anomaly in the whole region but with the largest anomaly over northern parts of Sumatra. The AAM variability proven has a significant role in the precipitation variability over the study area. A teleconnection between the AAM and other global circulations implies the precipitation variability over the northern part of Sumatra Island as a regional phenomenon. The large-scale tropical circulation is possibly related to the PWC modulation (Pacific Walker Circulation).
1. Introduction
Understanding of the mechanism causing precipitation variability is crucial for a comprehensive investigation of the hydrologic cycle [1]. The study about precipitation over the tropical western Pacific and the eastern Indian Ocean is essential because the Indonesian Maritime Continent (IMC) is called the world’s convection center or the region of maximum precipitation on Earth [2,3]). Considering the vast quantities of precipitation, a thorough study focusing on the driving mechanism of precipitation variability over the Indonesian archipelago would significantly contribute to understanding the IMC’s climate system. Several studies have been done related to the precipitation variability over the Indonesian region and its relation to large-scale climatic phenomena such as El Niño–Southern Oscillation (ENSO) [4,5] and monsoon [6]. In Indonesia, most of the study about precipitation variability only focuses on Java Island due to limited observation data in other Islands [7,8,9]. The scarcity of observation data in other Islands in Indonesia is related to limited weather stations, which cannot cover all the Indonesia’s islands. A detailed study about the mechanism of precipitation variability was rarely conducted in Sumatra Island, especially in the northern parts of the island.
In general, the annual precipitation of the northern parts of Sumatra Island (north of the equator) is higher than the southern parts of Sumatra Island, except Sumatra’s west coast [10]. This condition occurs because the precipitation over the southern part of Sumatra Island is also affected by the impact of El-Niño on weakening the northwesterly monsoon [7,8]. Moreover, higher precipitation on the west coast of Sumatra Island is due to the ascent along the near-coast hills and the seaward-propagating orographically-induced convective systems [4,11]. Nocturnal precipitation activity occurs along the west coast of the Sumatra Islands [10,12]. On the west coast of Sumatra Island, sea breeze plays a significant role in forming inland precipitation during the daytime, while land breeze plays a major role in developing offshore precipitation at night until morning time. The development of rainfall begins inland when the sea breeze has intense wind speed. Because solar radiation heats the islands more effectively than the seas, sea breezes are initiated. Precipitation formed over the inland area and is further enhanced by the topographic effect [12].
Extreme precipitation events and flooding that cause damaging impacts on agriculture and water resources occur in this area frequently. Based on Indonesia’s disaster database, flooding is a natural disaster that frequently happens in Sumatra’s northern parts [13]. There were 471 flooding events recorded between 1981 and 2016, and of these events, about 10 percent occurred during the dry season of the JJA (June, July, and August) period (Figure 1). The northern parts of Sumatra are classified as the semi-monsoonal region, which has two rain seasons during March–April–May [14] and September–October–November (SON) [3]. Based on the Principal Component Analysis (PCA) and clustering method, the area at the west coast of Aceh in northern parts of Sumatra, is classified as the “No-Seasonal Zone” (No-ZoM), meaning that high precipitation can happen even in the dry (wet) months [15]. Furthermore, most of the Indonesia region has experienced a decreasing trend in precipitation during the JJA periods, except the northern parts of Sumatra Island [16]. Considering the higher variability and complexity in precipitation, a comprehensive study would benefit both the scientific and application purposes in that area.
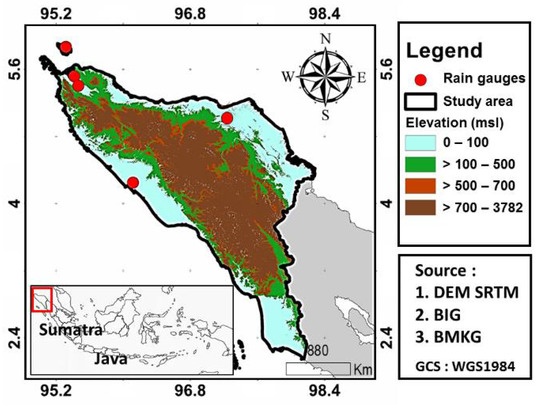
Figure 1.
The study area and topography for the Northern parts of Sumatra Island (Aceh Province), Indonesia.
Generally, the zonal and meridional circulations cause atmospheric dynamics variation in the equatorial Indonesian Maritime Continent [3,16]. The meridional circulation has a connection to the cross-equatorial circulation of the monsoon as Hadley cell (the lateral monsoon), especially the Indian Summer Monsoon (IM) and the East-Asian Summer Monsoon (EASM) [17,18,19]. The EASM and the Australian Monsoon (AM) of the Southern Hemisphere (SH) triggers an Asian–Australian Monsoon (AAM) system on the seasonal time scale [20]. In addition to these circulations, the Indonesian Maritime Continent is also affected by the local circulation phenomenon. In general, the zonal circulation has a strong relationship with ENSO and the Indian Dipole Mode (IOD). Many studies have shown that the AAM also has a close link to the interannual variability of the tropical ocean-atmosphere system, particularly the El Niño–Southern Oscillation (ENSO) phenomenon [18,21]. To further understand the precipitation variability in northern parts of Sumatra during the dry season, studies have been conducted to explore the relative impact of zonal and meridional circulations in JJA when the southwest monsoon prevails. Harijono et al. (2007) confirmed that the Indian Summer Monsoon has an essential role in the precipitation budget of the northern parts of Sumatra Island [16]. ISM compensated for the reduction effects of El-Niño and IOD (+) on the JJA period. Akbar (2014) found that IOD has a more siginificant impact than ENSO for the precipitation anomaly in the northern parts of Sumatra Island [22]. Akbar (2014) also indicated that El-Niño and La-Nina has a role in decreasing (increasing) precipitation in the study area [22].
The AAM has an important role over Indonesia because it can decrease westward zonal wind and develop westerly wave propagation [23,24]. According to the climatological mean fields of low-level winds at 850 hPa during JJA, the AAM usually appears over the domain between 30° S–40° E and 60° E–160° E, including the Sumatra Island [25]. As the background flow, the AAM is significantly inducing the precipitation anomalies over the Sumatra Island. The strong precipitation variability in the AAM domain show significant regional differences and depend on the seasonal march and evolution of ENSO [26]. Moreover, the Indo-Pacific warm pool (IPWP), Indian Warm Pool (IWP), and Pacific Warm Pool (PWP) are the source of heat energy and water vapor over deep convection, which leads to intense air-sea interactions [27]. Thus, the interaction between monsoon and warm pools is another crucial factor that controls the AAM variations [26]. In this study, the impact of teleconnection between the AAM and global atmosphere circulations will be investigated for explaining the precipitation anomaly over the northern parts of Sumatra Island.
The moisture budget equation constrains the linkage between atmospheric dynamics, water vapor, and precipitation. Thus the moisture budget analysis is a powerful approach for studying the processes that generate precipitation anomalies [28,29]. The moisture budget is based upon the moisture transport in the atmosphere, including evaporation, horizontal moisture advection, moisture convergence, and precipitation [30,31]. Regional precipitation variability is balanced by local evaporation and moisture transport on a seasonal mean time scale [32,33], and the moisture budget has been used to understand the processes that control precipitation variability [34]. Interestingly, this approach has never been made for studying the precipitation variability in Sumatra Island, especially for the northern parts of Sumatra Island. Hence, the objective of this study’s objective is to explore the contrasting characteristics of large-scale circulation during Boreal Summer that led to the precipitation anomalies over the northern parts of Sumatra Island in dry/wet JJA. The study can contribute to fill the knowledge gap about the driving mechanism of precipitation variability in the northern parts of Sumatra Island, Indonesia.
This paper consists of four sections. The first section explains the historical background, which mainly describes the research background, global climate pattern of Sumatra Island, and the AAM role during summer periods that affect the precipitation variability in the northern parts of Sumatra Island. Further, a brief introduction to moisture budget analysis is provided in this section. The second section contains the data and method used during the study. The third section elaborated the validation of the precipitation data of ERA-Interim, the result calculation of moisture budget for the classified dry/wet years, and confirmed the budgeting by using composite analysis and previous studies. The fourth section is the conclusions, which compiles the previous three sections’ findings and recommendations for further studies.
2. Data and Methods
2.1. Study Area
The northern part of Sumatra Island (or the Aceh province) is located between 95° E–98° E and 20° N–60° N (Figure 1). The area of the Aceh Province is about 58,377 km2. It is located southeast of the Andaman and Nicobar Islands, India, separated by the Andaman Sea, and to the west of the Malaysian Peninsula, separated by the Strait of Malacca. Aceh is also bordered by the Bay of Bengal and the Indian Ocean in the northwest and the west. This region’s topography is characterized by the high-rising topography of the Bukit Barisan Mountains, with the highest elevation at 3782 m above means sea level. Because of the land-sea contrast and the high topography, northern parts of Sumatra have complexity in climate profile [16,22]. The rainy season usually comes during MAM and SON, while the dry season always occurs during DJF and JJA [3]. The southeast monsoon prevails in JJA, while the northwest monsoon occurs in December–January–February (DJF) [35]. The transition between monsoons occurs during March–April–May and September–October–November (SON) [14].
2.2. Data
The monthly reanalysis data of ERA-Interim from the European Centre for Medium-Range Weather Forecasts (ECMWF) from 1981 to 2016 (36 years) were used for diagnostics. The spatial resolution is 0.1250 degrees. There were five (5) rain gauge stations in the study area, but they have different data periods and many empty data. We analyzed the precipitation data in ERA-interim for data consistency, which validated against rain gauge data and Climate Hazards Group InfraRed Precipitation with Station data (CHIRPS). CHIRPS provides precipitation estimates based on rain gauge and satellite observations [36]. In a Bali Island’s study with a similar topography profile to Sumatra Island, CHIRPS precipitation estimates have been well-validated against the rain gauge observation [37].
In addition to the daily total precipitation (m/day) and surface latent heat flux (J/m2) as evaporation data, other ERA-Interim data used in this research, such as the specific humidity (kg/kg), u and v of horizontal winds (m/s), and vertical velocity (Pa/s) in pressure coordinates. The Extended Reconstructed Sea Surface Temperature (ERSST in °C), the Outgoing Longwave Radiation (OLR in W/m2) and Sea Level Pressure (SLP in mb) were provided by the National Oceanic and Atmospheric Administration [38] Physical Sciences Laboratory [38], Boulder, Colorado, USA, retrieved from https://psl.noaa.gov/ [38]. We also used the Shuttle Radar Topography Mission (SRTM) topography data, which has 30 m of spatial resolution.
2.3. Methods
In general, most of the processing data in this study was done by utilizing the NCAR Command Language (NCL) [34]. In this study, we divided the methods into five steps. The first step is a spatial analysis of precipitation variability in the Indonesian region, focusing on Sumatra Island. In this part, we conducted a composite analysis based on 36 years of ERA-Interim data, such as precipitation data, horizontal winds, and specific humidity (i.e., inter-annual). Comparison between the ERA-Interim, rain gauge data, and CHIRPS was conducted to validate the ERA-Interim precipitation data. It is proven to be difficult to directly compare the area-mean precipitation from (ERA-interim, CHIRPS) and the 3-station average. Nevertheless, that was one of the possible approaches considering the limited observation in northern Sumatra. This study focused on the statistical characteristics, and the significant correlation coefficients among three data sets suggest the usefulness of ERA-interim precipitation for a study in this data-scarce region.
The second step is to identify the dry/wet years from 36 JJAs based on the definition of “dry” and “wet” year by National Climatic Data Center–NCDC (2011). The normalized precipitation anomaly was calculated based on the average of JJA’s period, and then it was normalized by the standard deviation of JJA’s ERA-Interim precipitation data from 1981 to 2016. The “dry” years are those with the normalized precipitation that is one standard deviation below the 30-year mean, while the “wet” years are those with the normalized precipitation above one standard deviation [39]. This study took a 0.8 standard deviation as the threshold to obtain more events for compositing purposes.
The third step is applying the Student’s t-test to identify the statistically significant anomalies in both dry and wet years. The t-test assumes the null hypothesis that the sample means are from the same population (i.e., H0: ave1 = ave2), where Ave1 represents the climatological of precipitation and Ave2 represents the averages of the dry and wet years. By contrast, the rejection of the null hypothesis implies that the sample means two different populations.
The fourth step is designed for understanding the main mechanism that induces the precipitation anomalies. We conducted the vertically integrated moisture budget analysis following Chou et al. (2009) [40]:
where () denotes climatological mean, which is defined as the mean over 1981–2016. Here (’) represents the departure from the climatological mean. E is evaporation, is vertical pressure velocity, is horizontal velocity, is specific humidity and . The last term () represents the contributions of nonlinear transient eddies, which are generally not part of the physical solution because their magnitudes are much smaller compared to the other terms. There are five terms in the moisture budget, as shown in Equation (1). In (1), precipitation anomalies are roughly balanced by the anomalous vertical moisture transport associated with a mean () and anomalous () vertical motion, horizontal moisture transport anomalies, evaporation anomalies, and term that includes transient and nonlinear terms (relatively small and often neglected) (Figure 1). Each of the terms is converted to the energy units by absorbing the latent heat per unit mass. The P is precipitation in energy units (W/m2), divided by 28 to become mm/day [40]. The vertical integral from 1000 to 300 hPa is computed in this study. Vertical integral ⟨ ⟩ denotes a mass integration from 1000 to 300 hPa:
where is gravity. Chou et al. (2009) seemed to include all levels in the data set they used. Various upper limits have been chosen in previous studies, e.g., 100 hPa in Liu et al., (2018) and 300 hPa in Jongaramrungruang et al., (2017) [41,42]. The uncertainty of measured moisture is relatively considerable in the upper troposphere, especially near the tropopause [43]. We, therefore, decided to integrate up to 300 hPa. On the other hand, the results are essentially the same, whether integrated to 300 hPa or 30 hPa, because the moisture in the upper troposphere and lower stratosphere is relatively minimal.
In the fifth step, we determined the velocity potential. In the fifth step, we determined the velocity potential. The upper-tropospheric velocity potential can represent the large-scale upward motion related to the outgoing longwave radiation (OLR) and precipitation [11]. In principle, the tropical wind field has information about the synoptic conditions instead of the geopotential height or pressure field. A theorem of Helmholtz states that any wind velocity field can be divided into a nondivergent part and an irrotational part , where and . The two components can be further derived into variables that represent for tropical weather analysis, the stream function ( and and velocity potential. For a two-dimensional velocity field, the non-divergent part can be expressed in terms of a stream function defined by letting in Cartesian components as
Velocity potential is an indicator to comprehend the irrotational (divergent) flows in the atmosphere. It is a scalar field that describes the quantity of divergent parts of the horizontal velocity field.
Velocity potential and stream function are clearly appearing at the equator, which is very powerful for model initialization in tropical regions. Since velocity potential is proportional to divergence, then it can be applied to track regions where convection is enhanced [11]. Furthermore, velocity potential can easily be used to determine the large-scale horizontal convergence or divergence [27]. For calculating the velocity potential and stream function, we used the and component of horizontal wind and specific humidity from ERA-Interim. First, we calculated the stream function and velocity potential (“uv2sfvpf” function in NCL). Second, we determined the divergence wind components (“uv2dvf” function in NCL).
3. Results and Discussion
3.1. Precipitation of Northern Parts of Indonesia Based on ERA-Interim
The climatological mean and standard deviation of precipitation (mm/month) during JJA from 1981 to 2016 based on ERA-Interim can be seen in Figure 2a. Note that JJA is the dry season in Sumatra Island, and the precipitation seen in Figure 2a is the lowest in the whole year. This condition is due to the seasonal northward movement of the Asian–Australian monsoon system and the Intertropical Convergence Zone (ITCZ). Nevertheless, the high standard deviation of precipitation can be found over the northern part of Sumatra Island except the very northern tip, where complex terrain is located (Figure 1 and Figure 2b). Because the standard deviation represents the estimated interannual-varying range around the average, a higher standard deviation implies higher temporal variability of precipitation in the area (Figure 2b).
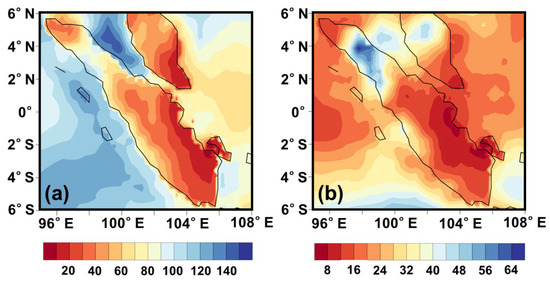
Figure 2.
(a) Climatological mean and (b) standard deviation of precipitation (mm/month) during June, July, and August (JJA) from 1981 to 2016 based on ERA-Interim data.
The major purpose of this study is to understand the linkage between local precipitation and the surrounding large-scale circulation, and most importantly, the moisture budget. It is, therefore, sensible to use the ERA-Interim precipitation for consistency, especially in the calculation of moisture budget. Pearson’s correlation was applied to check the consistency between monthly ERA-Interim (CHIRPS) precipitation and from the measurement from 3 rain gauges during JJA (Figure 3). The correlation coefficient (r) between observation and ERA-Interim (CHIRPS) shows a strong positive correlation of 0.68 (0.78). The result is consistent with the previous study that ERA-Interim is close to the observation data [44]. Several previous studies also proved a strong relationship between ERA-interim analysis and observations [45]. We conclude that ERA-Interim can be used as alternative precipitation data to represent the real observation data in the northern parts of Sumatra Island.
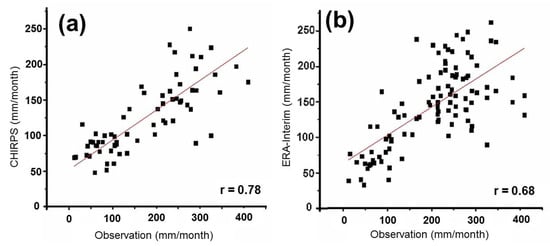
Figure 3.
Scatter plot and the Pearson’s correlation between observed precipitation (3 stations) and (a) CHIRPS and (b) ERA-Interim in JJA from 1981 to 2016.
The climatology of precipitation for JJA between observation in two stations (Meulaboh and Lhokseumawe), CHIRPS, and ERA-Interim can be seen in Figure 4. In this study, the Meulaboh station (green circle) is located on the western coast of the study area, and the Lhokseumawe station (yellow circle) is located on the eastern coast of the study area (Figure 4). Based on the JJA climatology, the western part of the study area has higher average precipitation than the eastern part of the study area due to the mountainous orographic effects in Sumatra Island [44]. Based on CHIRPS, the JJA precipitation during 1981–2016 in the western and eastern stations ranges from 150 to 175 mm and 70 to 110 mm, respectively. Furthermore, the precipitation of JJA using ERA-Interim at the western and eastern stations ranges from 175 to 200 mm and 70 to 110 mm, respectively. The climatological-mean precipitation of JJA based on CHIRPS and ERA-Interim are also comparable, as shown in Figure 4. Although both gridded precipitation data underestimate the rain gauge (observation) values, they realistically represent the precipitation contrast between western and eastern Sumatra. In summary, the ERA-Interim precipitation product has a realistic temporal and spatial representation compared with precipitation observations on a monthly scale, although it has an average of 19–30% underestimation for monthly precipitation [45,46].
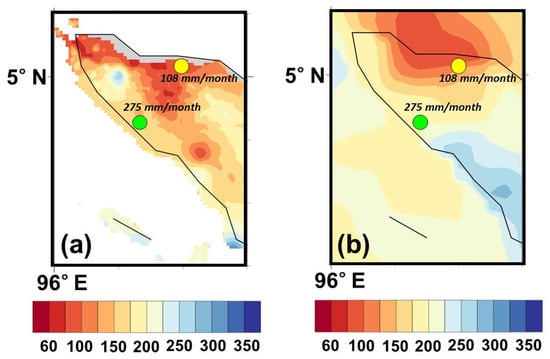
Figure 4.
Climatological-mean precipitation (mm/month) in JJA averaged over 1981–2016 based on; (a). CHIRPS; (b) ERA-Interim. Meulaboh (in the west part) and Lhokseumawe (in the east part) stations are marked by green and yellow circle, respectively.
3.2. Precipitation Variability over Northern Parts of Sumatra Island
In this research, JJA precipitation anomalies (from 1981 to 2016) are classified into wet and dry years, as discussed in Section 2. Based on the precipitation anomaly in JJA, six wet (1988, 1995, 1996, 1998, 2008, and 2015) and nine dry (1981, 1985, 2000, 2001, 2004, 2005, 2006, 2011, and 2012) years were identified, respectively. Figure 5 reveals that the anomaly during the wet years tends to be larger than in dry years. This anomaly is relevant because most of the flooding disasters occur during JJA due to extreme precipitation in this climatologically dry season.
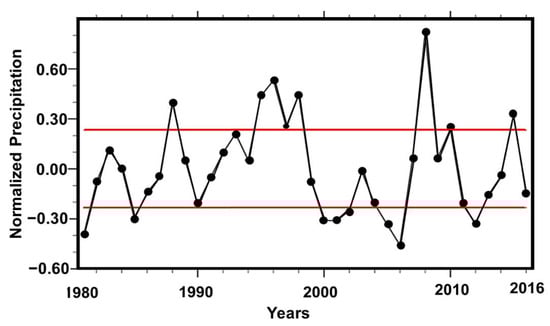
Figure 5.
Normalized precipitation anomaly index over the study area from 1981 to 2016 during JJA based on ERA-Interim. The red line (__) represent the range of 0.8 standard deviation.
During the dry years, significant negative anomalies were seen in the equatorial Indian Ocean between 90° E and 110° E (including the study area), the South China Sea (SCS), and the Celebes Sea, whereas positive anomalies were observed in the Philippine Sea (Figure 6a). In Sumatra Island, the negative precipitation anomaly appears in the northern part of the island (i.e., the Aceh province). In the wet years, the t-test shows positive anomalies over the Indian Ocean, the study area, and most parts of the Maritime continent (Figure 6b). By contrast, a band of significant negative anomalies was located in the north, spreading eastward from the Indochina Peninsula to the Philippine Sea. We can notice a reversed precipitation anomaly between Indonesia and the Philippines Sea in both dry and wet years.
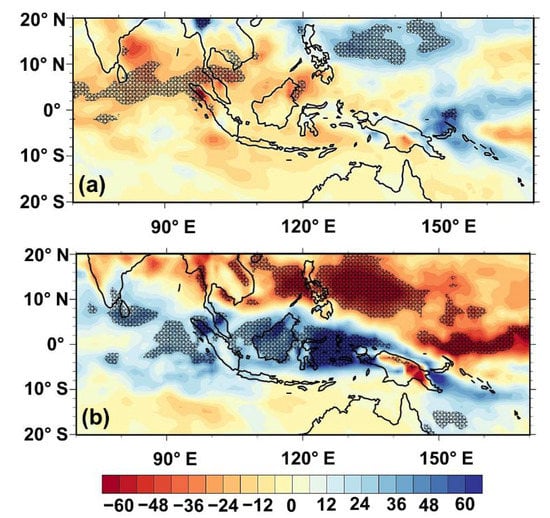
Figure 6.
Composites of precipitation anomaly (mm/month) in JJA: (a) dry years; (b) wet years. The precipitation anomaly significant at the 10% significance level is hatched.
As the background flow in JJA, the dry air from the winter continent (Australia) flows across the Equator toward the Northern Hemisphere (Figure 7a) [46]. In the dry years, the anomalous westerly wind appears over the Bay of Bengal and extends eastward to merge with the Philippines Sea’s cyclonic anomalies (Figure 7b). A southwesterly anomaly is observed over the tropical eastern Indian Ocean to the west of northern Sumatra. These anomalous circulations are parts of the anomalous cyclonic circulation prevailing over the Indochina Peninsula, the SCS, and the Philippine Sea. Meanwhile, in the wet years, a strong anomalous anticyclonic circulation covers South Asia, the Indochina Peninsular, and the Philippine Sea, with easterly anomalies stronger than the long-term westerly flow prevailing from the tropical western Pacific to the tropical Ocean (Figure 7c). Note that the wind anomalies are much more robust in the wet years than in the dry years. A comparison of the circulation anomalies presented above reveals a close relationship between the Asian Summer monsoon and precipitation in northern Sumatra in inter-annual time scale. An enhanced and weakened Asian summer monsoon trough appears in the dry and wet years, respectively.
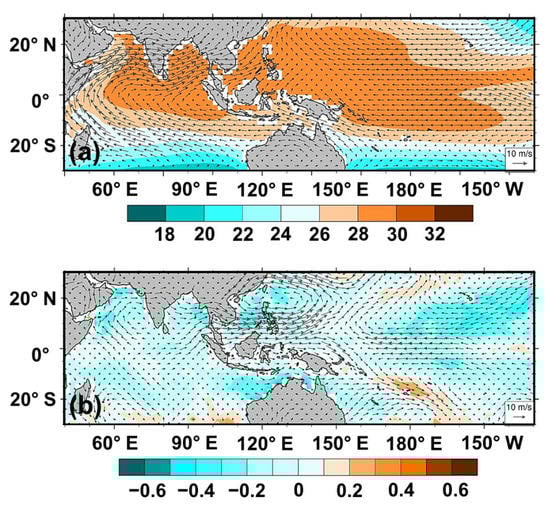
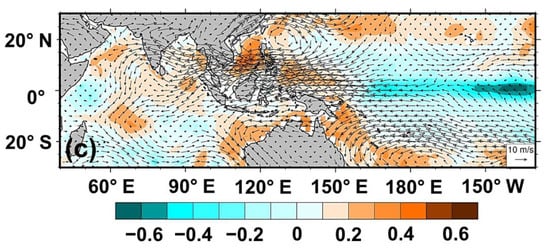
Figure 7.
Horizontal wind (850 hPa) (m/s) and Sea Surface Temperature (SST in °Celsius) in JJA from 1981 to 2016: (a). Climatological means, and anomalies in the (b). dry years and (c). wet years.
The anomalous circulations in the dry and wet years are generally associated with cooler and warmer SST in the region, respectively. In the equatorial central Pacific, a La Niña-like negative SST anomaly (SSTA) is evident in the wet years, whereas a weak positive SST anomaly is seen in the dry years. ERA-Interim circulation and SST anomalies in the dry and wet years are consistent with the understanding that positive and negative SSTA in the equatorial eastern Pacific can respectively induce cyclonic and anticyclonic anomalies in the western North Pacific [47,48]. As for the SSTA in the western Pacific and the eastern Indian Ocean, the positive SST anomalies in the wet years could provide more moisture to the easterly anomalies that transport moister air to the study area.
Jiang and Li (2017) found that orographic lifting is the primary forcing for the anomalous vertical motion over the Maritime Continent (MC) [49]. To describe the mountain lifting effect clearly, we plotted the zonal-vertical cross-section of zonal overturning circulation averaged over a latitude band (4° N–5° N) (Figure 8). Based on the climatology of the cross-section of meridionally-averaged horizontal wind in Figure 7a, the westerly winds appear as the background flows supported by the Asian-Australian Monsoon (Figure 8a). It is clearly observed that the mountain ridge on the west coast of Sumatra is located around 96° E–99° E (Figure 1). The low-level westerly winds encounter the mountain ranges and are raised on the windward side. The ascending motion is around the mountain top, and the convection-circulation-moisture feedback related to the lifting would enhance the precipitation along the coast [50]. A branch of descending motion is observed over the top and leeward side of the mountains in the east, followed by a region of ascending motion further to the east over the eastern coast of northern Sumatra (Figure 8a). Evidently, the overall zonal overturning circulation (westerly in the lower troposphere, easterly in the upper troposphere, and upward motion in between) is disrupted by the mountain ranges in northern Sumatra, which creates a relatively dry region over the mountains (Figure 8a).
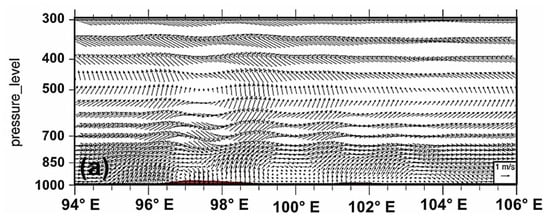
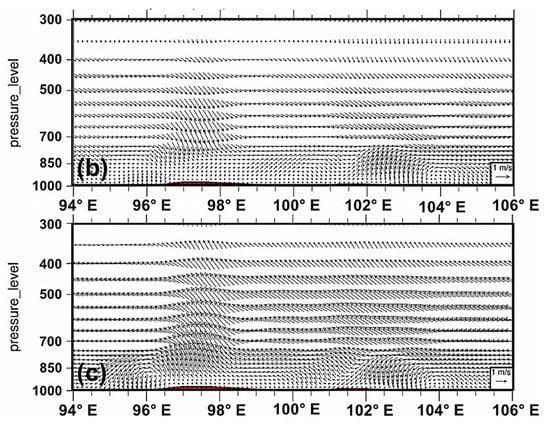
Figure 8.
Longitude-pressure cross-section of zonal wind and vertical motion averaged over 4° N–5° N in JJA periods from 1981 to 2016: (a) climatological means and anomalies in the (b) dry years and (c) wet years. Brown shading marks the surface elevation over the study area.
The anomalous overturning circulation in the dry years shown in Figure 8b is characterized by the subsiding westerly anomalies throughout the domain, particularly strong subsidence anomaly over northern Sumatra. The overall downward motion of anomalous westerly wind appears to suppress the convection and lead to negative precipitation anomaly in the whole region but with the largest anomaly over northern parts of Sumatra (Figure 2a). By contrast, in the wet years, strong easterly wind anomalies prevail in the entire domain, and strong anomalous upward motion occurs over northern Sumatra (Figure 8c). This anomalous circulation explains the appearance of positive precipitation anomalies over the equatorial belt in the region and the enhanced precipitation over northern Sumatra (Figure 2b). The stronger easterly wind during the wet years is caused by the "orographic effect" of the wind, which the first ascent by the highest elevation of Peninsula Malaysia to Sumatra Island.
3.3. Moisture Budget Analysis
In this research, we investigated the moisture budget associated with wet and dry JJAs following the formulation in Chou et al., (2009a) and Chou et al., (2009b) [31,44]. The domain for calculating the moisture budget is 2° N to 6° N and 95° E to 98° E (Figure 1). The vertical integral from 1000 to 300 hPa is computed in this study.
3.3.1. The Dry Years
During the dry JJA, the study area was characterized by a negative precipitation anomaly and an anomalously descending zone as shown in Figure 2a and Figure 8b. The vertical moisture transport associated with anomalous vertical motion,that is significantly less than zero, is the dominant term that balances negative precipitation anomaly (Figure 9). Because the vertical gradient term of climatological-mean specific humidity in pressure coordinate is positive, negative implies reduced upward motion (descending anomaly) over these areas, so the associated convection is weakened during the dry years (Figure 9).
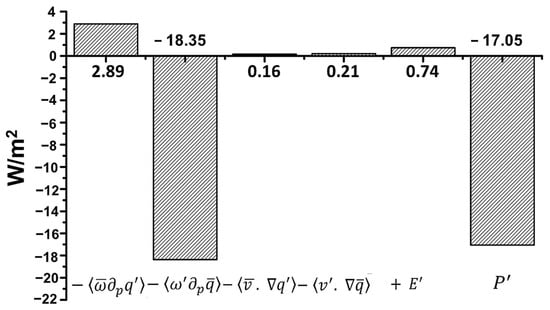
Figure 9.
Moisture budget analysis for the dry years over the land only including terrain correction in JJA periods from 1981 to 2016. The diagnosed domain is from 2° N to 6° N and from 95° E to 98° E.
Other terms such as horizontal moisture advections and , , and evaporation anomaly E’ are all positive but with much smaller magnitudes. The residual term in the moisture budget is positive but small (not shown). In summary, the negative precipitation anomaly is mainly balanced by the dynamic process via , which implies the weakening of tropical convection and the corresponding circulation [29,49]. We further examined the spatial distribution of surrounding the study area (Figure 10a). For brevity, most parts of the Sumatra Island are associated with negative A strong negative anomaly of is noticed over the study area, consistent with the local negative precipitation anomaly in the study region. Furthermore, there is an agreement between the pattern of the anomaly of and the anomaly of vertical velocity () (Figure 10b). It again reflects that the negative precipitation anomaly is caused by weakened upward motions over these areas.
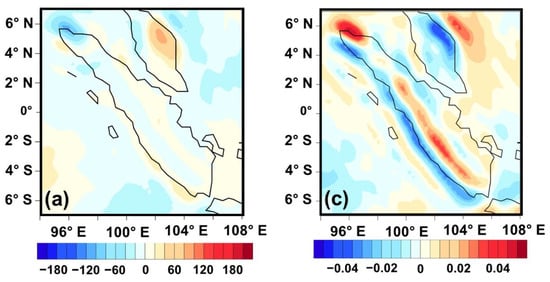
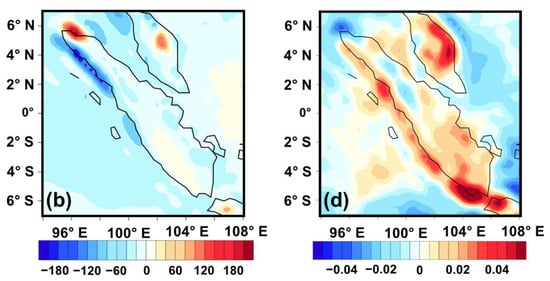
Figure 10.
(a). Moisture budget 2nd term (W/m−2) and (c). vertical velocity (500 hPa) anomaly (Pa/s) in the dry years. (b). Moisture budget 2nd term (W/m−2) and (d) vertical velocity (500 hPa) anomaly (Pa/s) in the wet years.
To investigate the convective activity, we presented the OLR anomaly, which can describe the large scale of the convection process over the study area [27]. In the tropics, the annual average of OLR distribution is mostly affected by the cloudiness and has a strong negative correlation with precipitation [50]. Positive OLR anomalies indicate suppressed convection and drier conditions, and negative OLR anomalies represent enhanced precipitation [51]. In principle, the positive (negative) of OLR anomalies refer to the decrease (increase) of cloud cover due to suppressed (enhanced) convections. The OLR anomalies shown in Figure 11 yield a clearer picture revealing a large-scale pattern that is characterized by stronger (weaker) convection in the western Pacific and weaker (stronger) convection in the eastern tropical Indian Ocean and the western Maritime Continent. This pattern suggests that the dryness in northern Sumatra is not a regional phenomenon; instead it is related to the variation in the large-scale tropical circulation. Interannual variability of the Pacific Walker Circulation (PWC) has an important role in those ENSO, monsoonal circulation, and precipitation over adjacent continents [52]. The easterlies (westerlies) wind anomalous at 850 hPa can be used as one of the indicators of strengthening (weakening) Walker circulation [53]. During the dry years, the anomalous westerly wind came from the western to central Pacific, implying the weaken of the PWC (Figure 7b and Figure 8b). For the wet years, the anomalous easterly wind has appeared over the equatorial Pacific, which refers to the enhanced of the PWC (Figure 7c and Figure 8c).
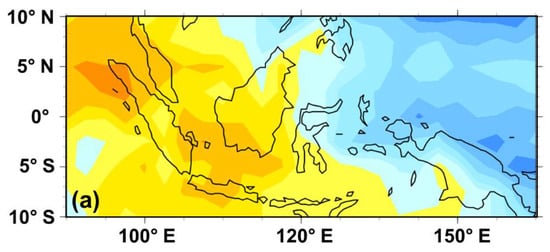
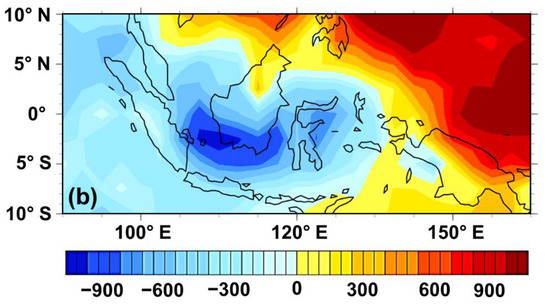
Figure 11.
Outgoing Longwave Radiation (OLR) anomaly (W/m2) in JJA from 1981 to 2016: (a) the dry years, and (b) the wet years.
3.3.2. The Wet Years
In the wet years, a positive precipitation anomaly is identified. Based on the moisture budget, the positive precipitation anomalies are mainly associated with , which is positive and much larger than other terms (Figure 12). Although the residual term is larger than in the dry JJA, as reflected in the larger difference between and the precipitation term, the vertical advection term by the anomalously upward motion appears to be the main physical process leading to the more extensive precipitation. The spatial patterns of shown in Figure 10b,d again demonstrate the close correspondence with anomalous upward motions. The upward motion anomaly is consistent with the negative OLR anomalies in the study region, as shown in Figure 11b, which again reveals that the enhanced vertical motion and convection in the study region are part of the variation large-scale circulation associated convection that exhibits an east-west dipolar structure. It also suggests a strong seesaw connection between the Philippine Sea and the Maritime Continent/eastern Indian Ocean region covering the study area.
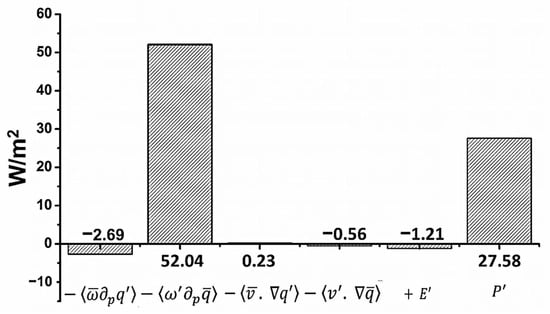
Figure 12.
Moisture budget analysis for the wet years over the land only including terrain correction in JJA periods from 1981 to 2016. The diagnosed domain is from 2° N to 6° N and from 95° E to 98° E.
The figure below shows the Intertropical Convergence Zone (ITCZ) during JJA periods overlaid by the mean of Sea Level Pressure from 1981 to 2016 (Figure 13a). The shift of ITCZ from south to the north is linear to the low sea level pressure. Based on Figure 13b,c, most of the precipitation occurs over the Philippine Sea and Bay of Bengal, triggered by low sea level pressure around those locations.
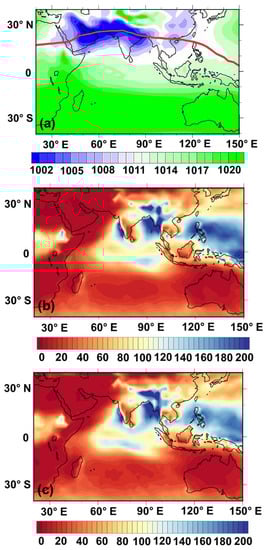
Figure 13.
(a) Long-term mean sea-level pressure (mb) for JJA 1981–2016. (b) Average precipitation of JJA (mm) for the dry years. (c) Averages precipitation of JJA (mm) for the wet years. The red line represents the location of the Intertropical Convergence Zone (ITCZ), a region of relatively low pressure during summer.
3.4. Velocity Potential
Velocity potential and divergent wind anomalies at the upper-levels (300 hPa) and low-levels (850 hPa) of the troposphere are analyzed for the wet and dry years, and the results are presented in Figure 14. Note that the upper troposphere’s velocity potential tends to be of the opposite signs relative to the one in the lower troposphere. Figure 14 indicates that the dry and wet conditions are related to the fluctuation of a large-scale dipolar pattern. In the dry years, a sinking branch occurs over the eastern Indian Ocean in the dry years, and a rising branch appears in the Philippine Sea. In the wet years, a dipole with reversed polarity is found. The pattern is consistent with the OLR and precipitation pattern shown above. The existence of the divergence-convergence dipole would maintain the anomalous low-level circulations shown in Figure 7, which result in the westerly and easterly anomalies, respectively, in the dry and wet year over the surrounding region of northern Sumatra. The easterly anomalies lead to anomalous uplifting over the mountain area in northern Sumatra and enhance the precipitation, whereas the westerly anomalies suppress the lifting and reduce the precipitation.
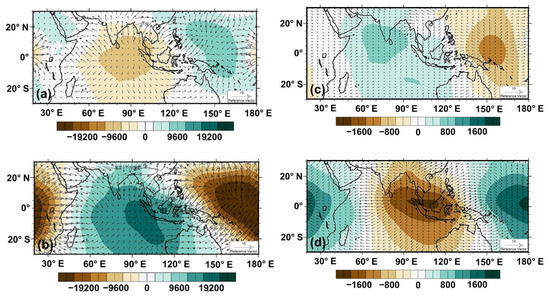
Figure 14.
Spatial distribution of velocity potential (shading, m2s−1) and divergent wind (the wind vectors, ms−1) anomaly fields at (a,b) 850 hPa and (c,d) 300 hPa during (a,c) the dry years and (b,d) the wet years.
The anomalous decreasing (increasing) precipitation during the dry years (wet years) was consistent with anomalous descending (ascending) motion of the 500 hPa omega anomaly, OLR anomaly, and 300 hPa velocity potential. In the context of large-scale circulations, the dry years (wet years over the study area are possibly related to the weakening (enhance) of the PWC. The weaken (strengthen) of PWC can be identified by the westerly winds anomaly (easterly wind) in 850 hPa of the horizontal wind. Based on the anomaly of SST over the Pacific Ocean in Figure 7b,c, the dry years were dominantly occurring during a positive anomaly of SST (El-Niño). In contrast, the wet years have a strong proxy of supporting a negative anomaly of SST (La-Nina). In addition, Kim et al., (2020) found that the modulation of PWC refers to the natural variability (warming/cooling/normal mode) of Indo-Pacific warm pool (IPWP), Indian Warm Pool (IWP), and Pacific Warm Pool (PWP) [27]. According to velocity potential in 300 hPa, the center of the sinking and the rising branch is closely linked to variability between IWP and PWP.
4. Conclusions
The contrasting characteristics of the circulation and moisture transport induce the precipitation anomalies during the dry/wet JJA in the northern parts of Sumatra Island. The spatial analysis (annual precipitation and inter-annual precipitation) and statistical approach show that the ERA-Interim precipitation can be used as the alternative data to represent observed precipitation in Sumatra’s northern parts. In JJA, the standard deviation of precipitation is higher in the northern parts of Sumatra Island than in other parts, implying the higher temporal variability of precipitation over the northern parts of Sumatra Island during JJA.
The dry years were mainly associated with a downward vertical velocity anomaly based on the circulation and moisture budget analysis. During the dry (wet) years, the vertical moisture transport is supported by the downward (upward) motion of anomalous vertical velocity, which is significantly less than zero. It implies the strengthened (weakened) descending motion, which prevails climatologically, and the negative (positive) precipitation anomaly over the study area during dry and wet JJAs (Table 1). Moreover, the moisture budget is dominated by and anomalous vertical velocity (), which again reflects that the negative (positive) precipitation anomaly is related to the weakened (strengthened) upward motion over the study area.

Table 1.
Relationship between precipitation anomaly and vertical velocity anomaly during JJA periods over the study area.
The anomalous overturning circulation in the dry years (wet years) is characterized by subsiding westerly (ascending easterly) anomalies throughout the domain. The overall downward (upward) motion of the anomalous westerly (easterly) winds appears to suppress (support) the convection and lead to negative (positive) precipitation anomaly in the whole region but with the largest anomaly over northern Sumatra. Based on the cross-section of zonal wind and vertical motion, the topography affects the Sumatra Island precipitation variability. Although the topography is fixed, the variation in prevailing flow (e.g., easterly vs. westerly anomalies) would result in marked interannual variability in precipitation around the topography.
During the boreal summer, the AAM variation is crucial for triggering the precipitation variability in the study area. A strengthen or weaken of the AAM has a strong relationship with the convection over the study area. The AAM, a westerly wind, is more dominant during the dry years. In contrast, the AAM becomes weaker during the wet years, and the easterly wind is more dominant during the wet years. Since a strong proxy of negative SSTA can be found during the wet years, the easterly wind anomaly is possibly supported by ENSO. In the context of large circulation, a teleconnection between AAM and other global circulations can be implied from this case.
Furthermore, a contrast of the large-scale convection pattern appears between the western Pacific and the tropical Indian Ocean, which implies that the fluctuation of wet/dry JJA in the northern parts of Sumatra is a regional phenomenon related to the variation in the large-scale tropical circulation over the Philippine Sea and the Maritime Continent/eastern Indian Ocean region. The large-scale tropical circulation is possibly related to the PWC modulation triggered by the natural variability of IPWP, IWP, and PWP. The dry years (wet years) refer to the weaken (strengthen) of PWC, which is represented by the westerly (easterly) anomaly of horizontal winds in 850 hPa.
Analysis of velocity potential, OLR, and precipitation reveals that the dry and wet conditions in northern parts of Sumatra Island are related to the fluctuation of a large-scale dipolar pattern. In the dry (wet) years, an anomalous sinking (rising) branch occurs over the Indian Ocean, and an anomalous rising (sinking) branch appears in the Philippine Sea. The presence of divergence-convergence dipole would support the low-level westerly and easterly anomalies crossing the SCS, the Indochina Peninsula, and the Bay of Bengal. Moreover, results in the dry and wet JJAs in northern parts of Sumatra, respectively. The easterly anomalies lead to anomalous uplifting over the mountain area in northern Sumatra and enhance the precipitation, whereas the westerly anomalies suppress the lifting and reduce the precipitation. A future investigation needs to confirm the influencing factors that drive the anomalous circulation and convection in the region.
Author Contributions
Y.D. and H.-H.H. conceived the research. Y.D. conducted the analyses and prepare the manuscript. H.-H.H. guided the research and helped revise the manuscript. J.-Y.Y. provided suggestion on moisture budget calculation and made useful comments on the first draft of the manuscript. All authors have read and agreed to the published version of the manuscript.
Funding
This research was supported by the Ministry of Science and Technology (Taiwan) under grants MOST 109-2123-M-001-004.
Institutional Review Board Statement
Not applicable.
Informed Consent Statement
Not applicable.
Data Availability Statement
Not applicable.
Acknowledgments
Y.D. is supported by the Taiwan International Graduate Program, Academia Sinica, and the Department of Atmospheric Sciences, National Central University. We appreciate the European Center for Medium-Range Weather Forecast (ECMWF) and the National Oceanic and Atmospheric Administration/Office of Oceanic and Atmospheric Research/Earth System Research Laboratory Physical Science Division (NOAA/OAR/ESRL PSD) for making available the ERA-Interim reanalysis and outgoing longwave radiation data.
Conflicts of Interest
The authors declare no conflict of interest.
References
- Park, J.-Y.; Jhun, J.-G.; Yim, S.-Y.; Kim, W.-M. Decadal changes in two types of the western North Pacific subtropical high in boreal summer associated with Asian summer monsoon/El Niño–Southern Oscillation connections. J. Geophys. Res. 2010, 115. [Google Scholar] [CrossRef]
- Ramage, C.S. Role of a tropical “maritime continent” in the atmospheric circulation. Mon. Weather Rev. 1968, 96, 365–370. [Google Scholar] [CrossRef]
- Aldrian, E.; Dwi Susanto, R. Identification of three dominant rainfall regions within Indonesia and their relationship to sea surface temperature. Int. J. Climatol. 2003, 23, 1435–1452. [Google Scholar] [CrossRef]
- As-syakur, A.R.; Adnyana, I.W.S.; Mahendra, M.S.; Arthana, I.W.; Merit, I.N.; Kasa, I.W.; Ekayanti, N.W.; Nuarsa, I.W.; Sunarta, I.N. Observation of spatial patterns on the rainfall response to ENSO and IOD over Indonesia using TRMM Multisatellite Precipitation Analysis (TMPA). Int. J. Climatol. 2014, 34, 3825–3839. [Google Scholar] [CrossRef]
- Aldrian, E.; Dümenil Gates, L.; Widodo, F.H. Seasonal variability of Indonesian rainfall in ECHAM4 simulations and in the reanalyses: The role of ENSO. Theor. Appl. Climatol. 2006, 87, 41–59. [Google Scholar] [CrossRef]
- Haylock, M.; McBride, J. Spatial Coherence and Predictability of Indonesian Wet Season Rainfall. J. Clim. 2001, 14, 3882–3887. [Google Scholar] [CrossRef]
- Qian, J.-H.; Robertson, A.W.; Moron, V. Interactions among ENSO, the Monsoon, and Diurnal Cycle in Rainfall Variability over Java, Indonesia. J. Atmos. Sci. 2010, 67, 3509–3524. [Google Scholar] [CrossRef]
- Aldrian, E.; Djamil, Y.S. Spatio-temporal climatic change of rainfall in East Java Indonesia. Int. J. Climatol. 2008, 28, 435–448. [Google Scholar] [CrossRef]
- Siswanto; van der Schrier, G.; Jan van Oldenborgh, G.; van den Hurk, B.; Aldrian, E.; Swarinoto, Y.; Sulistya, W.; Eka Sakya, A. A very unusual precipitation event associated with the 2015 floods in Jakarta: An analysis of the meteorological factors. Weather Clim. Extrem. 2017, 16, 23–28. [Google Scholar] [CrossRef]
- As-syakur, A.R.; Tanaka, T.; Osawa, T.; Mahendra, M.S. Indonesian rainfall variability observation using TRMM multi-satellite data. Int. J. Remote Sens. 2013, 34, 7723–7738. [Google Scholar] [CrossRef]
- Kumar, K.K.; Rajagopalan, B.; Hoerling, M.; Bates, G.; Bates, G.; Cane, M. Unraveling the mystery of Indian monsoon failure during El Niño. Science 2006, 314, 115–119. [Google Scholar] [CrossRef] [PubMed]
- Alfahmi, F.; Boer, R.; Hidayat, R.; Perdinan; Sopaheluwakan, A. The Impact of Concave Coastline on Rainfall Offshore Distribution over Indonesian Maritime Continent. Sci. World J. 2019, 2019, 1–11. [Google Scholar] [CrossRef] [PubMed]
- BNPB Disaster Database in Indonesia. Available online: http://bnpb.cloud/dibi/tabel1 (accessed on 19 November 2019).
- Susilo, G.E.; Yamamoto, K.; Imai, T.; Ishii, Y.; Fukami, H.; Sekine, M. The effect of ENSO on rainfall characteristics in the tropical peatland areas of Central Kalimantan, Indonesia. Hydrol. Sci. J. 2013, 58, 539–548. [Google Scholar] [CrossRef]
- Rahim, A.; Hidayati, R.F.; Akhmad, F.; Mamenun, M. Model Prediction Analysis of Rainy Season onset in South Sulawesi. Meteorol. Geophys. J. 2015, 12, 65–75. [Google Scholar]
- Harijono, S.W.B. The Indian Summer Monsson Contribution to the JJA Rainfall over the Northern Part of Sumatra during the co-occuring El-Nino and Dipole Mode (+) Years. Int. J. Remote Sens. Earth Sci. 2007, 4, 18–24. [Google Scholar]
- Nicholls, N. All-India Summer Monsoon Rainfall and Sea Surface Temperatures around Northern Australia and Indonesia. J. Clim. 1995, 8, 1463–1467. [Google Scholar] [CrossRef]
- Soman, M.K.; Slingo, J. Sensitivity of the asian summer monsoon to aspects of sea-surface-temperature anomalies in the tropical pacific ocean. Q. J. R. Meteorol. Soc. 1997, 123, 309–336. [Google Scholar] [CrossRef]
- Webster, P.J.; Magaña, V.O.; Palmer, T.N.; Shukla, J.; Tomas, R.A.; Yanai, M.; Yasunari, T. Monsoons: Processes, predictability, and the prospects for prediction. J. Geophys. Res. Ocean. 1998, 103, 14451–14510. [Google Scholar] [CrossRef]
- Wang, B.; Yim, S.-Y.; Lee, J.-Y.; Liu, J.; Ha, K.-J. Future change of Asian-Australian monsoon under RCP 4.5 anthropogenic warming scenario. Clim. Dyn. 2013, 42, 83–100. [Google Scholar] [CrossRef]
- Ju, J.; Slingo, J. The Asian summer monsoon and ENSO. Q. J. R. Meteorol. Soc. 1995, 121, 1133–1168. [Google Scholar] [CrossRef]
- Akbar, K. Analysis of Seasonal Rainfall Pattern and Frequency of the Extreme Rainfall relate to the Rainfall Control Anomalies in Aceh Province. Master’s Thesis, Physics Department, Unsyiah University, Banda Aceh, Indonesia, 2014. [Google Scholar]
- Liebmann, B.; Hendon, H.H. Synoptic-Scale Disturbances near the Equator. J. Atmos. Sci. 1990, 47, 1463–1479. [Google Scholar] [CrossRef]
- Wheeler, M.C.; McBride, J.L. Australian-Indonesian monsoon. In Intraseasonal Variability in the Atmosphere-Ocean Climate System; Lau, W.K.M., Waliser, D.E., Eds.; Springer: Berlin/Heidelberg, Germany, 2005; pp. 125–173. [Google Scholar]
- Wang, B.; Wu, R.; Li, T. Atmosphere–Warm Ocean Interaction and Its Impacts on Asian–Australian Monsoon Variation. J. Clim. 2003, 16, 1195–1211. [Google Scholar] [CrossRef]
- Li, J.; Yang, Y.-M.; Wang, B. Evaluation of NESMv3 and CMIP5 Models’ Performance on Simulation of Asian-Australian Monsoon. Atmosphere 2018, 9, 327. [Google Scholar] [CrossRef]
- Kim, H.-R.; Ha, K.-J.; Moon, S.; Oh, H.; Sharma, S. Impact of the Indo-Pacific Warm Pool on the Hadley, Walker, and Monsoon Circulations. Atmosphere 2020, 11, 1030. [Google Scholar] [CrossRef]
- Jin, F.; Kitoh, A.; Alpert, P. Climatological relationships among the moisture budget components and rainfall amounts over the Mediterranean based on a super-high-resolution climate model. J. Geophys. Res. 2011, 116. [Google Scholar] [CrossRef]
- Portis, D.H.; Lamb, P.J.; Zangvil, A. Investigation of Large-Scale Atmospheric Moisture Budget and Land Surface Interactions over U.S. Southern Great Plains including for CLASIC (June 2007). J. Hydrometeorol. 2012, 13, 1719–1738. [Google Scholar]
- Hsu, P.-C.; Li, T.; Murakami, H.; Kitoh, A. Future change of the global monsoon revealed from 19 CMIP5 models. J. Geophys. Res. Atmos. 2013, 118, 1247–1260. [Google Scholar] [CrossRef]
- Kiranmayi, L.; Maloney, E.D. Intraseasonal moist static energy budget in reanalysis data. J. Geophys. Res. Atmos. 2011, 116. [Google Scholar] [CrossRef]
- Li, L.; Li, W.; Barros, A.P. Atmospheric moisture budget and its regulation of the summer precipitation variability over the Southeastern United States. Clim. Dyn. 2013, 41, 613–631. [Google Scholar] [CrossRef]
- Brubaker, K.L.; Entekhabi, D.; Eagleson, P.S. Estimation of Continental Precipitation Recycling. J. Clim. 1993, 6, 1077–1089. [Google Scholar] [CrossRef]
- Wang, Z.; Duan, A.; Yang, S.; Ullah, K. Atmospheric moisture budget and its regulation on the variability of summer precipitation over the Tibetan Plateau. J. Geophys. Res. Atmos. 2017, 122, 614–630. [Google Scholar] [CrossRef]
- Wyrtki, K. Physical Oceanography of the Southeast Asian Waters; Scripps Institution of Oceanography: San Diego, CA, USA, 1961; p. 195. [Google Scholar]
- Funk, C.; Peterson, P.; Landsfeld, M.; Pedreros, D.; Verdin, J.; Shukla, S.; Husak, G.; Rowland, J.; Harrison, L.; Hoell, A.; et al. The climate hazards infrared precipitation with stations—A new environmental record for monitoring extremes. Sci. Data 2015, 2, 150066. [Google Scholar] [CrossRef] [PubMed]
- Liu, C.-Y.; Aryastana, P.; Liu, G.-R.; Huang, W.-R. Assessment of satellite precipitation product estimates over Bali Island. Atmos. Res. 2020, 244, 105032. [Google Scholar] [CrossRef]
- NOAA, PSL. Sea Level Pressure (SLP). Available online: https://psl.noaa.gov/ (accessed on 19 January 2021).
- Hunter, L.M.; Murray, S.; Riosmena, F. Rainfall Patterns and U.S. Migration from Rural Mexico. Int. Migr. Rev. 2013, 47, 874–909. [Google Scholar] [CrossRef] [PubMed]
- Chou, C.; Neelin, J.D.; Chen, C.-A.; Tu, J.-Y. Evaluating the “Rich-Get-Richer” Mechanism in Tropical Precipitation Change under Global Warming. J. Clim. W4 2009, 22, 1982–2005. [Google Scholar] [CrossRef]
- Jongaramrungruang, S.; Seo, H.; Ummenhofer, C.C. Intraseasonal rainfall variability in the Bay of Bengal during the Summer Monsoon: Coupling with the ocean and modulation by the Indian Ocean Dipole. Atmos. Sci. Lett. 2017, 18, 88–95. [Google Scholar] [CrossRef]
- Liu, H.-W.; Yu, J.-Y.; Chen, C.-A. Changes of tropical precipitation and convective structure under global warming projected by CMIP5 model simulations. Terr. Atmos. Ocean. Sci. 2018, 29, 429–440. [Google Scholar] [CrossRef]
- Müller, R.; Kunz, A.; Hurst, D.F.; Rolf, C.; Krämer, M.; Riese, M. The need for accurate long-term measurements of water vapor in the upper troposphere and lower stratosphere with global coverage. Earths Future 2016, 4, 25–32. [Google Scholar] [CrossRef]
- Gleixner, S.; Demissie, T.; Diro, G.T. Did ERA5 Improve Temperature and Precipitation Reanalysis over East Africa? Atmosphere 2020, 11, 996. [Google Scholar] [CrossRef]
- Gao, L.; Bernhardt, M.; Schulz, K. Elevation correction of ERA-Interim temperature data in complex terrain. Hydrol. Earth Syst. Sci. 2012, 16, 4661–4673. [Google Scholar] [CrossRef]
- Chen, W.; Guan, Z.; Yang, H.; Xu, Q. East Asian-Australian Monsoon Variations and Their Impacts on Regional Climate during Boreal Summer. J. Meteorol. Soc. Jpn. Ser. II 2020, 98, 283–297. [Google Scholar] [CrossRef]
- Chung, P.-H.; Sui, C.-H.; Li, T. Interannual relationships between the tropical sea surface temperature and summertime subtropical anticyclone over the western North Pacific. J. Geophys. Res. 2011, 116. [Google Scholar] [CrossRef]
- Chen, Z.; Wen, Z.; Wu, R.; Lin, X.; Wang, J. Relative importance of tropical SST anomalies in maintaining the Western North Pacific anomalous anticyclone during El Niño to La Niña transition years. Clim. Dyn. 2015, 46, 1027–1041. [Google Scholar] [CrossRef]
- Jiang, L.; Li, T. Why rainfall response to El Niño over Maritime Continent is weaker and non-uniform in boreal winter than in boreal summer. Clim. Dyn. 2017, 51, 1465–1483. [Google Scholar] [CrossRef]
- Grabowski, W.W.; Moncrieff, M.W. Moisture–Convection feedback in the tropics. Q. J. R. Meteorol. Soc. 2004, 130, 3081–3104. [Google Scholar] [CrossRef]
- Li, T.; Chen, M.; Shen, X.; Wu, B. Relative Roles of Dynamic and Thermodynamic Processes in Causing Evolution Asymmetry between El Niño and La Niña*. J. Clim. 2016, 29, 2201–2220. [Google Scholar]
- Webster, P.J.; Moore, A.M.; Loschnigg, J.P.; Leben, R.R. Coupled ocean–Atmosphere dynamics in the Indian Ocean during 1997–1998. Nature 1999, 401, 356. [Google Scholar] [CrossRef]
- Sohn, B.J.; Yeh, S.-W.; Schmetz, J.; Song, H.-J. Observational evidences of Walker circulation change over the last 30 years contrasting with GCM results. Clim. Dyn. 2012, 40, 1721–1732. [Google Scholar] [CrossRef]
Publisher’s Note: MDPI stays neutral with regard to jurisdictional claims in published maps and institutional affiliations. |
© 2021 by the authors. Licensee MDPI, Basel, Switzerland. This article is an open access article distributed under the terms and conditions of the Creative Commons Attribution (CC BY) license (http://creativecommons.org/licenses/by/4.0/).