Abstract
People spend most of their time in indoors and, as a result, indoor air quality has become an issue of increasing concern. Due to the use of coal and heavy transportation in Beijing, China, concentrations of polycyclic aromatic hydrocarbons (PAHs) bound to PM2.5 have risen and caused concerns about health risk, both outdoors and indoors. This study carried out quantitative investigation of PM2.5-bound PAHs in middle school classrooms and estimated the health risk to adolescents. According to the results, indoor PM2.5 concentrations ranged from 20.9 μg/m3 to 257.6 μg/m3, indoor PAH concentrations ranged from 8.0 ng/m3 to 83.0 ng/m3, and both were statistically correlated with outdoor concentrations. Results of diagnostic ratios (DR) and the PMF (positive matrix factorization) model indicated that coal combustion was the main source of PAHs in the classroom environment. The average value of incremental lifetime cancer risk (ILCR) was estimated to be 1.49 × 10⁻⁶, which indicated a potential health risk to students according to USEPA standards. Predictions showed that by 2021–2022, the risk will be reduced to an acceptable level. Results of this study could provide useful information for air pollution control in Beijing and proposing targeted solution against indoor air pollution.
1. Introduction
Due to an increasing population, vehicles, and industrial activities, severe air pollution has occurred and has drawn attention in recent years in China, especially in its capital, Beijing. Based on previous research [1,2,3], the main pollutant that causes this problem is PM2.5. PM2.5 is believed to cause numerous adverse effects on the environment and human health [4]. According to the “Beijing Ecology and Environment Statement 2019”, data published by the Beijing Municipal Ecology and Environmental Bureau [5], the average annual concentration of PM2.5 in Beijing in 2019 was 42 µg/m3, while the guideline is 35 µg/m3. A considerable number of policies and regulations have been carried out, and the number of days when the air quality level was above heavy pollution from 2013 to 2019 for each year was 58, 45, 42, 38, 22, 13 and 4 days, respectively. Despite the trend of air quality getting better, heavy pollution weather occurred sometimes.
The spatial topography and climatic conditions of Beijing have a significant connection with the air pollution in this city [6]. There are several mountains locating in the western, northern and northeastern area of Beijing, while the land is flat in the southeast region. Furthermore, the concentration of air pollutants decreases when wind speed increases. Moreover, lots of tall buildings have been built in recent decades, thus, the diffusion of air pollutants is blocked [7]. On this basis, a large population and complex industrial structure make this problem even worse [6].
Since PM2.5 is able to penetrate and deposit deep in the tracheobronchial and alveolar regions in the human body and have systemic effects [8], it can cause various health problems, such as respiratory disease, the development of lung cancer and increased daily mortality and morbidity [9].
Previous studies showed that people spend approximately 80%–90% of their time indoors everyday [13], thus, indoor air quality is crucial to people’s health. However, several studies have found that the indoor PM2.5 level is even worse than that of the outside environment [14,15,16]. PAHs bound to PM2.5 have a great effect on the indoor air quality, which is impacted by various sources, such as cooking, smoking, domestic chemicals, and outdoor sources [17]. To the best of our knowledge, the vast majority of research about indoor air pollution focused on public buildings [18,19], especially residential communities [20,21], and comparatively few have studied classroom environments. Chinese middle-school students spend nearly a half a day or more time in the classroom every day, so the classroom environment is important for student health.
Among all organic chemicals contained in PM2.5, polycyclic aromatic hydrocarbons (PAHs) are of great concern because they have potential risks to human health [10]. PAHs are relatively ubiquitous chemicals in the environment [11]. One of the PAHs, benzo(a)pyrene (BaP), is a strong carcinogen and, as such, it is used as an indicator in risk assessments regarding exposure to PAHs (EC, 2005). PAHs can be generated from natural sources such as volcanic eruptions and forest fires, but its main source is anthropogenic emissions, including the combustion of fossil fuel and biomass, automobile exhaust, and industrial activities, etc. [12].
Studies found that the fine particulate matter concentrations observed in classrooms were higher than those being observed in residences and commercial buildings [17,22]. At the same time, there are few typical indoor sources such as smoking and cooking in classroom environments [23], leading to challenges for source tracking. Because most students are in the period of growth and development, they are relatively susceptible to pollutants when compared to adults [24]. Therefore, it is necessary to study pollution levels and health risk of PM2.5-bound PAHs in classrooms. Furthermore, China has not carried out indoor PM2.5 standards as in the case of some western countries and, hence, this area needs further consideration.
The PAHs in air have gas and particle phases. Gas-phase PAHs mostly have less than four rings in their chemical structure, while particle-phase PAHs mostly have more than four rings. According to their toxicity [25], high molecular weight (HMW) PAHs with five or six rings, such as BaP, are more dangerous to human health. Thus, PAHs in the particle phase are much more dangerous than those in the gas phase. In this study, we collected PAHs bound to PM2.5 for analysis.
In our study, samples were all collected from a middle school in Beijing. Possible sources of PAHs bound to PM2.5 were identified by applying diagnostic ratio and the positive matrix factorization (PMF) model. Assessment of students’ health risk caused by indoor PAHs was performed by the incremental lifetime cancer risk (ILCR) model, combined with Monte Carlo simulation to reduce the uncertainty of results. Potential health risks to students were pointed out in the classroom environment, which should not be ignored in the long term. The findings of this study aim to broaden our understanding of air pollution in specific enclosed environments like the classroom. We also analyzed the main factor that contributed to the risk assessment. The results are also expected to provide useful information for researchers conducting analyses of health risks and help decision-makers in regard to environmental policy-making and control measures.
2. Materials and Methods
2.1. Sampling Site
In order to ensure that the sampling points were representative, we chose a middle school in the Xicheng District. The middle school is near a road that has a large traffic flow. This district is in the center of Beijing and has typical surroundings, such as main roads, a residential area, and a mall, with no construction sites or factories. In order to use this sample site as a representative school, both indoor and outdoor sampling points were established. The indoor sampling point was set as a classroom on the third floor of the main three-story teaching building, while the outdoor point was set as the roof of the same teaching building with a similar height. Indoor and outdoor sampling were operated simultaneously to be comparable.
2.2. Sample Collection
Sampling was conducted from October 2016 to March 2017. PM 2.5 samples were collected across three seasons: (1) autumn, October to November 2016; (2) winter, January 2017 and (3) spring, March 2017. According to the ambient PM2.5 level calendar [5], most heavy pollution occurred during the period from October to March of the following year. The sampling dates were random, and we tried to conduct the sampling as much as possible. Several samples were collected in winter vacation to show the differences between school time and long vacations. Furthermore, autumn samples were collected before Beijing’s central heating period, while winter and spring samples were collected within the central heating period.
A total of 54 samples were taken. The sampling was carried out using the TH-150 series intelligent total suspended particle flow sampler (Wuhan Tianhong Instrument Co., Ltd. in Wuhan, China). This instrument can collect PM2.5, PM10 or TSP (total suspended particulate) using cutters of different sizes. In this study, we used the cutter for collecting PM2.5. The sampling procedure referred to the national standards of China (HJ637-2013). The sampler operated at a flow rate of 100 L/min. Each sample was collected by the quartz filter for 24 h. Before sampling, the quartz filters were prebaked in muffle oven at 500 °C for 5 h, as this removes the target organic compounds. The sample filters were stabilized in a temperature-stable and humidity-controlled incubator before and after collection for 24 h. Each filter was weighed at least three times using an electronic analytical balance before and after sampling to ensure variance among the measurement results for each sample at <10 μg. All the filters were analyzed by ultrasonic extraction–liquid chromatography using Waters UPLC H-class. Blank tests were carried out to ensure the reliability of the sampling and testing process. The result showed that no target PAHs were found in the blank tests.
According to the results, 12 PAHs were identified: phenanthrene (Phe), anthracene (Ant), fluoranthene (FL), pyrene (Pyr), benzo(a)anthracene (BaA), chrysene (Chr), benzo(b)fluoranthene (BbF), benzo(k)fluoranthene (BkF), benzo(a)pyrene (BaP), dibenzo(a,h)anthracene (DBA), benzo(ghi)perylene (BghiP), and indeno(1,2,3-cd)pyrene (IcdP).
2.3. Source Apportionment
Atmospheric polycyclic aromatic hydrocarbons (PAHs) are the result of comprehensive emissions from a variety of sources. Studies have been experimenting with different methods to determine the main source of PAH pollution. Principal component analysis (PCA), cluster analysis, and diagnostic ratios (DR) are usually applied [26]. The diagnostic ratios method is based on differences in PAH composition and relative concentrations resulting from different combustion modes. DR method can identify the source of pollution according to the ratio of different PAHs, and is widely used and very convenient for the analysis of possible sources of PAHs. In this study, the DR method was applied to carry out source apportionment.
The main indicators used in the DR method are InP/(InP + BghiP), BaA/(BaA + Chr), Flu/(Flu + Pyr) and BaP/BghiP. According to these values, the possible sources of the collected PAHs can be found. The values we found in previous research are shown in Table 1 [26].

Table 1.
Values of the diagnostic ratios (DR) method from different polycyclic aromatic hydrocarbon (PAH) resources.
To make the source apportionment more precisely, the PMF model was used. USEPA PMF v5.0 was used by many researchers, and after many improvements, the source apportionment results conducted by PMF were reliable.
2.4. Exposure Assessment
In this study, a BaP-equivalent concentration (BaPeq) was used to evaluate the toxicity of PM2.5-bound PAHs, which can be expressed by the toxic equivalent factor (TEFs) of PAHs based on benzo [a] pyrene (BaP). The equation is as follows:
where Ci is the concentration of PAH species. Table 2 showed the TEF value [25,27] and average concentration of PAHs during our observation.

Table 2.
PAH species, toxic equivalent factors (TEFs) and concentrations.
The USEPA assumes that carcinogenic risk is believed to be a non-threshold effect, since even some small influences on the individual cell can result in abnormal cell proliferation and a clinical disease. People may face potential health risks due to exposure to the pollutants even at a relatively low concentration.
PAH exposure to the human body is mainly though inhalation and skin (although inhalation is much more dangerous than skin exposure). PAHs bound to PM2.5 can enter the human body via respiration and present a potential carcinogenic risk. The carcinogenic risk of PAHs by respiratory exposure can be estimated using the incremental lifetime cancer risk (ILCR) model [28,29].
The value of risk can be calculated as a unitless parameter, R, indicating carcinogenic incidence over the normal level. The equation is as follows:
where RI indicates the incremental lifetime cancer risk due to PAH exposure (dimensionless); CI denotes the total concentration of BaPeq (ng/m3); CSF represents the inhalation cancer slope factor of BaP (kg·day·mg−1); BW is body weight (kg); IRi is inhalation rate(m3·day−1); EF is exposure frequency (day·year −1); ED is exposure duration (year); AT = averaging time (70 years for carcinogens) (US EPA 1991); and cf is the conversion factor (10−6).
To reduce uncertainty of parameters in the equation, the Monte Carlo simulation was also conducted for both probability analysis and uncertainty assessment, where parameters were expressed by a series of data based on probability distribution. The result of the Monte Carlo simulation was a distribution value rather than specific data.
USEPA regards 1.0 ×10⁻⁶ as acceptable for risk level (USEPA, 2001), which suggests one in one million might suffer from cancer due to pollutant exposure in the sampling area. If the assessment result is less than 1.0 × 10⁻⁶, the risk level is acceptable; if the result is more than 1.0 × 10⁻⁶ but less than 1.0 × 10⁻⁴, there is potential risk; and if the result is higher than 1.0 × 10⁻⁴, the risk level is serious and further protective management should be carried out.
3. Results
3.1. Characteristics of the Pollutants in the Sample Site
Figure 1 shows the variation levels of PM2.5 and PAH mass concentration in indoor and outdoor observations from our samples. We conducted observations from autumn 2016 to spring 2017 and collected 54 samples in total. The average concentration of PM2.5 in the classroom was 103.7 μg/m3 (range: 20.9–257.6 μg/m3), while the average concentration of ambient PM2.5 outdoors was 131.8μg/m3 (range: 32.4–365.2 μg/m3). According to the Environmental Air Quality Standard (GB 3095-2012) published by the Ministry of Environmental Ecology of China, the standard for PM2.5 daily average concentration in a residential area is 75 μg/m3. During the sampling period, 44.4% of the indoor and 70.4% of outdoor PM2.5 samples exceeded the national standard. The outdoor PM2.5 concentration during the most polluted period was almost 11 times higher than the concentration during the most ideal period.
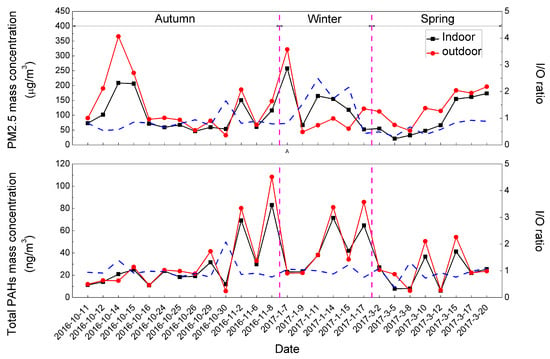
Figure 1.
Time series and indoor/outdoor (I/O) ratio of PM2.5 and total PAH concentrations in indoor/outdoor air.
Although compared to the concentrations of outdoor air, indoors is a relatively safe environment, there was still a statistically significant correlation between PM2.5 concentrations in the indoor and outdoor environments. In the autumn and spring sampling period, the Pearson correlation coefficient between the indoor and outdoor PM2.5 concentration was 0.90 (p < 0.01). Hence, outdoor PM2.5 concentrations have a great impact on air quality indoors, and, in most cases, were higher than those of indoors. However, during the winter sampling period, the correlation between the indoor and outdoor PM2.5 was relatively weak, with a correlation coefficient of 0.73 (p < 0.01), and observations from 9 January to 15 January showed that indoor PM2.5 concentrations actually exceeded outdoor concentrations significantly. This time period was during the school’s winter vacation. The concentration of PAHs indoors did not rise to the corresponding level, and this was most likely related to the dust accumulation in the indoors environment during long vacations.
High concentration of fine particulates in indoor environments have been reported in several investigations. Chithra et al. [23] found that in Indian classrooms, concentrations of PM10 and PM2.5 were observed to be 136.1 ± 60.43 and 36.30 ± 14.98 μg/m3, respectively. Indoor PM concentrations were higher than outdoor PM levels, with the concentration of PM10 being around two times higher that of the outdoors. Chen et al. [30] conducted investigations in three indoor environments in Beijing and found that average concentrations of PM2.5 in a dormitory, office, and residential house were 52.1 μg/m3, 55.3 μg/m3, 35.5 μg/m3, respectively. Compared with these studies, the classroom pollution in our study was much higher than other indoor environments such as offices and homes.
In this study, the average mass concentration of PAHs bound to PM2.5 in the outdoors during the entire sampling period was 33.7 ng/m3, ranging from 6.5 ng/m3 to 108.4 ng/m3. The indoor PAH concentration showed the same trend as that of the outdoors and the average value was 29.8 ng/m3, ranging from 8.0 ng/m3 to 83.0 ng/m3. Table 3 and Table 4 show the concentration data of PM2.5 and total PAHs in this study.

Table 3.
Mass concentrations of PM2.5 during the sampling period.

Table 4.
Mass concentrations of total PAHs during sampling period.
Compared to PM2.5, PAHs showed more obvious seasonal trends, as during the cold sampling period the concentration rose and during the warm period it declined. The difference in concentration was significant. Generally, the effect of the meteorological conditions can lead to high PAH concentrations during the winter season, such as low atmospheric temperature affecting the distribution of PAH gas and particles, low mixing height reducing PAH dispersion and so on, as several studies have reported [31,32,33]. Furthermore, Beijing’s central heating might contribute significantly to the pollutants according to the seasonal variation.
Consistent with PM2.5, there was an apparent correlation between indoor and outdoor PAHs with a correlation coefficient of 0.97 (p < 0.01), which suggested that outdoor pollution was a major source of indoor air pollutants.
The blue dotted line in Figure 1 shows the ratio of indoor PM2.5 or PAH concentration to outdoors (I/O ratio) [34]. The I/O ratio directly represents the relationship between indoor and outdoor concentrations, which is easy to understand and widely used [35].
Air continues to circulate from the outdoor environment to indoors through voids in windows and doors, and human activities also cause air circulation, both affecting indoor air quality [21]. In our study, the I/O ratio was used to describe the relationship between indoor and outdoor pollution states. Most I/O ratios of PM2.5 and PAHs were lower than 1; the average values were 0.82 and 0.98, respectively.
Investigations into the I/O ratio in different environments have been conducted in previous papers. For example, Zhou et al.
[21] reported that the I/O ratio of residential houses in Tianjin varied from 0.67 to 0.89 with a temporal delay in the outdoor PM2.5 concentration. Chen et al. [35] reviewed 77 studies including 4000 homes and found that indoor particle emission rates, building structures, and air exchange rates had considerable impacts on the I/O ratio. As for PAHs in the school environment, few studies have been carried out. Wang et al. [36] reviewed over 16 studies from different areas, and found that the I/O ratio of PM2.5 ranged from 0.50 to 0.95, and the I/O ratio of PAH ranged from 0.43 to 0.93. According to Long and Sarnat [37], if the I/O ratio was larger than 1.15, an indoor source would be present. From this point, in this study, the main sources of PM2.5 come from outdoors, for example, vehicle exhausts, biomass combustion, etc. Some results showed PAH I/O ratios higher than 1, indicating that there might be indoor PAH sources.
Descriptive statistics on the analyzed 12 PAH species both indoor and outdoor are presented in Figure 2. According to correlation analysis by SPSS, there was a statistically strong positive correlation between indoor and outdoor PAH species sequence, with a correlation coefficient of 0.86 (p < 0.01), indicating the significant impacts of outdoor PAHs on indoors.
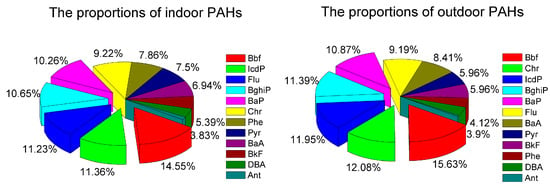
Figure 2.
The proportion of PAHs in indoor/outdoor air.
The most abundant species (top five) observed in indoor and outdoor environment during sampling period were quite similar: Bbf (4.34 ng/m3), IcdP (3.39 ng/m3), Flu (3.35 ng/m3), BghiP (3.18 ng/m3) and BaP (3.06 ng/m3) for the indoor site, accounting for 58.1% of total PAHs, and BbF(5.27 ng/m3), Chr (4.08 ng/m3), IcdP (4.03 ng/m3), BghiP (3.84 ng/m3) and BaP (3.67 ng/m3) for the outdoor site, accounting for 61.9% of total PAHs.
Because of the high carcinogenicity and atmosphere concentration of BaP, the risk assessment of inhalational PAHs is usually based on BaP environment level. In most of European countries, the target annual average concentration of BaP in inhalational PAHs is set to 0.70–1.30 ng/m3 [38].
This observation in the classroom showed the indoor average BaP level during the whole sampling period was 3.06 ng/m3 (0.25–13.36 ng/m3). The mean level of BaP in the classroom in autumn was 2.88 ng/m3, in winter was 4.75 ng/m3, and in spring was 2.09 ng/m3, suggesting that the BaP in PM2.5 in the classroom posed risks to health during the three sampling seasons.
Both indoor and outdoor PAH concentrations with different molecular weights showed consistent concentration trends of HMW > MMW > LMW. MMW- and HMW-PAHs made up 79.7% of the total PAHs for indoor sites and 86.1% for outdoor sites. As several studies reported, this phenomenon may be due to the fact that PAHs with different molecular weights exist in different phases [39]. Over 90% of LMW-PAHs were in the gas phase because of their higher vapor pressure and higher volatility. Meanwhile, over 90% of HMW-PAHs were in the particle phase because of their lower vapor pressure. However, the concentration of different PAH species in the indoor and outdoor environments varied with different molecular weights. In the indoor sites, LMW-PAH species occurred at higher concentrations than in the outdoors, which was consistent with previous research results [40,41,42,43,44].
Although indoor PAHs were mostly from outdoors as previously found, this result suggests the potential for indoor LMW-PAH sources as well [30]. The major possible sources in the school classroom environments are human activity, classroom furnishings, painting and the use of electronic equipment, such as PCs or projectors [45,46].
In addition, because of high volatility, most LMW-PAHs exist in the gas phase. In the outdoor environment, they are more likely to diffuse with air flow. However, despite the volatilization of LMW-PAHs in the indoor environment, poor air mobility of the indoor environment decreases their diffusion, which leads to an accumulation of LMW-PAHs. On the contrary, all of HMW-PAH species in outdoors exceeded indoors concentration, which could be attributed to the fact that HMW-PAHs are mainly from automobile exhausts [47,48].
Obvious seasonal variations of PAH species are presented in pie charts in Figure 3. In general, for both indoors and outdoors, the highest concentrations occurred in winter, with lower levels in autumn, and the lowest in spring.
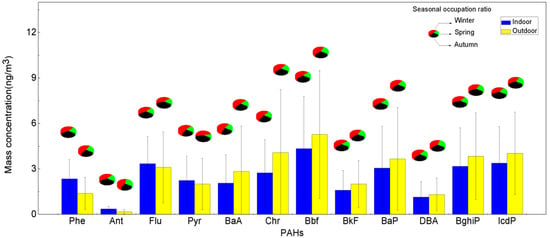
Figure 3.
Seasonal variations of PAHs in indoor/outdoor air.
This was consistent with the results reported by most of the previous studies [49,50,51]. Increasing concentrations of particulate PAHs in the winter could be attributed to several factors. On the one hand, meteorological conditions in winter such as low ambient temperature and solar radiation result in a relatively larger occupation of PAHs partitioned to the particle phase [52,53]. On the other hand, coal combustion and biomass burning for heating increase significantly during winter, and both are major contributors of PM 2.5 -bound PAHs [54].
3.2. Source Apportionment
Based on our determination that outdoor pollution is a major source PAHs in classrooms, the next step was to analyze the PAH sources.
The diagnostic ratio method was used in this study for preliminary identification of possible indoor PAH sources, including IcdP/(IcdP + BghiP), BaA/(BaA + Chr), Flu/(Flu + Pyr) and Bap/BghiP. Figure 4a,b shows the scatter plot for BaP/BghiP vs. Flu/(Flu + Pyr) and IcdP/(IcdP + BghiP) vs. BaA/(BaA + Chr) with different seasons, respectively. As shown in Figure 4, for indoor PAHs, automobile exhausts, fossil fuel combustion and biomass combustion source were the major contributors. The BaP/BghiP ratios of all samples were higher than 0.6, suggesting a significant vehicle atmospheric environment, and, especially in autumn, petroleum played a domination role according to the BaP/BghiP ratio [55,56]. The Flu/(Flu + Pyr) ratio can further identify diesel vehicle sources (0.6–0.7), indicating a mixed-traffic source of indoor PAHs. The ratios of BaA/(BaA + Chr) in most samples higher than 0.35 suggest that the combustion is also a primary source [30].The value of IcdP/(IcdP + BghiP) lower than 0.5 was regarded as an indicator of a petroleum source, while exceed 0.5 was distinguished as a coal, grass and wood combustion source [57]. In addition, ratios of Flu/(Flu + Pyr) around 0.5 suggested a liquid fossil fuel source, while Flu/(Flu + Pyr) > 0.5 was the mark of coal and biomass combustion [58,59].
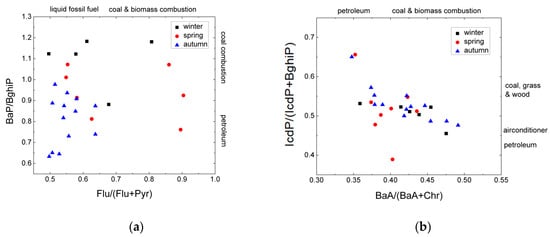
Figure 4.
Results of diagnostic ratio method. (a) Bap/BghiP and Flu/(Flu + Pyr) (b) IcdP/(IcdP + BghiP) and BaA/(BaA + Chr).
For further investigation of PAH source apportion and contribution, the PMF model analysis was conducted, and the primary sources’ contributions to the total indoor PAHs are as shown in Figure 5. There were five identified PAH sources.
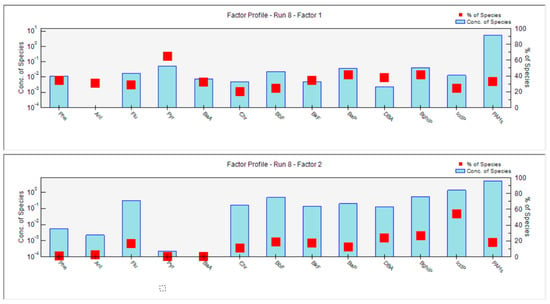
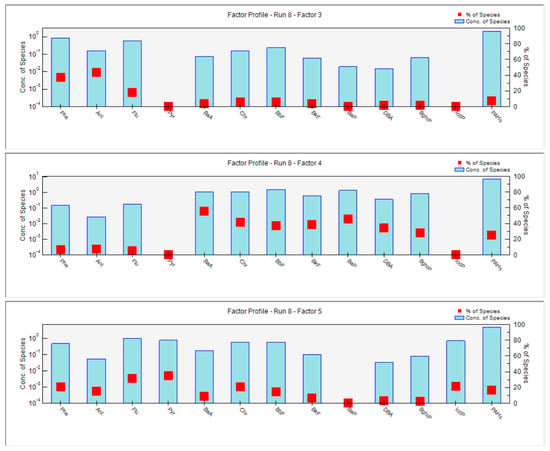
Figure 5.
Results of positive matrix factorization.
Factor 1 was highly loaded on Pyr, which is the typical tracers of coal combustion [60], thus, it was interpreted as a coal combustion emission source. Factor 2 was mainly defined by HMW-PAHs, such as BaP, BkF, BghiP, and IcdP, which are related to vehicle emissions [57]. Therefore, factor 2 was identified as a traffic source, which was mainly automobile exhausts. Factor 3 was mainly LWM-PAHs, such as Phe and Ant, which indicate an indoor source of electronic devices [61]; thus, factor 3 is an indoor source. Factor 4 was mainly BaA, Chr, BbF, BkF and BaP, i.e., PAHs that have a close relationship with family cooking and natural gas combustion, which is commonly used in the Chinese kitchen [62]. Thus, factor 4 was a cooking source of mainly natural gas combustion and biomass combustion. Factor 5 was mainly Flu and Pyr; these two PAHs are connected with industrial exhausts and, thus, factor 5 is an industrial source [63,64].
Furthermore, as shown in Figure 6, different sources contribute unequally to the sample site, as coal combustion contributed the most and the indoor source the least.
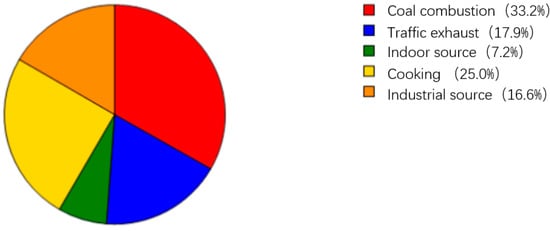
Figure 6.
PAH contribution of different sources.
3.3. Health Risk Assessment
The concentration of PAHs in the indoor environment was beyond the safe level. Based on the method and simulations introduced in Section 2.4, the mean Σ[BaP]eq in the classroom for the whole sampling period was 10.27 ng/m3, higher than the standard value 1 ng/m3 provided by the European Commission [65]. Health risk threats of classroom atmosphere are becoming a huge concern to adolescents. The high level of BaPeq found in this study may be due to the high concentrations of PAHs that have a relatively heavier molecular weight (especially 5 ring PAHs) and are mainly attributed to outdoor sources, including automobile exhausts and coal combustion.
Due to physiological differences, individuals varied in body weight, respiration rate, etc., leading to uncertainty in the assessment of health risks. In our study, Monte Carlo simulations were performed to make the estimation more accurate. Parameters of individual body weight and respiration rate were set as lognormal distribution using Monte Carlo simulation, and 100,000 performances were carried out with Crystal Ball software. Figure 7 shows the results. The mean value of ILCR was estimated to be 1.49 × 10⁻⁶, and highly sensitive individuals (10% of total) have a cancer risk of 2.47 × 10⁻⁶. It is stated in USEPA (2009) standards that less than 1 in 1 million (10−6) is an acceptable value, while over 1 in 10,000 (10−4) is a serious risk level. In our research, more than half of adolescents faced an indoor health risk exceeding the acceptable risk level (10−6), but below the serious risk level. The classroom atmospheric environment has potential health risks for most middle school students.
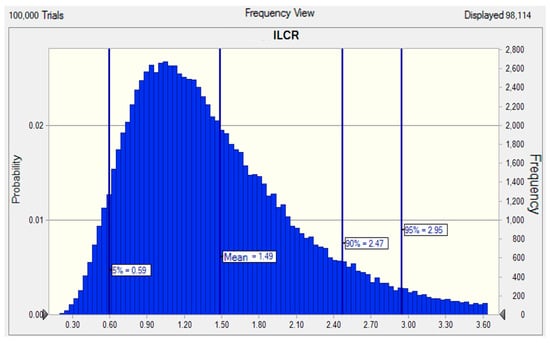
Figure 7.
Probability distributions of incremental lifetime cancer risks (ILCR).
There are previous studies on indoor PAH exposure risk. The average excess total inhalation cancer risk for nine communities in Xi’an was 7.6 × 10⁻⁶ [20]. The average inhalation ILCRs in Taiyuan was 1.76 × 10⁻⁶ for children and 7.95 × 10⁻⁶ for adults, respectively [66]. As for worldwide research, few studies have been carried out on the school environment. Reported carcinogenic risks associated with exposure to PAHs can only be found in Asia and Europe [67]. The risks were higher at Asian schools than at European schools (1.3 × 10⁻⁶~5.4 × 10⁻⁵ indoors and 1.3 × 10⁻⁶~6.1 × 10⁻⁵ outdoors in Asia versus 5.9 × 10⁻⁹ to 1.1 × 10⁻⁸ indoors and 1.1 × 10⁻⁸ to 2.2 × 10⁻⁸ outdoors in Europe).
To predict the risk trend, this study used environment monitoring data to conduct further predictions. As above-mentioned, the PM2.5 concentration level showed a linear relationship with this ILCR risk, which we use as a black box model instead. This means that ILCR risk in this study shows the same variation pattern as PM2.5 concentration. We found that the monitoring data of Xicheng distinct had a good correlation with the sampling data that we collected, R = 0.785. Then, we found that the PM2.5 monitoring level has an approximately linear changing trend in recent years, as y = −8.5321x + 17272, R2 = 0.9546. In this prediction equation, x is the year, and y is the PM2.5 monitoring level. Thus, using the above data, we assume that the ILCR risk can be reduced to the acceptable level in the year 2021 or 2022. Further verification should be carried out if possible.
4. Conclusions and Discussion
Quantitative analysis of PM2.5-bound PAHs in classrooms was carried out in this study to broaden our understanding of atmospheric pollution in enclosed environments. Our results suggests that the classroom is a not-so-safe environment to adolescents. During the sampling period, the average concentration of PM2.5 in the classroom was 103.7 μg/m3 (range: 20.9–257.6 μg/m3), and the average value of the indoor PAH concentration was 29.8 ng/m3 (range: 8.0–83.0 ng/m3), suggesting poor air quality in the classroom environment. Notably, it deteriorated in the winter season with higher PM2.5 concentration indoors. A statistically significant correlation between indoor and outdoor PM2.5-bound PAHs indicated that outdoor pollution was a primary source of indoor air pollutants. As PMF results showed, coal combustion, residential cooking and traffic exhausts were the primary sources of indoor PAHs. Due to heavy transportation and the special resource utilization mode in Beijing, these outdoor sources exerted a considerable influence on indoor atmosphere. Thus, to improve indoor air quality measures such as energy conservation, implementation of green energy, appropriate vehicle control policies and effective emission controls are needed.
This study also proposed estimation of students’ health risk caused by indoor PAHs, and potential cancer risks to students were found according to ILCR results. As cancer risk assessment considers the lifetime period, exposure characteristics may vary among individuals. For example, students’ behaviors could lead to different results, or less pollutants would be accumulated if the classroom was regularly cleaned.
There are several potential complete pathways for exposure to PAHs, including inhalation, skin exposure and dietary intake. Since it is impossible to carry out measurement of the total amount of PAHs in the classroom and estimate exposure via all pathways, we could only focus on the inhalation risk. However, exposure by the other pathways is likely minor when compared to inhalation. Thus, the health risk we calculated above is relatively reasonable and can be an instruction index for public health management.
Although we applied the ILCR model to this study, some limitations of the ILCR model can cause uncertainty. For example, PAH concentration is a constant value in the model, and as PAHs’ adverse health effects are not fully understood, the calculation factors are not completely accurate. In addition, our study used only one monitoring point in the classroom and outdoors, and this may lead to uncertainty in the final result. Research in more schools in other areas of Beijing would help summarize the pollution profile in the whole city of Beijing. Furthermore, due to the limited conditions, we did not obtain abundant samples conduct the analysis. A long-term continuous sampling would make the dataset more reliable and provide more convincing results.
However, despite these uncertainties, great merits of this study should not be neglected. The results reveal some potential risks that are often likely to be neglected. Although classrooms appear to be relatively safe and clean environments, there are also health threats to individuals, and some insurance actions have to be taken to ensure the that the quality of indoor air is maintained to an acceptable standard.
This work can improve knowledge regarding studies on health risk assessments of PAH inhalation exposure, filling information gaps regarding enclosed environments in China. The results of this study are also expected to provide useful information to support the policy-making of pollution control management. For example, limiting the number cars in Beijing in more effective ways, banning high-emission cars and recommending electric cars. Meanwhile, students should protect themselves from pollutants, such as by using face mask when the air quality is low. Schools also should guarantee a safe environment for students and take measures to prevent pollutants from affecting students’ health.
Author Contributions
Conceptualization, L.X. and S.Y.; methodology, L.X., S.Y. and R.O.; software, R.O. and S.Y.; validation, R.O., S.Y. and L.X.; formal analysis, R.O. and S.Y.; investigation, R.O. and S.Y.; resources, L.X.; data curation, L.X., S.Y. and R.O.; writing—original draft preparation, R.O., S.Y. and L.X.; writing—review and editing, R.O.; visualization, R.O. and S.Y.; supervision, L.X.; project administration, L.X.; funding acquisition, L.X. All authors have read and agreed to the published version of the manuscript.
Funding
This research was funded by the National Key Research and Development Program of China (No. 2016YFC0502802), Innovative Research Group Project of the National Natural Science Foundation of China (No. 51721093), and Sino-Italian Cooperation of China Natural Science Foundation (No. 7171101135).
Acknowledgments
The authors also would like to thank David Cragin from Merck & Co. for his efforts in editing and guidance for this manuscript.
Conflicts of Interest
The authors declare no conflict of interest.
References
- Yin, H.; Pizzol, M.; Xu, L. External costs of PM2.5 pollution in Beijing, China: Uncertainty analysis of multiple health impacts and costs. Environ. Pollut. 2017. [Google Scholar] [CrossRef] [PubMed]
- Yin, H.; Xu, L. Comparative study of PM10/PM2.5-bound PAHs in downtown Beijing, China: Concentrations, sources, and health risks. J. Clean. Prod. 2018. [Google Scholar] [CrossRef]
- Huang, R.J.; Zhang, Y.; Bozzetti, C.; Ho, K.F.; Cao, J.J.; Han, Y.; Daellenbach, K.R.; Slowik, J.G.; Platt, S.M.; Canonaco, F.; et al. High secondary aerosol contribution to particulate pollution during haze events in China. Nature 2015, 514, 218–222. [Google Scholar] [CrossRef] [PubMed]
- Brook, R.D.; Rajagopalan, S.; Pope, C.A.; Brook, J.R.; Bhatnagar, A.; Diez-Roux, A.V.; Holguin, F.; Hong, Y.; Luepker, R.V.; Mittleman, M.A.; et al. Particulate matter air pollution and cardiovascular disease: An update to the scientific statement from the american heart association. Circulation 2010. [Google Scholar] [CrossRef] [PubMed]
- Beijing Ecology and Environment Statement 2019. The Beijing Municipal Ecology and Environmental Bureau. Available online: http://sthjj.beijing.gov.cn/bjhrb/resource/cms/article/1718882/10837172/2020073117581274300.pdf (accessed on 31 July 2020).
- Chan, C.K.; Yao, X. Air pollution in mega cities in China. Atmos. Environ. 2008. [Google Scholar] [CrossRef]
- Liu, H.; Jiang, Y.; Lian, B.; Zhu, F.; Zhang, B.; Sang, J. Studies on wind environment around high buildings in urban areas. Sci. China Ser. D Earth Sci. 2005, 48 (Suppl. II), 102–115. [Google Scholar]
- Cao, C.; Jiang, W.; Wang, B.; Fang, J.; Lang, J.; Tian, G.; Jiang, J.; Zhu, T.F. Inhalable microorganisms in Beijing’s PM2.5 and PM10 pollutants during a severe smog event. Environ. Sci. Technol. 2014. [Google Scholar] [CrossRef]
- Burnett, R.T.; Arden Pope, C.; Ezzati, M.; Olives, C.; Lim, S.S.; Mehta, S.; Shin, H.H.; Singh, G.; Hubbell, B.; Brauer, M.; et al. An integrated risk function for estimating the global burden of disease attributable to ambient fine particulate matter exposure. Environ. Health Perspect. 2014. [Google Scholar] [CrossRef]
- Xu, L.Y.; Shu, X. Aggregate human health risk assessment from dust of daily life in the urban environment of Beijing. Risk Anal. 2014. [Google Scholar] [CrossRef]
- Audebert, M.; Jacques, C.; Hillenweck, A.; Jamin, E.; Zalko, D.; Cravedi, J.-P. Metabolism and genotoxicity of polycyclic aromatic hydrocarbons (PAHs): Description of a new genotoxic assay. In Proceedings of the Meeting of the United Kingdom Environmental Mutagen Society, University of Leeds, Leeds, UK, 12–15 July 2009. [Google Scholar]
- Schauer, J.J.; Rogge, W.F.; Hildemann, L.M.; Mazurek, M.A.; Cass, G.R.; Simoneit, B.R.T. Source apportionment of airborne particulate matter using organic compounds as tracers. Atmos. Environ. 1996. [Google Scholar] [CrossRef]
- Castro, D.; Slezakova, K.; Delerue-Matos, C.; da Alvim-Ferraz, M.C.; Morais, S.; do Pereira, M.C. Polycyclic aromatic hydrocarbons in gas and particulate phases of indoor environments influenced by tobacco smoke: Levels, phase distributions, and health risks. Atmos. Environ. 2011. [Google Scholar] [CrossRef]
- González-Eguino, M. Energy poverty: An overview. Renew. Sustain. Energy Rev. 2015. [Google Scholar] [CrossRef]
- Moosavi, L.; Mahyuddin, N.; Ab Ghafar, N.; Azzam Ismail, M. Thermal performance of atria: An overview of natural ventilation effective designs. Renew. Sustain. Energy Rev. 2014. [Google Scholar] [CrossRef]
- Zwoździak, A.; Sówka, I.; Krupińska, B.; Zwoździak, J.; Nych, A. Infiltration or indoor sources as determinants of the elemental composition of particulate matter inside a school in Wrocław, Poland? Build. Environ. 2013. [Google Scholar] [CrossRef]
- Miller, T. Global, regional, and national comparative risk assessment of 79 behavioural, environmental and occupational, and metabolic risks or clusters of risks in 188 countries, 1990–2013: A systematic analysis for the Global Burden of Disease Study 2013. Lancet 2016, 386, 2287–2323. [Google Scholar]
- Challoner, A.; Gill, L. Indoor/outdoor air pollution relationships in ten commercial buildings: PM2.5 and NO2. Build. Environ. 2014. [Google Scholar] [CrossRef]
- Zhang, J.; Chen, J.; Yang, L.; Sui, X.; Yao, L.; Zheng, L.; Wen, L.; Xu, C.; Wang, W. Indoor PM2.5 and its chemical composition during a heavy haze-fog episode at Jinan, China. Atmos. Environ. 2014. [Google Scholar] [CrossRef]
- Xu, H.; Ho, S.S.H.; Gao, M.; Cao, J.; Guinot, B.; Ho, K.F.; Long, X.; Wang, J.; Shen, Z.; Liu, S.; et al. Microscale spatial distribution and health assessment of PM2.5-bound polycyclic aromatic hydrocarbons (PAHs) at nine communities in Xi’an, China. Environ. Pollut. 2016. [Google Scholar] [CrossRef]
- Zhou, Z.; Liu, Y.; Yuan, J.; Zuo, J.; Chen, G.; Xu, L.; Rameezdeen, R. Indoor PM2.5 concentrations in residential buildings during a severely polluted winter: A case study in Tianjin, China. Renew. Sustain. Energy Rev. 2016. [Google Scholar] [CrossRef]
- Lee, S.C.; Guo, H.; Li, W.M.; Chan, L.Y. Inter-comparison of air pollutant concentrations in different indoor environments in Hong Kong. Atmos. Environ. 2002. [Google Scholar] [CrossRef]
- Chithra, V.S.; Nagendra, S.M.S. Characterizing and predicting coarse and fine particulates in classrooms located close to an urban roadway. J. Air Waste Manag. Assoc. 2014. [Google Scholar] [CrossRef] [PubMed]
- Turunen, M.; Toyinbo, O.; Putus, T.; Nevalainen, A.; Shaughnessy, R.; Haverinen-Shaughnessy, U. Indoor environmental quality in school buildings, and the health and wellbeing of students. Int. J. Hyg. Environ. Health. 2013. [Google Scholar] [CrossRef] [PubMed]
- Nisbet, I.C.T.; LaGoy, P.K. Toxic equivalency factors (TEFs) for polycyclic aromatic hydrocarbons (PAHs). Regul. Toxicol. Pharmacol. 1992. [Google Scholar] [CrossRef]
- Shi, G.L.; Feng, Y.C.; Wu, J.H.; Li, X.; Wang, Y.Q.; Xue, Y.H.; Zhu, T. Source identification of polycyclic aromatic hydrocarbons in urban particulate matter of Tangshan, China. Aerosol Air Qual. Res. 2009. [Google Scholar] [CrossRef]
- Jung, K.H.; Yan, B.; Chillrud, S.N.; Perera, F.P.; Whyatt, R.; Camann, D.; Kinney, P.L.; Miller, R.L. Assessment of Benzo(a)pyrene-equivalent Carcinogenicity and mutagenicity of residential indoor versus outdoor polycyclic aromatic hydrocarbons exposing young children in New York city. Int. J. Environ. Res. Public Health. 2010, 7, 1889–1900. [Google Scholar] [CrossRef] [PubMed]
- Liao, C.M.; Chiang, K.C. Probabilistic risk assessment for personal exposure to carcinogenic polycyclic aromatic hydrocarbons in Taiwanese temples. Chemosphere 2006. [Google Scholar] [CrossRef]
- Bai, Z.; Hu, Y.; Yu, H.; Wu, N.; You, Y. Quantitative health risk assessment of inhalation exposure to polycyclic aromatic hydrocarbons on citizens in Tianjin, China. Bull. Environ. Contam. Toxicol. 2009. [Google Scholar] [CrossRef]
- Chen, Y.; Li, X.; Zhu, T.; Han, Y.; Lv, D. PM2.5-bound PAHs in three indoor and one outdoor air in Beijing: Concentration, source and health risk assessment. Sci. Total Environ. 2017. [Google Scholar] [CrossRef]
- Callén, M.S.; De La Cruz, M.T.; López, J.M.; Murillo, R.; Navarro, M.V.; Mastral, A.M. Long-range atmospheric transport and local pollution sources on PAH concentrations in a south European urban area. Fulfilling of the European directive. Water Air Soil Pollut. 2008. [Google Scholar] [CrossRef]
- Li, Z.; Sjodin, A.; Porter, E.N.; Patterson, D.G.; Needham, L.L.; Lee, S.; Russell, A.G.; Mulholland, A.J. Characterization of PM2.5-bound polycyclic aromatic hydrocarbons in Atlanta. Atmos. Environ. 2009. [Google Scholar] [CrossRef]
- Martellini, T.; Giannoni, M.; Lepri, L.; Katsoyiannis, A.; Cincinelli, A. One year intensive PM 2.5 bound polycyclic aromatic hydrocarbons monitoring in the area of Tuscany, Italy. Concentrations, source understanding and implications. Environ. Pollut. 2012. [Google Scholar] [CrossRef] [PubMed]
- Tong, Z.; Chen, Y.; Malkawi, A.; Adamkiewicz, G.; Spengler, J.D. Quantifying the impact of traffic-related air pollution on the indoor air quality of a naturally ventilated building. Environ. Int. 2016. [Google Scholar] [CrossRef] [PubMed]
- Chen, C.; Zhao, B. Review of relationship between indoor and outdoor particles: I/O ratio, infiltration factor and penetration factor. Atmos. Environ. 2011. [Google Scholar] [CrossRef]
- Wang, J.; Xu, H.; Guinot, B.; Li, L.; Ho, S.; Liu, S.; Cao, J. Concentrations, sources and health effects of parent, oxygenated- and nitrated- polycyclic aromatic hydrocarbons (PAHs) in middle-school air in Xi’an, China. Atmos. Res. 2017, 192, 1–10. [Google Scholar] [CrossRef]
- Long, C.M.; Sarnat, J.A. Indoor-outdoor relationships and infiltration behavior of elemental components of outdoor PM2.5 for Boston-area homes. Aerosol Sci. Technol. 2004. [Google Scholar] [CrossRef]
- Pérez, B.P.; DeSalgar, E.; Kotzias, D. State of the art of the PAHs’ analysis in ambient air. Fresenius Environ. Bull. 1999, 8, 499–505. [Google Scholar]
- Bandowe, B.A.M.; Bigalke, M.; Boamah, L.; Nyarko, E.; Saalia, F.K.; Wilcke, W. Polycyclic aromatic compounds (PAHs and oxygenated PAHs) and trace metals in fish species from Ghana (West Africa): Bioaccumulation and health risk assessment. Environ. Int. 2014. [Google Scholar] [CrossRef]
- Akyüz, M.; Çabuk, H. Gas-particle partitioning and seasonal variation of polycyclic aromatic hydrocarbons in the atmosphere of Zonguldak, Turkey. Sci. Total Environ. 2010. [Google Scholar] [CrossRef]
- Liu, J.; Man, R.; Ma, S.; Li, J.; Wu, Q.; Peng, J. Atmospheric levels and health risk of polycyclic aromatic hydrocarbons (PAHs) bound to PM2.5 in Guangzhou, China. Mar. Pollut. Bull. 2015. [Google Scholar] [CrossRef]
- Khan, M.F.; Latif, M.T.; Lim, C.H.; Amil, N.; Jaafar, S.A.; Dominick, D.; Nadzir, M.S.M.; Sahani, M.; Tahir, N.M. Seasonal effect and source apportionment of polycyclic aromatic hydrocarbons in PM2.5. Atmos. Environ. 2015. [Google Scholar] [CrossRef]
- Kong, S.; Li, X.; Li, L.; Yin, Y.; Chen, K.; Yuan, L.; Zhang, Y.; Shan, Y.; Ji, Y. Variation of polycyclic aromatic hydrocarbons in atmospheric PM2.5 during winter haze period around 2014 Chinese Spring Festival at Nanjing: Insights of source changes, air mass direction and firework particle injection. Sci. Total Environ. 2015. [Google Scholar] [CrossRef] [PubMed]
- Wu, F.; Liu, X.; Wang, W.; Man, Y.B.; Chan, C.Y.; Liu, W.; Tao, S.; Wong, M.H. Characterization of particulate-bound PAHs in rural households using different types of domestic energy in Henan Province, China. Sci. Total Environ. 2015. [Google Scholar] [CrossRef]
- Destaillats, H.; Maddalena, R.L.; Singer, B.C.; Hodgson, A.T.; McKone, T.E. Indoor pollutants emitted by office equipment: A review of reported data and information needs. Atmos. Environ. 2008. [Google Scholar] [CrossRef]
- Morawska, L.; Ayoko, G.A.; Bae, G.N.; Buonanno, G.; Chao CY, H.; Clifford, S.; Fu, S.C.; Hänninen, O.; He, C.; Isaxon, C.; et al. Airborne particles in indoor environment of homes, schools, offices and aged care facilities: The main routes of exposure. Environ. Int. 2017. [Google Scholar] [CrossRef] [PubMed]
- Kong, S.; Ding, X.; Bai, Z.; Han, B.; Chen, L.; Shi, J.; Li, Z. A seasonal study of polycyclic aromatic hydrocarbons in PM2.5 and PM2.5-10 in five typical cities of Liaoning Province, China. J. Hazard. Mater. 2010. [Google Scholar] [CrossRef] [PubMed]
- Okuda, T.; Matsuura, S.; Yamaguchi, D.; Umemura, T.; Hanada, E.; Orihara, H.; Tanaka, S.; He, K.; Ma, Y.; Cheng, Y.; et al. The impact of the pollution control measures for the 2008 Beijing Olympic Games on the chemical composition of aerosols. Atmos. Environ. 2011. [Google Scholar] [CrossRef]
- Bandowe, B.A.M.; Meusel, H.; Huang, R.-j.; Ho, K.; Cao, J.; Hoffmann, T.; Wilcke, W. PM2.5-bound oxygenated PAHs, nitro-PAHs and parent-PAHs from the atmosphere of a Chinese megacity: Seasonal variation, sources and cancer risk assessment. Sci. Total Environ. 2014. [Google Scholar] [CrossRef]
- Romagnoli, P.; Balducci, C.; Perilli, M.; Gherardi, M.; Gordiani, A.; Gariazzo, C.; Gatto, M.P.; Cecinato, A. Indoor PAHs at schools, homes and offices in Rome, Italy. Atmos. Environ. 2014. [Google Scholar] [CrossRef]
- Wu, Y.; Yang, L.; Zheng, X.; Zhang, S.; Song, S.; Li, J.; Hao, J. Characterization and source apportionment of particulate PAHs in the roadside environment in Beijing. Sci. Total Environ. 2014. [Google Scholar] [CrossRef]
- Chen, Y.C.; Hsu, C.Y.; Lin, S.L.; Chang-Chien, G.P.; Chen, M.J.; Fang, G.C.; Chiang, H.C. Characteristics of concentrations and metal compositions for PM2.5 and PM2.5–10 in yunlin county, taiwan during air quality deterioration. Aerosol Air Qual. Res. 2015. [Google Scholar] [CrossRef]
- Kuo, C.Y.; Lin, Y.R.; Chang, S.Y.; Lin, C.Y.; Chou, C.H. Aerosol characteristics of different types of episode. Environ. Monit. Assess. 2013. [Google Scholar] [CrossRef] [PubMed]
- Zhang, Y.; Tao, S. Global atmospheric emission inventory of polycyclic aromatic hydrocarbons (PAHs) for 2004. Atmos. Environ. 2009. [Google Scholar] [CrossRef]
- Khalili, N.R.; Scheff, P.A.; Holsen, T.M. PAH source fingerprints for coke ovens, diesel and, gasoline engines, highway tunnels, and wood combustion emissions. Atmos. Environ. 1995. [Google Scholar] [CrossRef]
- Yunker, M.B.; Macdonald, R.W.; Vingarzan, R.; Mitchell, R.H.; Goyette, D.; Sylvestre, S. PAHs in the Fraser River basin: A critical appraisal of PAH ratios as indicators of PAH source and composition. Org. Geochem. 2002. [Google Scholar] [CrossRef]
- Ravindra, K.; Sokhi, R.; Van Grieken, R. Atmospheric polycyclic aromatic hydrocarbons: Source attribution, emission factors and regulation. Atmos. Environ. 2008. [Google Scholar] [CrossRef]
- De Zárate, I.O.; Ezcurra, A.; Lacaux, J.P.; Van Dinh, P. Emission factor estimates of cereal waste burning in Spain. Atmos. Environ. 2000. [Google Scholar] [CrossRef]
- Yu, G.G.; Wang, T.G.; Wu, D.P.; Wang, J. A Study on polycyclic aromatic hydrocarbons in atmospheric aerosols in Beijing. J. China Univ. Min. Technol. 2008, 37, 72–78. (In Chinese) [Google Scholar]
- Wang, J.; Ho, S.S.; Cao, J.; Huang, R.; Zhou, J.; Zhao, Y.; Xu, H.; Liu, S.; Wang, G.; Shen, Z.; et al. Characteristics and major sources of carbonaceous aerosols in PM2.5 from Sanya, China. Sci. Total Environ. 2015, 530–531, 110–119. [Google Scholar]
- Chen, L.; Cai, C.; Yu, S.; Liu, Y.; Tao, S.; Liu, W. Emission factors of particulate matter, CO and CO 2 in the pyrolytic processing of typical electronic wastes. J. Environ. Sci. 2019. [Google Scholar] [CrossRef]
- Xu, H.; Ta, W.; Yang, L.; Feng, R.; He, K.; Shen, Z.; Meng, Z.; Zhang, N.; Li, Y.; Zhang, Y.; et al. Characterizations of PM2.5-bound organic compounds and associated potential cancer risks on cooking emissions from dominated types of commercial restaurants in northwestern China. Chemosphere 2020. [Google Scholar] [CrossRef]
- Xu, S.; Liu, W.; Tao, S. Emission of polycyclic aromatic hydrocarbons in China. Environ. Sci. Technol. 2006. [Google Scholar] [CrossRef] [PubMed]
- Wang, Q.; Liu, M.; Yu, Y.; Li, Y. Characterization and source apportionment of PM2.5-bound polycyclic aromatic hydrocarbons from Shanghai city, China. Environ. Pollut. 2016, 218, 118–128. [Google Scholar] [CrossRef] [PubMed]
- Air Quality Standards. European Commission. Available online: https://ec.europa.eu/environment/air/quality/standards.htm (accessed on 5 June 2019).
- Xia, Z.; Duan, X.; Tao, S.; Qiu, W.; Liu, D.; Wang, Y.; Wei, S.; Wang, B.; Jiang, Q.; Lu, B.; et al. Pollution level, inhalation exposure and lung cancer risk of ambient atmospheric polycyclic aromatic hydrocarbons (PAHs) in Taiyuan, China. Environ. Pollut. 2013. [Google Scholar] [CrossRef] [PubMed]
- Oliveira, M.; Slezakova, K.; Delerue-Matos, C.; Pereira, M.C.; Morais, S. Children environmental exposure to particulate matter and polycyclic aromatic hydrocarbons and biomonitoring in school environments: A review on indoor and outdoor exposure levels, major sources and health impacts. Environ. Int. 2019. [Google Scholar] [CrossRef] [PubMed]
© 2020 by the authors. Licensee MDPI, Basel, Switzerland. This article is an open access article distributed under the terms and conditions of the Creative Commons Attribution (CC BY) license (http://creativecommons.org/licenses/by/4.0/).