Article

Spatio-Temporal Variations of Water Vapor Budget over the Tibetan Plateau in Summer and Its Relationship with the Indo-Pacific Warm Pool

1
Key Laboratory of Digital Earth Science, The Aerospace Information Research Institute, Chinese Academy of Sciences, Beijing 100094, China
2
College of Resources and Environment, University of Chinese Academy of Sciences, Beijing 100049, China
*
Author to whom correspondence should be addressed.
Atmosphere 2020, 11(8), 828; https://doi.org/10.3390/atmos11080828
Submission received: 19 July 2020 / Revised: 31 July 2020 / Accepted: 4 August 2020 / Published: 6 August 2020
(This article belongs to the Special Issue Air-Sea Interaction)

Abstract

:
The water vapor budget (WVB) over the Tibetan Plateau (TP) is closely related to the large-scale atmospheric moisture transportation of the surrounding mainland and oceans, especially for the Indo-Pacific warm pool (IPWP). However, the procession linkage between the WVBs over the TP and its inner basins and IPWP has not been sufficiently elucidated. In this study, the relationship between the summer WVB over the TP and the IPWP was quantitatively investigated using reanalysis datasets and satellite-observed sea surface temperature (SST). The results show that: (1) the mean total summer vapor budget (WVBt) over the TP in the period of 1979–2018 was 72.5 × 10⁶ kg s−1. Additionally, for the 13 basins within the TP, the summer WVB has decreased from southeast to northwest; the Yarlung Zangbo River Basin had the highest WVB (33.7%), followed by the Upper Yangtze River Basin, Ganges River Basin and Qiangtang Plateau. (2) For the past several decades, the WVBt over the TP has experienced an increasing trend (3.81 × 10⁶ kg s−1 decade−1), although the southern boundary budget (WVBs) contributed the most and is most closely related with the WVBt, while the eastern boundary budget (WVBe) experienced a decreasing trend (4.21 × 10⁶ kg s−1 decade−1) which was almost equal to the interdecadal variations of the WVBt. (3) For the IPWP, we defined a new warm pool index of surface latent heat flux (WPI-slhf), and found that an increasing WPI-slhf would cause an anticyclone anomaly in the equatorial western Indian Ocean (near 70° E), resulting in the increased advent of water vapor to the TP. (4) On the interdecadal scale, the correlation coefficients of the variation of the summer WVBt over the TP with the WPI-slhf and Indian Ocean Dipole (IOD) signal were 0.86 and 0.85, respectively (significant at the 0.05% level). Therefore, the warming and the increasing slhf of the IPWP would significantly contribute to the increasing WVB of the TP in recent decades.

1. Introduction

As the “roof of the world”, the Tibetan Plateau (TP) has high elevations, with the average elevation exceeding 4000 m [1,2]. The special dynamic and thermal effect of the plateau caused by its complex topography [3] has a significant impact on the water cycle of the TP [4,5], Asia and even the rest of the world; it has bred numerous major rivers in the lower reaches, including the Yangtze River, the Yellow River, the Nu River, the Lancang River, the Yarlung Zangbo River, the Irrawaddy River, the AmuDarya River, the Indus River, the Ganges River, the Hexi Corridor Rivers and the Tarim River, which is also known as the “Asian water tower” [6,7,8]. Additionally, the TP is a climatologically and ecologically sensitive area. Under the influence of global warming, TP’s water vapor has undergone drastic changes in recent decades, which has also significantly affected the TP’s precipitation, lake storage and river runoff [9,10,11,12,13,14].
During boreal summer (June–July–August, JJA), the water vapor of the TP is primarily transported over large distances, from the tropical Indian Ocean and the Western Pacific Ocean [15,16], which is the most significant region of the global interannual variability of sea surface temperature (SST). Moreover, this region contains the world’s largest warm pool with the highest SST, also known as the Indo-Pacific warm pool (IPWP) [17]. The IPWP, atmosphere and TP together constitute a regional ocean–atmosphere–land water cycle system [6,18]. Under the action of atmospheric circulation, water vapor will be transported from the IPWP to the TP via the Indian subcontinent and the nearby seas (the Arabian Sea and the Bay of Bengal), and will be affected by the large terrain of the TP [19,20,21]. The water vapor transport above the TP is different from the same latitudes in South China, Central Asia and North America, and is characterized by special water vapor transport channels and water vapor budget (WVB) [22]. It is particularly important to examine the changes and related mechanisms of the water vapor sources, transportation channels and WVB over the TP under the background of the IPWP and the large terrain forcing on the TP.
A few studies have focused on changes in water vapor transport and WVB over the TP [10,23,24,25,26]. The sources of water vapor of the TP mainly include external water vapor transport and local underground cushion surface evapotranspiration [10]. From the external space of the water cycle, Xu et al. [27] delineated the source as the “large triangle sector” water vapor influence area composed of the TP and the low-latitude ocean monsoon active area, including the north Indian Ocean and the Western Pacific and offshore areas. From the perspective of time, Chen et al. [28] pointed out that the water vapor source area in the short term (1 d) covers the northwestern side of the plateau, the Bay of Bengal, the Indian subcontinent and the South China Sea; for a longer duration (10 d), the source area extends from the Arabian Sea to the lower latitude Indian Ocean, and can be traced across the equator to the southern hemisphere, it can also extend from the South China Sea to the Western Pacific, which also proves the trans-hemispheric atmospheric water circulation system over the TP. Owing to the differences in the water vapor sources and the transport process, the water vapor transport channels of the TP can be roughly divided into four channels, namely the Indian Ocean Channel, the South China Sea Channel, the northern channel of the Bay of Bengal and the westerly belt channel; the four channels correspond to four high-humidity centers in the plateau [29,30]. The mid-latitude westerly water vapor enters from the west of the plateau and is divided into two branches. The north branch flows toward the northern edge of the Kunlun Mountains and the south branch enters the southern foothills of the Himalayas, and then the south branch water vapor merges with the water vapor transported by the strong southwestern part of the northern Indian Ocean, and enters the plateau from the southeastern boundary of the plateau through the Bay of Bengal and the South China Sea. Moreover, the southern Indian Ocean water vapor flux is significantly greater than the north-westerly water vapor flux, indicating that the southern water vapor channel plays a significant role in the changes of the TP’s water vapor [16,28]. Studies show that summer precipitation contributes the most to annual precipitation for the TP, and that the water vapor in summer is the highest; furthermore, the WVB in summer is more than it is in other seasons [4,31]. In recent decades, the TP’s WVB has generally exhibited a significant interdecadal and interannual increasing trend, however, the TP got wetter after 1994, leading to an increase in the total atmospheric water vapor and causing more surface precipitation and runoff to the TP and its surrounding areas [9,32]. In the past 40 years, the lake storages in the TP have exhibited dramatic changes, especially for the 39 lakes in the Qiangtang Plateau, whose water storages have increased; the WVB can modulate the variations of terrestrial storage change and annual lake mass change [33,34].
The long-term variation of the SST anomaly (SSTA) in the IPWP since 1870 is more or less consistent with the changing trend of the global SSTA, however, its amplitude change is approximately twice that of the global SSTA [35], which indicated that the IPWP is more sensitive to the climate change caused by global warming [36,37]. Qiu et al. [38] employed ocean assimilation data to study the interdecadal variation characteristics of the IPWP and found that the IPWP exhibits significant quasi-10a periodic oscillation. The process changes of the IPWP would affect the underlying surface of the TP through water vapor and heat transport [37]. In terms of snow accumulation on the TP, many studies have found that the interdecadal warming of the IPWP is closely related to the interdecadal increase in winter snow depth in the TP. The warming of the tropical Indian Ocean may be an important reason for the increase in winter snow depth in the TP, while the warming of the tropical Western Pacific was not conducive to winter snow accumulation on the TP [39,40,41]. Wang et al. [42] found that the IPWP will indirectly affect the growth of vegetation in the plateau from April to July through water vapor transport and precipitation.
Briefly, most of the studies on water vapor transport and WVB of the TP either primarily consider the TP as a whole [10] or simply divide it into several areas [24,28]. At the same time, in terms of changes in water vapor transport, research focused on the boundary of the TP [9] or some key areas [43,44,45,46]. Meanwhile, there are relatively fewer studies on water vapor transport on the plateau from the perspective of basin characteristics. In addition, most studies on water vapor sources in the TP area focus on the Indian subcontinent and its coastal areas [19,47], or on the qualitative analysis of water vapor transport in the Indian or Pacific Ocean [48,49,50,51]. However, there is a dearth of research on the WVB of the fine plateau boundary and the basins within the plateau. Besides, their relationship with the IPWP has not been studied before. Therefore, based on the reanalysis datasets and satellite-observed SST, the relationship between the summer WVB over the TP and the IPWP is investigated herein.
The paper is organized as follows: Section 2 describes the datasets and methods. The results discussed in Section 3 include the following parts: (1) the variations of the summer water vapor transport and WVB over the TP, and its effect on the precipitable water and precipitation; (2) changes of surface latent heat flux (slhf) of the IPWP; (3) the relationship between the changes of the summer WVB over the TP and the climate indices of the IPWP. Finally, Section 4 presents the conclusions and discussion, respectively.

2. Materials and Methods
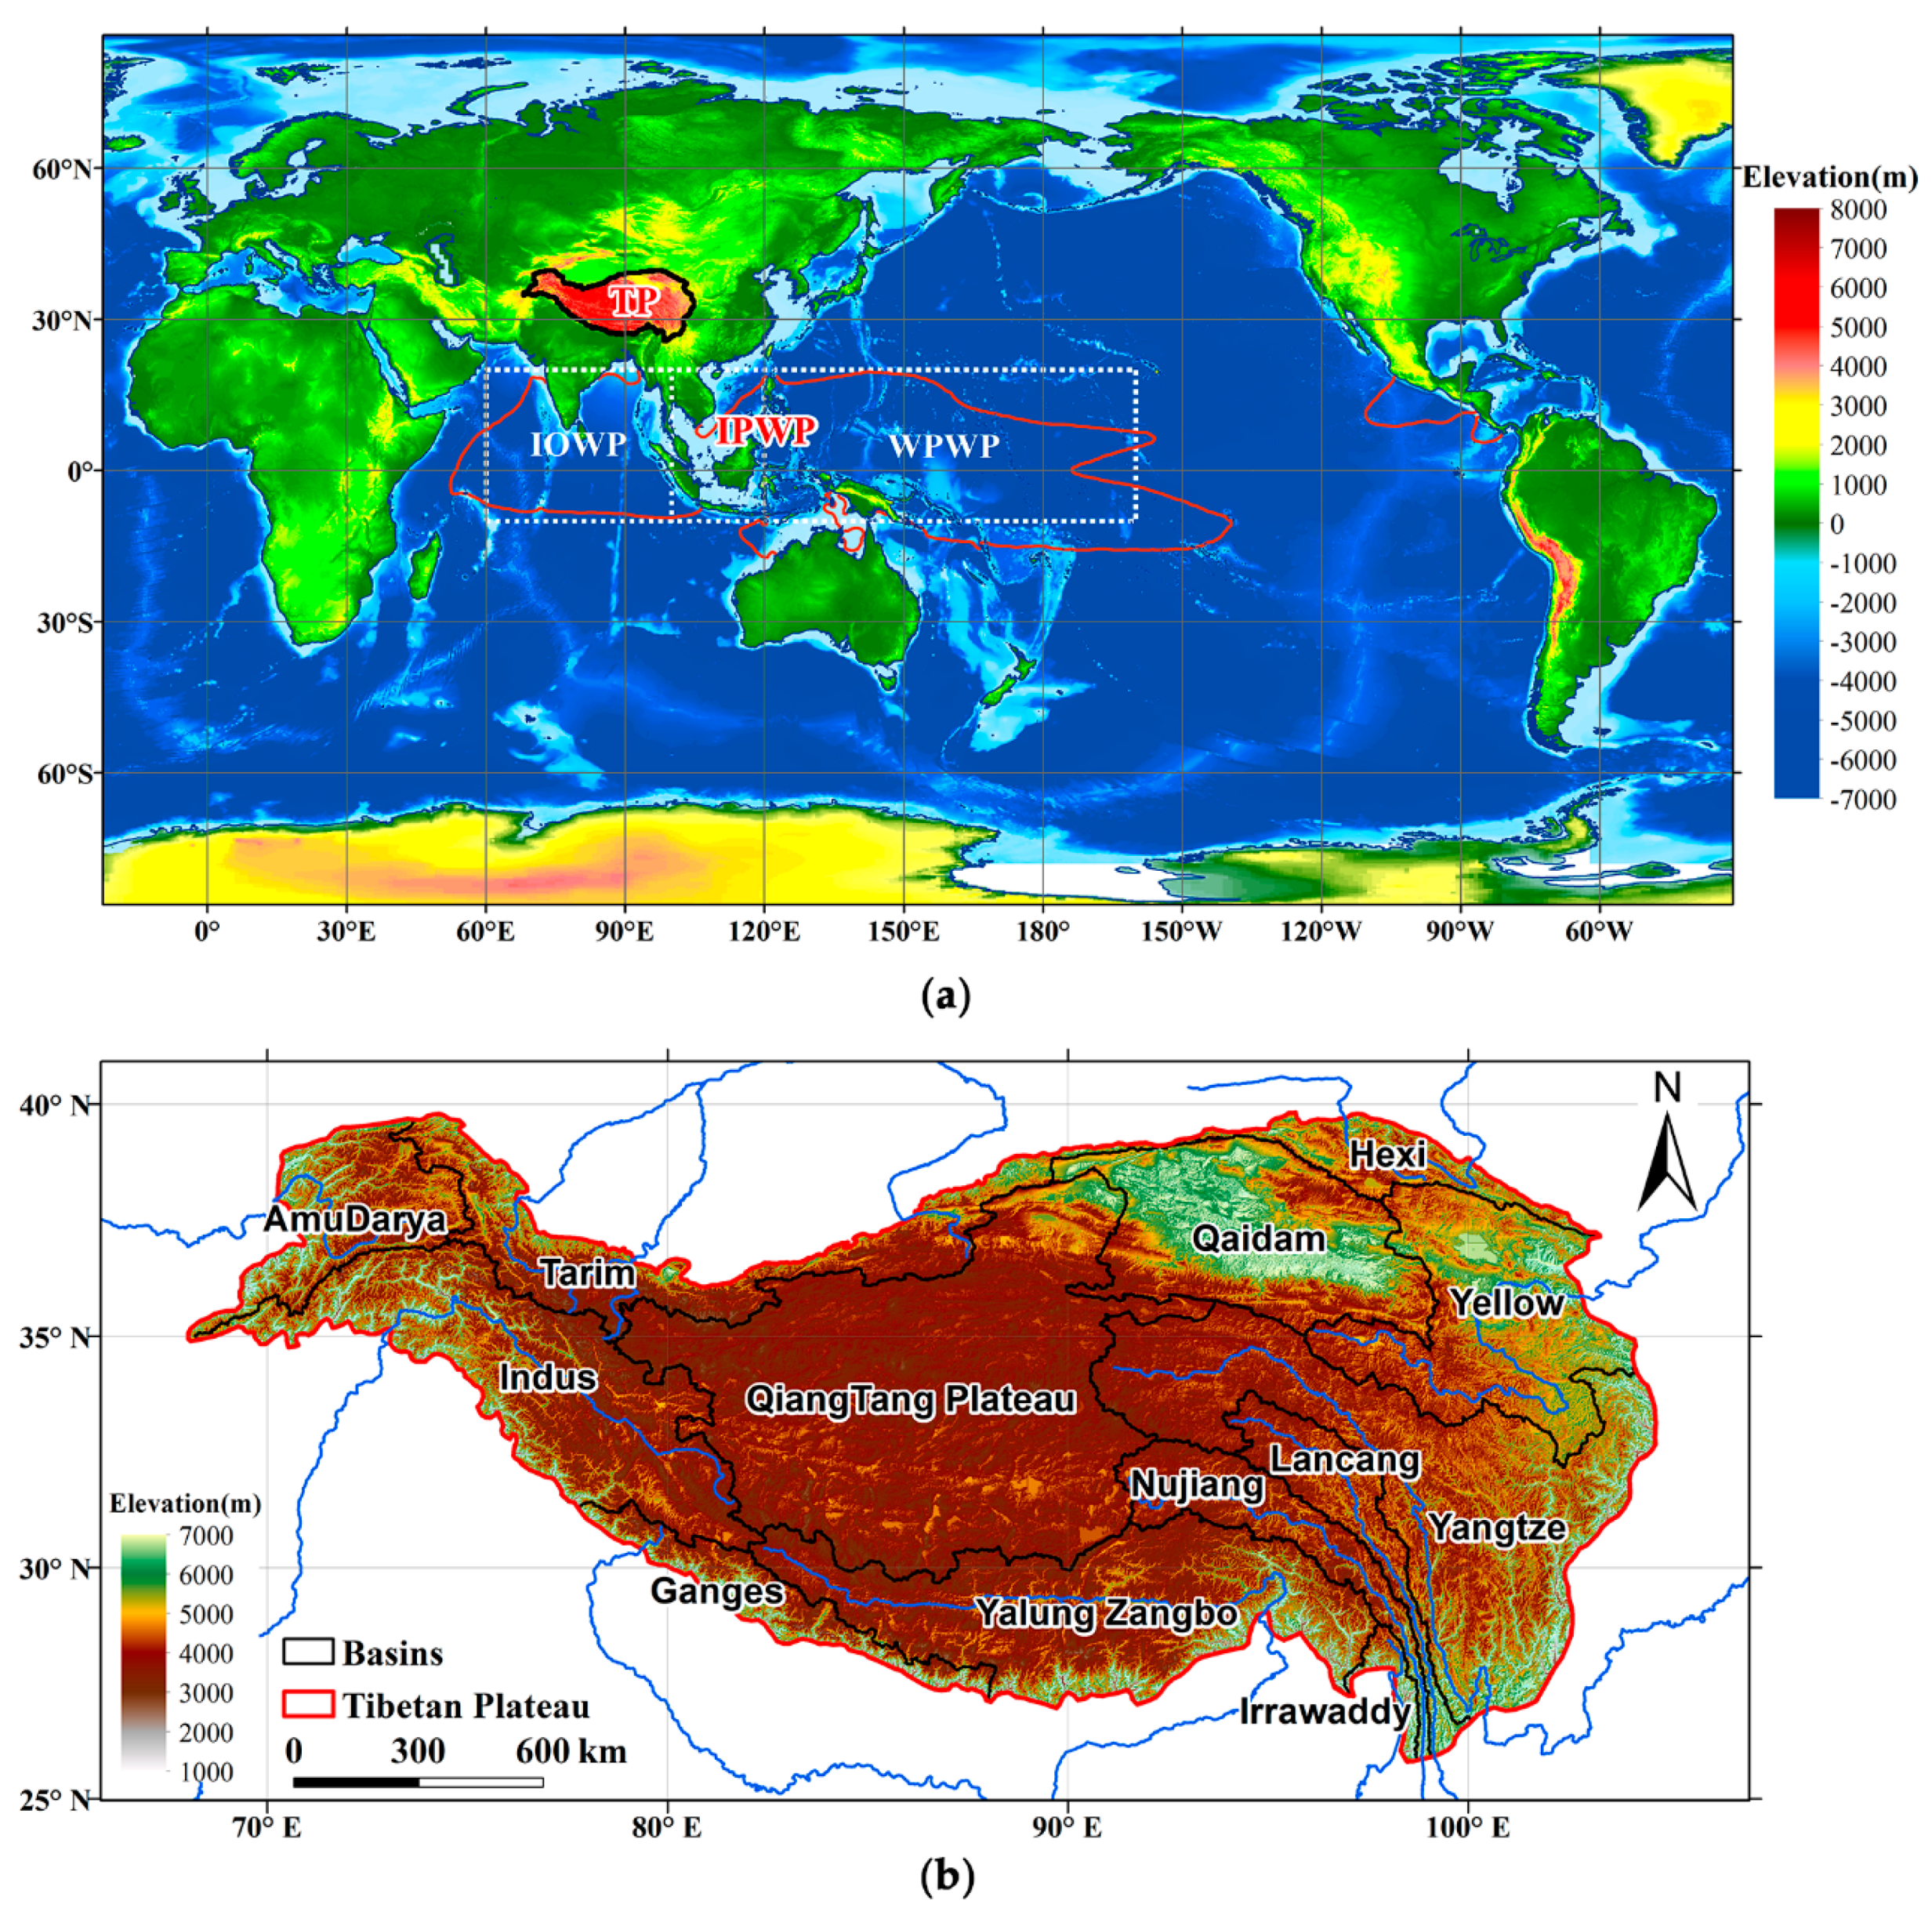
2.1. Study Area

The study area consists of two regions, the TP and the IPWP (Figure 1a). For the TP (Figure 1b), the boundary and watershed division dataset used ASTER (Advanced Spaceborne Thermal Emission and Reflection Radiometer) GDEM (Global Digital Elevation Model) V2 data, and the boundary of elevations greater than 2500 m was extracted as the boundary of TP; the TP is further divided into 13 river basins [19], including nine exorheic basins of the AmuDarya, Indus, Ganges, Yalung Zangbo, Irrawaddy, Nu, Lancang, Upper Yangtze, Upper Yellow River Basins and four endorheic basins of the Hexi Corridor and Tarim River, Qaidam Basin and Qiangtang Plateau. The sea area where the SST is above 28 °C over the Indian Ocean and the Western Pacific is defined as the IPWP [52]. Its rectangular boundary range is 10° S–20° N and 60° E–160° W. It is divided into the Indian Ocean warm pool (IOWP) with a rectangular boundary range of 10° S–20° N and 60° E–100° E, and the Western Pacific warm pool (WPWP) with a rectangular boundary range of 10° S–20° N and 120° E–160° W.

2.2. Datasets

The datasets and related information used in the study are presented in Table 1.
ERA5 is the latest generation of ECMWF global atmospheric reanalysis from 1979 to the present produced by the ECMWF, and has already benefited from a decade of developments in model physics, core dynamics and data assimilation relative to ERA-Interim [53,54]. For the data used from ERA5, variables u and v are the zonal and meridional wind speeds (unit: m s−1) of each air pressure layer, q is the specific humidity (unit: kg kg−1) of each air pressure layer, sp is the surface pressure (unit: hPa), tp is the total precipitation (units: mm d−1) and slhf is the surface latent heat flux (unit: W m−2).
The precipitation data of the TP is collected from the China Meteorological Forcing Dataset (CMFD) [55]. These data utilize the existing international Princeton reanalysis data, Global Land Data Assimilation System (GLDAS) data, GEWEX-SRB radiation data and Tropical Rainfall Measuring Mission (TRMM) precipitation data as the background field. Moreover, it integrates conventional meteorological observational data from the China Meteorological Administration with accuracy between the meteorological bureau observation data and satellite remote sensing data with daily time resolution. The prec is the 3 h average precipitation rate (unit: mm h−1), with a spatial resolution of 0.1°. The CMFD precipitation data are more reliable than the reanalysis precipitation data [56], but their spatial extent is only limited to China, therefore, the neural network method was chosen to fuse the CMFD precipitation data with ERA5 to supplement the part of the TP outside China. The SST data are collected from the optimally interpolated sea surface temperature dataset (OI SST V2) provided by the NOAA/OAR/ESRL PSD [57]. Furthermore, as commonly used climate indices, the multivariate ENSO index and dipole mode index are employed [58,59].
From the perspectives of the same time in the two areas of the TP and the IPWP, and the spatiotemporal unification of multi-source datasets, the spatial resolution of the data used in this study is 0.25°, and the timespan ranges from 1979 to 2018, with a temporal resolution of the monthly mean.

2.3. Methods

In this work, we firstly calculated the water vapor flux, water vapor flux divergence, boundary WVB and the precipitable water of TP, and then operated the single or multi-element mathematical analysis at the temporal or spatial scale. Methods used include correlation coefficient calculation and t test, linear regression analysis, correlation vector analysis and index calculation.
The vertically integrated water vapor flux (Q) is defined as [60]
Q = 1 g p s p t q V d p = Q u + Q v
which can be respectively divided into the zonal and meridional water vapor transport flux Q u = 1 g p s p t q u d p , Q v = 1 g p s p t q v d p , where g (9.8 m s−2) represents the gravity acceleration, and ps is the surface pressure (unit: hPa). The climatological mean surface pressure is approximately 600 hPa, owing to the high-elevation topographic effects of the TP [3]. Therefore, the ps is set to 600 hPa, when the ps exceeds 600 hPa. Additionally, pt is set to 300 hPa as the top pressure of the atmosphere (unit: hPa) [61].
The WVB is defined as
WVB = Q d l
which can be divided into the zonal WVBu, WVB u = Q λ a d Φ , and the meridional WVBv, W VB v = Q Φ a cos Φ d λ , where a is the earth radius, Φ is the latitude, λ is the longitude, and l is the boundary curve of the TP or its internal basins [62].
To examine the pattern of the slhf due to the high temperature characteristics of the IPWP, we define a new warm pool index considering the SST based on the slhf, called WPI-slhf,
WPI s l h f = 1 n i = 1 n slhf i s s t i 28 s s t ¯ 28
where slhfi is the slhf at the current grid point i, s s t i is the SST of i, s s t ¯ is the mean SST of all the grid, and n is the total number of grids whose SSTs are higher than 28 °C.
Additionally, the correlation vector analysis [14] is conducted as follows:
R ( x , y ) = R u ( x , y ) i + R v ( x , y ) j
where R is the composite correlation vector of Ru and Rv, Ru is the correlation field of the Ru component (greater than 0 represents the westward direction), and Rv is the correlation field of the Rv component (greater than 0 represents the southerly direction).

3. Results

3.1. TP Water Vapor Transport and Precipitation

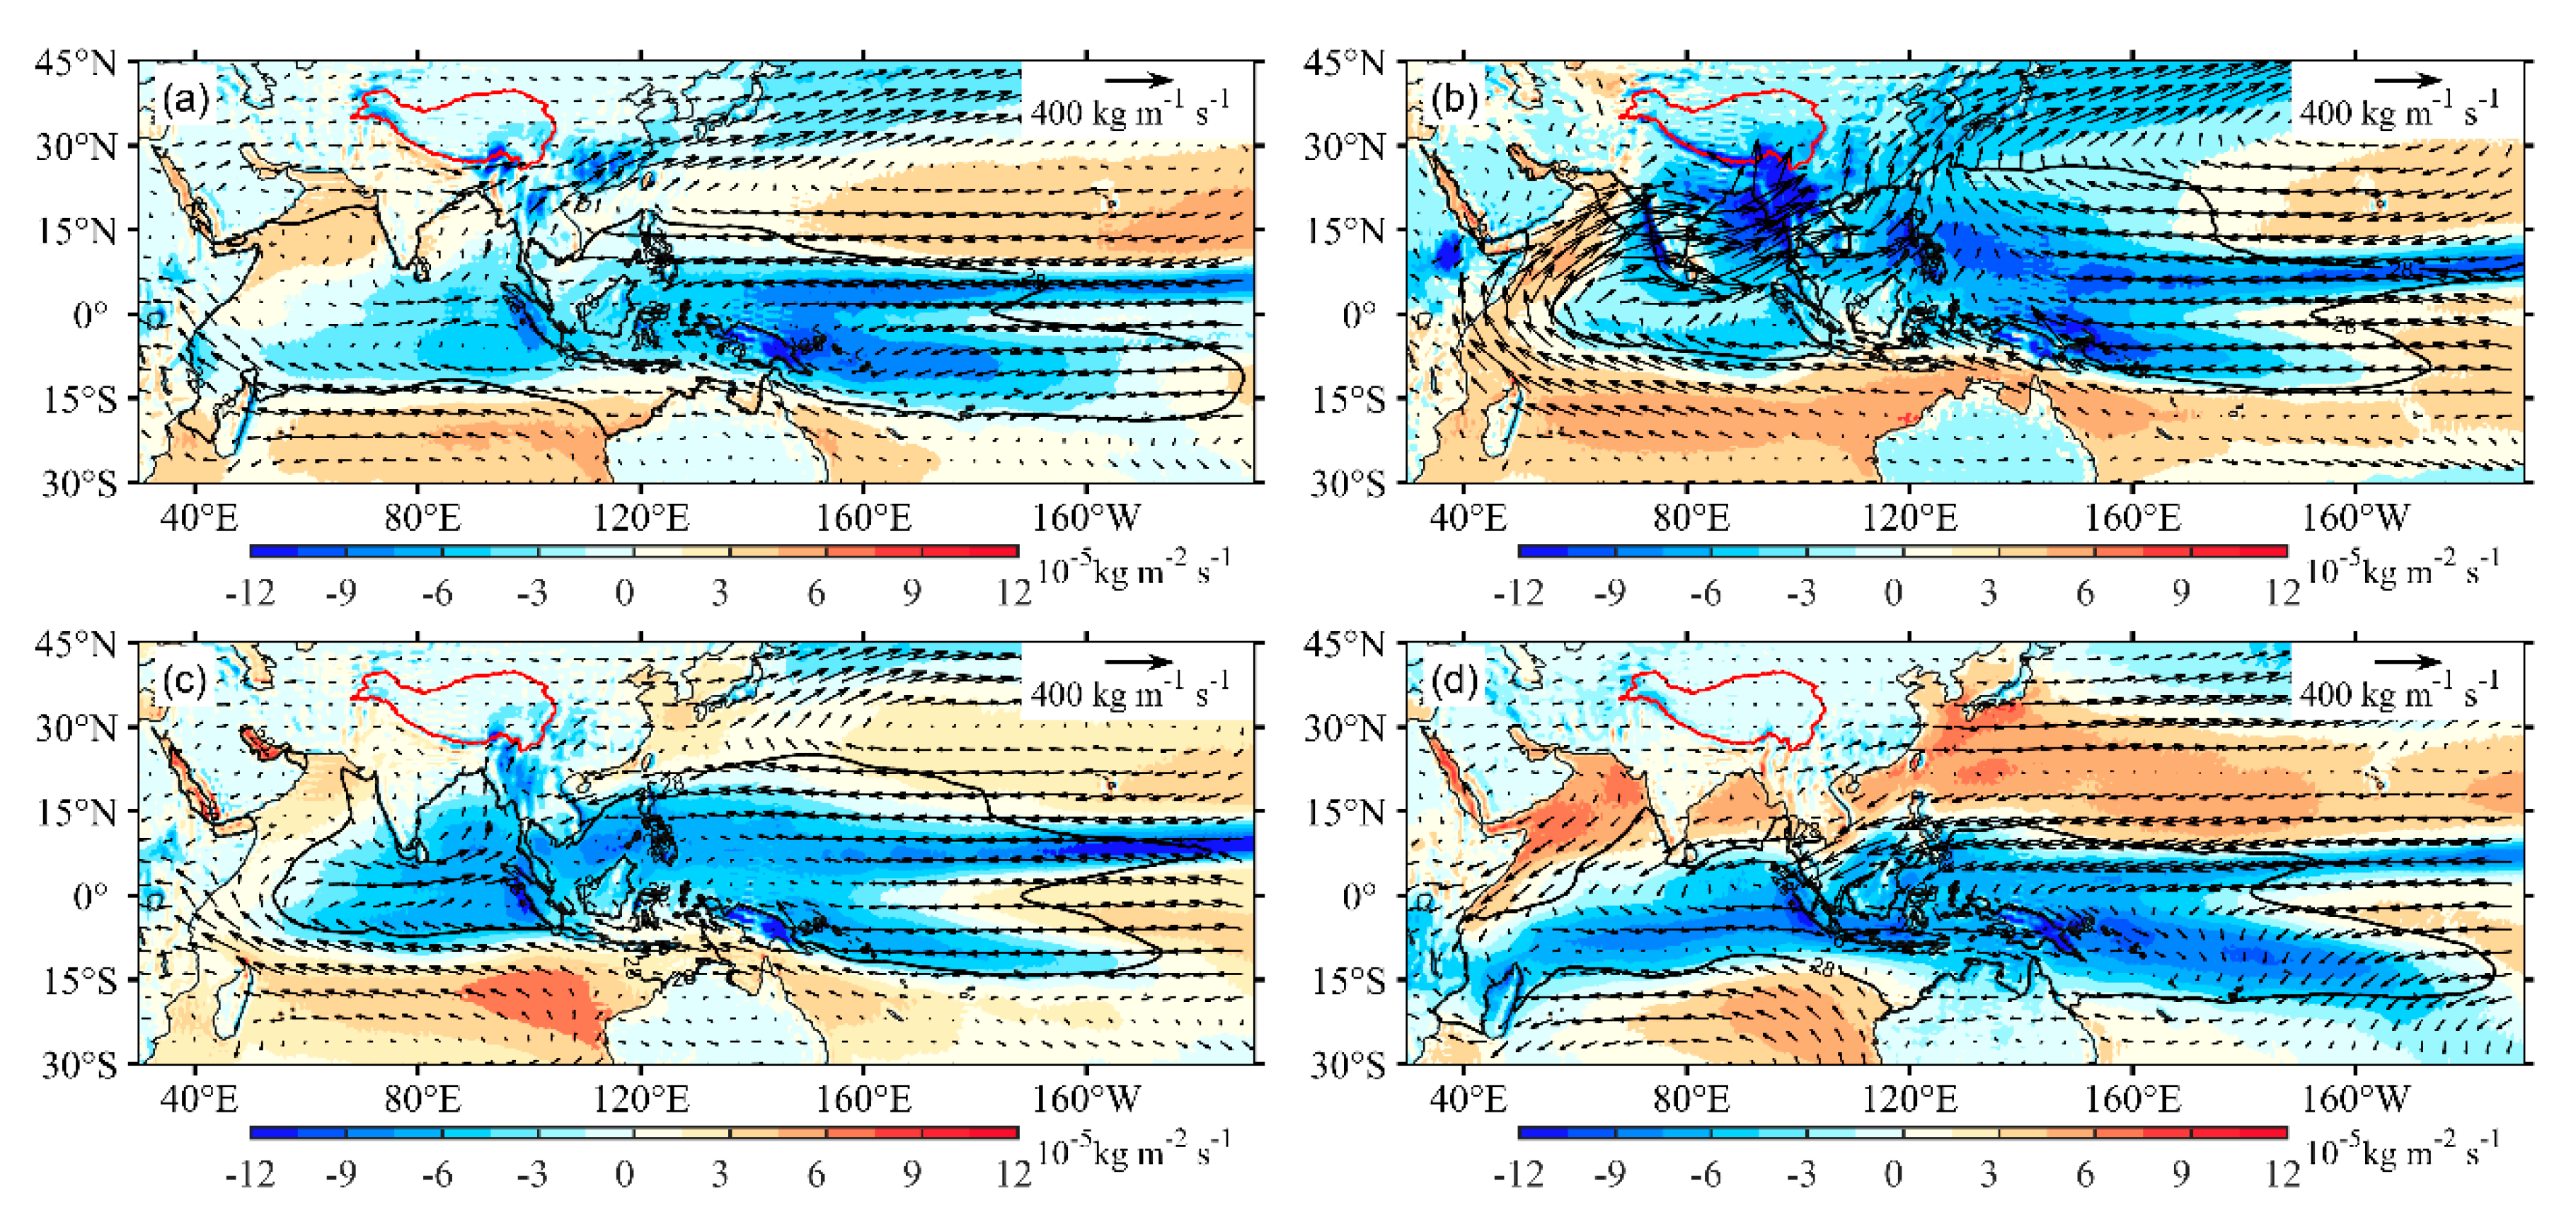
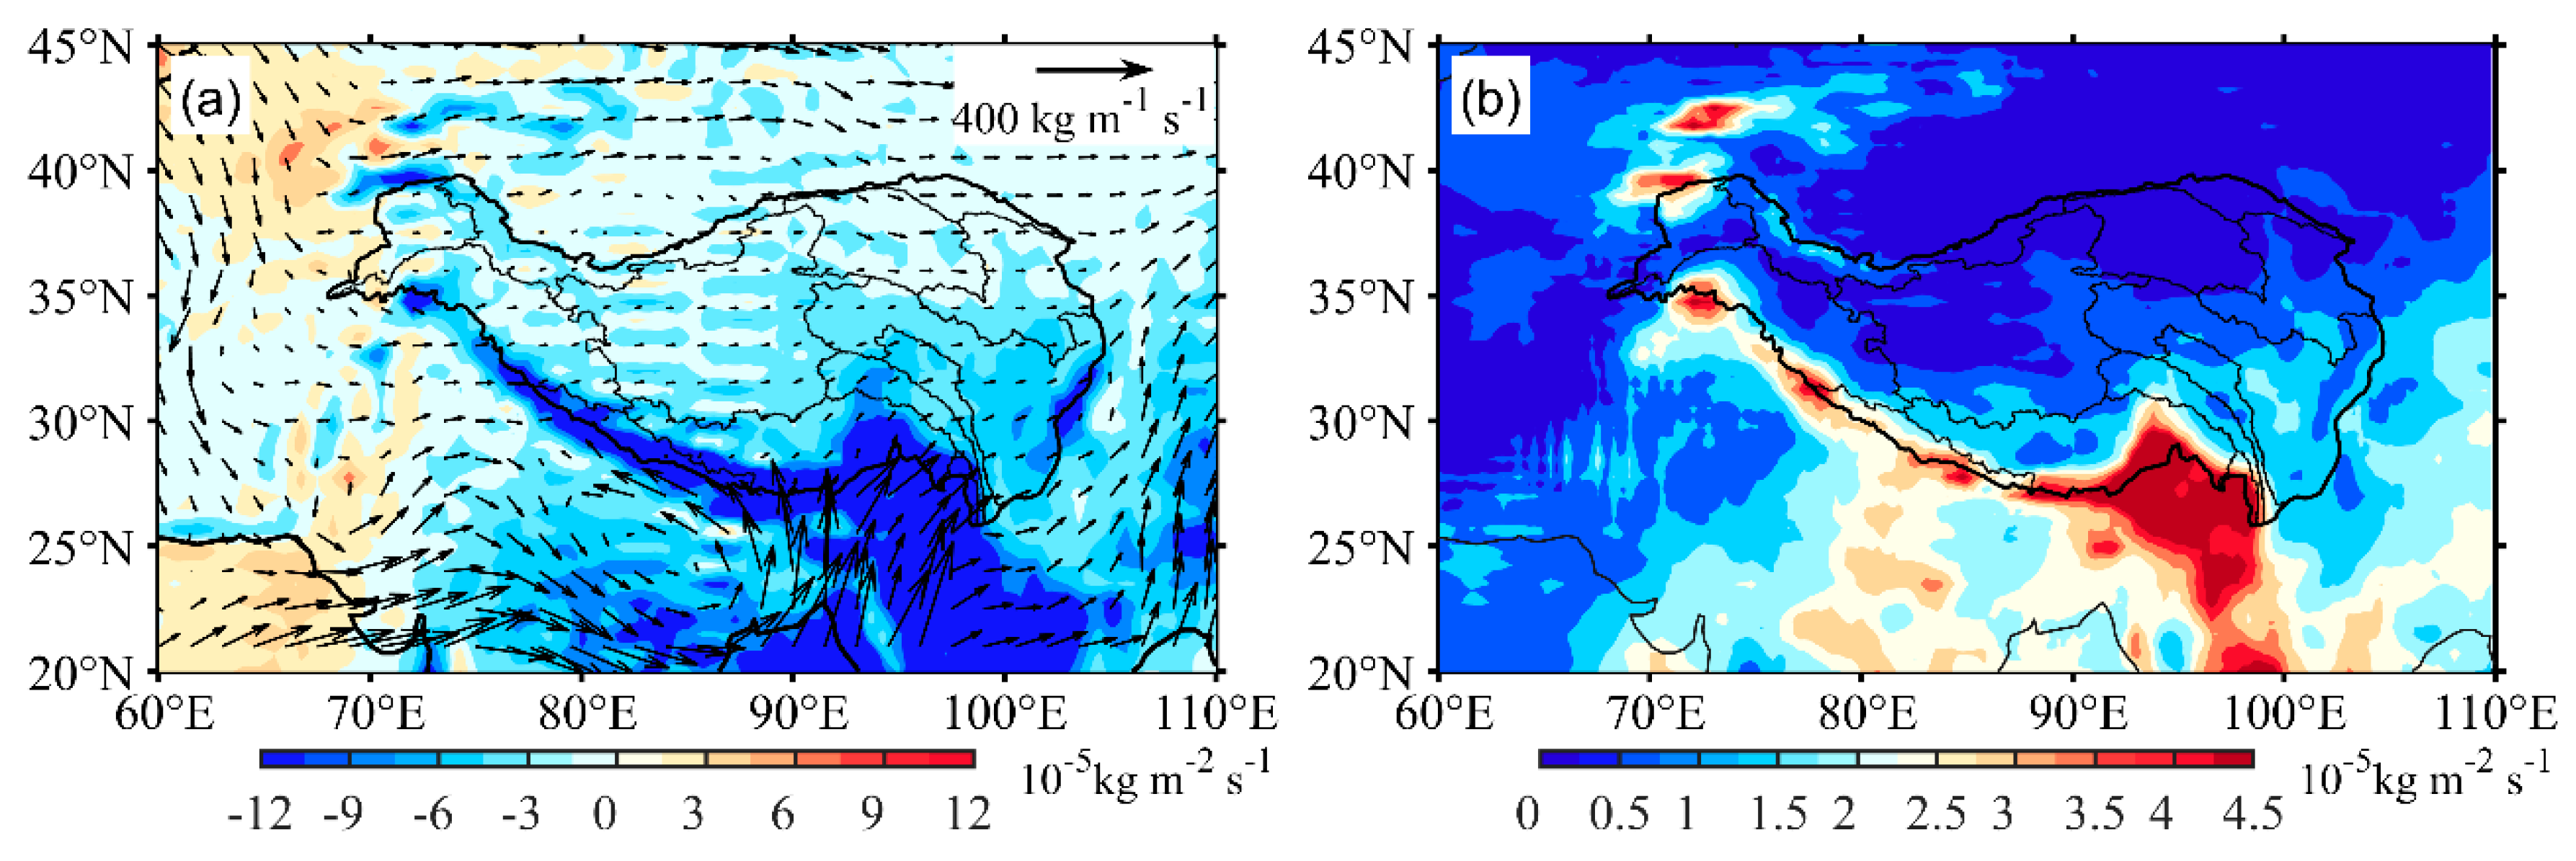
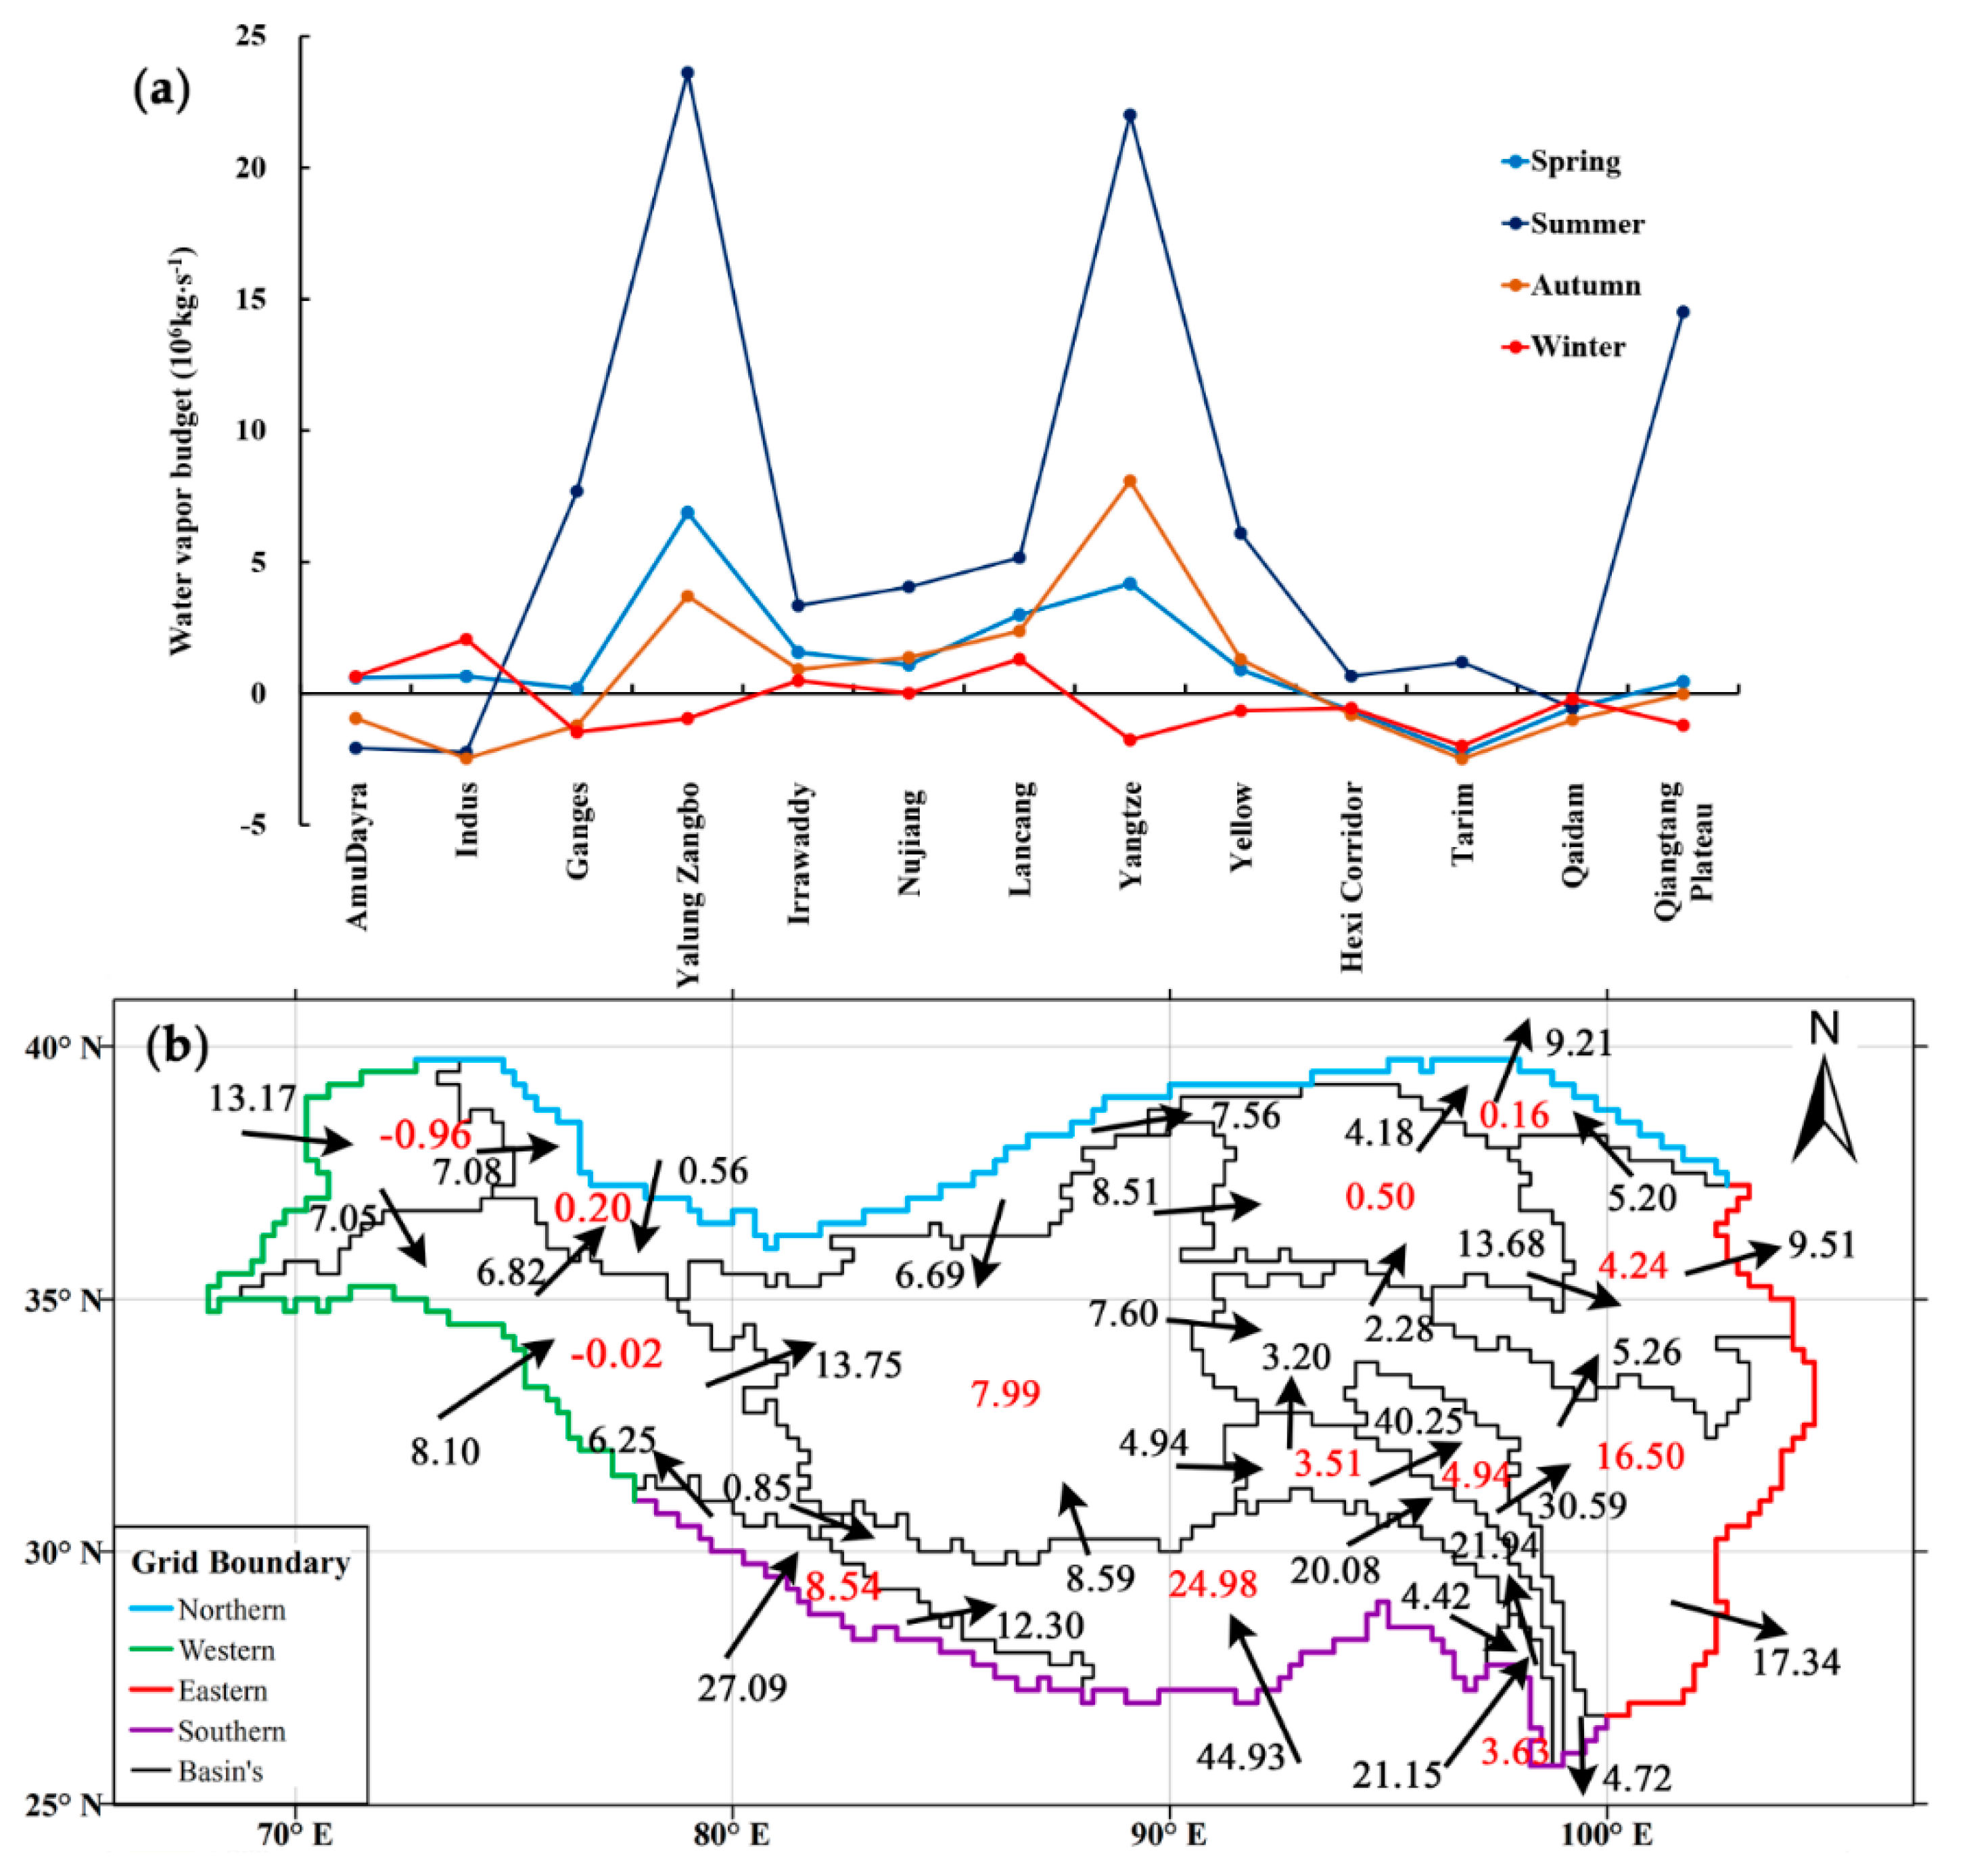
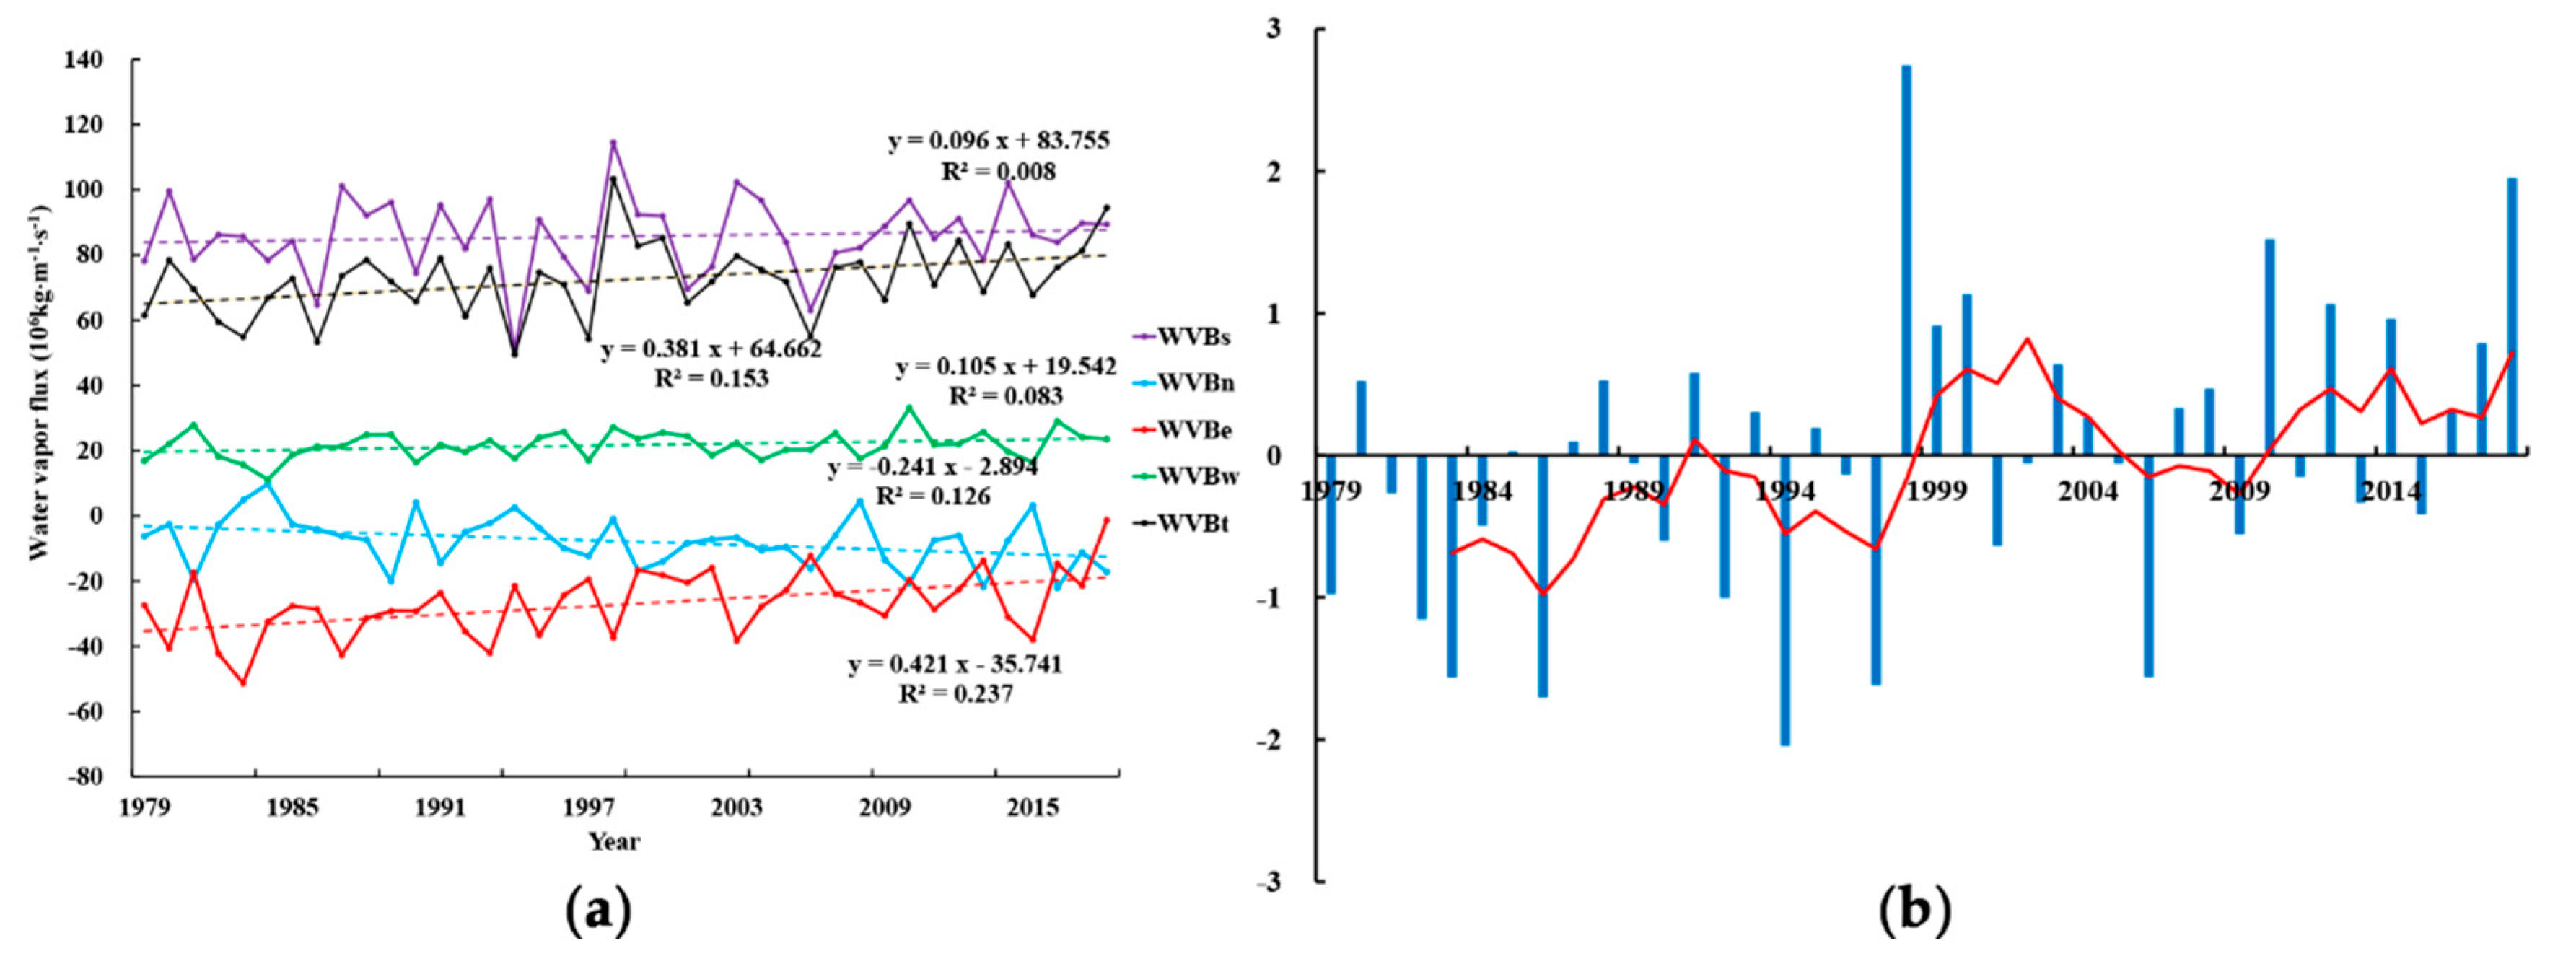
3.1.1. Spatiotemporal Variations of Water Vapor Transport and Budget

The water vapor transport intensity and water vapor source of the TP vary for different seasons, among which the water vapor flux is the largest in boreal summer, followed by autumn (September–October–November, SON) and spring (March–April–May, MAM), and is the least in winter (December–January–February, DJF). In spring and winter (Figure 2a,c), the high-value areas of water vapor flux are located in the west and southeast of the plateau; the water vapor mainly can be attributed to the westerly belt in the middle and high latitudes and the Arabian Sea in the northern Indian Ocean. Owing to partial eastward transportation along the southern foothills of the Himalayas, fewer amounts of water vapor enter the interior of the plateau. In summer and autumn (Figure 2b,d), the high-value area of the water vapor flux is located in the southeast of the plateau. Meanwhile, the water vapor is mainly transported by the monsoon in the northern Indian Ocean and the Western Pacific, while the westerly belt water vapor transport is less. The entire process of water vapor transport in the summer can be seen in Figure 2b and Figure 3a, where the water vapor source is located in the equatorial south of the Indian Ocean. Under the action of the equatorial jet and the monsoons, the water vapor is transported through the coast of East Africa, enters the Arabian Sea and the Indian subcontinent, following which it enters the land through the Bay of Bengal. Consequently, it gives rise to three branches in the southeast part of the TP, westward along the southern foothills of the Himalayas, northward along the Grand Canyon of the Yarlung Zangbo River and north-eastward along the Irrawaddy River. It is evident from Figure 2 that the seasonal variations of the intertropical convergence zone (ITCZ) and the water vapor convergence are consistent with the range of the IPWP.
Figure 3b presents the variation of the vertically integrated summer water vapor flux divergence in the TP during the past decades. The water vapor transport in the southeastern TP, the southern foothills of the Himalayas and the west of the plateau exhibits significant interannual changes, which correspond to the high-value areas of water vapor flux. However, the mean square deviation of the water vapor flux divergence within the TP is small, and the overall distribution is weakened from southeast to northwest.
From the perspective of the seasonal WVB distribution (Figure 4a), in spring, the high-value regions of the WVB are the Yarlung Zangbo River Basin (30.1%), the Indus River Basin (16.1%) and the Upper Yangtze River Basin (14.4%); in summer, the high-value regions of the WVB include the Yarlung Zangbo River Basin (33.7%), the Upper Yangtze River Basin (22.2%) and the Ganges River Basin (11.5%); in autumn (Figure 4b), the high-value areas of the WVB are the Upper Yangtze River Basin (37.3%), the Yarlung Zangbo River Basin (34.6%) and the Lancang River Basin (16.7%); in winter, the regions with high WVB are the Indus River Basin (48.3%), the Lancang River Basin (19.0%) and the AmuDarya River Basin (16.3%). We find that the high-value areas of the WVB are concentrated in the south, southwest and southeast of the plateau. Moreover, as the seasons change, the high-value center exhibits an east–west shift.
The results indicate that the WVBs of different basins are different from each other on spatial and seasonal scales. In terms of annual total WVB, the Yarlung Zangbo (31.4%) and the Yangtze River Basin (20.2%) are the two basins with the largest budget, followed by the Lancang River (10.3%) and the Indus River Basin (7.7%), and Ganges River Basin (6.9%), then the Upper Yellow River (6.0%), Qiangtang Plateau (5.4%), Irrawaddy River Basin (5.3%) and Nu River (5.0%), finally followed by the Tarim River Basin, Qaidam Basin and Hexi Corridor, and it is especially important to note that the river basin of the Hexi Corridor presents the net water vapor export.
In terms of seasonal WVB in various basins, the AmuDarya and Indus River Basins have the largest spring and winter WVBs for the whole year; the Ganges, the Yarlung Zangbo, Irrawaddy, Nu, the Upper Yangtze and the Upper Yellow Rivers have the largest summer proportion, accounting for more than 50% of the annual budgets. This is followed by spring, which accounts for 15–20% of each basin. The Upper Yangtze River shows net water vapor output in winter; the river basins of the Hexi Corridor and Tarim are net outputs in spring, summer and autumn; the Qaidam Basin and Qiangtang Plateau have shown net output in autumn; the Qiangtang Plateau has the largest summer budget, followed by spring.
According to the water vapor transport characteristics of the TP in summer, the plateau boundary is divided into four sections (western, southern, eastern and northern boundaries), and the climatological mean summer WVBs of the 13 basins divided within the TP are shown in Figure 4b. The water vapor transport fluxes at each boundary from 1979 to 2018 are calculated (Figure 5a). Water vapor enters the TP through the southern and western boundaries and leaves the plateau via the eastern boundary. Among all the boundaries, the summer climatological mean WVB of the southern boundary (WVBs) was the largest at 85.7 × 10⁶ kg s−1. Moreover, the climatological mean WVB of the western boundary (WVBw) was 21.7 × 10⁶ kg s−1, and the eastern boundary (WVBe) was −27.1 × 10⁶ kg s−1, while the northern boundary (WVBn) was −7.8 × 10⁶ kg s−1. The total WVB of the TP (WVBt) was 72.5 × 10⁶ kg s−1. In general, the WVBt has experienced an increasing trend at the rate of 3.81 × 10⁶ kg s−1 decade−1. The correlation coefficient between the WVBt and WVBs is 0.78, which is larger than that with WVBw, WVBe or WVBn. Therefore, it is evident that the monsoon from the Indian subcontinent and the Bay of Bengal is the most significant factor affecting the summer WVB of the TP on the climatology state. Figure 5b shows the standardized time series and 11-year slip changes in the WVB of the TP during summer.

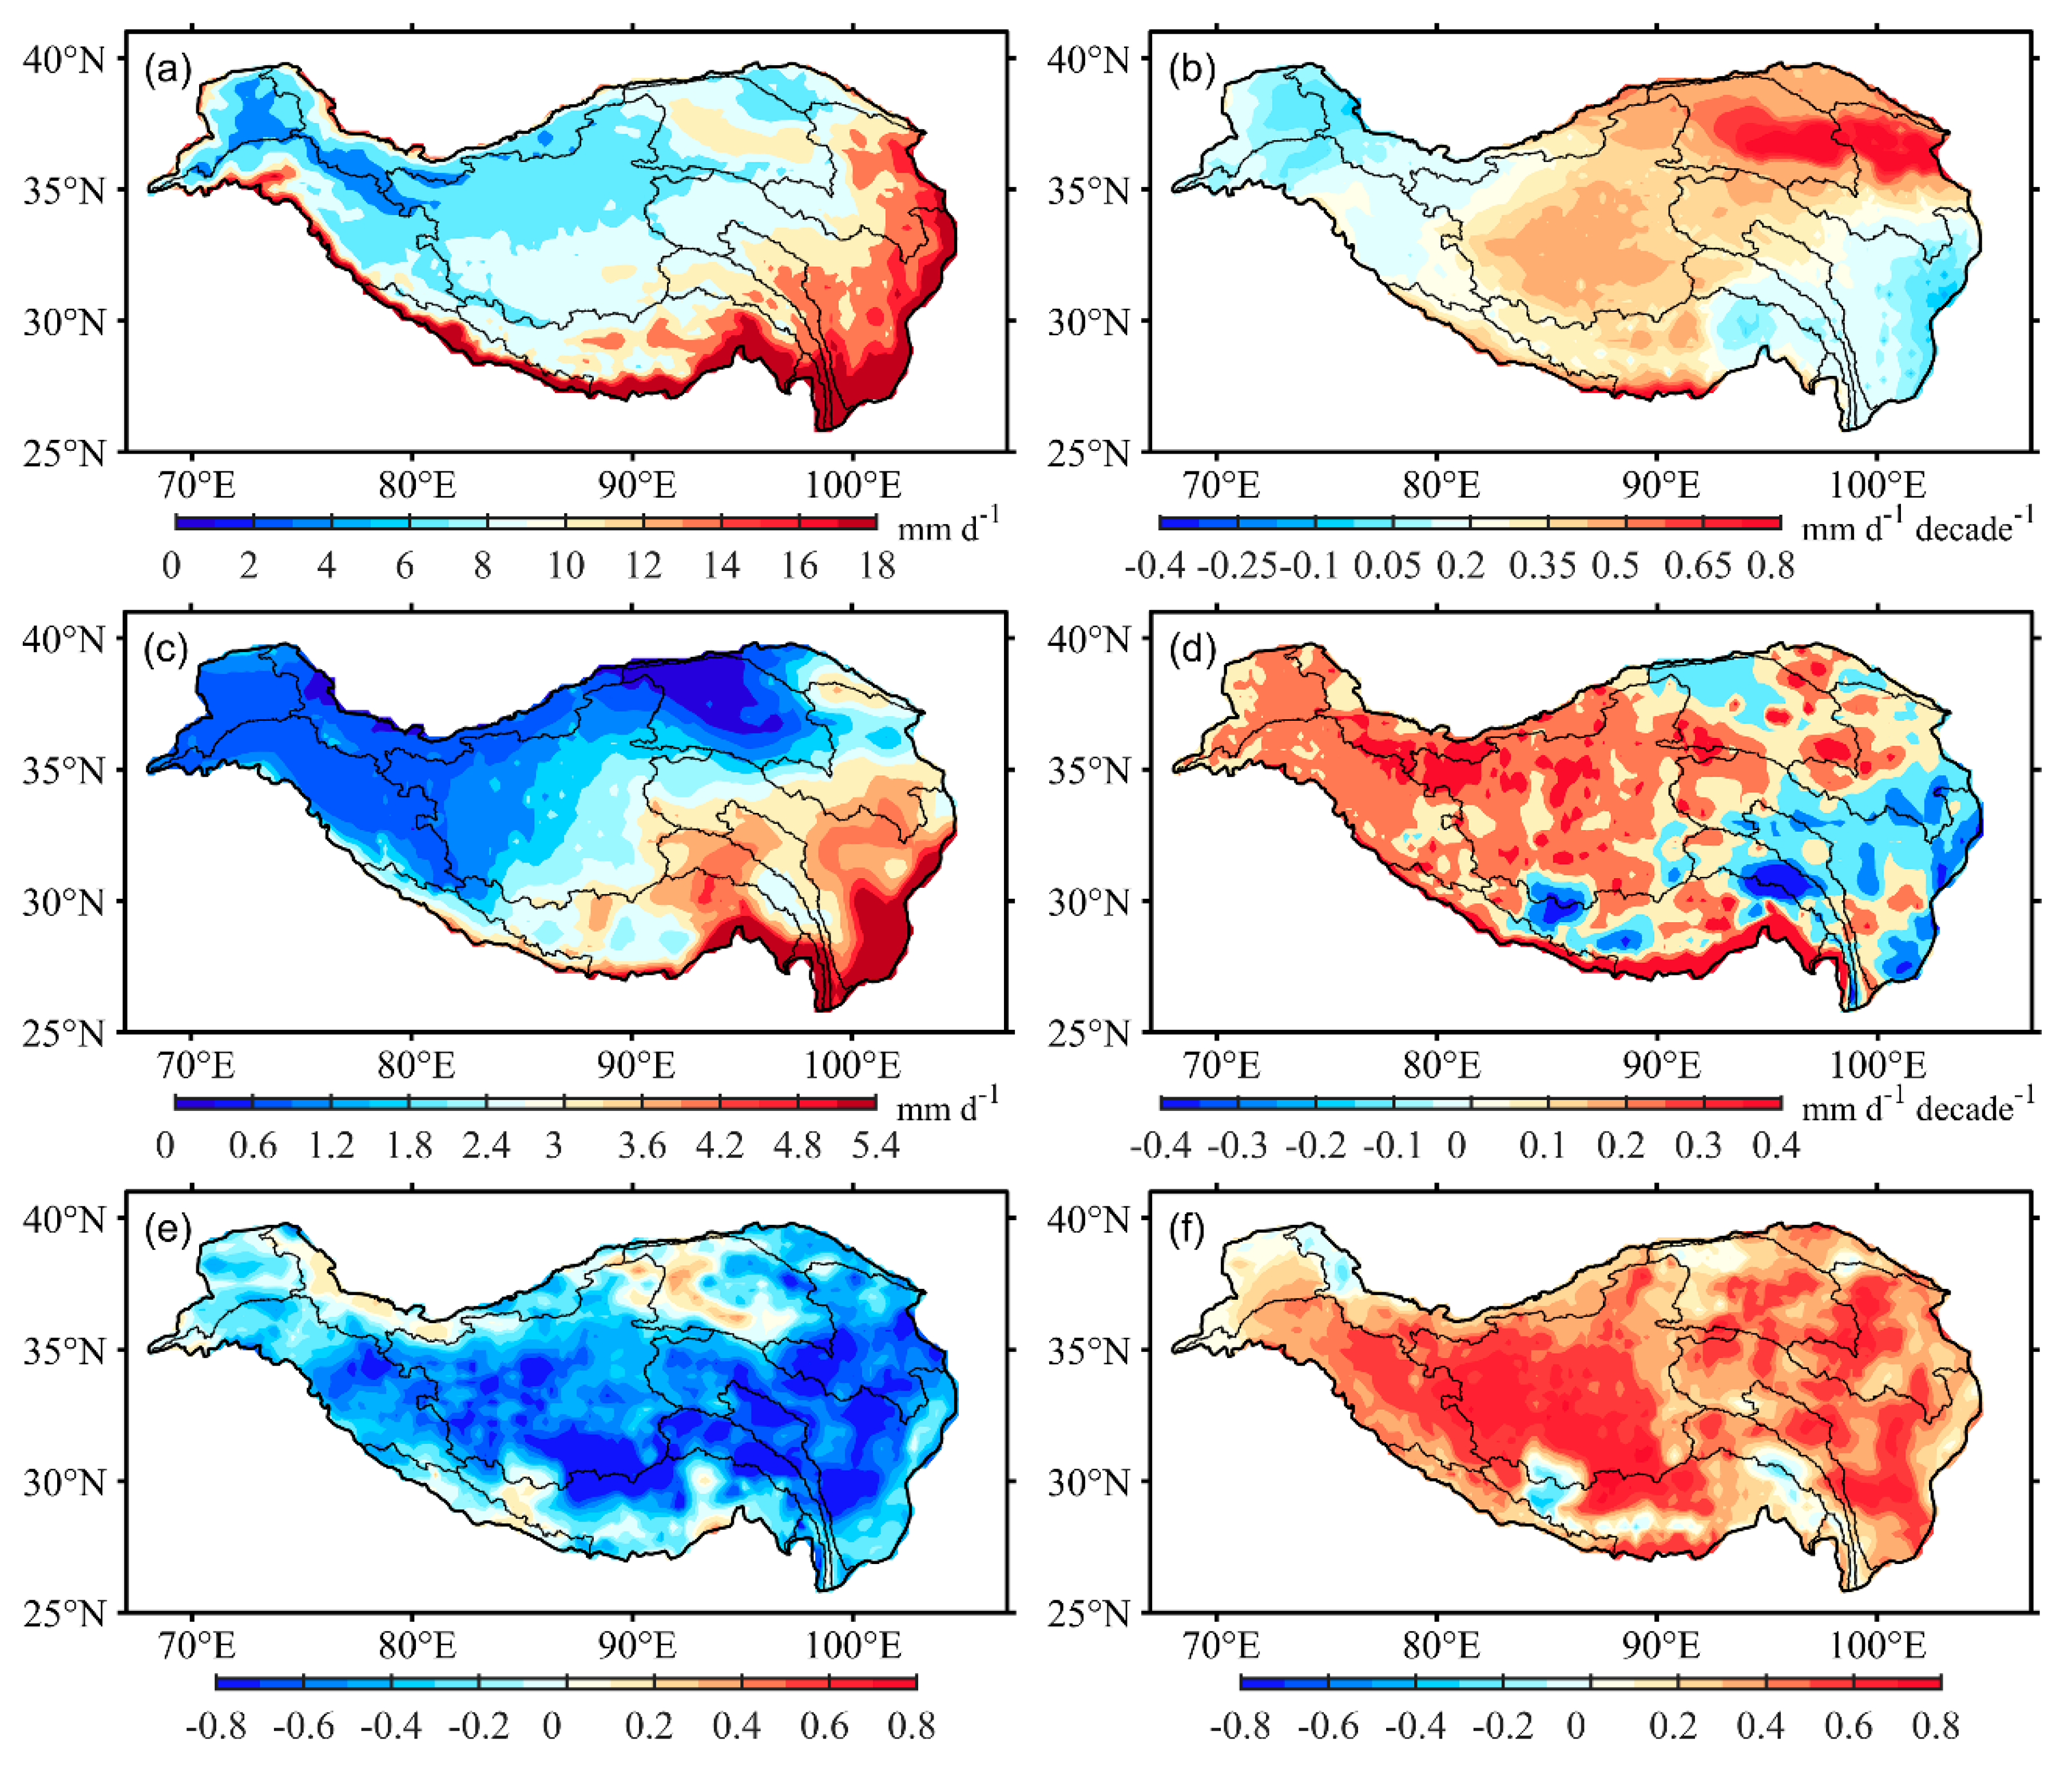
3.1.2. Spatiotemporal Variations of the Precipitable Water and Precipitation

The distribution of summer precipitable water (PW) (Figure 6a) over the TP decreases from southeast to northwest. The PW in the southeast of the plateau exceeds 20 mm d-1, while that of the northwest is less than 5 mm d−1. The PW on the TP has shown an increasing overall trend, and the fastest increasing areas are mainly located in the northeastern TP, including the Upper Yellow River Basin, Hexi Corridor and Qaidam Basin (Figure 6b). A possible reason for the increase in PW in these areas is the rapid melting of the Qilian Mountain glaciers [63]. Similarly, for the Qiangtang Plateau and the sources of major rivers in the eastern TP, the PW experienced an increasing trend. However, the PW in the southeastern and western TP showed a weaker decreasing trend.
The distribution of summer precipitation on the TP (Figure 6c) is similar to that of PW, and precipitation increases most rapidly near the Himalayas. The other basins are bounded by the monsoon boundary in the east of the Qiangtang Plateau; the western TP of the monsoon boundary increases while the eastern TP decreases (Figure 6d). However, it is worth noting that there is a local low-value area of precipitation. The PW in the middle and upper reaches of the Nu River Basin and the PW and precipitation in this low-value area are decreasing. This decrease can be attributed to the decrease in WVB in the basin and the special dry-hot effect in the Hengduan Mountains [64]. According to Figure 6e,f, the precipitation in the TP is negatively correlated with the water vapor flux divergence, while being positively correlated with the overall PW. However, in the upper reaches of the Yarlung Zangbo River, the correlation is reversed for the water vapor flux divergence and PW. Moreover, this area is an arid valley, which is similar to the dry-hot valley in the Hengduan Mountains.

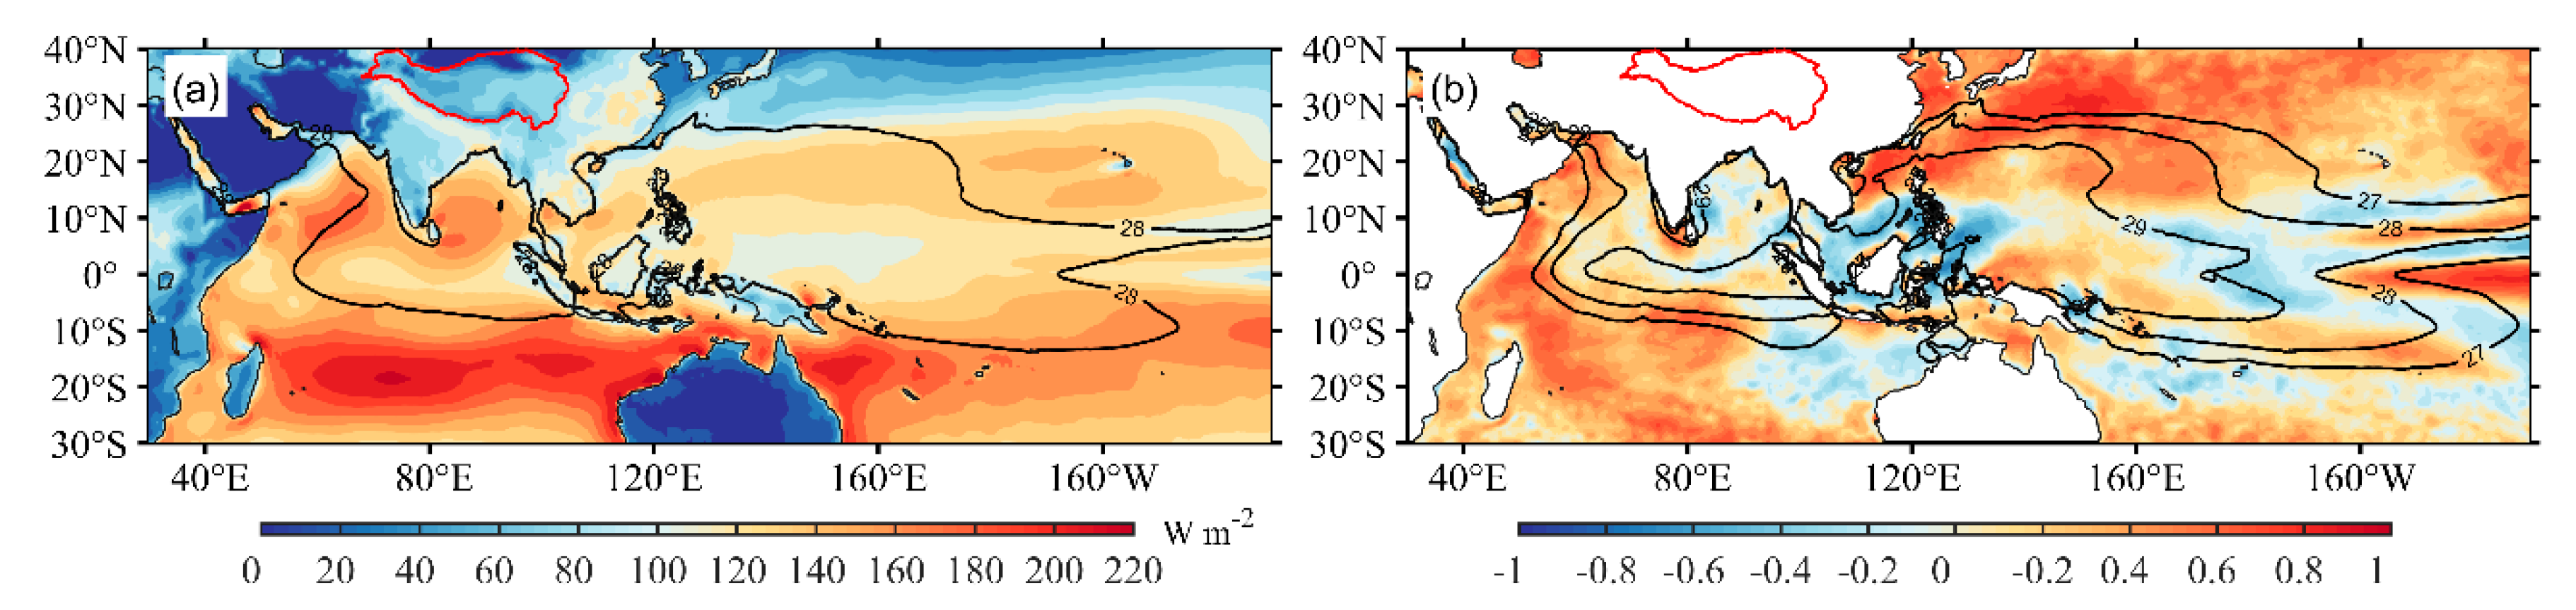
3.2. IPWP SST and Slhf Changes

Figure 7a shows the mean summer distribution of the slhf in the IPWP. In the northern IOWP, the southern regions of the Arabian Sea and Bay of Bengal each have a high local slhf center and are consistent with the distribution of the SST. Meanwhile, for the WPWP in the Solomon Islands, there is a low local slhf center where the mean SST exceeds 29 °C. To examine the relationship between the slhf and SST in the IPWP, we calculated the correlation coefficient (Figure 7b). It is evident from the result that the slhf is significantly positively correlated with the SST in the equatorial southwest Indian Ocean, Arabian Sea and the north-western and central Pacific regions. In contrast, it is significantly negatively correlated with the SST in the regions near the equatorial east of the Indian Ocean, Bay of Bengal, South China Sea, and Indonesian Islands. Following this, we calculated the multi-year average correlation coefficient of the slhf and SST of the IPWP: the correlation between the two is significantly positive (r = 0.64), indicating that the slhf would increase when the IPWP gets warmer. Moreover, using the linear small disturbance method to quantitatively evaluate the direct local contribution of relevant meteorological elements to the trend of the slhf, Li et al. [65] found that the SST increasing is the primary direct and local cause of the slhf trend.
The correlation coefficients between the standardized time series of the WVB of the TP and the WPI-SST and WPI-slhf of the IPWP were 0.35 and 0.41, respectively (Figure 8). The WPI-SST and WPI-slhf changed around 1998, from a negative phase to a positive phase, and the changes in the WVB of the TP (Figure 4b) around 1998 coincided with the overall trend of increase for the three. Among them, the WPI-SST exhibited the greatest extent of change.

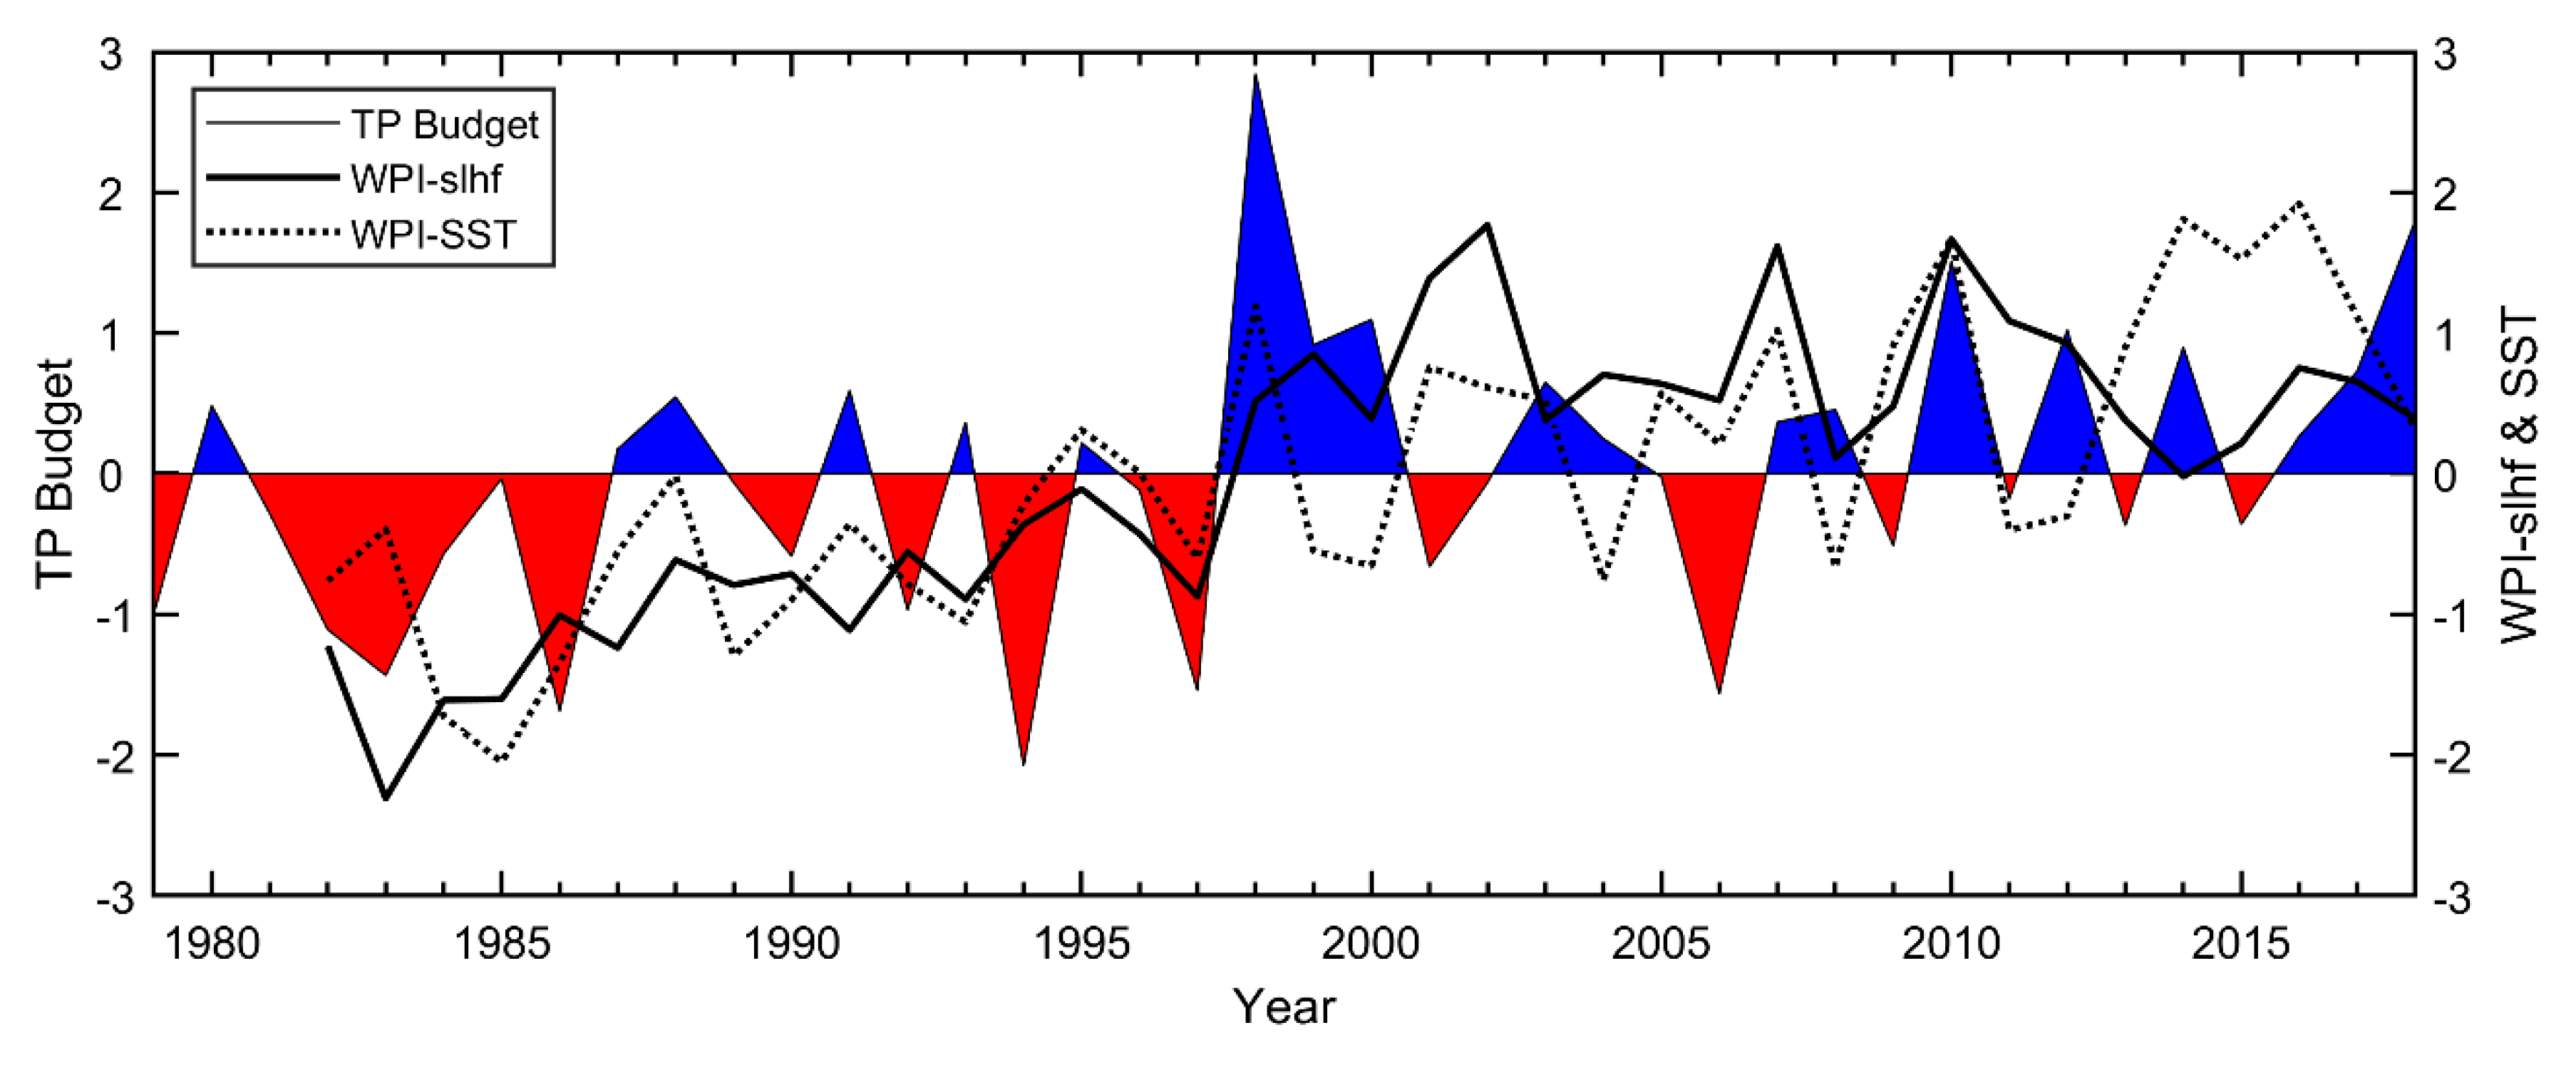
3.3. The Relationship Between the TP and the IPWP

According to Figure 9a,c, when the WPI-SST of the IPWP gets larger, an anticyclone will form in the equatorial West Indian Ocean (near 70° E). Furthermore, statistical results reveal a more significant relationship between the WPI-SST and WPI-slhf and the cross-equatorial flows over Somalia (SCEF). This relationship enhances the water vapor transport flux from the South Indian Ocean to East Africa and the Arabian Sea and increases the water vapor input to the western plateau. Moreover, it will also strengthen the water vapor transport flux from the WPWP and the South China Sea to the Bay of Bengal from the Indian subcontinent and the central Himalayas to increase the water vapor input, and then transport it to the Qiangtang Plateau and Xinjiang. When the WPI-slhf and WPI-SST of the IPWP simultaneously become stronger, they strengthen the water vapor transport in the northeast of the plateau and increase the water vapor output in the area.
The WPI-slhf is significantly positively correlated with the precipitation of the TP to the west of the plateau and negatively correlated to the east of the plateau (Figure 9b). Moreover, the areas with a significant positive correlation are mostly located in high-elevation areas (>5000 m), including the Qiangtang Plateau, the watershed areas in the Himalayas, Kunlun Mountains and Qilian Mountains and other watersheds, indicating that the changes in high-elevation precipitation are closely related to the slhf changes of the IPWP. In addition, the spatial distribution of the correlation coefficient between the WPI-SST and the precipitation of TP (Figure 9d) is similar to that of the WPI-slhf. However, the correlation is weaker, indicating that the relationship between the changes in plateau precipitation and the SST of the IPWP is relatively weaker.
The spatial correlation patterns in Figure 10a show that a close correspondence of positive summer WVB over the TP and SST is observed in the WPWP, coasts of New Guinea and the Solomon Islands, western Indian Ocean and the coast of East Africa. Meanwhile, the negative pattern is prevalent in the equatorial Pacific east (180° E), as well as the central southern Indian Ocean. As is shown in Figure 10b, the spatial regression pattern of the summer WVB over the TP with the slhf is different from that of the SST. The positive correlation area is in the equatorial Pacific east (160° E), the equatorial Indian Ocean and eastern Madagascar. Meanwhile, the negative area appears in the south-eastern Philippine Islands, western Indian Peninsula, Bay of Bengal and the South China Sea.
Correlations of the WVBs over the TP and its inner basins with climate indices on the interannual scale are listed in Table 2. The WVB over the TP is positively correlated with the WPI-slhf. Of the 13 basins inside the plateau, the Ganges River Basins and the Qiangtang Plateau show a strong positive correlation. Meanwhile, there are no significant correlations in other areas. However, the interannual correlation between the WVB of the TP and its basins and the IOD index is exceedingly weak and fails to explain the impact of the Indian Ocean Dipole (IOD) on the plateau WVB. Since 1998, the IOD has gradually developed toward a warmer phase. After 11 years of average increase (Figure 11), we find that the WVB of the TP increased significantly in the 1980s and 1990s, and slowly decreased in the 2000s. However, the WPI-slhf and IOD have exhibited an overall increasing trend, indicating the decadal increase in the IPWP and the warming of the Indian Ocean.
On the interdecadal scale (Table 3), changes in the WVB of the TP are closely related to the WPI-slhf and IOD signal. The increase in the slhf of the IPWP and the warm phase with the IOD are conducive to an increasing WVB of the TP. Furthermore, the decreasing slhf of the IPWP will reduce the WVB of the TP. For the interior of the plateau, the results are closely related to its central and eastern regions, including Irrawaddy, Upper Yangtze, Upper Yellow, Hexi Corridor, Tarim River Basins and Qiangtang Plateau. Meanwhile, on the interdecadal scale, during the El Niño (La Niña) year, the WVB of the Indus and Nu River Basins decreased, while that of the Ganges River, Hexi Corridor River and Qaidam Basins WVB increased.

4. Conclusions and Discussion

In this study, based on the latest ERA5 reanalysis product and satellite-observed SST, we have studied the variability characteristics of summer WVBs over the TP and its 13 basins with high-resolution boundaries and analyzed the effects of the water vapor transport of the TP on the PW and precipitation. Furthermore, a new slhf index of the IPWP is defined, and the effects of the SST and slhf of the IPWP on the WVB of the TP are investigated on the interannual and interdecadal scales. Concurrently, we also explored the impact of the ENSO and IOD index on the WVB of the TP. We found that:
(1) On the seasonal scale, the regions with high water vapor flux showed east–west shifts concentrated at the south, southwest and southeast boundaries of the TP. The summer WVBt of the TP from 1979 to 2018 was calculated to be 72.5 × 10⁶ kg s−1, which has experienced an increasing trend at a rate of 3.81 × 10⁶ kg s−1 decade−1, and its interdecadal variation was strongly associated with the WVBe (at a rate of 4.21 × 10⁶ kg s−1 decade−1), although WVBs contributed the most to the WVBt.
(2) Upon using the same method to calculate the WVBs of the 13 basins within the TP, it is evident that the high-value areas of the summer WVB were the Yarlung Zangbo River Basin (33.7%), the Upper Yangtze River Basin (22.2%), Ganges River Basin (11.5%) and the Qiangtang Plateau (10.8%), while the low-value areas were the Hexi Corridor (0.22%), the Qaidam Basin ( 0.7%), Tarim River Basin (0.3%) and Amu Darya (–1.3%).
(3) For the IPWP, the WPI-slhf changed from a negative phase to a positive phase around 1998, which was consistent with the trend of the WVB of the TP. As the WPI-slhf increased, a cyclone was formed in the equatorial West Indian Ocean (close to 70° E) and enhanced the SCEF, bringing more water vapor to the TP via East Africa and the Arabian Sea.
(4) On the interannual scale, the WVB in the TP was positively correlated with the WPI-slhf. On the interdecadal scale, changes in the WVB of the TP were closely related to the WPI-slhf and IOD signals, and the correlation coefficients were 0.86 and 0.85. Therefore, the warming of the IPWP and the IOD signals were the key factors connected to the interdecadal changes of the WVB over the TP, especially for the eastern and central TP.
The WVBt over the TP was found to be the largest in summer, accounting for 55.7% of the annual WVBt, and then the spring WVBt, which accounted for 23.5% during 1979–2018. Although many studies have investigated the water vapor transport characteristics and WVBt over the TP using different reanalysis datasets, the boundary of the TP is almost rough and contains many non-plateau areas [9,10,23,43], this paper calculates the WVB of the irregular and high-resolution boundary of the TP, thus can more realistically represent the TP’s WVB, and the WVB is significantly lower than the results of previous studies. For TP’s inner 13 basins, the WVBs of Yarlung Zangbo and Nu River basins were high, but the WVBs in the upper and middle reaches of the two basins presented net water vapor export, and the PW and precipitation showed deceasing trends, this decrease could be attributed to the special dry-hot effects in the Northern Himalayas and Hengduan Mountains [64]. Besides, it is important to note that the WVBt of the Hexi Corridor in autumn was negative of −0.27 × 10⁶ kg s−1,which may be attributed to the sharp increase in the glacier melts of the Qilian Mountain over the last 50 years [63].
The summer water vapor of the TP mainly comes from its southern and western boundaries, which can be extended to the Arabian Sea, the Bay of Bengal and the South China Sea, further traced back to the tropical Indian Ocean and the Western Pacific Ocean, including the IPWP. As the IPWP gets warmer, it could also enhance the water vapor transport from the WPWP and South China Sea to the Bay of Bengal, and from the Indian Subcontinent and the Central Himalayas to the Bay of Bengal, along with an increase in the water vapor input [66]. However, a simultaneous increase in the WPI-slhf and WPI-SST would enhance the water vapor transport in the north-eastern TP and cause the water vapor output of the TP. Regardless of the interannual scale or the interdecadal scale, there is no significant relationship between the WVB over the TP and the multivariate ENSO index.
The current results provide evidence that the variations in summer WVB over the TP were closely correlated with the air–sea slhf of the IPWP, which could be helpful to understand the sea–atmosphere–land interaction mechanism related to the TP. Further investigations are needed to clarify the impact of the IPWP on the climate changes of the TP and its surrounding areas.

Author Contributions

Conceptualization, Q.D.; data curation, F.K.; formal analysis, D.M.; investigation, D.M.; resources J.L.; supervision, Q.D.; methodology, Z.Y. and Y.L.; writing—original draft, D.M.; writing—review and editing, F.K. and Q.D. All authors have read and agreed to the published version of the manuscript.

Funding

This research was supported by the National Natural Science Foundation of China (NO. 41876210) and the National Key Research and Development Program of China (2017YFA0603003).

Acknowledgments

The horizontal wind field, specific humidity, surface pressure, total precipitation and slhf data are provided by the European Center for Medium-Term Numerical Forecasting (ECMWF) (https://cds.climate.copernicus.eu/cdsapp#!/home). The SST data are from the NOAA/OAR/ESRL PSD (www.esrl.noaa.gov/psd). The daily precipitation data of the China meteorological forcing dataset (1979-2018) are provided by the National Tibetan Plateau Data Center (https://data.tpdc.ac.cn/zh-hans/data/8028b944-daaa-4511-8769-965612652c49/). The ASTER GDEM V2 is from the Ministry of Economy, Trade, and Industry (METI) of Japan and the United States National Aeronautics and Space Administration (NASA). The MEI and DMI are from NOAA (www.esrl.noaa.gov/psd/enso/mei/) and (www.esrl.noaa.gov/psd/gcos_wgsp/Timeseries/DMI/). Thanks for the technology support of the China-Sri Lanka Joint Center for Education and Research, Chinese Academy of Sciences.

Conflicts of Interest

The authors declare no conflict of interest.

References

  1. Boos, W.R.; Kuang, Z.M. Dominant control of the South Asian monsoon by orographic insulation versus plateau heating. Nature 2010, 463, 218–222. [Google Scholar] [CrossRef]
  2. Kang, S.C.; Xu, Y.W.; You, Q.L.; Flugel, W.A.; Pepin, N.; Yao, T.D. Review of climate and cryospheric change in the Tibetan Plateau. Env. Res. Lett. 2010, 5, 8. [Google Scholar] [CrossRef]
  3. Hao, D.L.; Wen, J.G.; Xiao, Q.; Wu, S.B.; Lin, X.W.; Dou, B.C.; You, D.Q.; Tang, Y. Simulation and Analysis of the Topographic Effects on Snow-Free Albedo over Rugged Terrain. Remote Sens. 2018, 10, 278. [Google Scholar] [CrossRef] [Green Version]
  4. Yang, K.; Wu, H.; Qin, J.; Lin, C.G.; Tang, W.J.; Chen, Y.Y. Recent climate changes over the Tibetan Plateau and their impacts on energy and water cycle: A review. Glob. Planet. Chang. 2014, 112, 79–91. [Google Scholar] [CrossRef]
  5. Ge, J.; You, Q.L.; Zhang, Y.Q. Effect of Tibetan Plateau heating on summer extreme precipitation in eastern China. Atmos. Res. 2019, 218, 364–371. [Google Scholar] [CrossRef]
  6. Xu, X.D.; Dong, L.L.; Zhao, Y.; Wang, Y.J. Effect of the Asian Water Tower over the Qinghai-Tibet Plateau and the characteristics of atmospheric water circulation. Chin. Sci. Bull. Chin. 2019, 64, 2830–2841. [Google Scholar] [CrossRef] [Green Version]
  7. Zhou, T.; Gao, J.; Zhao, Y.; Zhang, L.; Zhang, W. Water Vapor Transport Processes on Asian Water Tower. Bull. Chin. Acad. Sci. 2019, 34, 1210–1219. [Google Scholar]
  8. Zou, F.; Tenzer, R.; Jin, S.G. Water Storage Variations in Tibet from GRACE, ICESat, and Hydrological Data. Remote Sens. 2019, 11, 1103. [Google Scholar] [CrossRef] [Green Version]
  9. Zhou, C.Y.; Zhao, P.; Chen, J.M. The Interdecadal Change of Summer Water Vapor over the Tibetan Plateau and Associated Mechanisms. J. Clim. 2019, 32, 4103–4119. [Google Scholar] [CrossRef]
  10. Wang, Z.Q.; Duan, A.M.; Yang, S.; Ullah, K. Atmospheric moisture budget and its regulation on the variability of summer precipitation over the Tibetan Plateau. J. Geophys. Res. Atmos. 2017, 122, 614–630. [Google Scholar] [CrossRef]
  11. Li, H.Y.; Mao, D.H.; Li, X.Y.; Wang, Z.M.; Wang, C.Z. Monitoring 40-Year Lake Area Changes of the Qaidam Basin, Tibetan Plateau, Using Landsat Time Series. Remote Sens. 2019, 11, 343. [Google Scholar] [CrossRef] [Green Version]
  12. You, Q.L.; Liu, J.J.; Pepin, N. Changes of summer cloud water content in China from ERA-Interim reanalysis. Glob. Planet. Chang. 2019, 175, 201–210. [Google Scholar] [CrossRef] [Green Version]
  13. Zhang, G.Q.; Yao, T.D.; Xie, H.J.; Kang, S.C.; Lei, Y.B. Increased mass over the Tibetan Plateau: From lakes or glaciers? Geophys. Res. Lett. 2013, 40, 2125–2130. [Google Scholar] [CrossRef]
  14. Zhao, Y.; Xu, X.D.; Zhao, T.L.; Yang, X.J. Effects of the Tibetan Plateau and its second staircase terrain on rainstorms over North China: From the perspective of water vapour transport. Int. J. Clim. 2019, 39, 3121–3133. [Google Scholar] [CrossRef] [Green Version]
  15. Dong, W.H.; Lin, Y.L.; Wright, J.S.; Xie, Y.Y.; Xu, F.H.; Xu, W.Q.; Wang, Y. Indian Monsoon Low-Pressure Systems Feed Up-and-Over Moisture Transport to the Southwestern Tibetan Plateau. J. Geophys. Res.-Atmos. 2017, 122, 12140–12151. [Google Scholar] [CrossRef]
  16. Ma, Y.Z.; Lu, M.Q.; Chen, H.N.; Pan, M.X.; Hong, Y. Atmospheric moisture transport versus precipitation across the Tibetan Plateau: A mini-review and current challenges. Atmos. Res. 2018, 209, 50–58. [Google Scholar] [CrossRef]
  17. Kong, F.P.; Dong, Q.; Xiang, K.S.; Yin, Z.; Li, Y.Y.; Liu, J.Y. Spatiotemporal Variability of Remote Sensing Ocean Net Primary Production and Major Forcing Factors in the Tropical Eastern Indian and Western Pacific Ocean. Remote Sens. 2019, 11, 391. [Google Scholar] [CrossRef] [Green Version]
  18. Liu, Y.M.; Lu, M.M.; Yang, H.J.; Duan, A.M.; He, B.; Yang, S.; Wu, G.X. Land-atmosphere-ocean coupling associated with the Tibetan Plateau and its climate impacts. Natl. Sci. Rev. 2020, 7, 534–552. [Google Scholar] [CrossRef] [Green Version]
  19. Dong, W.H.; Lin, Y.L.; Wright, J.S.; Ming, Y.; Xie, Y.Y.; Wang, B.; Luo, Y.; Huang, W.Y.; Huang, J.B.; Wang, L.; et al. Summer rainfall over the southwestern Tibetan Plateau controlled by deep convection over the Indian subcontinent. Nat. Commun. 2016, 7, 9. [Google Scholar] [CrossRef]
  20. Chen, B.; Xu, X.D.; Yang, S.; Zhang, W. On the origin and destination of atmospheric moisture and air mass over the Tibetan Plateau. Theor. Appl. Clim. 2012, 110, 423–435. [Google Scholar] [CrossRef]
  21. Zhang, F.L.; Li, G.P.; Yue, J. The Moisture Sources and Transport Processes for a Sudden Rainstorm Associated with Double Low-Level Jets in the Northeast Sichuan Basin of China. Atmosphere 2019, 10, 160. [Google Scholar] [CrossRef] [Green Version]
  22. Luo, Y.L.; Zhang, R.H.; Qian, W.M.; Luo, Z.Z.; Hu, X. Intercomparison of Deep Convection over the Tibetan Plateau-Asian Monsoon Region and Subtropical North America in Boreal Summer Using CloudSat/CALIPSO Data. J. Clim. 2011, 24, 2164–2177. [Google Scholar] [CrossRef] [Green Version]
  23. Curio, J.; Maussion, F.; Scherer, D. A 12-year high-resolution climatology of atmospheric water transport over the Tibetan Plateau. Earth Syst. Dynam. 2015, 6, 109–124. [Google Scholar] [CrossRef] [Green Version]
  24. Zhang, C.; Tang, Q.H.; Chen, D.L.; van der Ent, R.J.; Liu, X.C.; Li, W.H.; Haile, G.G. Moisture Source Changes Contributed to Different Precipitation Changes over the Northern and Southern Tibetan Plateau. J. Hydrometeorol. 2019, 20, 217–229. [Google Scholar] [CrossRef]
  25. Pan, C.; Zhu, B.; Gao, J.H.; Kang, H.Q.; Zhu, T. Quantitative identification of moisture sources over the Tibetan Plateau and the relationship between thermal forcing and moisture transport. Clim. Dyn. 2019, 52, 181–196. [Google Scholar] [CrossRef]
  26. Meng, F.C.; Su, F.G.; Li, Y.; Tong, K. Changes in Terrestrial Water Storage During 2003-2014 and Possible Causes in Tibetan Plateau. J. Geophys. Res. Atmos. 2019, 124, 2909–2931. [Google Scholar] [CrossRef]
  27. Xu, X.; Zhao, T.; Lu, C.; Shi, X. Characteristics of the water cycle in the atmosphere over the Tibetan Plateau. Acta Meteorol. Sin. 2014, 72, 1079–1095. [Google Scholar]
  28. Chen, B.; Zhang, W.; Yang, S.; Xu, X.D. Identifying and contrasting the sources of the water vapor reaching the subregions of the Tibetan Plateau during the wet season. Clim. Dyn. 2019, 53, 6891–6907. [Google Scholar] [CrossRef]
  29. Zou, M.; Qiao, S.; Wu, Y.; Feng, G. Effects of Anomalous Water Vapor Transport from Tropical Indian Ocean-Western Pacific on Summer Rainfall in Eastern China. Chin. J. Atmos. Sci. 2017, 41, 988–998. [Google Scholar]
  30. Xie, X.; You, Q.; Bao, Y.; Meng, X. The Connection Between the Precipitation and Water Vapor Transport over Qinghai-Tibetan Plateau in Summer Based on the Multiple Datasets. Plateau Meteorol. 2018, 37, 78–92. [Google Scholar]
  31. Feng, L.; Zhou, T.J. Water vapor transport for summer precipitation over the Tibetan Plateau: Multidata set analysis. J. Geophys. Res. Atmos. 2012, 117, 16. [Google Scholar] [CrossRef] [Green Version]
  32. Lu, N.; Trenberth, K.E.; Qin, J.; Yang, K.; Yao, L. Detecting Long-Term Trends in Precipitable Water over the Tibetan Plateau by Synthesis of Station and MODIS Observations. J. Clim. 2015, 28, 1707–1722. [Google Scholar] [CrossRef] [Green Version]
  33. Li, X.D.; Long, D.; Huang, Q.; Han, P.F.; Zhao, F.Y.; Wada, Y. High-temporal-resolution water level and storage change data sets for lakes on the Tibetan Plateau during 2000–2017 using multiple altimetric missions and Landsat-derived lake shoreline positions. Earth Syst. Sci. Data 2019, 11, 1603–1627. [Google Scholar] [CrossRef] [Green Version]
  34. Zhang, G.Q.; Yao, T.D.; Shum, C.K.; Yi, S.; Yang, K.; Xie, H.J.; Feng, W.; Bolch, T.; Wang, L.; Behrangi, A.; et al. Lake volume and groundwater storage variations in Tibetan Plateau’s endorheic basin. Geophys. Res. Lett. 2017, 44, 5550–5560. [Google Scholar] [CrossRef]
  35. Chen, D.; Gao, S.; Chen, J. Impact of the indo-pacific warm pool sst anomaly on arctic sea ice variation. Chin. J. Polar Res. 2016, 28, 49–57. [Google Scholar]
  36. Lin, C.Y.; Ho, C.R.; Lee, Y.H.; Kuo, N.J.; Liang, S.J. Thermal variability of the Indo-Pacific warm pool. Glob. Planet. Chang. 2013, 100, 234–244. [Google Scholar] [CrossRef]
  37. Visser, K.; Thunell, R.; Stott, L. Magnitude and timing of temperature change in the Indo-Pacific warm pool during deglaciation. Nature 2003, 421, 152–155. [Google Scholar] [CrossRef]
  38. DongXiao, Q.I.U.; Fei, H.; YuXing, Y. Interdecadal Variability of the Indo-Pacific Warm Pool. J. Ocean Univ. China 2007, 37, 525–532. [Google Scholar]
  39. Chu, C.J.; Yang, X.Q.; Sun, X.G.; Yang, D.J.; Jiang, Y.Q.; Feng, T.; Liang, J. Effect of the tropical Pacific and Indian Ocean warming since the late 1970s on wintertime Northern Hemispheric atmospheric circulation and East Asian climate interdecadal changes. Clim. Dyn. 2018, 50, 3031–3048. [Google Scholar] [CrossRef]
  40. Wang, Z.B.; Wu, R.G.; Chen, S.F.; Huang, G.; Liu, G.; Zhu, L.H. Influence of Western Tibetan Plateau Summer Snow Cover on East Asian Summer Rainfall. J. Geophys. Res. Atmos. 2018, 123, 2371–2386. [Google Scholar] [CrossRef]
  41. Hao, D.L.; Wen, J.G.; Xiao, Q.; Lin, X.W.; You, D.Q.; Tang, Y.; Liu, Q.; Zhang, S.S. Sensitivity of Coarse-Scale Snow-Free Land Surface Shortwave Albedo to Topography. J. Geophys. Res. Atmos. 2019, 124, 9028–9045. [Google Scholar] [CrossRef]
  42. Wang, Z.S.; Huang, M.; Wang, R.; Wang, S.Q.; Liu, X.D.; Xie, X.N.; Liu, Z.J.; Gong, H.; Hao, M. Global NDVI Patterns in Response to Atmospheric Water Vapor Anomalies over the Indo-Pacific Warm Pool during April-June. J. Clim. 2019, 32, 1167–1180. [Google Scholar] [CrossRef]
  43. Xu, K.P.; Zhong, L.; Ma, Y.N.; Zou, M.J.; Huang, Z.Y. A study on the water vapor transport trend and water vapor source of the Tibetan Plateau. Theor. Appl. Clim. 2020, 140, 1031–1042. [Google Scholar] [CrossRef]
  44. Yang, S.; Zhang, W.; Chen, B.; Xu, X.D.; Zhao, R.Y. Remote moisture sources for 6-hour summer precipitation over the Southeastern Tibetan Plateau and its effects on precipitation intensity. Atmos. Res. 2020, 236, 14. [Google Scholar] [CrossRef]
  45. Zhou, X.; Yang, K.; Beljaars, A.; Li, H.D.; Lin, C.G.; Huang, B.; Wang, Y. Dynamical impact of parameterized turbulent orographic form drag on the simulation of winter precipitation over the western Tibetan Plateau. Clim. Dyn. 2019, 53, 707–720. [Google Scholar] [CrossRef]
  46. Zhang, Y.W.; Wang, D.H.; Zhai, P.M.; Gu, G.J.; He, J.H. Spatial Distributions and Seasonal Variations of Tropospheric Water Vapor Content over the Tibetan Plateau. J. Clim. 2013, 26, 5637–5654. [Google Scholar] [CrossRef]
  47. Guo, L.; Klingaman, N.P.; Demory, M.E.; Vidale, P.L.; Turner, A.G.; Stephan, C.C. The contributions of local and remote atmospheric moisture fluxes to East Asian precipitation and its variability. Clim. Dyn. 2018, 51, 4139–4156. [Google Scholar] [CrossRef] [Green Version]
  48. Xie, F.; Zhou, X.; Li, J.P.; Chen, Q.L.; Zhang, J.K.; Li, Y.; Ding, R.Q.; Xue, J.Q.; Ma, X. Effect of the Indo-Pacific Warm Pool on Lower-Stratospheric Water Vapor and Comparison with the Effect of ENSO. J. Clim. 2018, 31, 929–943. [Google Scholar] [CrossRef]
  49. Ratna, S.B.; Cherchi, A.; Joseph, P.V.; Behera, S.K.; Abish, B.; Masina, S. Moisture variability over the Indo-Pacific region and its influence on the Indian summer monsoon rainfall. Clim. Dyn. 2016, 46, 949–965. [Google Scholar] [CrossRef]
  50. Hoell, A.; Funk, C. Indo-Pacific sea surface temperature influences on failed consecutive rainy seasons over eastern Africa. Clim. Dyn. 2014, 43, 1645–1660. [Google Scholar] [CrossRef]
  51. Priya, P.; Mujumdar, M.; Sabin, T.P.; Terray, P.; Krishnan, R. Impacts of Indo-Pacific Sea Surface Temperature Anomalies on the Summer Monsoon Circulation and Heavy Precipitation over Northwest India-Pakistan Region during 2010. J. Clim. 2015, 28, 3714–3730. [Google Scholar] [CrossRef] [Green Version]
  52. Yin, Z.; Dong, Q.; Kong, F.; Cao, D.; Long, S. Seasonal and Interannual Variability of the Indo-Pacific Warm Pool and its Associated Climate Factors Based on Remote Sensing. Remote Sens. 2020, 12, 1062. [Google Scholar] [CrossRef] [Green Version]
  53. Dee, D.P.; Uppala, S.M.; Simmons, A.J.; Berrisford, P.; Poli, P.; Kobayashi, S.; Andrae, U.; Balmaseda, M.A.; Balsamo, G.; Bauer, P.; et al. The ERA-Interim reanalysis: configuration and performance of the data assimilation system. Q. J. R. Meteorol. Soc. 2011, 137, 553–597. [Google Scholar] [CrossRef]
  54. Hersbach, H.; Bell, W.; Berrisford, P.; Horányi, A.; J., M.-S.; Nicolas, J.; Radu, R.; Schepers, D.; Simmons, A.; Soci, C.; et al. Global reanalysis: Goodbye ERA-Interim, hello ERA5. ECMWF Newsl. 2019, 159, 17–24. [Google Scholar]
  55. He, J.; Yang, K.; Tang, W.J.; Lu, H.; Qin, J.; Chen, Y.Y.; Li, X. The first high-resolution meteorological forcing dataset for land process studies over China. Sci. Data 2020, 7, 11. [Google Scholar] [CrossRef] [PubMed] [Green Version]
  56. Kun, Y.; Jie, H.E. China meteorological forcing dataset (1979–2018). Natl. Tibet. Plateau Data Cent. 2018. [Google Scholar] [CrossRef]
  57. Reynolds, R.W.; Smith, T.M.; Liu, C.; Chelton, D.B.; Casey, K.S.; Schlax, M.G. Daily high-resolution-blended analyses for sea surface temperature. J. Clim. 2007, 20, 5473–5496. [Google Scholar] [CrossRef]
  58. Saji, N.H.; Goswami, B.N.; Vinayachandran, P.N.; Yamagata, T. A dipole mode in the tropical Indian Ocean. Nature 1999, 401, 360–363. [Google Scholar] [CrossRef] [PubMed]
  59. Wolter, K.; Timlin, M.S. El Nino/Southern Oscillation behaviour since 1871 as diagnosed in an extended multivariate ENSO index (MEI.ext). Int. J. Clim. 2011, 31, 1074–1087. [Google Scholar] [CrossRef]
  60. Banacos, P.C.; Schultz, D.M. The use of moisture flux convergence in forecasting convective initiation: Historical and operational perspectives. Weather Forecast 2005, 20, 351–366. [Google Scholar] [CrossRef]
  61. Xiao, W.; Yuanfa, G.; Sixian, C.E.N. Characteristics of the Moist Pool and Its Moisture Transports over Qinghai-Xizang Plateau in Summer Half Year. Acta Geogr. Sin. 2009, 64, 601–608. [Google Scholar]
  62. Zhang, Q.A.; Xu, C.Y.; Zhang, Z.X.; Chen, Y.D. Changes of atmospheric water vapor budget in the Pearl River basin and possible implications for hydrological cycle. Theor. Appl. Clim. 2010, 102, 185–195. [Google Scholar] [CrossRef]
  63. Sun, M.; Liu, S.; Yao, X.; Guo, W.; Xu, J. Glacier changes in the Qilian Mountains in the past half century: Based on the revised First and Second Chinese Glacier Inventory. Acta Geogr. Sin. 2015, 70, 1402–1414. [Google Scholar] [CrossRef] [Green Version]
  64. Dong, D.H.; Huang, G.; Tao, W.C.; Wu, R.G.; Hu, K.M.; Li, C.F. Interannual variation of precipitation over the Hengduan Mountains during rainy season. Int. J. Clim. 2018, 38, 2112–2125. [Google Scholar] [CrossRef]
  65. Li, G.; Ren, B.H.; Yang, C.Y.; Zheng, J.Q. Revisiting the trend of the tropical and subtropical Pacific surface latent heat flux during 1977-2006. J. Geophys. Res. Atmos. 2011, 116, 9. [Google Scholar] [CrossRef]
  66. Yang, H.; Xu, G.Y.; Wang, X.F.; Cui, C.G.; Wang, J.Y.; He, D.X. Quantitative Analysis of Water Vapor Transport during Mei-Yu Front Rainstorm Period over the Tibetan Plateau and Yangtze-Huai River Basin. Adv. Meteorol. 2019, 14. [Google Scholar] [CrossRef]
Figure 1. (a) The entire study area of the Tibetan Plateau (TP) where the black solid line (elevation greater than 2500 m) is the boundary of the TP, and the Indo-Pacific warm pool (IPWP), where the red line (SST greater than 28 °C) is the annual-averaged boundary of the IPWP. The dotted white lines are the rectangular boundaries of the Indian Ocean warm pool (IOWP) and Western Pacific warm pool (WPWP). (b) The topography of the TP and its 13 basins.
Atmosphere 11 00828 g001
Figure 2. Vertically integrated climate mean seasonal water vapor flux (vectors, unit: kg m−1 s−1) and divergence (shaded areas, unit: 10−5 kg m-2 s−1) (a): spring; (b): summer; (c): winter and (d): autumn) of years ranging from 1979 to 2018 for the TP and IPWP (red and black lines, respectively).
Atmosphere 11 00828 g002
Figure 3. (a) Vertically integrated water vapor transport of the TP in summer, similar to Figure 2b and (b) mean square deviation of the water vapor flux divergence (unit: 10−5 kg m−2 s−1).
Atmosphere 11 00828 g003
Figure 4. (a) Climatological mean WVBs in different seasons for the 13 basins; (b) summer climatological mean WVB of the basins and their boundaries for the TP (unit: 106 kg s−1) from 1979 to 2018.
Atmosphere 11 00828 g004
Figure 5. (a) Summer water vapor budget (WVB) (unit: 106 kg s−1) at different boundaries of the TP from 1979 to 2018, WVBn (blue, northern boundary), WVBw (green, western boundary), WVBs (purple, southern boundary) and WVBe (red, eastern boundary) represent the WVBs of the four boundaries; (b) the standard time series of summer WVBt (blue column) and its 11-year moving average (red line).
Atmosphere 11 00828 g005
Figure 6. Distribution of summer precipitable water (PW) and precipitation over the TP (a,c) unit: mm d−1) and their changing trends (b,d) unit: mm d−1 decade−1), and spatial correlation distribution of precipitation with water vapor flux divergence and PW (e,f).
Atmosphere 11 00828 g006
Figure 7. (a) Spatial pattern of summer mean surface latent heat flux (slhf) (unit: W m−2), and (b) its correlation with sea surface temperature (SST) in the IPWP from 1979 to 2018. The red solid line is the boundary of the TP, and the black solid lines are isolines at 27/28/29 of the SST.
Atmosphere 11 00828 g007
Figure 8. The standard time series of summer WVB in the TP (the shaded area) and the warm pool index (WPI)-slhf (solid black line) and WPI-SST (dashed black line).
Atmosphere 11 00828 g008
Figure 9. The linear regression pattern of the summer water vapor transport (the arrows represent the water vapor flux, and the shaded areas represent the divergence) against the (a) the WPI-slhf from 1979 to 2018 and (c) WPI-SST from 1982 to 2018, (b) is similar to (a), and (d) is similar to (c), but for summer precipitation in the TP.
Atmosphere 11 00828 g009
Figure 10. (a)The linear regression pattern of summer WVB over the TP and the SST of the IPWP, (b) is the same as (a), but for the slhf.
Atmosphere 11 00828 g010
Figure 11. The time series of the Indian Ocean Dipole (IOD) index (shading and solid black line) and standard time series of the TP budget (dashed blue line) and WPI-slhf index (solid red line) obtained by applying an 11-year moving average.
Atmosphere 11 00828 g011
Table 1. Detailed information of all the datasets used in the study.
Datasets ResolutionTimespanVariables
ERA50.25°, monthlyJanuary 1979–December 2018u and v, q, sp, tp, slhf
OI SST V20.25°, monthlyDecember 1981–December 2018sst
China Meteorological Forcing Dataset0.1°, dailyJanuary 1979–December 2018prec
ASTER GDEM V230 mdem
Table 2. The correlation coefficients of the WVB of 13 basins within the TP and climate indices of the IPWP.
BasinsClimate IndicesBasinsClimate Indices
WPIslhfNino3.4IODWPIslhfNino3.4IOD
TP0.41 *−0.37 *−0.08Lancang0.050.020.03
AmuDarya−0.07−0.04−0.16Yangtze0.24−0.09−0.03
Indus022−0.230.11Yellow0.25−0.180.00
Ganges0.49 *−0.49 *0.03Hexi Corridor0.04−0.090.03
Yalung Zangbo0.16−0.34 *−0.13Tarim0.25−0.090.06
Irrawaddy−0.21−0.140.05Qaidam0.010.110.17
Nu0.10−0.05−0.09Qiangtang 0.63 *−0.38 *−0.12
* The bold values are statistically significant above the 95% level.
Table 3. The correlation coefficients of the WVB of 13 basins within the TP and climate indices of the IPWP by applying an 11-year moving average.
BasinsClimate IndicesBasinsClimate Indices
WPIslhfNino3.4IODWPIslhfNino3.4IOD
TP0.86 *0.130.85 *Lancang0.37−0.020.32
AmuDarya−0.72 *−0.15−0.71 *Yangtze0.88 *0.110.80 *
Indus0.48 *0.42 *0.70 *Yellow0.83 *0.090.79 *
Ganges0.74 *0.230.90 *Hexi Corridor0.120.43 *0.31
Yalung Zangbo0.22−0.020.34Tarim0.44 *−0.31−0.00
Irrawaddy0.83 *−0.000.81 *Qaidam−0.51 *0.44 *−0.35
Nu0.28−0.240.13Qiangtang 0.96 *0.080.89 *
* The bold values are statistically significant above the 95% level.

