Abstract
This study documents a sudden interdecadal variation in the frequency of extreme high–temperature events (FEHE) over southern China during summer in the early 2000s, which is characterized by a relatively small (large) FEHE during 1991–2000 (2003–2018). The composite analysis on the extreme high–temperature events (EHEs) over southern China indicates that the occurrence of EHEs is mainly influenced by increased downward surface net shortwave radiation, which is induced by the cloud–forced radiation anomalies associated with reduced cloud; the reduced cloud is attributed to anomalous descent motion and decreased water vapor content in the troposphere. Compared to the situation during 1991–2000, anomalous descent motion and decreased atmospheric water vapor content occurred over southern China in summer during 2003–2018, providing a more favorable climatic condition for EHEs. This interdecadal variation is associated with the strengthened Pacific Walker circulation after 2003. The Pacific decadal oscillation (PDO) is suggested to be an important driver for the above interdecadal variation, which shifted from a positive phase towards a negative phase after 2003. Numerical experiments demonstrate that a negative phase of PDO may induce a strengthened Walker circulation and anomalous atmospheric descent motion as well as water vapor divergence over Southern China.
1. Introduction
Under the background of climate change, extreme high–temperature events (EHEs) increasingly occur and exert a great influence on human health, agriculture and social activities on a global scale, which attracts increasing studies focusing on EHEs [1,2,3,4,5]. For example, Europe underwent two devastating EHEs in 2003 and 2010, which led to about 70,000 and 55,000 heat–related deaths, respectively [1,6]. During the same period, some areas of southeastern Asia underwent frequent EHEs [7,8,9]. Therefore, EHEs have attracted more public attention, and deep investigation into the mechanisms of EHE occurrence is necessary.
Over the past decades, the frequency of EHEs (FEHE) underwent a significant increasing trend over all of eastern China (105° E east), except for a weak decreasing trend that was observed over the Yangtze River Valley [10,11,12]. Anthropogenic factors such as greenhouse gas emissions and urbanization play an important role in the long–term change in the FEHE in China [3,12,13]. The numerical simulation results of the models show that the EHEs will continue to increase across China [14,15,16]. Influenced by the East Asian monsoon, the climate in eastern China is unique with multi–timescale variability and remarkable regional features [17,18,19,20]. Superimposed on the long–term trends, the FEHE in the different regions of eastern China also shows significant interannual and interdecadal variability [5,21,22,23]. The atmospheric circulation responsible for the occurrence of EHEs is quite different between different regions of China [2,5,24,25,26]. For northern China (35° N north, 105° E east), the positive anomalies of FEHE in this region are mainly associated with positive anomalies of geopotential height in the overlying troposphere, which would suppress convection and cause more solar radiation to reach the surface [11,27,28]. For central–southern China (35° N south, 105° E east), the FEHE is influenced not only by geopotential height in the overlying troposphere but also by low–level thermal advection [21,29,30]. Previous studies suggest that the western North Pacific subtropical high (WNPSH) is the main factor for the occurrence of EHEs over southern China (30° N south, 105° E east) [8,11,31]. Wang et al. [31] noted that in July 2003, the East Asian jet stream moved southward, and the western North Pacific subtropical high intensified southwestward, contributing to more EHEs occurring over southern China. Chen and Lu [26] classified the atmospheric circulation associated with EHEs over eastern China, and EHEs over southern China and Yangtze River Valley are associated with a monsoonal circulation pattern, which are mainly characterized by high temperature only in the lower troposphere as a result of monsoon–induced anomalous descent motion and decreased water vapor. On the synoptic scale, Chen and Lu [26] and Chen et al. [32] found that the atmospheric anomalies responsible for the occurrence of EHEs over southern China are quite unique and are characterized by a pair of anticyclonic anomalies over southern China and cyclonic anomalies over the tropical western Pacific.
Previous studies have shown that the anomalous atmospheric circulation responsible for the EHE occurrence over eastern China is associated with various factors, such as the Atlantic sea surface temperature (SST), tropical Indian Ocean SST, El Niño–Southern Oscillation (ENSO), and sea ice [21,23,26,33,34,35,36]. Zhu et al. [21] found that the air–sea interaction over the northeastern Atlantic Ocean could influence the dominant mode of interannual variability of FEHE in eastern China characterized by opposite anomalies over northeastern China and southern China by stimulating a Eurasian wave train. The results of Hu et al. [34] showed that the warming of the tropical Indian Ocean could trigger a low–level anticyclone over the subtropical western Pacific via stimulating a Kelvin wave, which would lead to an anomalous descent motion, reduced cloud cover, and increased EHEs over southern China. The anomalous warming over the maritime continent could induce anomalous anticyclone and descent motion over southern China via East Asia–Pacific/Pacific–Japan teleconnection, which contributes to the occurrence of EHEs over southern China [21]. Furthermore, the relationship between the EHEs over southern China and the SST may undergo the interdecadal change [30,36], which also contributes to the complex of EHEs over southern China.
Southern China is located in the tropical–subtropical East Asian monsoon region, which undergoes frequent EHEs in summer [10,24,37]. Moreover, the dense population over this region makes southern China vulnerable to EHEs. In recent decades, the summer climate in southern China has undergone interdecadal variations, which has been widely observed [38,39,40,41,42,43,44]. By contrast, there is a lack of acknowledge of recent interdecadal variation in the FEHE over southern China and associated mechanisms. Thus, this study focuses on the following two questions: (1) What are the characteristics of interdecadal variations in the FEHE over southern China? (2) What are the mechanisms associated with the recent interdecadal variation in the FEHE over southern China, and what are the possible influential factors?
2. Data and Methods
2.1. Data
The daily maximum temperature data for 1961–2018 are used for defining EHEs, which are derived from the CN05.1 dataset (“CN” is short for China; “05” refers to a resolution of 0.5° × 0.5°; “05.1” means a better version with a higher resolution of 0.25° × 0.25°) [45,46]. The gridded daily dataset of CN05.1 is constructed on the daily observation data from over 2400 stations in China, which is widely used in studying climate characteristics in China [21,45,47,48,49,50].
The variables used in the study include: (1) total cloud cover, cloud forcing net solar flux and surface heat fluxes including surface net shortwave radiation, surface net longwave radiation, surface sensible heat net flux, and surface latent heat net flux, with a Gaussian grid of 92 × 192 (94 × 192) for monthly (daily) data; (2) specific humidity and horizontal winds at eight pressure levels (1000, 925, 850, 700, 600, 500, 400, and 300 hPa), vertical velocity at 850 hPa and 500 hPa, and surface pressure, with a resolution of 2.5° × 2.5°. The daily and monthly mean data for the above variables are used for analyzing the anomalies of surface heat fluxes and atmospheric circulation associated with EHEs, which are derived from the National Centers for Environmental Prediction/National Center for Atmospheric Research (NCEP/NCAR) reanalysis dataset [51].
The monthly mean SST data (2° × 2°) are the Extended Reconstructed SST version 5 (ERSST.v5) derived from the National Oceanic and Atmospheric Administration (NOAA) [52]. The monthly Pacific decadal oscillation (PDO) index is defined as the leading principal component of monthly SST anomalies in the North Pacific Ocean [53], which is available online at http://research.jisao.washington.edu/pdo/PDO.latest. The SST data and PDO index are used for analyzing the role played by the SST on the interdecadal time scale.
2.2. Description of the Numerical Model and Experiments
Version 5 of the Community Atmospheric Model (CAM5) [54] is used in the study to conduct two experiments with different SST boundary conditions. CAM5 has 30 hybrid sigma pressure levels in the vertical, with a resolution of 1.9° × 2.5° in the horizontal. One experiment is a control run, the SST boundary of which is the climatic monthly mean SST during 1981–2010. The other experiment is a sensitivity run, the SST boundary of which is specified in Section 4. The atmospheric composition of the two experiments is constant at the level of that in 2000. Each run is for 50 years, with the first 10 years used for model spin-up and the data of the last 40 years used for analysis.
2.3. Methods
In the study, southern China is defined as the region covering 22° N–30° N and 105° E–120° E. Summer in the study refers to June, July and August. The time series of observational and reanalysis data was detrended for 1961–2018 before any computation to remove linear trends. The vertically integrated water vapor transport is computed by vertically integrating water vapor flux between surface and 300 hPa pressure level, using the data for surface pressure, specific humidity and horizontal winds at eight pressure levels (1000, 925, 850, 700, 600, 500, 400, and 300 hPa) [19,55]. Atmospheric water vapor content is computed by vertically integrating water vapor between surface and 300 hPa pressure level, using data for surface pressure, and specific humidity at eight pressure levels (1000, 925, 850, 700, 600, 500, 400, and 300 hPa). Composite analysis is used to study the interdecadal variations of FEHE over southern China and associated atmospheric circulation anomalies.
2.4. Definition of Extreme High-Temperature Events
There are two popular ways to define EHEs: the use of absolute and relative thresholds [11,21,25,37,56]. The absolute threshold uses a certain number as the criterion to define EHEs. Specifically, in the China Meteorological Administration, 35 °C is used as the absolute threshold to determine whether a daily maximum temperature reaches an extreme high–temperature level [22,24,56]. In contrast, a value of the prescribed percentile in the frequency distribution is often used as a relative threshold to define EHEs, which will consider the different climate states of different regions and is suitable for a large target area [11,21]. The definition of FEHE using a relative threshold is more popular across the world and conducive to compare features of FEHE in different area. In the study, the 95% quantile of summer daily maximum temperature during 1961–2018 is used to define gridded FEHE. Specifically, for each grid point, the number of daily maximum temperatures exceeding 95% quantile in one summer is defined as the FEHE of this grid point during the certain summer. The gridded FEHE will better show the spatial characteristics of FEHE. To analyze the synoptic atmospheric circulation anomalies associated with EHEs, the regional FEHE is defined based on the daily maximum temperature averaged over southern China in summer. One regional EHE over southern China is defined as the daily maximum temperature averaged over southern China exceeding the 95% quantile of that in summer during 1961–2018. The regional FEHE over southern China in one summer is defined as the number of regional EHEs over southern China during the summer.
3. Results
3.1. The Characteristics of Interdecadal Variations in the Frequency of Extreme High–Temperature Events (FEHE) over Southern China
To show the characteristics of the interdecadal variations in the FEHE over southern China, the time–latitude cross–section of the 7-year running mean of FEHE anomalies in summer relative to the climatic summer mean for 1961–2018 averaged over 105° E–120° E is calculated and shown in Figure 1. Southern China underwent relatively less EHEs during 1970–2000 and relatively more EHEs before 1970 and after 2000. Furthermore, compared with the weak interdecadal variation in the FEHE over southern China at the end of the 1960s, the interdecadal variation in the FEHE over southern China in the early 2000s is stronger. It is noteworthy that the interdecadal variation in the FEHE in the early 2000s is dominant over southern China and is weak over the northern area. Thus, the study focuses on the recent interdecadal variation in the FEHE over southern China in the early 2000s. Previous studies show that the summer climate over eastern China underwent significant interdecadal variations in the early 1990s and in the early 2000s [22,23,38,41,43]. To better show the interdecadal variation of FEHE over southern China in the early 2000s and explore the associated mechanisms, 1991–2000 is referred to as inactive period (P1), and 2003–2018 is referred to as active period (P2), which is used in the following composite analysis.
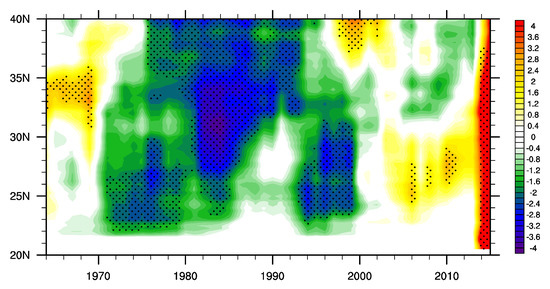
Figure 1.
The time–latitude cross–section of the 7–year running mean of frequency of extreme high–temperature events (FEHE) anomalies (unit: 1) during summer relative to the climatic summer mean for 1961–2018 averaged over 105° E–120° E. The dots denote where the anomalies exceed one standard deviation.
Figure 2a shows the differences of FEHE between the active period and inactive period. The consistent positive anomalies of FEHE over southern China are almost significant at 90% confidence level except for the anomalies over the south of Hunan province, which basically exceed 85% significant level (figure not shown). Therefore, it is reasonable to take southern China as a whole and the regional FEHE over southern China is defined in Section 2.4. During summer from 1961–2018, 267 regional EHEs over southern China occurred, which is about 4.6/year. During 1991–2000 (2003–2018), 29 (117) regional EHEs over southern China occurred, which is about 2.9/year (7.3/year) below (above) climatic mean, further suggesting increased FEHE over southern China after the early 2000s. Figure 2b shows the time series of the regional FEHE over southern China, characterized by abrupt increased FEHE after the early 2000s. The abrupt increase of FEHE indicates that the FEHE over southern China essentially underwent an interdecadal shift in the early 2000s rather than a trend change. Moreover, the global mean temperature shows a weak increase in the 2000s indicates that climate change seems to play a less important role in this interdecadal variation [57,58].
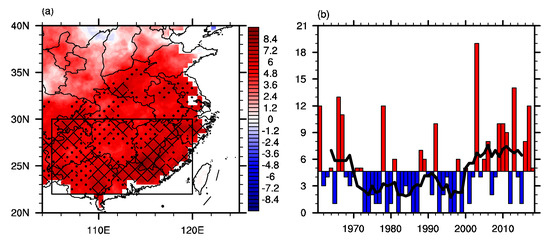
Figure 2.
(a) The differences of summer FEHE between P2 and P1 (P2 minus P1, unit: 1). (b) The time series of summer regional FEHE over southern China (bar) and of 7–year running mean in regional FEHE over southern China during summer (line) (unit: 1). Dots and meshes in (a) denote where the anomalies are significant at the 90% and 95% confidence levels based on Student’s t test, respectively. The black rectangle in (a) refers to the domain of southern China.
3.2. The Synoptic Surface Heat Fluxes and Atmospheric Circulation Anomalies Associated with the EHEs over Southern China
Before analyzing the mechanisms associated with the interdecadal variation of FEHE over southern China, the composite anomalies of synoptic surface heat fluxes and atmospheric circulation based on the 267 regional EHEs over southern China are shown in Figure 3 and Figure 4. The surface temperature is mainly influenced by surface heat fluxes which influence surface energy balance [21,59,60]. As shown in Figure 3a, there are positive anomalies of net surface heat fluxes over southern China, mainly located in the north of southern China, which are favorable for the occurrence of EHEs over southern China. Net surface heat fluxes (Figure 3a) are composed of surface net shortwave radiation (Figure 3b), surface net longwave radiation (Figure 3c), surface sensible heat net fluxes (Figure 3d), and surface latent heat net fluxes (Figure 3e). As shown in Figure 3a,b, there are significant positive anomalies of surface net shortwave radiation (SWR) over southern China, indicating more solar radiation reaching and heating the surface, which suggests that SWR contributes most to the positive anomalies of net surface heat fluxes and surface warming. Furthermore, surface sensible heat net fluxes (Figure 3d) over southern China play a less important role and the negative anomalies of surface latent heat net fluxes (Figure 3e) are not conducive to the positive anomalies of net surface heat fluxes (Figure 3a). According to Boltzmann’s law, there is more upward surface longwave radiation (Figure 3c) over southern China as a passive response to SWR heating the surface. The above results suggest that the occurrence of EHEs over southern China is mainly influenced by the anomalies of surface net shortwave radiation, which are associated with the anomalies of cloud forcing net solar flux (Figure 3b,f).
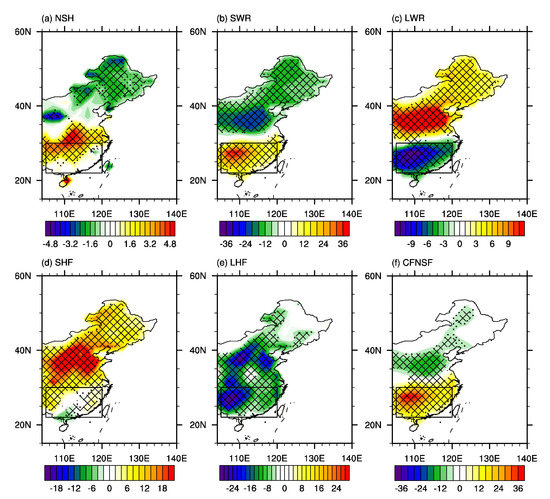
Figure 3.
The composite anomalies of summer mean (a) net surface heat flux (NSH), (b) surface net shortwave radiation (SWR), (c) surface net longwave radiation (LWR), (d) surface sensible heat net flux (SHF), (e) surface latent heat net flux (LHF), and (f) cloud forcing net solar flux (CFNSF) based on the 267 regional EHEs over southern China (unit: W m−2). The positive direction is defined as downward. Dots and meshes in (a–f) denote where the anomalies are significant at the 90% and 95% confidence levels based on Student’s t-test, respectively. The black rectangle in (a–f) refers to the domain of southern China.
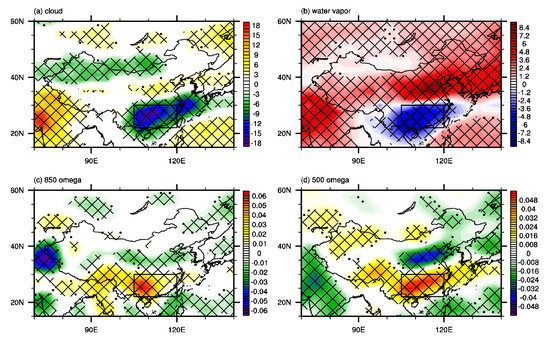
Figure 4.
The composite anomalies of summer mean (a) total cloud amount (unit: %), (b) atmospheric water vapor content (unit: kg m−2), (c) 850–hPa vertical velocity (unit: 10−3 Pa s−1), and (d) 500–hPa vertical velocity (unit: 10−3 Pa s−1) based on the 267 regional EHEs over southern China. Dots and meshes in (a–d) denote where the anomalies are significant at the 90% and 95% confidence levels based on Student’s t-test, respectively. The black rectangle in (a–d) refers to the domain of southern China.
The cloud forcing net solar flux is closely related to the cloud amount. Sufficient water vapor and ascent motion would contribute to increased clouds and decreased solar fluxes reaching the surface. As shown in Figure 4, the decreased water vapor (Figure 4b) and anomalous descent motion (Figure 4c,d) over southern China contribute to the reduced cloud (Figure 4a), which leads to increased solar fluxes reaching the surface and favors the occurrence of EHEs over southern China.
3.3. The Interdecadal Variations of Surface Heat Fluxes and Atmospheric Circulation
To show the climate shift in the surface heat fluxes and atmospheric circulation, the differences between the active period and the inactive period are calculated. As shown in Figure 5, the interdecadal variations of heat fluxes over southern China are consistent with the composite anomalies of synoptic heat fluxes based on the 267 regional EHEs over southern China (Figure 3), characterized by positive anomalies of net surface heat fluxes, surface net shortwave radiation and cloud forcing net solar fluxes over southern China. Therefore, the interdecadal variations of heat fluxes over southern China provided favorable climatic conditions for the increased FEHE over southern China after the early 2000s. It is noteworthy that the interdecadal variations of heat fluxes are weak over northern China (Figure 5), which is consistent with the interdecadal variation of FEHE in the early 2000s mainly occurring over southern China (Figure 1). The differences of surface heat fluxes between P2 and P1 based on the ERA5 dataset are consistent with those based on the NCEP/NCAR dataset (figure not shown), which further confirms the influence of surface heat fluxes on the interdecadal variation of FEHE over southern China in the early 2000s. Moreover, the interdecadal variations of atmospheric circulation (Figure 6) are consistent with the composite anomalies of synoptic circulation based on the 267 regional EHEs over southern China (Figure 4), characterized by reduced cloud, decreased atmospheric water vapor content, and anomalous descent motion over southern China, which are favorable for more solar radiation reaching surface and increased FEHE over southern China. The total cloud amount, atmospheric water vapor content and 500–hPa vertical motion averaged over southern China show consistent interdecadal variations with the regional FEHE over southern China in the early 2000s (Figure 6e,f), which indicates the close connection between the interdecadal variation of FEHE over southern China and that of atmospheric circulation. It is noteworthy that the differences of thermal advection between P2 and P1 show anomalous cold thermal advection over southern China (figure not shown), which indicates that the thermal advection is not conducive to the increased FEHE over southern China after the early 2000s.
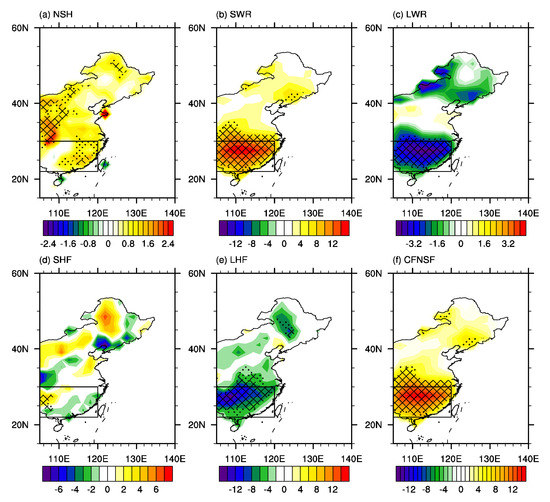
Figure 5.
The differences in the summer mean (a) net surface flux (NSH), (b) surface net shortwave radiation (SWR), (c) surface net longwave radiation (LWR), (d) surface sensible heat net flux (SHF), (e) surface latent heat net flux (LHF), and (f) cloud forcing net solar flux (CFNSF) between P2 and P1 (P2 minus P1, unit: W m−2). The positive direction is defined as downward. Dots and meshes in (a–f) denote where the anomalies are significant at the 90% and 95% confidence levels based on Student’s t-test, respectively. The black rectangle in (a–f) refers to the domain of southern China.
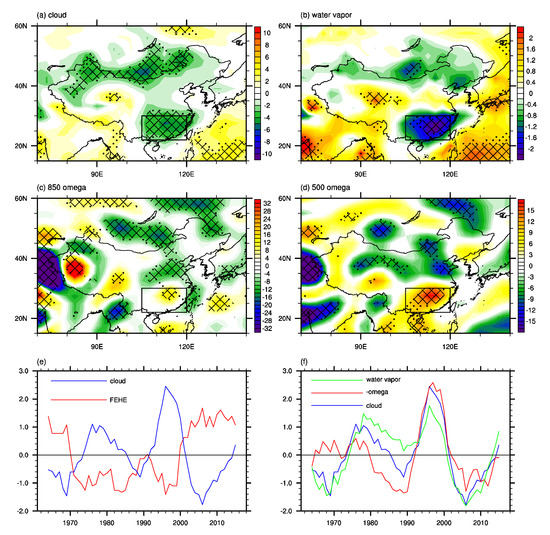
Figure 6.
The differences in the summer mean (a) total cloud amount (unit: %), (b) atmospheric water vapor content (unit: kg m−2), (c) 850–hPa vertical velocity (unit: 10−3 Pa s−1), and (d) 500–hPa vertical velocity (unit: 10−3 Pa s−1) between P2 and P1 (P2 minus P1). (e) The standardized time series of the 7–year running mean of the regional FEHE over southern China (red) and summer mean total cloud amount (blue) averaged over southern China. (f) The standardized time series of the 7–year running mean of the summer mean total cloud amount (blue), atmospheric water vapor content (green) and sign-reversed 500–hPa vertical velocity (red) averaged over southern China. Dots and meshes in (a–d) denote where the anomalies are significant at the 90% and 95% confidence levels based on Student’s t-test, respectively. The black rectangle in (a–d) refers to the domain of southern China.
The increased upward surface latent heat net fluxes over southern China (Figure 5e) indicate more water vapor evaporation. Hence, the decreased atmospheric water vapor content over southern China (Figure 6b) may not result from local water vapor evaporation and may result from water vapor transport. Thus, the differences of vertically integrated water vapor transport between P2 and P1 are shown in Figure 7a, which are characterized by an anomalous anticyclone of water vapor transport over southern China and an anomalous cyclone of water vapor transport to the south of southern China. More water vapor is transported northward along the western flank of the anticyclone and anomalous southward water vapor transport along the western flank of the cyclone suppresses water vapor transporting from the South China Sea to southern China (Figure 7a). Thus, water vapor transport will diverge over southern China (Figure 7b), which may lead to the decreased atmospheric water vapor content over southern China (Figure 6b).
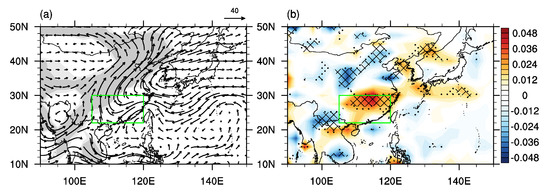
Figure 7.
The differences in the summer mean (a) vertically integrated water vapor transport (vector, unit: kg m−1 s−1) and (b) divergence of the water vapor transport (unit: 10−3 kg m−2 s−1) between P2 and P1 (P2 minus P1). Light (dark) shadings in (a) and dots (meshes) in (b) denote where the anomalies are significant at the 90% (95%) confidence level based on Student’s t-test. The green rectangle in (a,b) refers to the domain of southern China.
The anomalous water vapor transport over southern China is closely associated with the large–scale water vapor transport anomalies over the northern Pacific [19,38,48]. As shown in Figure 8a, there is an anomalous large-scale anticyclone of water vapor transport over the northwestern Pacific and an anomalous large-scale cyclone of water vapor transport over the subtropical western Pacific. Moreover, there are significant anomalies of westward water vapor transport over the tropical Pacific, leading to anomalous convergence of water vapor over the tropical western Pacific (Figure 8a). Due to water vapor being mainly concentrated in the low-level troposphere, water vapor transport is mainly influenced by low- to mid-level winds. Figure 8b shows the differences of 850–hPa winds between P2 and P1, which show similar pattern to those of vertically integrated water vapor transport, characterized by an anomalous anticyclone over the northwestern Pacific, an anomalous cyclone over the subtropical western Pacific, and anomalous easterlies over the tropical Pacific. The differences of 500 hPa winds between P2 and P1 (Figure 8c) show similarity to those of 850–hPa winds (Figure 8b), with a stronger anomalous anticyclone over the northwestern Pacific. The meridional structure of the cyclone and anticyclone over the western Pacific (Figure 8b,c) may be a Rossby wave response to the anomalous convective heating over the tropical western Pacific [61]. As shown in Figure 9a, winds converge over the tropical western Pacific and diverge over the tropical eastern Pacific at 850 hPa. By contrast, winds diverge over the tropical western Pacific and converge over the tropical eastern Pacific at 200 hPa (Figure 9b). According to the principle of mass compensation, there will be anomalous ascent motion in the troposphere over the tropical western Pacific and anomalous descent motion in the troposphere over the tropical eastern Pacific, which is consistent with anomalies of 500 hPa vertical velocity (Figure 9c), indicating that the Walker circulation was strengthened after the early 2000s. The strengthened convective heating over the tropical western Pacific, with anomalous water vapor convergence and ascent motion in the overlying troposphere (Figure 8a and Figure 9c), will excite a Rossby wave characterized by an anomalous cyclone to the northwest of the convective heating and an anomalous anticyclone over the northwestern Pacific due to the Rossby wave propagation (Figure 8b,c) [61]. Furthermore, the strengthened ascent motion over the tropical western Pacific diverges at 200 hPa and converges over southern China (Figure 9b), leading to anomalous descent motion (Figure 9c) and divergent winds at 850 hPa (Figure 9a) over southern China.
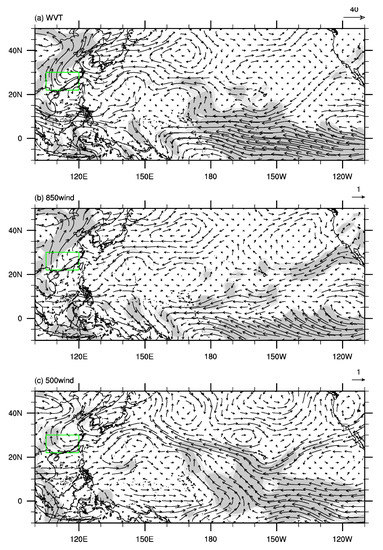
Figure 8.
The differences in the summer mean (a) vertically integrated water vapor transport (vector, unit: kg m−1 s−1), (b) 850–hPa wind (vector, m s−1) and (c) 500–hPa wind (vector, m s−1) between P2 and P1 (P2 minus P1). Light (dark) shadings denote where the anomalies are significant at the 90% (95%) confidence level based on Student’s t-test. The green rectangle in (a–c) refers to the domain of southern China.
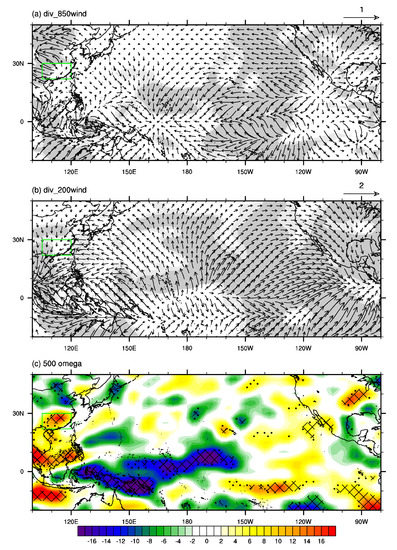
Figure 9.
The differences in the summer mean (a) divergent components of 850 hPa wind (vector, unit: m s−1), (b) divergent components of 200 hPa wind (vector, unit: m s−1), and (c) 500 hPa vertical velocity (unit: 10−3 Pa s−1) between P2 and P1 (P2 minus P1). Light (dark) shadings in (a,b) and dots (meshes) in (c) denote where the anomalies are significant at the 90% (95%) confidence level based on Student’s t-test. The green rectangle in (a–c) refers to the domain of southern China.
The above results suggest that the Walker circulation over the tropical Pacific was strengthened after the early 2000s, characterized by anomalous ascent (descent) motion over the tropical western (eastern) Pacific and anomalous easterlies over the tropical Pacific. With anomalous ascent motion and water vapor convergence, the convective heating over the tropical western Pacific was strengthened. As a Rossby wave response to the anomalous convective heating over the tropical western Pacific, there was an anomalous cyclone over the tropical–subtropical western Pacific, and an anomalous anticyclone over the northwestern Pacific due to the propagation of the Rossby wave, which leads to anomalous divergence of water vapor and descent motion over southern China.
3.4. The Role Played by the Pacific Decadal Oscillation
The Walker circulation has a close connection with the tropical Pacific SST [62,63,64]. Sun et al. [48] noted that the PDO modulates the large-scale east–west atmospheric circulation during summer over the tropical Pacific. To further explore the potential influence of the Pacific SST, the differences of SST between P2 and P1 are calculated. Figure 10a shows the differences of summer SST between P2 and P1, characterized by negative anomalies over the tropical eastern Pacific, and positive anomalies over the tropical western Pacific and northern Pacific, which resemble the negative phase of the PDO (Figure 10c). The differences of SST in other seasons (figure not shown) and annual mean SST (Figure 10b) over the Pacific between P2 and P1 are similar to those of summer SST (Figure 10a) and the negative phase of PDO (Figure 10d). Moreover, the time series of the 7-year running summer mean of the PDO index shows a consistent interdecadal variation in the early 2000s, with a transition from positive anomalies to negative anomalies (Figure 10e), which indicates that the PDO phase shifted from a positive phase to a negative phase. The standardized time series of the 7-year running mean of the summer mean PDO index and FEHE over southern China have a correlation coefficient of –0.65, significant at the 99% confidence level (Figure 10e). According to the above results, the shift in the PDO phase may contribute to the interdecadal variation in the FEHE over southern China and atmospheric circulation in the early 2000s. In the negative phase of the PDO, the negative anomalies of SST over the tropical eastern Pacific (Figure 10a,c) will suppress the convection in the overlying troposphere (Figure 9c), and the positive anomalies over the SST over the tropical western Pacific (Figure 10a,c) will strengthen the convection in the overlying troposphere (Figure 9c). Thus, the Walker circulation over the tropical Pacific is strengthened. The anomalous convection over the tropical western Pacific (Figure 9c) will lead to an anomalous cyclone (anticyclone) over the subtropical western Pacific (the northwestern Pacific) (Figure 8b,c) by exciting a Rossby wave [61], leading to anomalous descent motion (Figure 9c) and divergence of water vapor over southern China (Figure 7a,b).
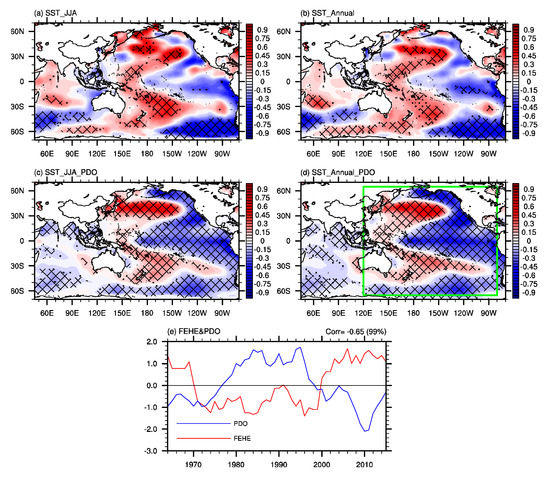
Figure 10.
The differences in (a) the summer mean sea surface temperature (SST, unit: °C) and (b) annual mean SST (unit: °C) between P2 and P1 (P2 minus P1). (c) The anomalies of the summer mean SST (unit: °C) regressed on the time series of the summer mean sign–reversed Pacific decadal oscillation (PDO) index. (d) The anomalies of the annual mean SST (unit: °C) regressed on the time series of the annual mean sign–reversed PDO index. (e) The standardized time series of the 7–year running mean of the summer mean PDO index (blue) and regional FEHE over southern China (red). Dots and meshes in (a–d) denote where the anomalies are significant at the 90% and 95% confidence levels based on Student’s t test, respectively. The green rectangle in (d) refers to the area, the SST anomalies in which are used in the CAM5 (Version 5 of the Community Atmospheric Model) sensitivity experiment.
To further examine the role of the PDO phase shift in the recent decadal variation in the FEHE over southern China and atmospheric circulation over the North Pacific, we conducted two numerical experiments with different SST boundary conditions, using the CAM5 model. One numerical experiment is a control experiment, the SST boundary in which is the climatic monthly mean SST. The other experiment is a sensitivity experiment, the SST boundary in which is the doubled anomalous SSTs associated with the negative phase of the PDO (65° S–65° N, 120° E–80° W) (Figure 10d: green rectangle) added to the climatic monthly SST for all months. The differences of climate variables in summer between the sensitivity experiment and the control experiment are shown in Figure 11. Figure 11a,b show the differences of 850 hPa and 500 hPa winds between the sensitivity experiment and the control experiment, characterized by an anomalous cyclone over the subtropical western Pacific and an anomalous anticyclone over the northwestern Pacific. Although the location and magnitude of the anomalous cyclone and anticyclone in the model results do not fit well with those in the reanalysis results, the structure of an anomalous cyclone and an anomalous anticyclone over the western Pacific is captured by the model, which is similar to that in the reanalysis results (Figure 8b,c). Furthermore, the differences of vertical velocity at 500 hPa between the sensitivity experiment and the control experiment show anomalous descent motion over the tropical eastern Pacific and anomalous ascent motion over the tropical western Pacific (Figure 11c), indicating the strengthened Walker circulation, which are consistent with the reanalysis results (Figure 9c). The differences of the divergent winds at 850 hPa and 200 hPa between the sensitive experiment and the control experiment (figure not shown) are also consistent with the reanalysis results (Figure 9a,b), which are characterized by convergent (divergent) winds at 850 hPa over the tropical western (eastern) Pacific and the opposite condition at 200 hPa, and further suggest that the Walker circulation is strengthened. The anomalous descent motion over southern China is also captured by the model (Figure 9c and Figure 11c), which favors the warmer state over southern China (Figure 11d).
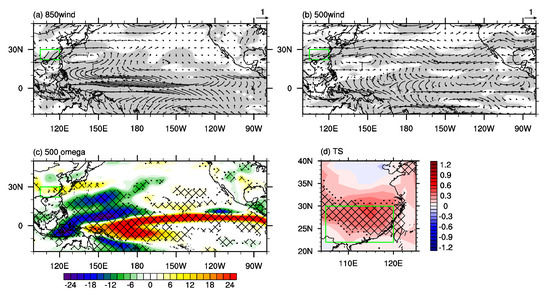
Figure 11.
The differences in the summer mean (a) 850 hPa wind (m s−1), (b) 500 hPa wind (m s−1), (c) 500 hPa vertical velocity (10−3 Pa s−1), and (d) surface temperature (°C) between the sensitivity experiment and the control experiment of the CAM5 model (sensitivity minus control). Light (dark) shadings in (a,b) and dots (meshes) in (c,d) denote where the anomalies are significant at the 90% (95%) confidence level based on Student’s t-test. The green rectangle in (a–d) refers to the domain of southern China.
The above results further indicate that the PDO phase shift in the early 2000s plays an important role in the recent interdecadal variation in the FEHE over southern China and atmospheric circulation over the North Pacific. Under the modulation of the negative PDO phase, there are positive (negative) anomalies of SST over the tropical western (eastern) Pacific, inducing anomalous ascent (descent) motion in the overlying troposphere. Hence, the Walker circulation over the tropical Pacific is strengthened. Furthermore, the anomalous convection over the tropical western Pacific further leads to an anomalous cyclone over the subtropical western Pacific and an anomalous anticyclone over the northwestern Pacific by exciting a Rossby wave, which results in the anomalous divergence of water vapor and descent motion over southern China.
4. Discussion
Some studies have noted there is a connection between summer SST over the tropical Indian Ocean and cyclone (anticyclone) over the tropical–subtropical western Pacific; additionally, the warming SST in the tropical Indian Ocean can induce anomalous easterlies in the low–mid troposphere over the tropical eastern Indian Ocean and tropical western Pacific that are accompanied by an anomalous anticyclone over the tropical–subtropical western Pacific via emanating a Kelvin wave [33,34,65,66]. In the study, there was anomalous SST warming over the tropical Indian Ocean after the early 2000s (Figure 10a,b). However, there were anomalous westerlies over the tropical western Pacific, with an anomalous cyclone over the subtropical western Pacific (Figure 8b,c), rather than anomalous easterlies over the tropical western Pacific, with an anomalous anticyclone over the subtropical western Pacific, which means that the warming SST in the tropical Indian Ocean plays a less important role in the recent interdecadal variation of the atmospheric circulation over the tropical–subtropical Pacific and may be related to the warming SST mainly occurring in the southwest of the tropical Indian Ocean (Figure 10a,b) [66,67].
As shown in Figure 10e, the PDO underwent an interdecadal variation in the end of 1970s, while the FEHE over southern China did not. The above inconsistence with the interdecadal variation in the early 2000s may be related to that the interdecadal variation of atmospheric circulation in the end of 1970s is quite different from that in the early 2000s (figure not shown). Previous studies showed the interdecadal variation of atmospheric circulation in the end of 1970s was influenced by several factors such as the Indian Ocean–western Pacific (IWP) warming and Tibetan snow cover [68,69,70], which may be responsible for the difference between the interdecadal variation of atmospheric circulation in the end of 1970s and that in the early 2000s. The study focuses on the interdecadal variation of FEHE over southern China and the role of the PDO in this interdecadal variation. It is worth noting that the PDO is a significant low–frequency oscillation in the Pacific basin, which has important influence on the global climate [71,72,73]. For example, Hartmann and Wendler [74], and Bieniek and Walsh [75] pointed that the low–frequency variability of temperature extremes in Alaska is attributed to the PDO, and that in the positive phase of PDO, there were positive anomalies of sea level pressure over Alaska, which are favorable for the occurrence of extreme–high temperature events.
In this study, the analysis for anomalous atmospheric circulation associated with EHEs over southern China is based on one reanalysis dataset (NCEP/NCAR), which is the limitation of the study. It is meaningful to compare the results of different datasets to ensure the robustness of results, which will be conducted in the future study.
5. Conclusions
The FEHE in southern China underwent an interdecadal variation in the early 2000s, characterized by a relatively small FEHE during 1991–2000 and a relatively large FEHE during 2003–2018. At the synoptic time scale, the occurrence of extreme high–temperature events (EHEs) over southern China is mainly influenced by increased downward surface net shortwave radiation, which is induced by the cloud–forced radiation anomalies associated with reduced cloud. The reduced cloud is attributed to anomalous descent motion and decreased water vapor content in the troposphere over southern China.
Compared to the situation during 1991–2000, anomalous atmospheric descent motion and decreased atmospheric water vapor content occurred over southern China in summer during 2003–2018, providing a more favorable climatic condition for EHEs. This interdecadal variation of atmospheric circulation over southern China was connected with the large-scale atmospheric circulation anomalies over the North Pacific. After 2003, the Walker circulation over the tropical Pacific was strengthened. The strengthened convection over the tropical western Pacific led to an anomalous cyclone over the subtropical Pacific and an anomalous anticyclone over the northwestern Pacific by exciting a Rossby wave, which led to the anomalous divergence of water vapor over southern China. Furthermore, the anomalous ascent motion over the tropical western Pacific induced anomalous divergent winds in the upper troposphere over the tropical western Pacific, which converged over southern China, and induced anomalous convergent winds in the upper troposphere over southern China and descent motion. The statistical results and numerical simulations suggest that the Pacific decadal oscillation is an important driver for the above interdecadal variation, which shifted from a positive phase towards a negative phase after 2003. Under the modulation of the negative phase of PDO, there were positive anomalies of SST over the tropical western Pacific and negative anomalies of SST over the tropical eastern Pacific, inducing the strengthened Walker circulation over the tropical Pacific and anomalous atmospheric descent motion as well as water vapor divergence over Southern China.
Author Contributions
Conceptualization, B.Z., B.S. and H.W.; Investigation, B.Z.; software, B.Z. and H.L.; Visualization, B.Z.; writing—initial draft, B.Z.; writing—review and editing, B.Z. and B.S. All authors have read and agreed to the published version of the manuscript.
Funding
This study is funded by the Natural Science Foundation of China (Grant No. 41991283 and 41805047),
the National Key Research and Development Plan (Grant No. 2016YFA0600703), the Natural Science Foundation of
Jiangsu Province of China (Grant No. BK20180807), the Jiangsu Innovation and Entrepreneurship Team, the Priority
Academic Program Development of Jiangsu Higher Education Institutions (PAPD), and the Postgraduate Research
and Practice Innovation Program of Jiangsu Province (Grant No. KYCX20_0914).
Conflicts of Interest
The authors declare no conflict of interest.
References
- Beniston, M. The 2003 heat wave in Europe: A shape of things to come? An analysis based on Swiss climatological data and model simulations. Geophys. Res. Lett. 2004, 31, 114–143. [Google Scholar] [CrossRef]
- Greene, S.; Kalkstein, L.S.; Mills, D.M.; Samenow, J. An examination of climate change on extreme heat events and climate–mortality relationships in large US cities. Weather Clim. Soc. 2011, 3, 281–292. [Google Scholar] [CrossRef]
- Sun, Y.; Zhang, X.B.; Zwiers, F.W.; Song, L.C.; Wan, H.; Hu, T.; Yin, H.; Ren, G. Rapid increase in the risk of extreme summer heat in Eastern China. Nat. Clim. Chang. 2014, 4, 1082–1085. [Google Scholar] [CrossRef]
- Wong, T.S.T. Statistical analysis of heat waves in the state of Victoria in Australia. Aust. N. Z. J. Stat. 2015, 57, 463–480. [Google Scholar] [CrossRef]
- Shi, N.; Wang, Y.C.; Wang, X.Q.; Tian, P.Y. Interdecadal variations in the frequency of persistent hot events in boreal summer over midlatitude Eurasia. J. Clim. 2019, 32, 5161–5177. [Google Scholar] [CrossRef]
- Barriopedro, D.; Fischer, E.M.; Luterbacher, J.; Trigo, R.M.; García–Herrera, R. The hot summer of 2010: Redrawing the temperature record map of Europe. Science 2011, 332, 220–224. [Google Scholar] [CrossRef]
- Wei, K.; Chen, W. An abrupt increase in the summer high temperature extreme days across China in the mid–1990 s. Adv. Atmos. Sci. 2011, 28, 1023–1029. [Google Scholar] [CrossRef]
- Peng, J.B. An investigation of the formation of the heat wave in southern China in summer 2013 and the relevant abnormal subtropical high activities. Atmos. Ocean. Sci. Lett. 2014, 7, 286–290. [Google Scholar]
- Nitschke, M.; Tucker, G.R.; Hansen, A.L.; Williams, S.; Zhang, Y.; Bi, P. Impact of two recent extreme heat episodes on morbidity and mortality in Adelaide, South Australia: A case–series analysis. Environ. Health 2011, 10, 42. [Google Scholar] [CrossRef]
- Wei, K.; Chen, W. Climatology and trends of high temperature extremes across China in summer. Atmos. Ocean. Sci. Lett. 2009, 2, 153–158. [Google Scholar]
- Gong, D.Y.; Pan, Y.Z.; Wang, J.A. Changes in extreme daily mean temperatures in summer in eastern China during 1955–2000. Theor. Appl. Climatol. 2004, 77, 25–37. [Google Scholar]
- Zhou, Y.Q.; Ren, G.Y. Change in extreme temperature event frequency over mainland China, 1961–2008. Clim. Res. 2011, 50, 125–139. [Google Scholar] [CrossRef]
- Zhang, L.; Ren, G.Y.; Liu, J.; Zhou, Y.Q.; Feng, Y.W. Urban effect on trends of extreme temperature indices at Beijing meteorological station. Chin. J. Geophys. 2011, 54, 1150–1159. (In Chinese) [Google Scholar]
- Chen, H.P.; Sun, J.Q. Projected changes in climate extremes in China in a 1.5 °C warmer world. Int. J. Climatol. 2018, 38, 3607–3617. [Google Scholar] [CrossRef]
- Wang, H.J.; Sun, J.Q.; Chen, H.P.; Zhu, Y.L.; Zhang, Y.; Jiang, D.B.; Lang, X.M.; Fan, K.; Yu, E.T.; Yang, S. Extreme climate in China: Facts, simulation and projection. Meteorol. Z. 2012, 21, 279–304. [Google Scholar] [CrossRef]
- Zhang, Y.; Xu, Y.L.; Dong, W.J.; Cao, L.J.; Sparrow, M. A future climate scenario of regional changes in extreme climate events over China using the PRECIS climate model. Geophys. Res. Lett. 2006, 33, L24702. [Google Scholar] [CrossRef]
- Wang, H.J. The weakening of the Asian monsoon circulation after the end of 1970s. Adv. Atmos. Sci. 2001, 18, 376–386. [Google Scholar]
- Hu, Z.Z. Interdecadal variability of summer climate over East Asia and its association with 500 hPa height and global sea surface temperature. J. Geophys. Res. Atmos. 1997, 102, 19403–19412. [Google Scholar] [CrossRef]
- Sun, B.; Zhu, Y.L.; Wang, H.J. The recent interdecadal and interannual variation of water vapor transport over eastern China. Adv. Atmos. Sci. 2011, 28, 1039–1048. [Google Scholar] [CrossRef]
- Xu, X.P.; Li, F.; He, S.P.; Wang, H.J. Subseasonal reversal of East Asian surface temperature variability in winter 2014/15. Adv. Atmos. Sci. 2018, 35, 737–752. [Google Scholar] [CrossRef]
- Zhu, B.Y.; Sun, B.; Wang, H.J. Dominant modes of interannual variability of extreme high-temperature events in eastern China during summer and associated mechanisms. Int. J. Climatol. 2020, 40, 841–857. [Google Scholar] [CrossRef]
- Li, R.X.; Sun, J.Q. Interdecadal variability of the large–scale extreme hot event frequency over the middle and lower reaches of the Yangtze River basin and its related atmospheric patterns. Atmos. Ocean. Sci. Lett. 2018, 11, 63–70. [Google Scholar] [CrossRef]
- Wu, Z.W.; Jiang, Z.H.; Li, J.P.; Zhong, S.S.; Wang, L.J. Possible association of the western Tibetan Plateau snow cover with the decadal to interdecadal variations of northern China heatwave frequency. Clim. Dyn. 2012, 39, 2393–2402. [Google Scholar] [CrossRef]
- Ding, T.; Qian, W.H.; Yan, Z.W. Changes in hot days and heat waves in China during 1961–2007. Int. J. Climatol. 2010, 30, 1452–1462. [Google Scholar] [CrossRef]
- You, Q.L.; Kang, S.C.; Aguilar, E.; Pepin, N.; Flügel, W.A.; Yan, Y.P.; Xu, Y.W.; Zhang, Y.J.; Huang, J. Changes in daily climate extremes in China and their connection to the large scale atmospheric circulation during 1961–2003. Clim. Dyn. 2011, 36, 2399–2417. [Google Scholar] [CrossRef]
- Chen, R.D.; Lu, R.Y. Comparisons of the circulation anomalies associated with extreme heat in different regions of eastern China. J. Clim. 2015, 28, 5830–5844. [Google Scholar] [CrossRef]
- Chen, W.; Lu, R.Y. A decadal shift of summer surface air temperature over Northeast Asia around the mid–1990s. Adv. Atmos. Sci. 2014, 31, 735–742. [Google Scholar] [CrossRef]
- Chen, W.; Hong, X.W.; Lu, R.Y.; Jin, A.F.; Jin, S.Z.; Nam, J.C.; Shin, J.H.; Goo, T.Y.; Kim, B.J. Variation in summer surface air temperature over northeast Asia and its associated circulation anomalies. Adv. Atmos. Sci. 2016, 33, 1–9. [Google Scholar] [CrossRef]
- Sun, J.Q.; Wang, H.J.; Yuan, W. Decadal variability of the extreme hot event in China and its association with atmospheric circulations. Clim. Environ. Res. 2011, 16, 199–208. (In Chinese) [Google Scholar]
- Chen, R.D.; Wen, Z.P.; Lu, R.Y. Interdecadal change on the relationship between the mid–summer temperature in South China and atmospheric circulation and sea surface temperature. Clim. Dyn. 2018, 51, 2113–2126. [Google Scholar] [CrossRef]
- Wang, W.W.; Zhou, W.; Li, X.Z.; Wang, X.; Wang, D.X. Synoptic–scale characteristics and atmospheric controls of summer heat waves in China. Clim. Dyn. 2016, 46, 2923–2941. [Google Scholar] [CrossRef]
- Chen, R.D.; Wen, Z.P.; Lu, R.Y. Evolution of the circulation anomalies and the quasi–biweekly oscillations associated with extreme heat events in southern China. J. Clim. 2016, 29, 6909–6921. [Google Scholar] [CrossRef]
- Hu, K.M.; Huang, G.; Huang, R.H. The impact of tropical Indian Ocean variability on summer surface air temperature in China. J. Clim. 2011, 24, 5365–5377. [Google Scholar] [CrossRef]
- Hu, K.M.; Huang, G.; Qu, X.; Huang, R.H. The impact of Indian Ocean variability on high temperature extremes across the southern Yangtze River Valley in late summer. Adv. Atmos. Sci. 2012, 29, 91–101. [Google Scholar] [CrossRef]
- Li, H.X.; Chen, H.P.; Wang, H.J.; Sun, J.Q.; Ma, J.H. Can Barents Sea ice decline in spring enhance summer hot drought events over northeastern China? J. Clim. 2018, 31, 4705–4725. [Google Scholar] [CrossRef]
- Wang, W.W.; Zhou, W.; Chen, D.L. Summer high temperature extremes in Southeast China: Bonding with the El Niño–Southern Oscillation and East Asian summer monsoon coupled system. J. Clim. 2014, 27, 4122–4138. [Google Scholar] [CrossRef]
- You, Q.L.; Jiang, Z.H.; Kong, L.; Wu, Z.W.; Bao, Y.T.; Kang, S.C.; Pepin, N. A comparison of heat wave climatologies and trends in China based on multiple definitions. Clim. Dyn. 2017, 48, 3975–3989. [Google Scholar] [CrossRef]
- Wu, R.G.; Wen, Z.P.; Yang, S.; Li, Y.Q. An interdecadal change in southern China summer rainfall around 1992/93. J. Clim. 2010, 23, 2389–2403. [Google Scholar] [CrossRef]
- Zhu, Y.L.; Wang, H.J.; Ma, J.H.; Wang, T.; Sun, J.Q. Contribution of the phase transition of Pacific decadal oscillation to the late 1990 s’ shift in East China summer rainfall. J. Geophys. Res. Atmos. 2015, 120, 8817–8827. [Google Scholar] [CrossRef]
- Zhu, Y.L.; Wang, H.J.; Zhou, W.; Ma, J.H. Recent changes in the summer precipitation pattern in East China and the background circulation. Clim. Dyn. 2011, 36, 1463–1473. [Google Scholar] [CrossRef]
- Ha, Y.; Zhong, Z.; Chen, H.S.; Hu, Y.J. Out–of–phase decadal changes in boreal summer rainfall between Yellow–Huaihe River Valley and southern China around 2002/2003. Clim. Dyn. 2016, 47, 137–158. [Google Scholar] [CrossRef]
- Ding, Y.H.; Sun, Y.; Wang, Z.Y.; Zhu, Y.X.; Song, Y.F. Inter-decadal variation of the summer precipitation in China and its association with decreasing Asian summer monsoon Part II: Possible causes. Int. J. Climatol. 2009, 29, 1926–1944. [Google Scholar] [CrossRef]
- Xu, Z.Q.; Fan, K.; Wang, H.J. Decadal variation of summer precipitation over China and associated atmospheric circulation after the late 1990s. J. Clim. 2015, 28, 4086–4106. [Google Scholar] [CrossRef]
- Chen, H.P.; Sun, J.Q.; Fan, K. Decadal features of heavy rainfall events in eastern China. Acta Meteorol. Sin. 2012, 26, 289–303. [Google Scholar] [CrossRef]
- Wu, J.; Gao, X.J. A gridded daily observation dataset over China region and comparison with the other datasets. Chin. J. Geophys. 2013, 56, 1102–1111. (In Chinese) [Google Scholar]
- Xu, Y.; Gao, X.J.; Yan, S.; Xu, C.H.; Ying, S.; Giorgi, F. A daily temperature dataset over China and its application in validating a RCM simulation. Adv. Atmos. Sci. 2009, 26, 763–772. [Google Scholar] [CrossRef]
- Wu, J.; Gao, X.J.; Giorgi, F.; Chen, D.L. Changes of effective temperature and cold/hot days in late decades over China based on a high resolution gridded observation dataset. Int. J. Climatol. 2017, 37, 788–800. [Google Scholar] [CrossRef]
- Sun, B.; Wang, H.J.; Zhou, B.T.; Li, H. Interdecadal variation in the synoptic features of Mei–Yu in the Yangtze River Valley region and relationship with the Pacific decadal oscillation. J. Clim. 2019, 32, 6251–6270. [Google Scholar] [CrossRef]
- Chen, H.P.; Sun, J.Q.; Li, H.X. Future changes in precipitation extremes over China using the NEX–GDDP high–resolution daily downscaled data-set. Atmos. Ocean. Sci. Lett. 2017, 10, 1–8. [Google Scholar] [CrossRef]
- Li, S.F.; Jiang, D.B.; Lian, Y.; Yao, Y.X. Trends in day–to–day variability of surface air temperature in China during 1961–2012. Atmos. Ocean. Sci. Lett. 2017, 10, 122–129. [Google Scholar] [CrossRef]
- Rayner, N.; Parker, D.E.; Horton, E.; Folland, C.K.; Alexander, L.V.; Rowell, D.; Kent, E.; Kaplan, A. Global analyses of sea surface temperature, sea ice, and night marine air temperature since the late nineteenth century. J. Geophys. Res. Atmos. 2003, 108, 4407. [Google Scholar] [CrossRef]
- Huang, B.Y.; Thorne, P.W.; Banzon, V.F.; Boyer, T.; Chepurin, G.; Lawrimore, J.H.; Menne, M.J.; Smith, T.M.; Vose, R.S.; Zhang, H.M. Extended Reconstructed Sea Surface Temperature, Version 5 (ERSSTv5): Upgrades, Validations, and Intercomparisons. J. Clim. 2017, 30, 8179–8205. [Google Scholar] [CrossRef]
- Zhang, Y.; Wallace, J.M.; Battisti, D.S. ENSO–like interdecadal variability: 1900–93. J. Clim. 1997, 10, 1004–1020. [Google Scholar] [CrossRef]
- Neale, R.B.; Chen, C.C.; Gettelman, A.; Lauritzen, P.H.; Park, S.; Williamson, D.L.; Conley, A.J.; Garcia, R.; Kinnison, D.; Lamarque, J.F. Description of the NCAR Community Atmosphere Model (CAM 5.0). NCAR Tech. Note NCAR/TN–486+ STR 2010, 1, 1–12. [Google Scholar]
- Simmonds, I.; Bi, D.; Hope, P. Atmospheric water vapor flux and its association with rainfall over China in summer. J. Clim. 1999, 12, 1353–1367. [Google Scholar] [CrossRef]
- Li, Q.X.; Huang, J.Y. Threshold values on extreme high temperature events in China. J. Appl. Meteorol. Sci. 2011, 22, 138–144. (In Chinese) [Google Scholar]
- Fyfe, J.C.; Gillett, N.P.; Zwiers, F.W. Overestimated global warming over the past 20 years. Nat. Clim. Chang. 2013, 3, 767–769. [Google Scholar] [CrossRef]
- Trenberth, K.E.; Fasullo, J.T. An apparent hiatus in global warming? Earths Future 2013, 1, 19–32. [Google Scholar] [CrossRef]
- Chen, S.F.; Wu, R.G.; Liu, Y. Dominant modes of interannual variability in Eurasian surface air temperature during boreal spring. J. Clim. 2016, 29, 1109–1125. [Google Scholar] [CrossRef]
- Sun, B. Seasonal evolution of the dominant modes of the Eurasian snowpack and atmospheric circulation from autumn to the subsequent spring and the associated surface heat budget. Atmos. Ocean. Sci. Lett. 2017, 10, 191–197. [Google Scholar] [CrossRef]
- Gill, A.E. Some simple solutions for heat-induced tropical circulation. Q. J. R. Meteorol. Soc. 1980, 106, 447–462. [Google Scholar] [CrossRef]
- Tokinaga, H.; Xie, S.; Deser, C.; Kosaka, Y.; Okumura, Y.M. Slowdown of the Walker circulation driven by tropical Indo–Pacific warming. Nature 2012, 491, 439–443. [Google Scholar] [CrossRef] [PubMed]
- Meng, Q.J.; Latif, M.J.; Park, W.S.; Keenlyside, N.S.; Semenov, V.A.; Martin, T. Twentieth century Walker circulation change: Data analysis and model experiments. Clim. Dyn. 2012, 38, 1757–1773. [Google Scholar] [CrossRef]
- Bjerknes, J. Atmospheric teleconnections from the equatorial Pacific. Mon. Weather Rev. 1969, 97, 163–172. [Google Scholar] [CrossRef]
- Qu, X.; Huang, G. Impacts of tropical Indian Ocean SST on the meridional displacement of East Asian jet in boreal summer. Int. J. Climatol. 2012, 32, 2073–2080. [Google Scholar] [CrossRef]
- Sun, B.; Li, H.X.; Zhou, B.T. Interdecadal variation of Indian Ocean basin mode and the impact on Asian summer climate. Geophys. Res. Lett. 2019, 46, 12388–12397. [Google Scholar] [CrossRef]
- Hu, K.M.; Huang, G.; Wu, R.G. A strengthened influence of ENSO on August high temperature extremes over the southern Yangtze River valley since the late 1980s. J. Clim. 2013, 26, 2205–2221. [Google Scholar] [CrossRef]
- Zhou, T.J.; Yu, R.C.; Zhang, J.; Drange, H.; Cassou, C.; Deser, C.; Hodson, D.L.; Sanchez–Gomez, E.; Li, J.; Keenlyside, N. Why the western Pacific subtropical high has extended westward since the late 1970s. J. Clim. 2009, 22, 2199–2215. [Google Scholar] [CrossRef]
- Chen, L.T.; Wu, R.G. Interannual and decadal variations of snow cover over Qinghai–Xizang Plateau and their relationships to summer monsoon rainfall in China. Adv. Atmos. Sci. 2000, 17, 18–30. [Google Scholar]
- Gong, D.Y.; Ho, C.H. Shift in the summer rainfall over the Yangtze River valley in the late 1970s. Geophys. Res. Lett. 2002, 29, 1436. [Google Scholar] [CrossRef]
- Dong, B.; Dai, A. The influence of the interdecadal Pacific oscillation on temperature and precipitation over the globe. Clim. Dyn. 2015, 45, 2667–2681. [Google Scholar] [CrossRef]
- Loikith, P.C.; Detzer, J.; Mechoso, C.R.; Lee, H.; Barkhordarian, A. The influence of recurrent modes of climate variability on the occurrence of monthly temperature extremes over South America. J. Geophys. Res. Atmos. 2017, 122, 10297–10311. [Google Scholar] [CrossRef]
- Krishnan, R.; Sugi, M. Pacific decadal oscillation and variability of the Indian summer monsoon rainfall. Clim. Dyn. 2003, 21, 233–242. [Google Scholar] [CrossRef]
- Hartmann, B.; Wendler, G. The significance of the 1976 Pacific climate shift in the climatology of Alaska. J. Clim. 2005, 18, 4824–4839. [Google Scholar] [CrossRef]
- Bieniek, P.A.; Walsh, J.E. Atmospheric circulation patterns associated with monthly and daily temperature and precipitation extremes in Alaska. Int. J. Climatol. 2017, 37, 208–217. [Google Scholar] [CrossRef]
© 2020 by the authors. Licensee MDPI, Basel, Switzerland. This article is an open access article distributed under the terms and conditions of the Creative Commons Attribution (CC BY) license (http://creativecommons.org/licenses/by/4.0/).