1. Introduction
Climate changes are observed in Poland, as in other countries in Europe, and in the world. They are manifested by, among others, increases in air temperature and the occurrence frequency of extreme events, such as flash floods or urban floods [
1]. The cause of warming is not fully recognized and is still controversial. Undoubtedly, the observed increase in air temperature significantly affects the circulation of water in the hydrological cycle (evaporation—condensation—precipitation). According to the report of the Intergovernmental Panel on Climate Change (IPCC), in the period 1960–2005, there was an increase in the average annual temperature of the globe by 0.74 °C. As a result, the level of seas and oceans increased by an average 0.19 m over the years 1901–2010 [
2]. According to projections based on the global climate model, in the current century, air temperature may rise by 1.7 to even 4.4 °C, and for each degree of the temperature increase, a global increase in precipitation intensity by about 7% is predicted [
3].
The random nature of precipitation makes it impossible to achieve the fully reliable operation of urban drainage systems, both now and in the future. Potential environmental threats caused by outflows from stormwater drainage channels can be demonstrated by hydrodynamic modelling. Simulation models (SWMM type) allow us, among others, to apply precipitation scenarios that change over time and space. These scenarios can be intense local precipitation measured over many years, which are, however, difficult to access, as well as model precipitation. The concept of “model precipitation” determines the load of the basin by precipitation, with the course normalized in time. Normalization is based on a statistical analysis of heavy precipitation events recorded in the past and reflects their most frequently recurring courses in time [
4]. For example, in Germany, Euler type II model rainfall is used to simulate short-term precipitation—in accordance with DWA-A118:2006. This pattern was also recommended in Poland [
5], presuming that Polish climatic conditions are similar to German (a transition zone between the maritime and continental climates). Euler type II model rainfall is dimensional, and based on the assumption that the largest momentary (for time interval ∆
t = 5 min) intensity of precipitation occurs at the end of the first, one-third part of its duration (
t ∈ (0, 0.33]
T). Local DDF (depth duration frequency) curves, or IDF (intensity duration frequency) curves are used to create it, for the assumed exceedance probabilities (
p), i.e., interchangeable precipitation occurrence frequencies (
C = 1/
p) (which is interpreted as: 1 time per
C years), according to the recommendations of standard EN 752:2017. This standard distinguishes the permissible frequency of channel outflows in a seven-degree scale of environmental impact (for example defined locations of areas), within the scope of:
p ∈ [100, 2]%, i.e., respectively:
C ∈ [1, 50] years (the sewer systems design criteria for sewer flooding threats, according to EN 752 from 2017, are given in
Supplementary Material).
Today, the required standard of drainage of urbanized areas is defined as the adaptation of the sewage system to accept the maximum (forecast) rainwater streams, with a frequency equal to the permissible (socially acceptable) frequency of outflow to the surface of the land. It should be emphasized that with today’s dimensioning of newly built sewage systems or modernization of existing systems, it is necessary to take the forecast effects of climate change in the period of 2050–2100 into account [
6,
7,
8,
9,
10]. The identification of future (potential) system overloads justifies the need to take appropriate remedial actions today, consisting in e.g., the construction of relief channels, retention and infiltration tanks or embankments [
11].
Modeling the reliability of stormwater drainage, recommended by standard EN 752, is rarely used in Poland, among others, due to the lack of reliable precipitation models. This paper is part of the trend to improve the basics of hydrodynamic modelling of land drainage systems on the example of Wrocław—as presented in monographs [
1,
5]. In particular, in this paper, the model Euler type II hyetograph, previously used to model sewage networks, was verified, and the forecast form of this model was developed in the perspective of 2050.
2. Study Area and Data Used
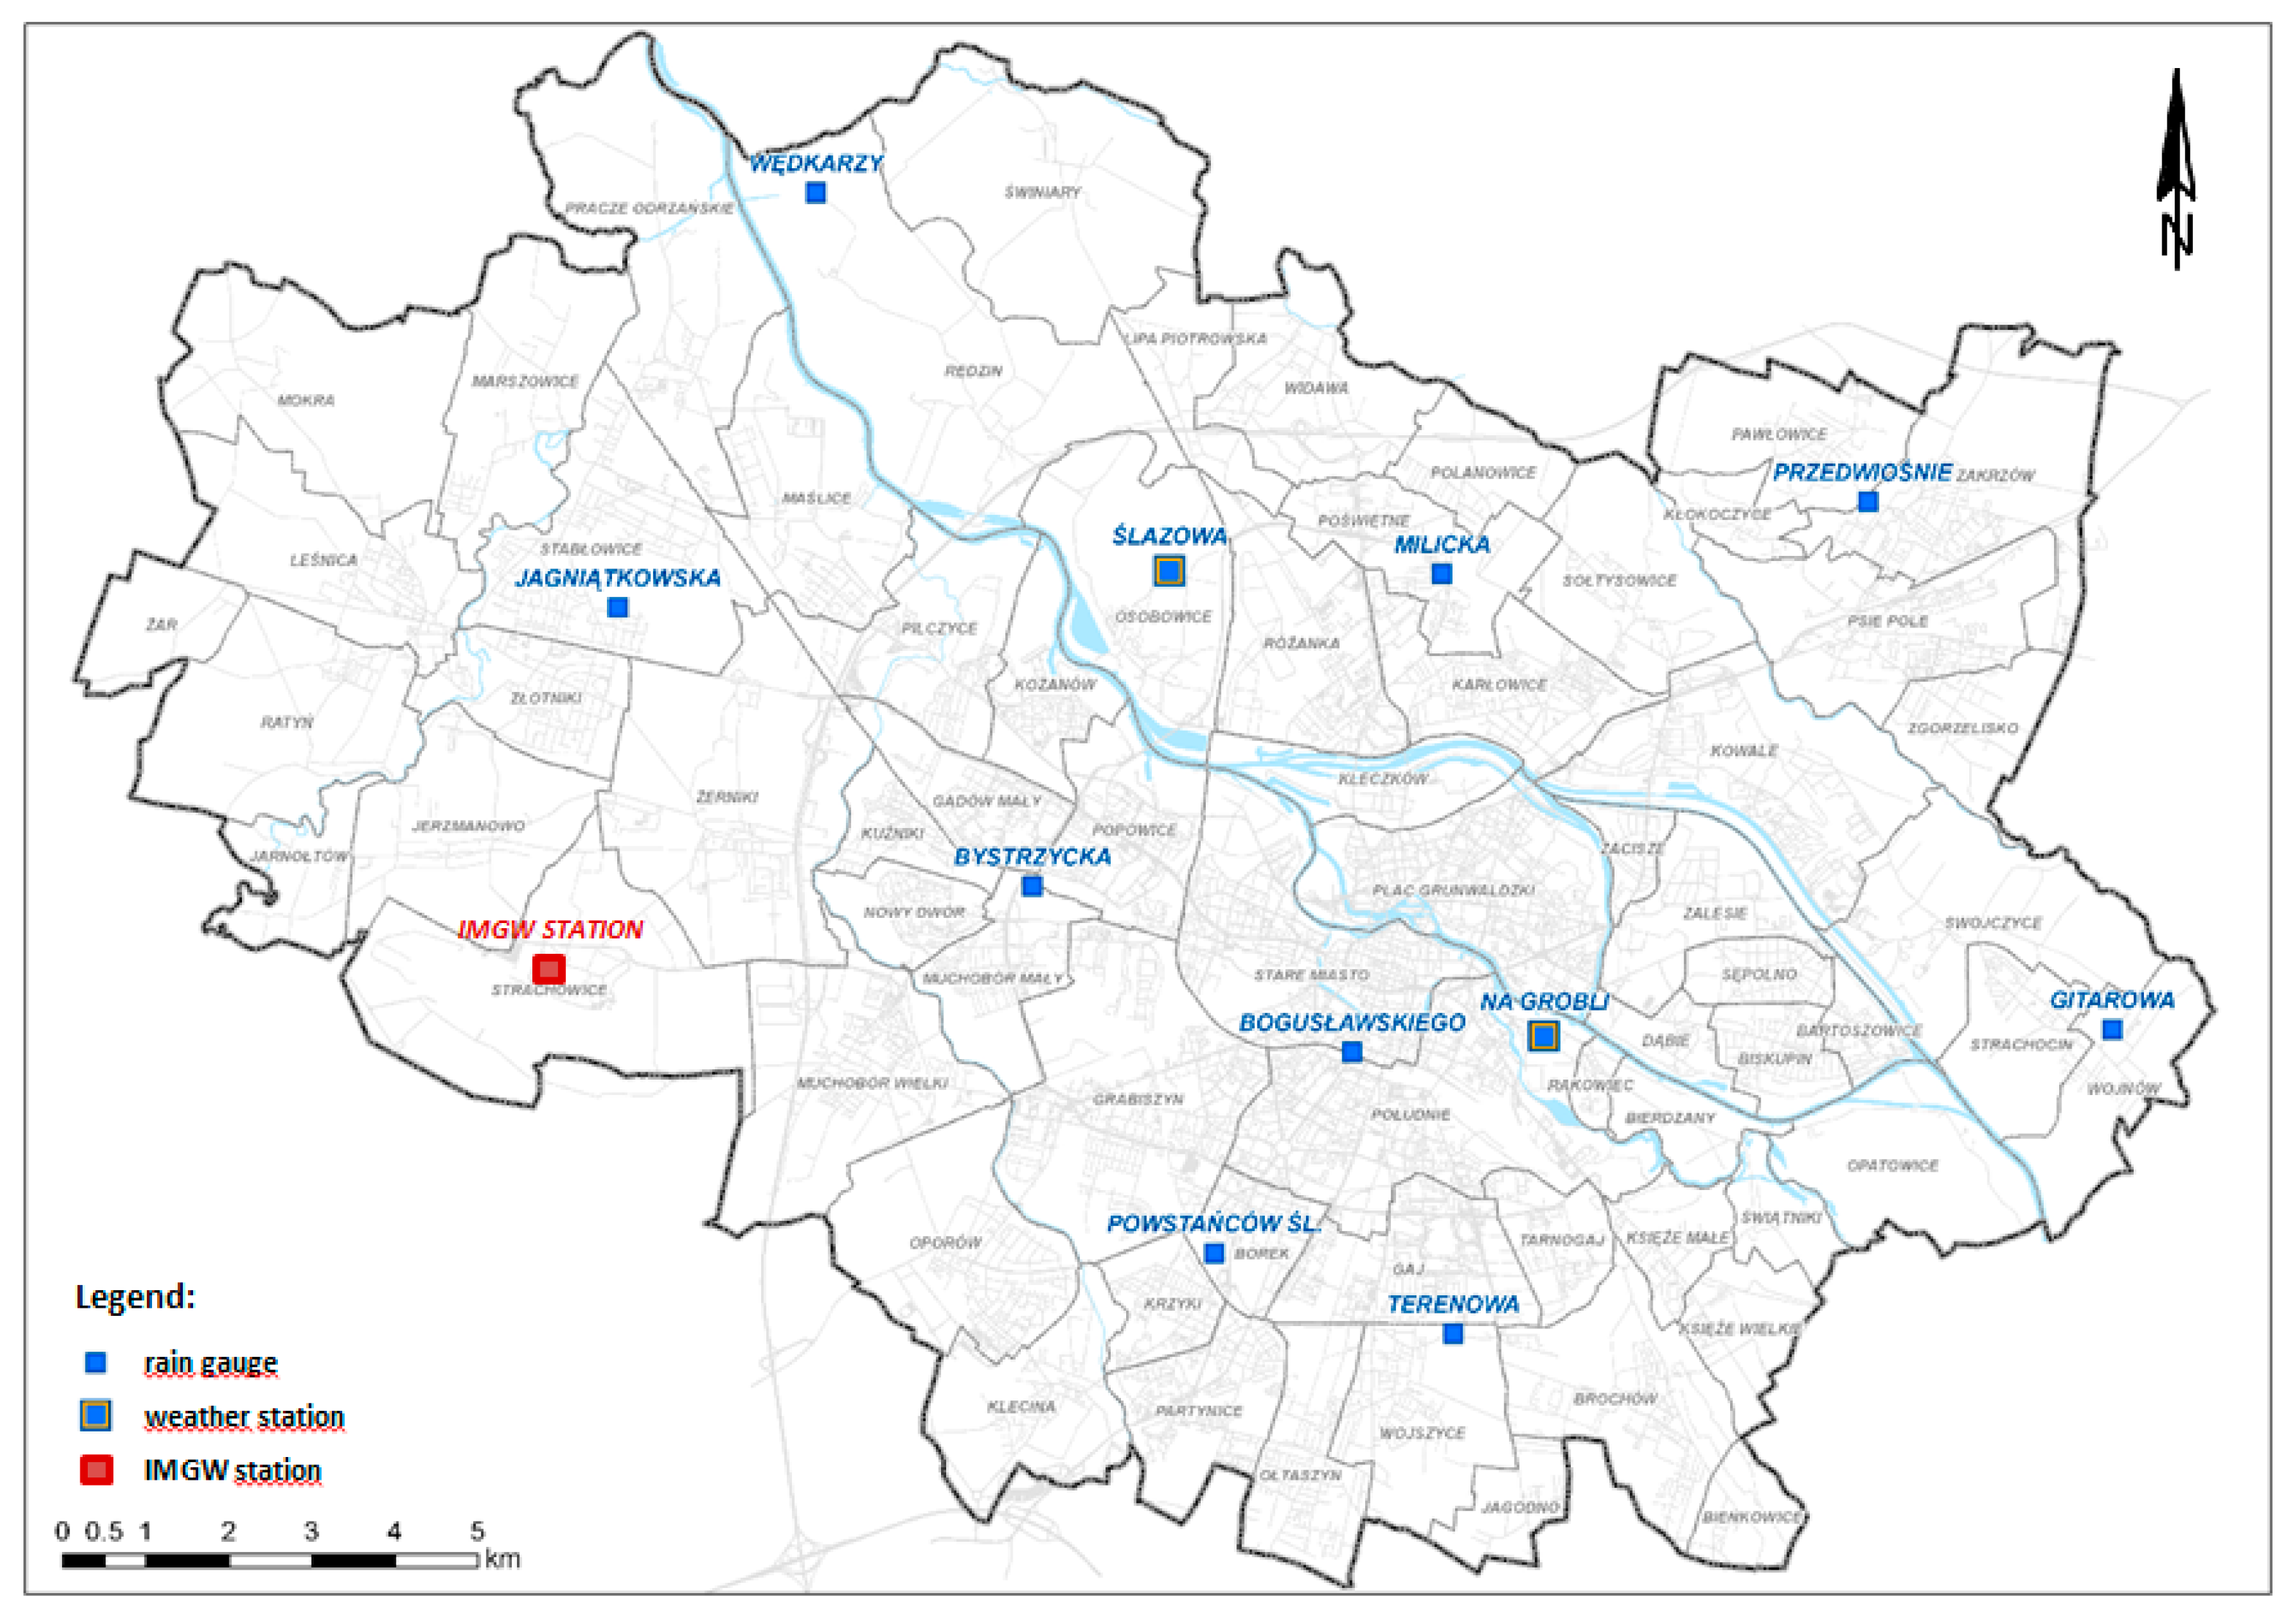
Wrocław is a city located in southwestern Poland, in the Silesian Lowland, on the Odra River and its four tributaries. The research material came from the measurement station of the Polish Institute of Meteorology and Water Management (IMGW) in Wrocław and the local precipitation monitoring network of the Municipal Water and Sewage Company (MPWiK) in Wrocław. Precipitation monitoring stations are located at the altitude of approx. 120 masl, over the area of approx. 300 km
2 (
Figure 1). The list of rain gauges with detailed geographical location is presented in
Table 1.
Precipitation records with high temporal resolution (1 min) were used to investigate the hyetographs’ shapes; for IMGW stations—for a period of 12 years (2007–2018), and for 11 stations of local monitoring network of MPWiK—for a period of one to several years (2012–2018). The precipitation data selected for the analyses can be considered representative of hydrological conditions of the central lowland part of Poland.
To separate independent precipitation phenomena, our own methodology of analysis of intervals between precipitation events (MDPD) was used [
5]. Independent precipitation events were assigned the occurrence frequency (
C), based on the current maximum precipitation model for Wrocław. From a set of 951 hyetographs, precipitation events with exceedance frequencies
C(
t) ≥ 1 year were selected for statistical analysis, obtaining a sample of 126 precipitation events.
For statistical analyses of the similarity of the real hyetographs’ shapes in relation to the Euler type II model, selected precipitation events were assigned to 3 groups: t ≤ 120 min—short duration precipitation, t ∈ (120, 720) min—medium duration precipitation and t > 720 min—long duration precipitation. In Wrocław, analyzed precipitation events have mostly short durations—75 events out of 126 (59%). Medium and long duration precipitation events have a smaller share—51 events (21% for precipitation events with t ∈ (120, 720) min and 20% with t > 720 min).
3. Method of Analysis
Many methods for creating model hyetographs are described in the literature. Their division is presented among others in papers [
12,
13,
14,
15]. These methods can be divided into 3 groups: methods based on IDF/DDF curves, methods based on historical precipitation data and stochastic methods—still being in the experimental phase. The oldest of the methods based on IDF/DDF curves is the Keifer and Chu method [
16]. Model hyetographs based on historical precipitation records are created by the statistical analysis of the selected precipitation phenomena. They are usually presented in the form of a cumulative hyetographs, i.e., as dimensionless mass curves. The oldest is the method by Huff [
17], who proposed the division of precipitation events into 4 groups, called quartiles—determining in which part of the precipitation duration its maximum intensity occurred. Based on this, he created the so-called quartile charts, illustrating changes in precipitation over time. Huff curves are a probabilistic representation of the ratio of cumulative precipitation amounts to the corresponding cumulative duration, in the form of the so-called probability isopleths. Huff curves became broadly applicable for analyzing precipitation variability, including in papers [
5,
18,
19,
20,
21,
22]. In this paper, this method is also used as one of the methods of grouping precipitation for analysis.
For grouping precipitation according to the similarity of hyetograph physical characteristics—i.e., for qualitative analyses, known methods can be used, e.g., cluster analysis using the Ward method or
k-means method [
5,
23]. The Ward method belongs to hierarchical methods. The measure of similarity is the function of the distance between bonds of object pairs. Most often it is the Euclidean distance, forming the so-called dendrogram of clusters of objects with similar characteristics. The
k-means method, however, belongs to non-hierarchical methods. It consists of dividing the investigated sample into a projected number of (
k) clusters (initially indicated, e.g., by the Ward method). Both methods, as well as the Huff curves, became applicable in the presented research—in order to verify which of the precipitation grouping, due to the similarity of shapes, best illustrates the typical courses of temporal distribution of short-term precipitation.
Quantitatively, hyetographs can be characterized by the (geometrical) indicator of the peak location of the highest intensity—
r, mass indicator—
m33 determining the ratio of the accumulated amount (mass) of rainfall for 1/3 of the initial rainfall duration to the total amount, and the intensity unevenness over time indicator—
nI, respectively [
5]:
where:
tpeak(
hmax(∆
t))—occurrence time of the peak of maximum interval rainfall amount, min;
T—total duration of rainfall, min,
hi—temporary amount of rainfall (for ∆
t = 1 min), mm;
Pc(
T)—total amount of rainfall (in time
T), mm;
Imax (∆
t)—maximum interval (∆
t) rainfall intensity, mm/min;
Im (
T)—mean rainfall intensity (in time
T), mm/min.
In monograph [
1], Kaźmierczak analyzed the changes in maximum rainfall amounts in Wrocław. Based on pluviographic records from the IMGW-PIB station in Wrocław from 59 years (1960–2018), he developed a predictive model for the maximum rainfall amount for Wrocław. He separated thirty-year periods from the measuring material: 1960–1989, 1961–1990, …, 1989–2018. The resulting 30 measurement series formed the basis for developing probability models of maximum rainfall. The maximum rainfall for statistical analysis was selected by the peak over threshold method—for 16 durations recommended for formulating rainfall models, i.e., 5, 10, 15, 30, 45, 60, 90, 120, 180, 360, 720, 1080, 1440, 2160, 2880 and 4320 min. As a result, 2018 rainfall was selected for analysis, from which 30 largest rainfall amounts (for each of the 16 rainfall durations) were chosen for each of the 30 periods (from 1960–1989 to 1989–2018) and ranked non-growing. The data prepared in this way was assigned the empirical probability of exceedance. Then, the estimators of the GED (generalized exponential distribution) and Weibull distribution parameters (as the best to describe the maximum rainfall in Polish conditions were demonstrated, among others in [
24,
25,
26]) were determined by the maximum likelihood method, through which maximum rainfall for each of the 30 analyzed periods was described.
The conformity of theoretical distributions with measured data can be examined using the λ-Kolmogorow test for statistics [
27]:
where:
;
—empirical probability:
where:
m—the place of the word in the non-growing order of precipitation;
N—random sample size.
The null hypothesis about the compatibility of distributions is adopted when the measurement data match the considered distribution at a given significance level (usually 95%)—test statistics are less than the critical value
λkr. The alternative hypothesis, about the non-compliance of the distributions with the measured data, is adopted otherwise. The best one should be chosen from the schedules meeting the selected compliance test. Information criteria are used to assess distributions [
28,
29], i.e., the Bayesian Schwartz information criterion:
where:
k—number of estimated parameters.
The criteria consist of two parts. The first describes the measure of fit of the model, while the second defines its simplicity. Therefore, information criteria allow one to choose models that are well matched, and at the same time as simple as possible. The model for which the information criterion obtains the lowest value is considered to be the best.
The non-parametric Mann–Kendall test was used to detect trends in the changes in the precipitation time series [
30,
31]. This test answers the question as to whether the values measured in the time series have a tendency to gradually increase or decrease. The rate of the change of analyzed trend in time can be described by the directional coefficient of the straight line expressed by Sen’s slope estimator. Changes (increases or decreases) at a significance level α < 0.05 are considered statistically significant.
The applied Mann–Kendall test showed statistically significant trends of changes in equation parameters, describing the dependence of scale and the lower limit parameters estimators (in the years from 1960–1989 to 1989–2018) on the duration of precipitation. As a result, equations were obtained which, after substitution to the GED quantile, enabled the formulation of a predictive model of the maximum precipitation amount (7), in the form:
dependent on: duration (from
t = 5 to
t = 4320 min), exceedance probability (from
p = 0.02 to
p = 1) and year, per which precipitation is measured (from
y = 1989 to
y = 2050).
Research carried out by Kaźmierczak showed that in the perspective of 2050, an increase in short duration precipitation and a decrease in the amount of precipitation with longer duration are forecasted in Wrocław [
1]. In particular, short-term rainfall amounts will increase by 6–10%—depending on the frequency of occurrence
C and the duration of precipitation
t (the largest projected increases were noted for
t = 5 min), which will result in an increase of their frequency of occurrence by about 30% in the future. For example, precipitation occurring currently once every
C = 3 years will occur once every
C = 2 years in the perspective of 2050. This means that more frequently, we will observe local flooding caused, especially by high intensity short-term precipitation.
4. Results and Discussion
4.1. Verification of the Euler Type II Model
Three research methods were used for qualitative analyses, i.e., for grouping precipitation according to the similarity of the hyetographs’ shape: the Huff method, cluster analysis with the Ward, and
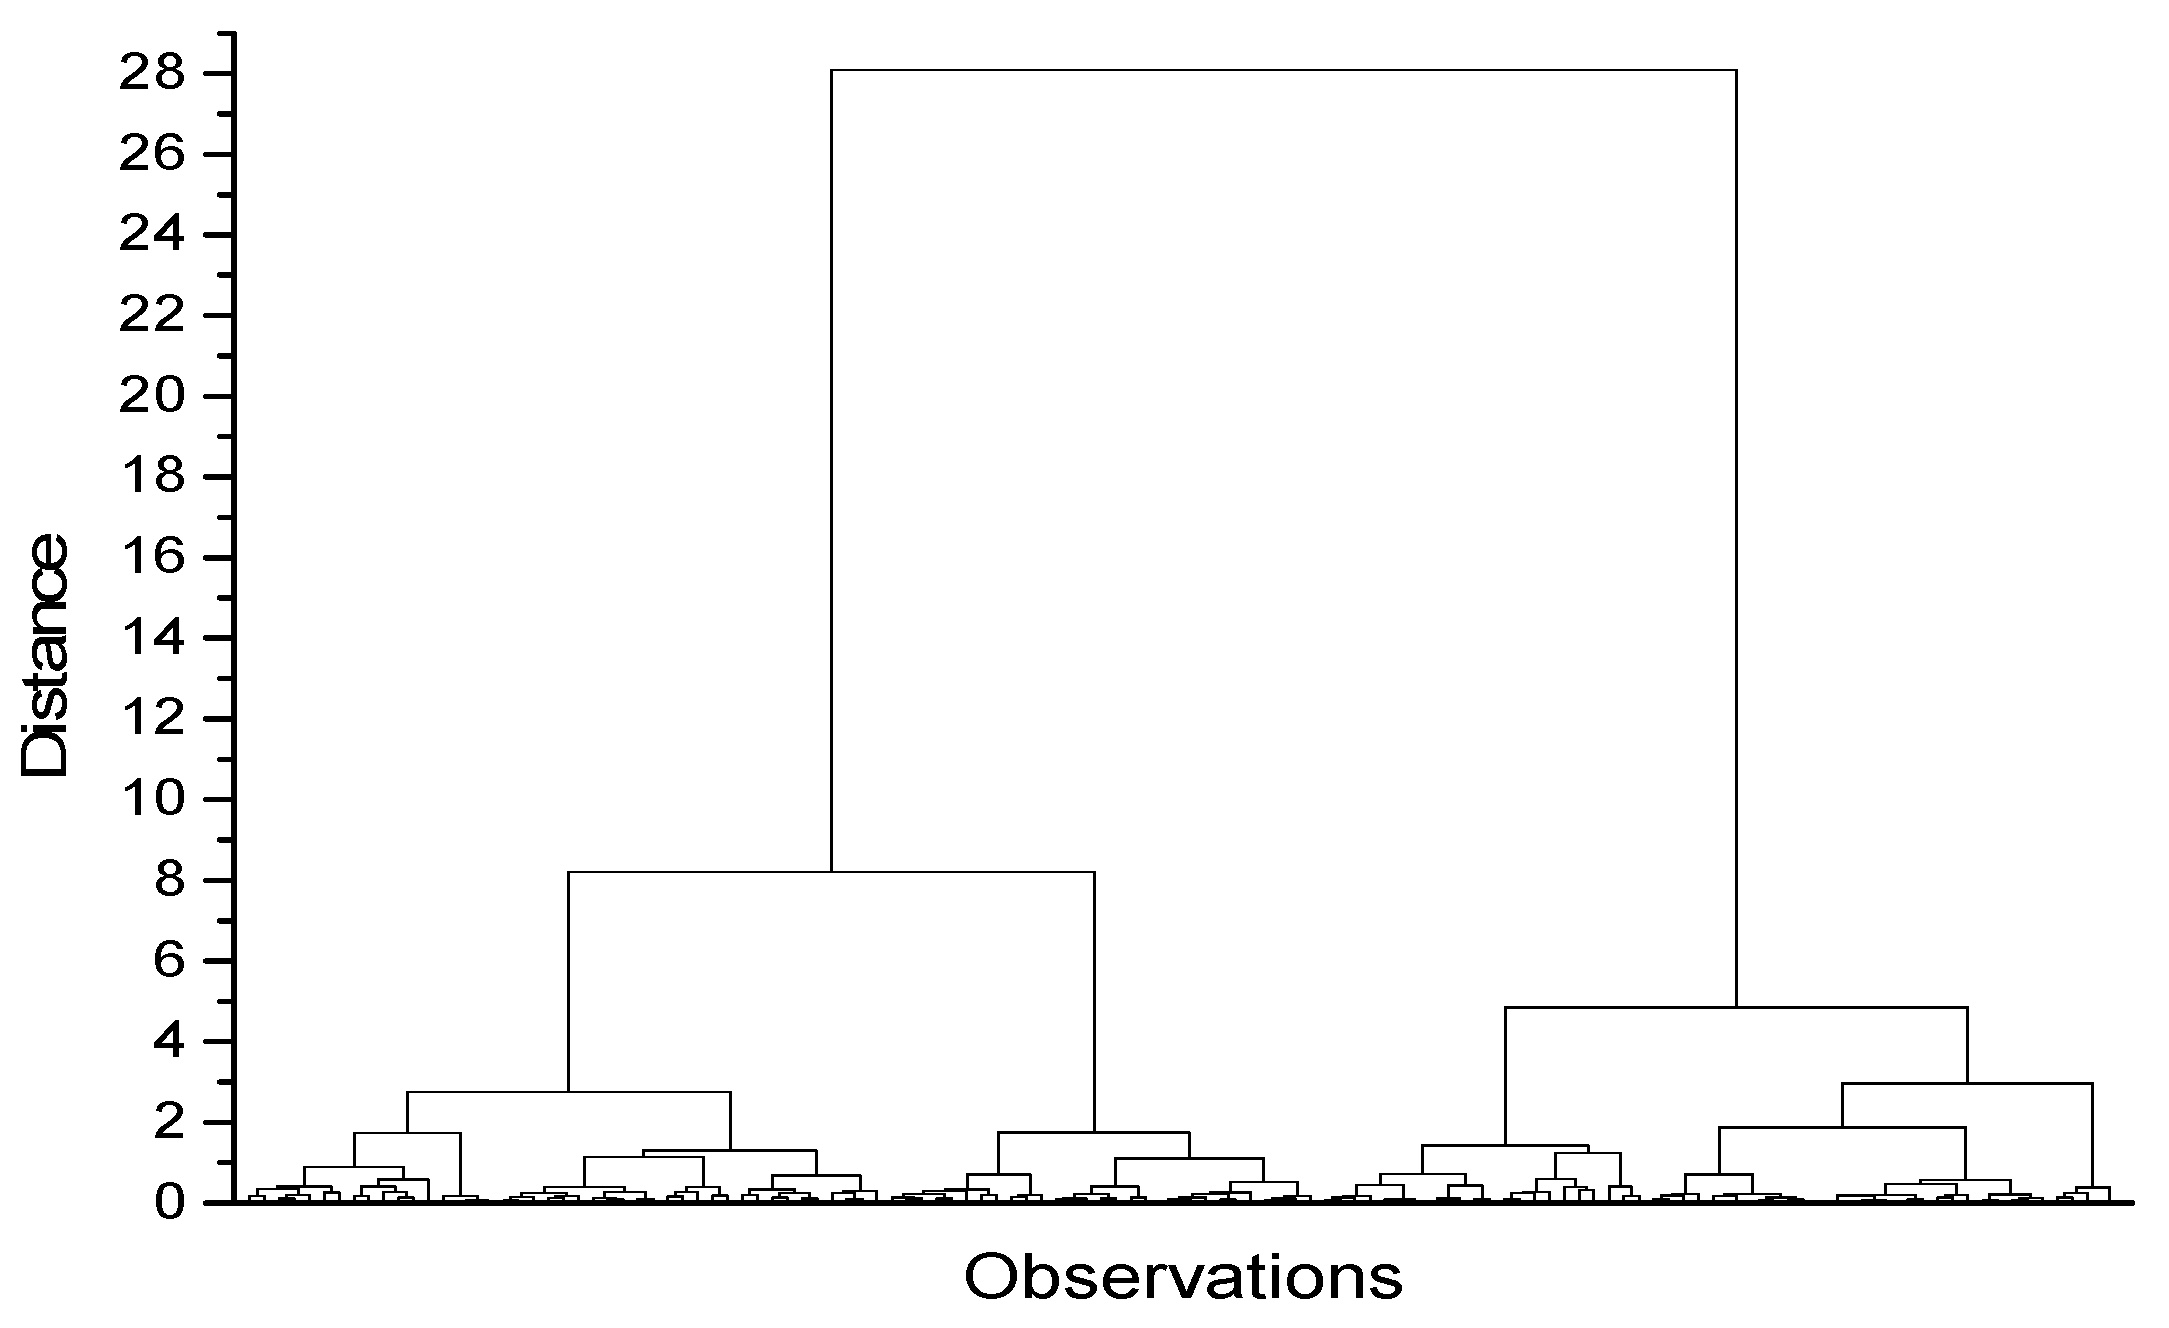
k-means methods. The results of rainfall grouping with these methods allowed choosing the best of them. The Huff method did not allow the determination of clear “patterns” of the analyzed hyetographs depending on the duration of precipitation. The shapes of dimensionless hyetographs in the form of mass curves turned out to be quite irregular in Huff’s quartile groups, and the intensity peaks were at a similar median level. The results of precipitation grouping using the Ward method showed the existence of four, significantly different precipitation clusters, i.e., with similar courses of mass curves within four groups.
Figure 2 presents the dendrogram of precipitation grouping with the use of the Ward method (the cut-off level of approx. 3 enabled the division of the rainfall sample to 4 clusters).
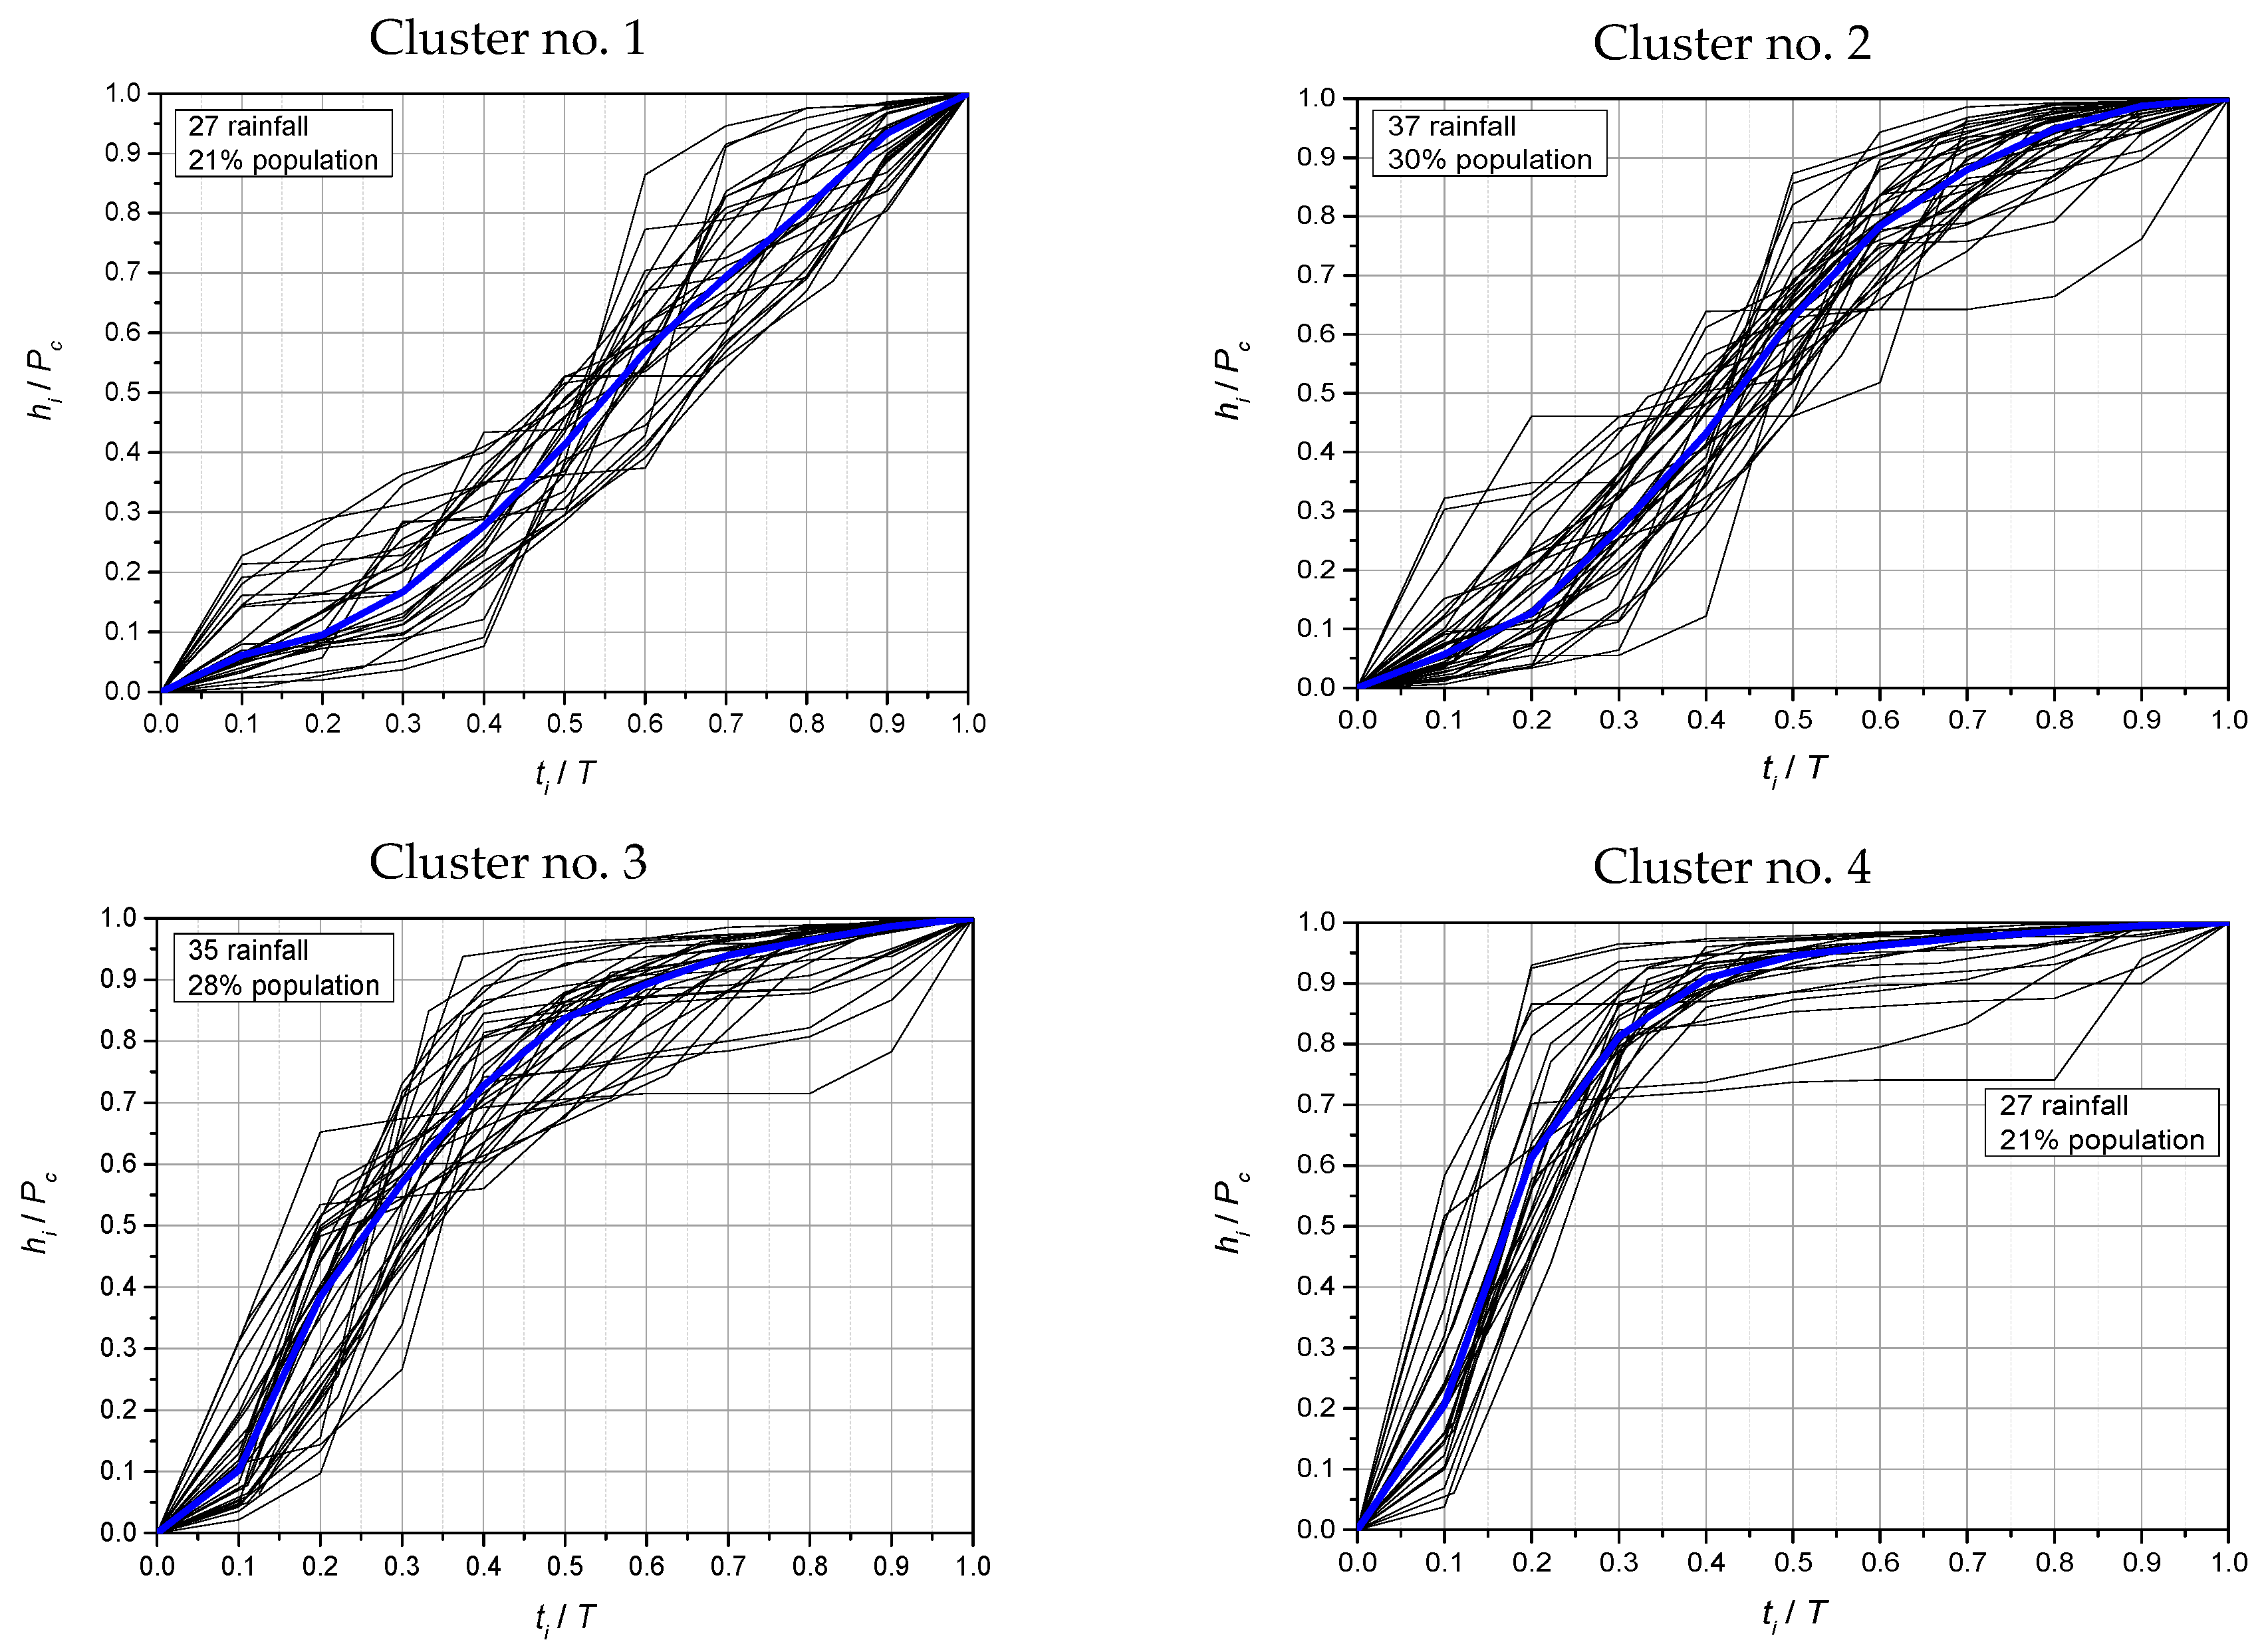
This enabled the use of another precipitation grouping method—the
k-means method. The
k-means method (for
k = 4 according to Ward) proved to be the most useful for precipitation selection according to its genetic characteristics. As a result of the precipitation grouping by the
k-means method, the most expressive clusters were obtained. This paper is limited to presenting the results of precipitation grouping by the
k-mean method.
Figure 3 illustrates the total precipitation curves in 4 clusters separated by this method with plotted median curves. It can be seen that the bundles of most precipitation sum curves are located close to the respective medians in the four analyzed clusters.
The results of the qualitative grouping of precipitation allow us to state that almost a half—62 precipitation events (49% of the sample) have a peak of accumulated amounts located at 1/3 of the initial duration (in clusters no. 3 and 4), during which the majority of the total precipitation mass is deposited. Clusters 3 and 4 include the majority (48 of 75) of short duration rainfall events and 3 medium duration events—from the border of short and medium duration precipitation, i.e., T < 150 min. Physically indicated short-term precipitation events (51) were subjected to a detailed quantitative analysis of the similarity of hyetographs’ shapes to the Euler type II model.
Figure 4 presents the sum curves of 51 analyzed precipitation events together with the calculated median curve, which shows that at 1/3 of their initial duration, the precipitation mass reaches approx. 75%.
In
Figure 5, a dimensionless hyetograph for the investigated 51 precipitation events was drawn. It depicts the 50% percentile (median) curve. This hyetograph illustrates ranges of measured relative interval values (∆
t = 0.1
T) of rainfall amounts (
hi/
Pc), using the so-called box charts. Box charts allow the pictogram to include information about the location, dispersion and shape of the empirical distribution of the investigated precipitation sample. The so-called whiskers were limited to 10% and 90% of the percentile of the data set, which are identified in the literature [
17,
22], with confidence intervals (at 10% and 90% respectively). According to the graph, the peak position indicator is set to
r = 0.2
ti/
T, i.e., at 1/5 of the rainfall duration.
The initial analysis allows us to state that the features of mass distribution on dimensionless hyetographs of 51 investigated precipitation events are similar to the Euler type II model. However, this observation requires confirmation in a detailed quantitative assessment of the similarity of the dimensional hyetographs’ shapes of these precipitation events. To assess the quantitative similarity of the local hyetographs’ shapes, three indicators were used to characterize: location of the maximum amount peak (1) mass distribution (2) and unevenness in rain intensity in time (3)—in dimensional systems.
The Euler type II model precipitation was developed from IDF curves for Wrocław, for the purposes of comparative analyses. The current maximum precipitation model (DDF forms) for Wrocław was used to create IDF curves [
1]. Based on this, 28 Euler models for Wrocław were created: for 7 durations:
T ∈ {30, 45, 60, 75, 90, 120, 150} min (divided into three and five equal parts) and four occurrence frequency classes:
C ∈ {1, 2, 5, 10} years.
Mass distribution and unevenness during precipitation events were investigated in the created models. Values of index m33 turned out to be almost identical, regardless of T and C. The average value of indicator m33 is 0.741. Unevenness during intensity varies from 3.64 to 12.24—depending on the duration of precipitation events (T = 30–150 min), but it is independent of their frequency (C). The average value of indicator nI = 7.71.
The parameters of 28 Euler type II precipitation models determined for Wrocław data regarding mass distribution and unevenness in time were then compared with parameters of the real rainfall hyetographs. To maintain the correctness of comparisons, i.e., to meet the condition of divisibility of the rainfall duration into three equal parts, and at the same time, its divisibility into intervals ∆
t = 5 min, the real duration of precipitation events
T was corrected to their model duration
T’ (to not lose the mass of rainfall:
T’ ≥ T). For quantitative assessments, the following indicators were re-used:
r,
m33 and
nI—in relation to time
T’ (
Table 2).
For peak position indicator r, the values for 51 real precipitation events differ in terms of interval location in relation to 28 models. Similarly, the average value of mass distribution index m33’ = 0.80 on 51 dimensional hyetographs is higher than the constant value m33 = 0.741 for 28 Euler type II models. In both cases, however, both the interval intensity peak and the main precipitation mass are located in the first 1/3 part of the duration. Precipitation unevenness in time on 51 hyetographs was significant: nI’ ∈ [1.59, 10.26]. In Euler type II model precipitation, the unevenness is at a similar level nI ∈ [3.64, 12.24]. These values can be considered similar. The discrepancies between the mean values fall into the accuracy class of hydrological measurements and calculations related to random phenomena.
The analysis of real precipitation events recorded in Wrocław allows us to conclude that the Euler type II model largely reflects the investigated short duration rainfall (for T < 150 min). The main mass of precipitation occurs in the first 1/3 part of the rainfall duration. However, the location of the maximum interval intensity peak (∆t = 5 min) varies significantly—for the investigated precipitation events, it occurs at the end of 1/5 part of their duration, and in Euler type II models, it occurs at the end of 1/3 of this time. Therefore, to generalize the research results, it is necessary to correct the position of the maximum interval intensity peak—from 1/3 T to 1/5 T.
4.2. Examples of Short Duration Rainfall Models for 2050
Table 3 lists the maximum precipitation amounts calculated from the predictive model (4) within the range
t ∈ [5, 75] min and
C ∈ {1, 2, 3, 5, 10, 30, 50} years, based on which IDF curves for Wrocław for 2050 were developed.
Then, based on the IDF curves forecast for 2050, generalized short duration rainfall models for Wrocław were developed (with the example duration
t = 75 min), as reliable for the future hydrodynamic modelling of stormwater drainage system overloads.
Table 4 presents the stages of creating the Euler type II model—with the example frequency of occurrence
C = 10 years and duration
t = 75 min, for the current form of the model for 2020 and for the generalized, detailed form (with the intensity peak shifted) forecast for 2050.
Based on the predictive model (4), the maximum rainfall amounts were calculated in 5-min intervals. These amounts were used to calculate interval intensities (I). In the case of the Euler type II model, the highest interval rainfall intensity occurs at the end of 1/3 of the rainfall duration. To this interval are attached on the left side of the time axis the next intervals, with lower intensities, until the time moment t = 0 is reached. Subsequent intervals occur on the time axis on the right side in relation to the peak, and fill the period to the end of the model rainfall. In the detailed form of the Euler model for 2050, the maximum interval rainfall intensity occurs at the end of 1/5 of the rainfall duration.
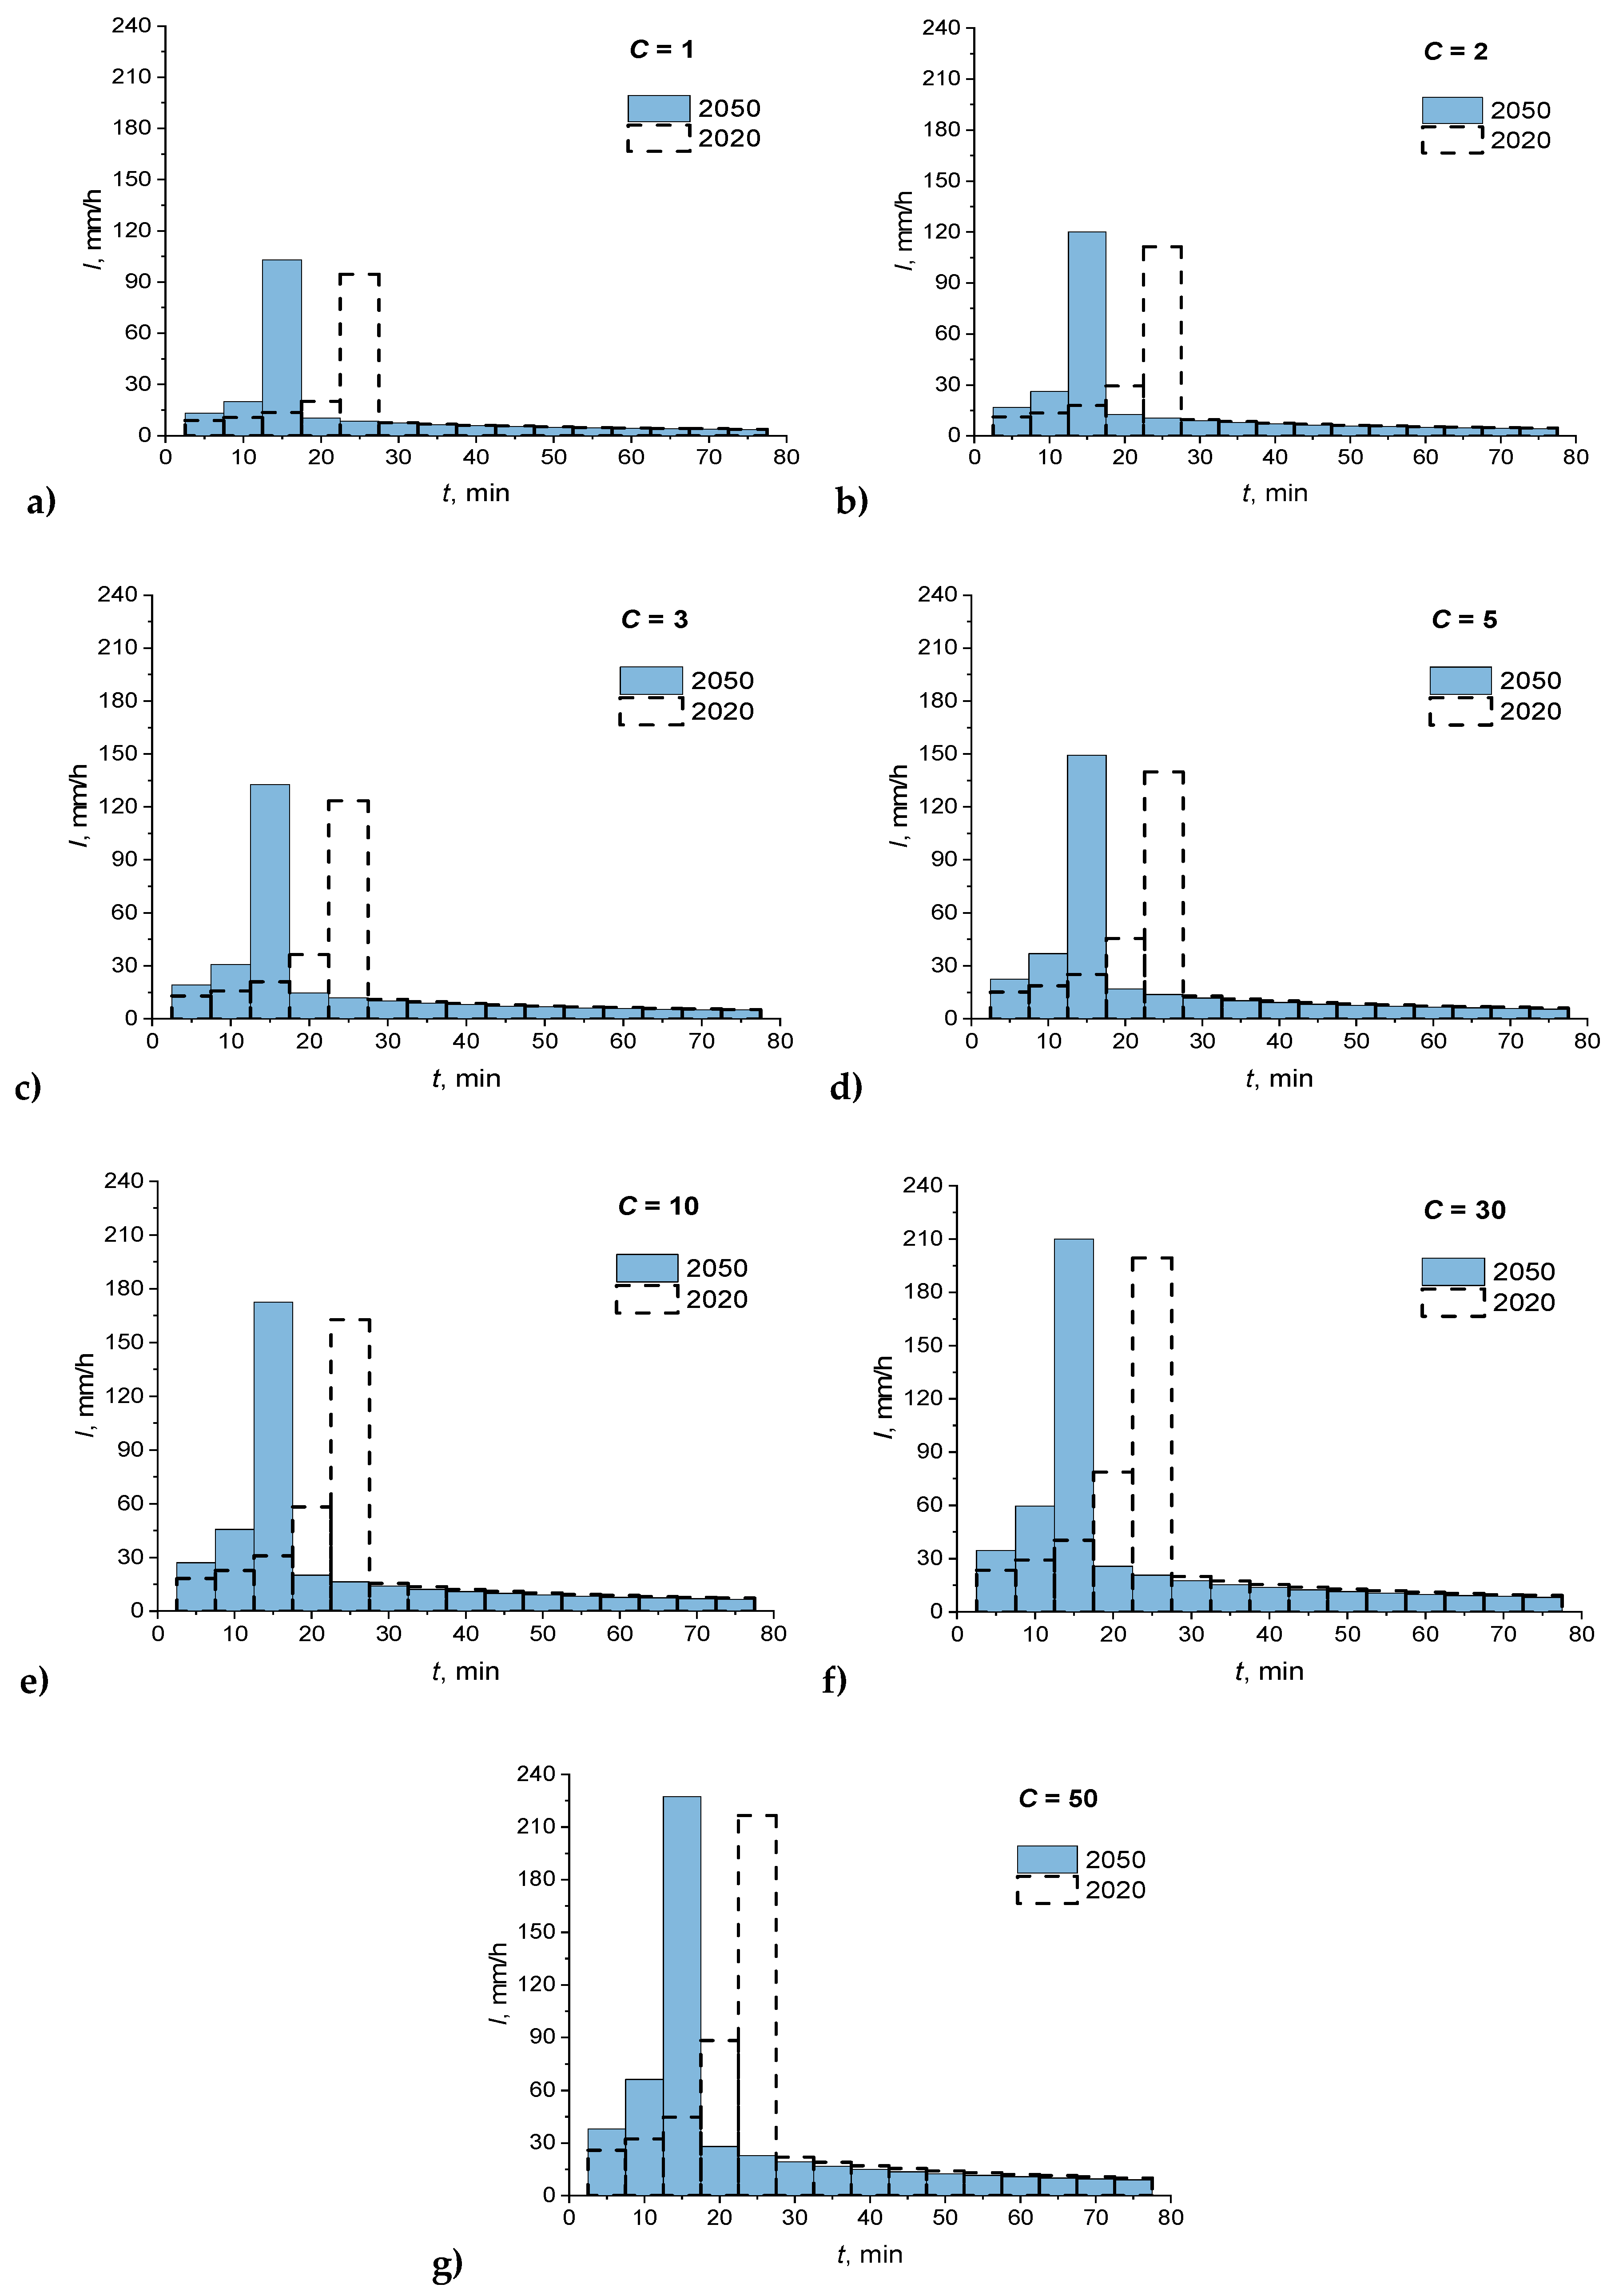
Figure 6 illustrates the example of the generalized short duration rainfall models, with duration
t = 75 min and occurrence frequency
C ∈ {1, 2, 3, 5, 10, 30, 50} years (according to the requirements of standard EN 752: 2017). The graphs also show the current Euler type II model determined for 2020 as the background.
The graphs (
Figure 6) present differences in the maximum precipitation interval intensity peaks (Δ
t = 5 min)—clearly higher for the generalized models forecast for 2050 in comparison to standard Euler type II models for 2020. In addition, there are significant differences in the distribution of precipitation mass. In the generalized model for 2050, the main mass peak is shifted to the end of the first 1/5 part of the precipitation duration (
t ∈ (0, 0.20]
T), while in the standard Euler type II model for 2020, the main mass peak occurs at the end of the first 1/3 part of the duration (
t ∈ (0, 0.33]
T). In both models, approx. ¾ of the precipitation mass is concentrated within the range
t ∈ (0, 0.33]
T. The remaining approx. ¼ of mass is within the range
t ∈ (0.33,
T). After exceeding
t = 0.33
T, differences in mass distribution in both models are very small.
5. Conclusions
Model rainfall should reflect the main characteristics of the real precipitation events occurring in a given area. It is therefore advisable to conduct the research on the variability in precipitation intensity in time, based on local databases. Precipitation data with high temporal resolution (1 min) from the IMGW station and the local network of 11 MPWK rain gauges was selected to investigate the hyetographs’ shapes in Wrocław. Selected stations can be considered representative for the hydrological conditions of the central lowland part of Poland. Overall, 126 precipitation events with exceedance frequencies C(T) ≥ 1 year were selected for statistical analyses, which were genetically grouped (according to duration). Most precipitation events are short-term (59%), and medium and long duration precipitation events constitute a smaller share (41%). For qualitative analyses, i.e., precipitation grouping according to the similarity of the hyetographs’ shape, three research methodologies were used: the Huff method, cluster analysis by the Ward method and the k-means method. These methods, especially the k-means method (for k = 4 according to the Ward method), proved useful for the selection of precipitation events according to the genetic characteristics of precipitation. For the quantitative assessment of the similarity of the local hyetographs’ shapes, three indicators were used to characterize: location of the maximum amount peak, mass distribution and the unevenness of precipitation intensity in time. The comparative analysis included the verification of the shapes of the Euler type II model and its generalization for the investigated stations in Wrocław.
To sum up, the paper presents the principles of creating generalized local short-term precipitation models. For practical reasons, precipitation events with exceedance frequency C(t) ≥ 1 year were analyzed as useful for designing and modelling the reliability of operation of drainage systems of urban areas (according to EN 752:2017). The example of precipitation events measured in Wroclaw demonstrated significant differences in the local hyetographs’ shape of a short-term precipitation events compared to the previously used Euler type II model. Based on this, a generalized short duration precipitation model for Wrocław was proposed, with a numerical example for practical applications—for the perspective of 2050. It should be noted here that the developed precipitation model is appropriate to describe the precipitation for the analyzed measuring station in Wrocław. The research was based on the predictive model for the maximum rainfall amount, developed based on rainfall data from the Wrocław station, with the use of the peak over threshold (POT) method and generalized exponential distribution (GED).
The performed research allows us to formulate the following final conclusions, with scientific and practical relevance:
The largest precipitation sample above the threshold amount—for occurrence frequency C(T) ≥ 1 year are short duration precipitation events in Wroclaw, for which the main mass, i.e., approx. ¾, is concentrated in the first 1/3 part of their duration. This temporal distribution of precipitation is characteristic for precipitation events with durations T < 150 min.
In the verified Euler type II model, the location of the peak of maximum interval rainfall amount shifts from 1/3 to 1/5 of the precipitation duration (T). However, the main precipitation mass remains at 1/3T. This means that the idea of creating precipitation models—from IDF curves—can be considered as positively verified on the investigated precipitation from (lowland) stations in Wrocław.
A generalized short duration precipitation model—forecast for 2050—was established for Wrocław, with the maximum interval intensity peak located in the first 1/5 part of the precipitation duration and with its greater value. The generalized model can be considered reliable for the hydrodynamic modelling of stormwater drainage system overloads. A larger peak of interval rainfall intensity may result in increasing the probability of flooding occurrence from sewers and therefore in reducing the sewage systems reliability in the future.
The presented research results should be verified on a larger number of IMGW stations and the local precipitation monitoring networks to confirm the investigated dependencies in Wrocław in other regions of Poland.


