Development of a Wide-Range Non-Dispersive Infrared Analyzer for the Continuous Measurement of CO2 in Indoor Environments


Abstract
1. Introduction
2. Experimental Methods
2.1. Investigation of the Effect of Pathlength on the Detection of CO2
2.2. Investigation of the Interference Effects on the CO2 NDIR Analyzer
3. Results and Discussion
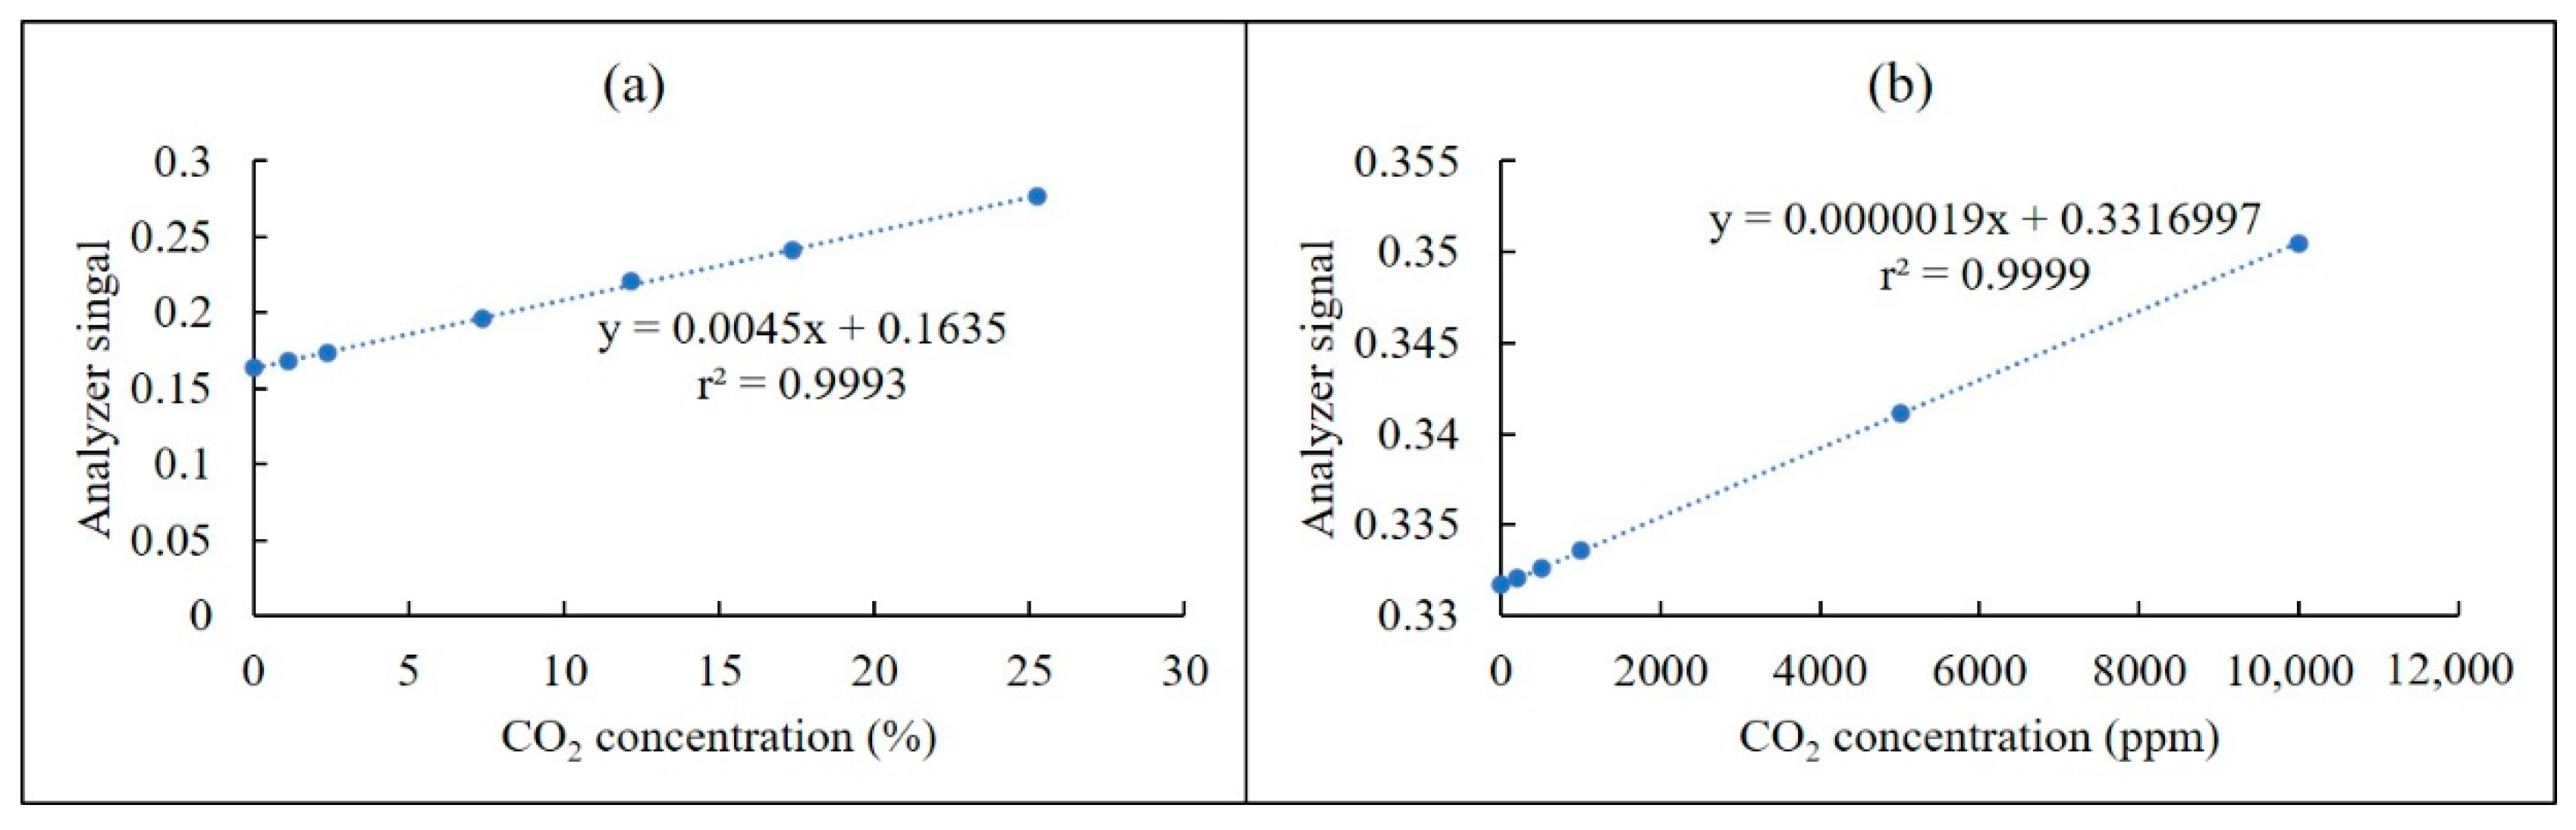
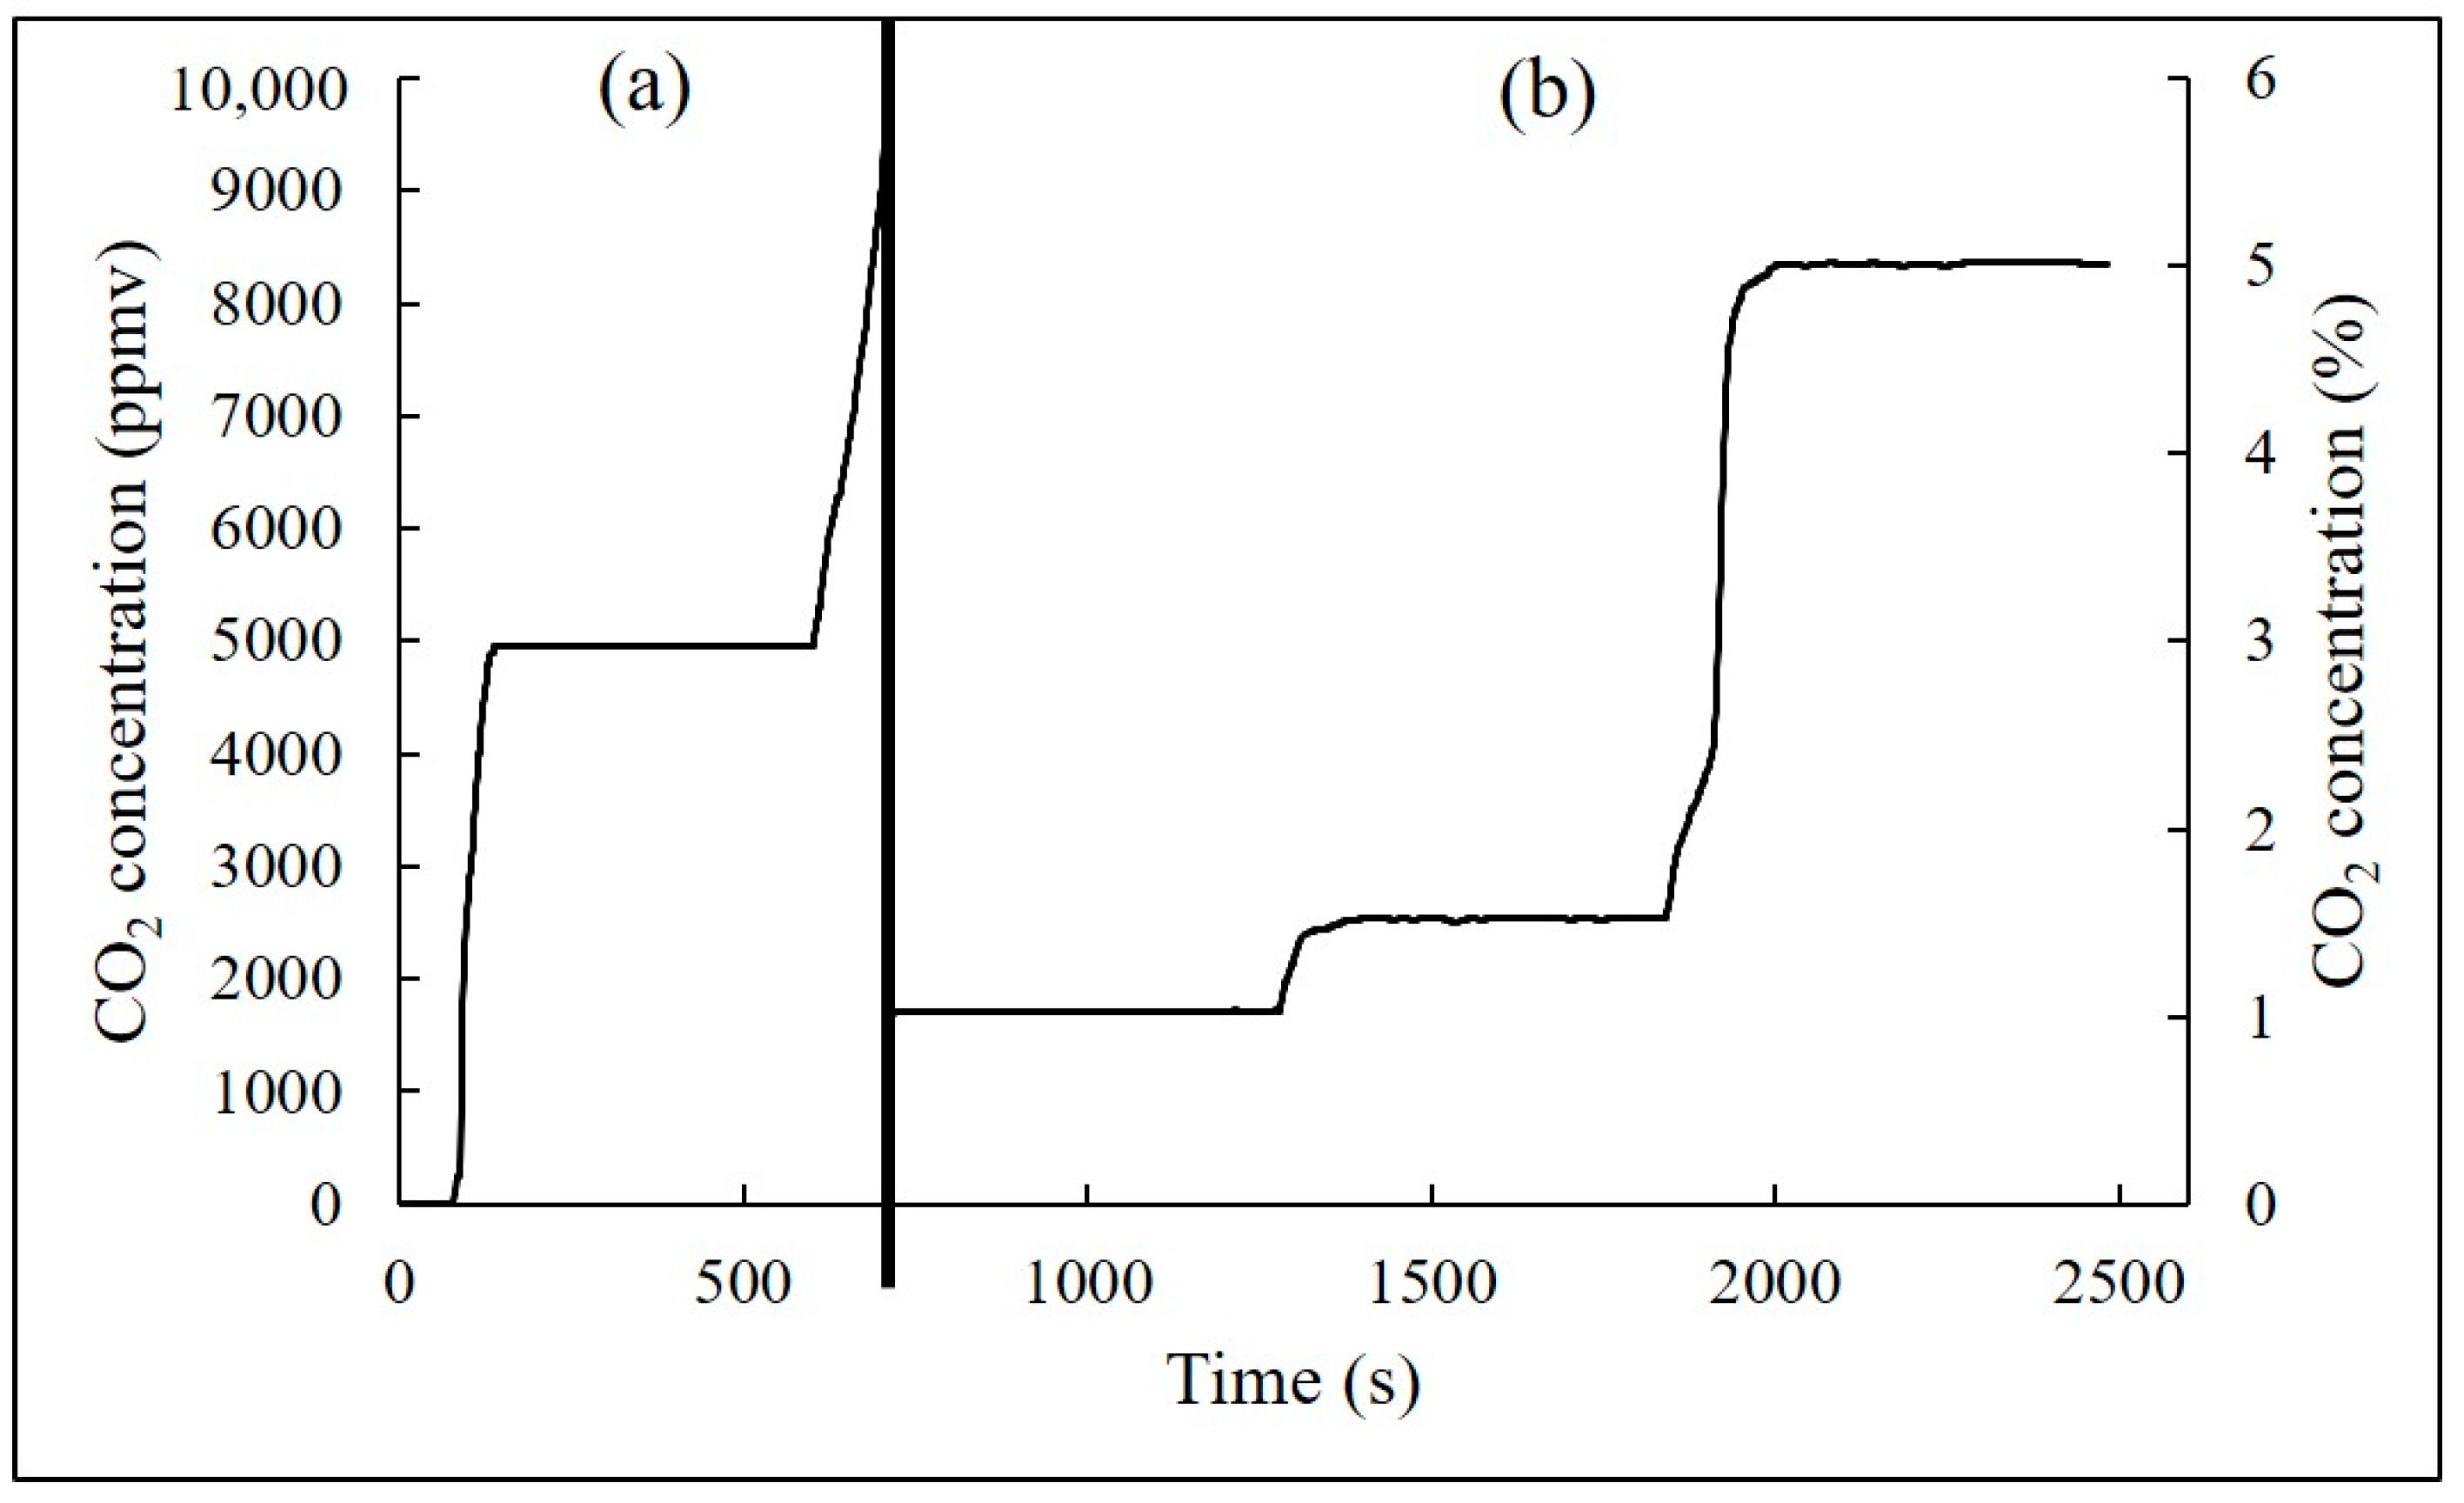
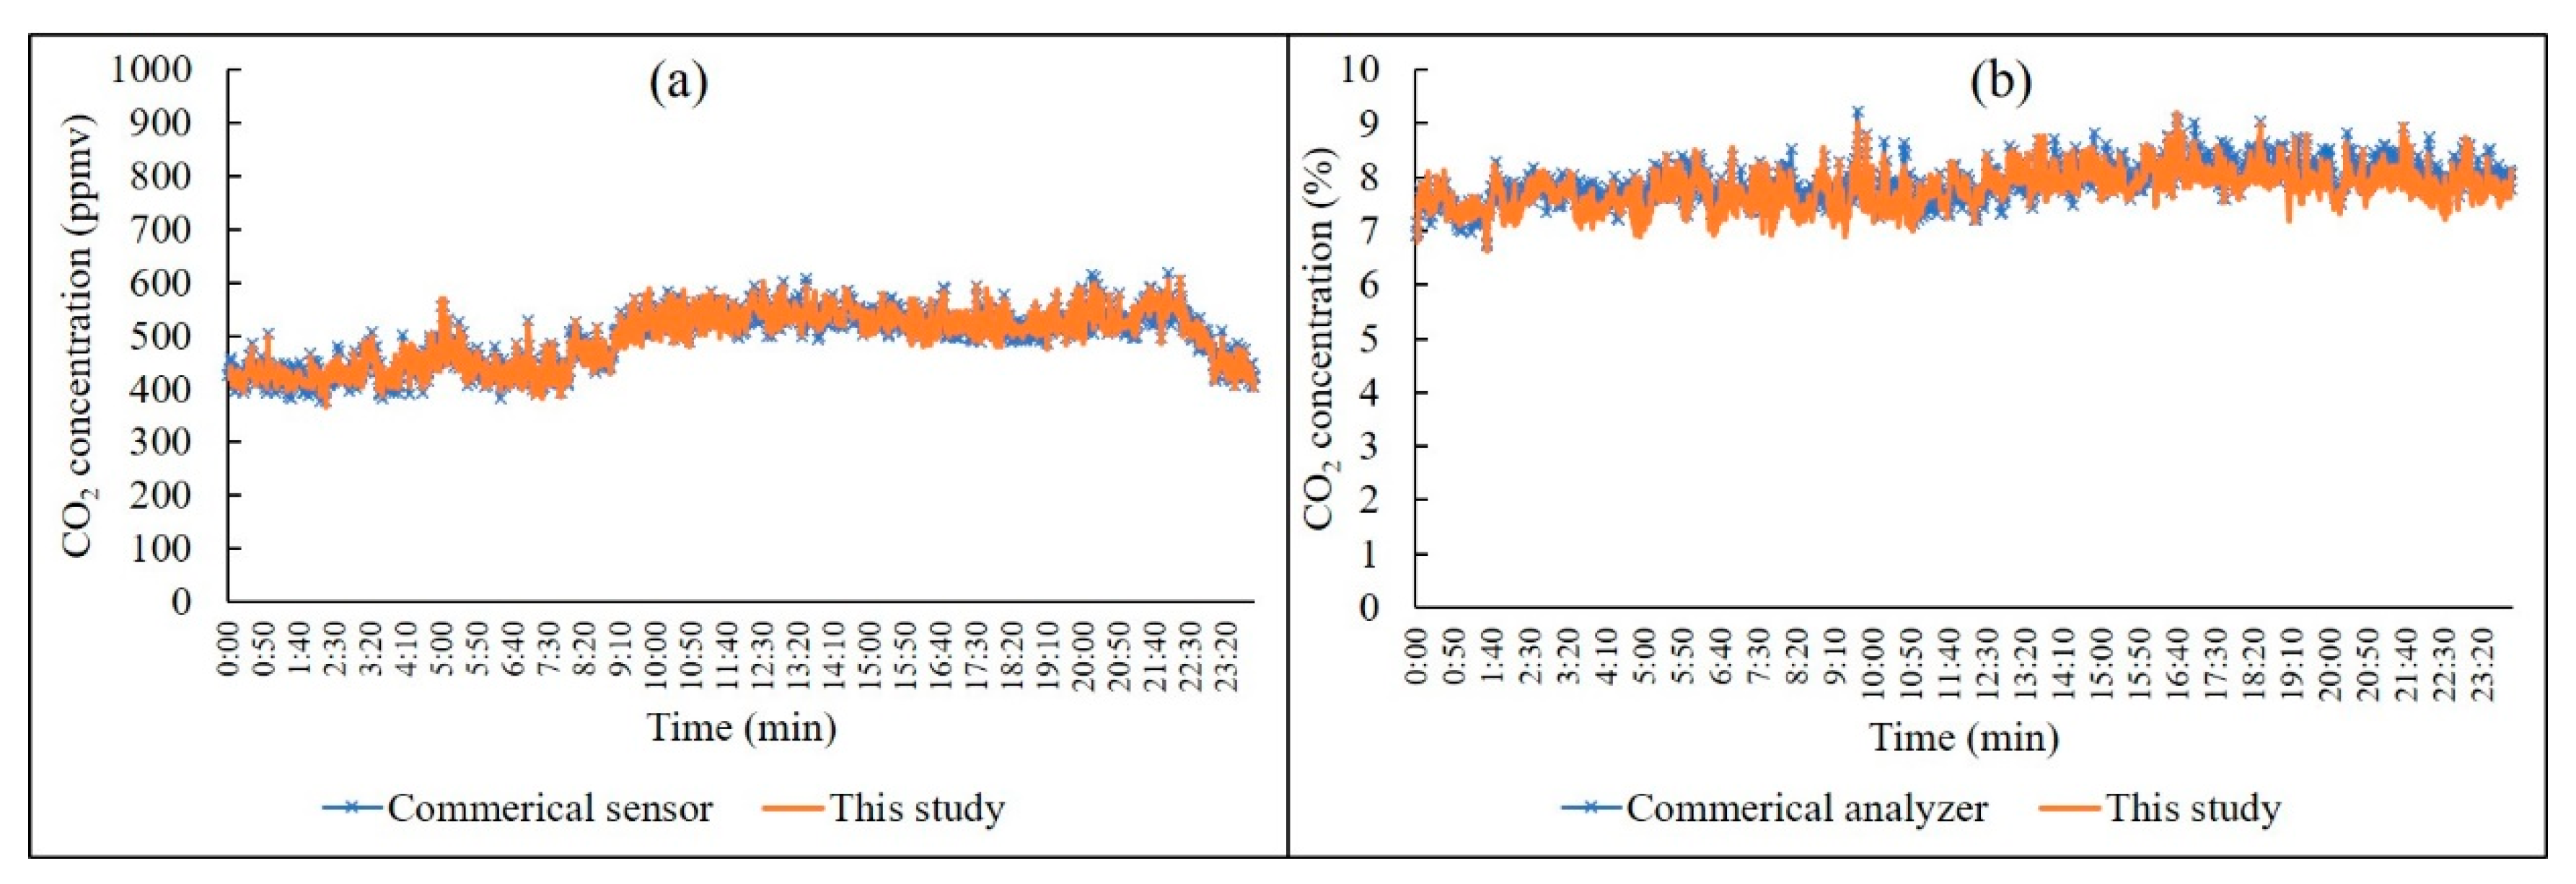
3.1. Investigation of the Effect of the Pathlength on the Detection of CO2
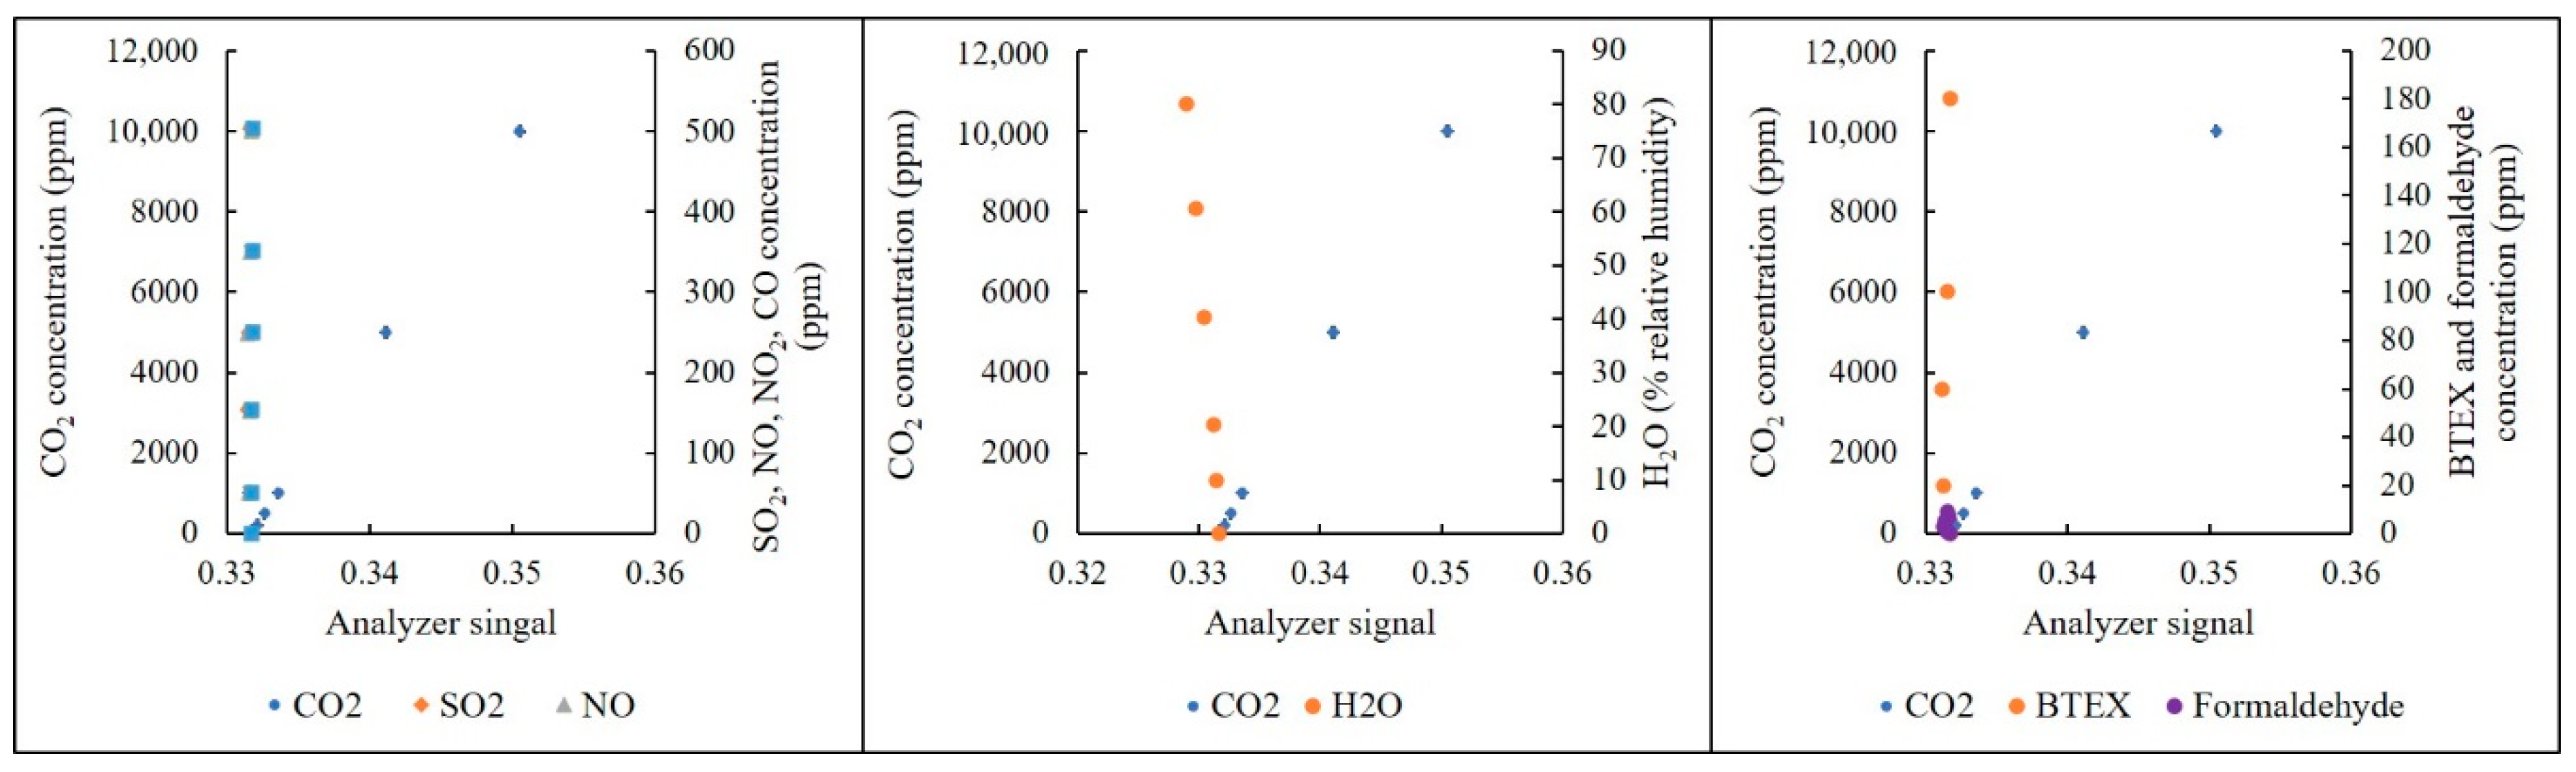
3.2. Effect of Interference Gases on the CO2 NDIR Analyzer
4. Conclusions
Author Contributions
Funding
Acknowledgments
Conflicts of Interest
References
- Hoefer, U.; Gutmachera, D. Fire Gas Detection. Procedia Eng. 2012, 47, 1446–1459. [Google Scholar] [CrossRef]
- Gutmacher, D.; Hoefer, U.; Wöllenstein, J. Gas sensor technologies for fire detection. Sens. Actuators B Chem. 2012, 175, 40–45. [Google Scholar] [CrossRef]
- Fonollosa, J.; Solórzano, A.; Jiménez-Soto, J.; Moreno, S.O.; Marco, S. Gas Sensor Array for Reliable Fire Detection. Procedia Eng. 2016, 168, 444–447. [Google Scholar] [CrossRef]
- Viveiros, F.; Gaspar, J.L.; Ferreira, T.; Silva, C. Hazardous indoor CO2 concentrations in volcanic environments. Environ. Pollut. 2016, 214, 776–786. [Google Scholar] [CrossRef] [PubMed]
- Chen, T.; Su, G.; Yuan, H. In situ gas filter correlation: Photoacoustic CO detection method for fire warning. Sens. Actuators B Chem. 2005, 109, 233–237. [Google Scholar] [CrossRef]
- Jaber, A.R.; Dejan, M.; Marcella, U. The Effect of Indoor Temperature and CO2 Levels on Cognitive Performance of Adult Females in a University Building in Saudi Arabia. Energy Procedia 2017, 122, 451–456. [Google Scholar] [CrossRef]
- Shriram, S.; Ramamurthy, K.; Ramakrishnan, S. Effect of occupant-induced indoor CO2 concentration and bioeffluents on human physiology using a spirometric test. Build. Environ. 2019, 149, 58–67. [Google Scholar] [CrossRef]
- Du, C.; Wang, S.; Yu, M.; Chiu, T.; Wang, J.-Y.; Chuang, P.; Jou, R.; Chan, P.; Fang, C.-T. Effect of ventilation improvement during a tuberculosis outbreak in underventilated university buildings. Indoor Air 2020, 30, 422–432. [Google Scholar] [CrossRef]
- Pereira, M.; Tribess, A.; Buonanno, G.; Stabile, L.; Scungio, M.; Baffo, I. Particle and Carbon Dioxide Concentration Levels in a Surgical Room Conditioned with a Window/Wall Air-Conditioning System. Int. J. Environ. Res. Public Health 2020, 17, 1180. [Google Scholar] [CrossRef]
- Ramalho, O.; Wyart, G.; Mandin, C.; Blondeau, P.; Cabanes, P.-A.; Leclerc, N.; Mullot, J.-U.; Boulanger, G.; Redaelli, M. Association of carbon dioxide with indoor air pollutants and exceedance of health guideline values. Build. Environ. 2015, 93, 115–124. [Google Scholar] [CrossRef]
- Zhou, J.; Kim, C.N. Numerical Investigation of Indoor CO2 Concentration Distribution in an Apartment. Indoor Built Environ. 2010, 20, 91–100. [Google Scholar] [CrossRef]
- Pamonpol, K.; Areerob, T.; Prueksakorn, K. Indoor Air Quality Improvement by Simple Ventilated Practice and Sansevieria trifasciata. Atmosphere 2020, 11, 271. [Google Scholar] [CrossRef]
- American Society of Heating Refrigerating and Air Conditioning Engineers. Ventilation for Acceptable Indoor Air Quality; American Society of Heating Refrigerating and Air Conditioning Engineers: Atlanta, GA, USA, 2019. [Google Scholar]
- Seppanen, O.A.; Fisk, W.J.; Mendell, M.J. Association of ventilation rates and CO2 concentrations with health and other responses in commercial and institutional buildings. Indoor Air 1999, 9, 226–252. [Google Scholar] [CrossRef]
- Pegas, P.N.; Alves, C.; Evtyugina, M.G.; Nunes, T.; Cerqueira, M.; Franchi, M.; Pio, C.; Almeida, S.M.; Freitas, M.C. Indoor air quality in elementary schools of Lisbon in spring. Environ. Geochem. Health 2010, 33, 455–468. [Google Scholar] [CrossRef]
- Al-Rashidi, K.; Loveday, D.; Al-Mutawa, N. Impact of ventilation modes on carbon dioxide concentration levels in Kuwait classrooms. Energy Build. 2012, 47, 540–549. [Google Scholar] [CrossRef]
- Yang, J.; Nam, I.; Yun, H.; Kim, J.; Oh, H.-J.; Lee, D.; Jeon, S.-M.; Yoo, S.-H.; Sohn, J.-R. Characteristics of indoor air quality at urban elementary schools in Seoul, Korea: Assessment of effect of surrounding environments. Atmospheric Pollut. Res. 2015, 6, 1113–1122. [Google Scholar] [CrossRef]
- Shendell, D.G.; Prill, R.; Fisk, W.J.; Apte, M.G.; Blake, D.; Faulkner, D. Associations between classroom CO2 concentrations and student attendance in Washington and Idaho. Indoor Air 2004, 14, 333–341. [Google Scholar] [CrossRef]
- Morawska, L.; Tang, J.W.; Bahnfleth, W.; Bluyssen, P.M.; Boerstra, A.; Buonanno, G.; Cao, J.; Dancer, S.; Floto, A.; Franchimon, F.; et al. How can airborne transmission of COVID-19 indoors be minimised? Environ. Int. 2020, 142, 105832. [Google Scholar] [CrossRef]
- Zellweger, C.; Emmenegger, L.; Firdaus, M.; Hatakka, J.; Heimann, M.; Kozlova, E.; Spain, T.G.; Steinbächer, M.; Van Der Schoot, M.V.; Buchmann, B. Assessment of recent advances in measurement techniques for atmospheric carbon dioxide and methane observations. Atmos. Meas. Tech. 2016, 9, 4737–4757. [Google Scholar] [CrossRef]
- Institute of Clean Air Companies. White Paper: Monitoring of HCl; Institute of Clean Air Companies: Arlington, VA, USA, 2013. [Google Scholar]
- Tarsa, P.B.; Lehmann, K.K. Cavity Ring-down biosensing. In Optical Biosensors; Elsevier BV: Amsterdam, The Netherlands, 2008; pp. 403–418. [Google Scholar]
- Wang, J.; Tian, X.; Dong, Y.; Zhu, G.; Chen, J.; Tan, T.; Liu, K.; Chen, W.; Gao, X. Enhancing off-axis integrated cavity output spectroscopy (OA-ICOS) with radio frequency white noise for gas sensing. Opt. Express 2019, 27, 30517–30529. [Google Scholar] [CrossRef]
- Chakraborty, N.; Mukherjee, I.; Santra, A.; Chowdhury, S.; Bhattacharya, S.; Mitra, A.; Sharma, C.; Chakraborty, S. Measurement of CO2, CO, SO2, and NO emissions from coal-based thermal power plants in India. Atmos. Environ. 2008, 42, 1073–1082. [Google Scholar] [CrossRef]
- Wang, X.; Rödjegård, H.; Oelmann, B.; Martin, H.; Larsson, B. High performance CO2 measurement based on pressure modulation. Procedia Eng. 2010, 5, 1208–1211. [Google Scholar] [CrossRef]
- Mayrwöger, J.; Reichl, W.; Hauer, P.; Krutzler, C.; Jakoby, B. CO2 monitoring using a simple Fabry–Perot-based germanium bolometer. Sens. Actuators B Chem. 2011, 154, 245–250. [Google Scholar] [CrossRef]
- Park, J.; Cho, H.; Yi, S. NDIR CO2 gas sensor with improved temperature compensation. Procedia Eng. 2010, 5, 303–306. [Google Scholar] [CrossRef]
- Sun, Y.; Liu, C.; Chan, K.L.; Xie, P.H.; Liu, W.Q.; Zeng, Y.; Wang, S.M.; Huang, S.H.; Chen, J.; Wang, Y.P.; et al. Stack emission monitoring using non-dispersive infrared spectroscopy with an optimized nonlinear absorption cross interference correction algorithm. Atmos. Meas. Tech. 2013, 6, 1993–2005. [Google Scholar] [CrossRef]
- Vincent, T.; Gardner, J. A low cost MEMS based NDIR system for the monitoring of carbon dioxide in breath analysis at ppm levels. Sens. Actuators B Chem. 2016, 236, 954–964. [Google Scholar] [CrossRef]
- Hodgkinson, J.; Smith, R.; Ho, W.O.; Saffell, J.R.; Tatam, R. Non-dispersive infra-red (NDIR) measurement of carbon dioxide at 4.2μm in a compact and optically efficient sensor. Sens. Actuators B Chem. 2013, 186, 580–588. [Google Scholar] [CrossRef]
- Stuart, B. Infrared Spectroscopy. In Kirk-Othmer Encyclopedia of Chemical Technology; Wiley: Hoboken, NJ, USA, 2005. [Google Scholar]
- Wong, J.Y.; Anderson, R.L. Non-Dispersive Infrared Gas Measurement; Ifsa Publishing: Barcelona, Spain, 2012; ISBN 9788461597321. [Google Scholar]
- Hanlan, J.; Skoog, D.A.; West, D.M. Principles of Instrumental Analysis. Stud. Conserv. 1973, 18, 45. [Google Scholar] [CrossRef]
- Rogalski, A. Infrared Detectors, 2nd ed.; CRC Press Taylor & Francis Group: Oxfordshire, UK, 2011; ISBN 78-1-4200-7671-4. [Google Scholar]
- Wright, J.; Lillesand, T.M.; Kiefer, R.W. Remote Sensing and Image Interpretation. Geogr. J. 1980, 146, 448. [Google Scholar] [CrossRef]
- Sklorz, A.; Schafer, A.; Lang, W. Merging ethylene NDIR gas sensors with preconcentrator-devices for sensitivity enhancement. Procedia Eng. 2010, 5, 1192–1195. [Google Scholar] [CrossRef]
- Sklorz, A.; Schafer, A.; Lang, W. Merging ethylene NDIR gas sensors with preconcentrator-devices for sensitivity enhancement. Sens. Actuators B Chem. 2012, 170, 21–27. [Google Scholar] [CrossRef]
- White, J.U. Long Optical Paths of Large Aperture. J. Opt. Soc. Am. 1942, 32, 285. [Google Scholar] [CrossRef]
- The Korea Ministry of Environment. National Standard Method for Type Approval of Environmental Measurement Device (TM 0202.10); The Ministry of Environment: Sejong, Korea, 2017. Available online: http://www.law.go.kr/admRulLsInfoP.do?admRulSeq=2100000185252#AJAX (accessed on 22 September 2020).
- Dijkstra, A.; Massart, D.L.; Kaufman, L. Evaluation and Optimization of Laboratory Methods and Analytical Procedures, 1st ed.; Elsevier Science: Amsterdam, The Netherlands, 1978; Volume 1, ISBN 9780080875484. [Google Scholar]
- El-Hashemy, M.A.E.-S.A.; Ali, H.M. Characterization of BTEX group of VOCs and inhalation risks in indoor microenvironments at small enterprises. Sci. Total. Environ. 2018, 645, 974–983. [Google Scholar] [CrossRef] [PubMed]
- Dai, X.; Liu, J.; Yin, Y.; Song, X.; Jia, S. Modeling and controlling indoor formaldehyde concentrations in apartments: On-site investigation in all climate zones of China. Build. Environ. 2018, 127, 98–106. [Google Scholar] [CrossRef]
- Sun, Y.; Liu, W.-Q.; Zeng, Y.; Wang, S.-M.; Huang, S.-H.; Xie, P.; Yu, X.-M. Water Vapor Interference Correction in a Non Dispersive Infrared Multi-Gas Analyzer. Chin. Phys. Lett. 2011, 28, 073302. [Google Scholar] [CrossRef]


| Compound | Concentration (ppm, %-CO2) | Maker |
|---|---|---|
| CO | 50, 150, 250, 350, 500 | Rigas Co., Ltd., Daejeon, Republic of Korea |
| NO2 | 50, 150, 250, 350, 500 | Rigas Co., Ltd., Daejeon, Republic of Korea |
| SO2 | 50, 150, 250, 350, 500 | Rigas Co., Ltd., Daejeon, Republic of Korea |
| CO2 | 1.1, 2.3, 5.01, 7.4, 12.2, 17.3, 25 | Rigas Co., Ltd., Daejeon, Republic of Korea |
| BTEX | 20, 60, 100, 180 | Rigas Co., Ltd., Daejeon, Republic of Korea |
| Formaldehyde | 0.5, 1, 3, 5, 7, 9 | Rigas Co., Ltd., Daejeon, Republic of Korea |
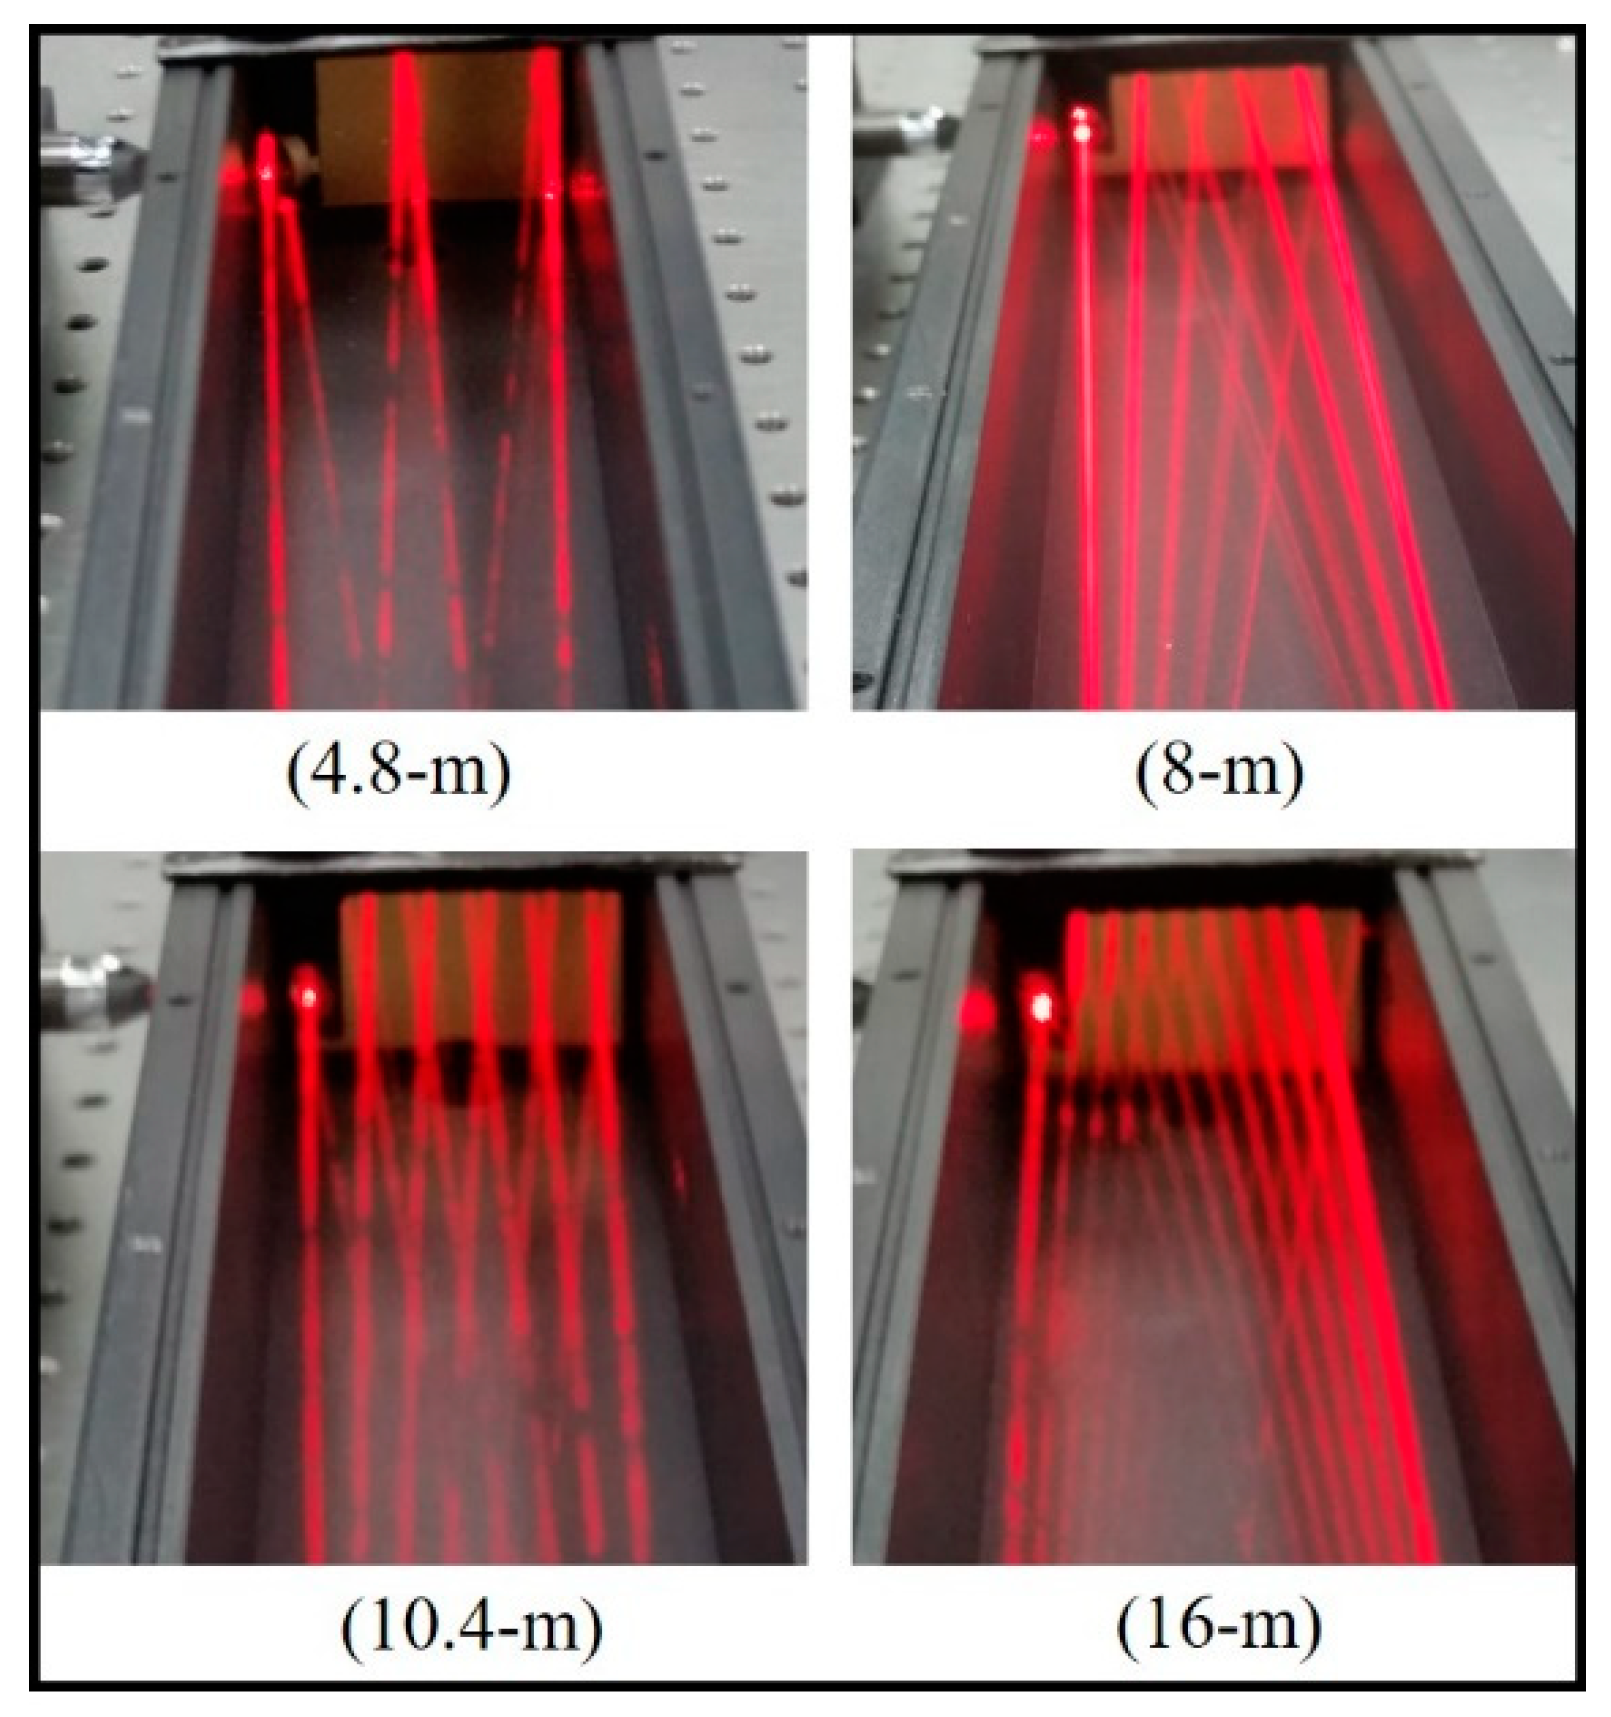
| Pathlength (m) | Lower Detection Limit (ppmv) | Standard Deviation * (ppmv) |
|---|---|---|
| 4.8 | 703 | 1.6 |
| 8.0 | 410 | 1.2 |
| 10.4 | 100 | 0.6 |
| 16.0 | 80 | 0.9 |
| Compound | Percentage Channel | ppmv Channel | ||||
|---|---|---|---|---|---|---|
| Selectivity Coefficient | Linear Regression Curve | r2 | Selectivity Coefficient | Linear Regression Curve | r2 | |
| SO2 | 2.22 × 10⁻⁵ | Y = −1 × 10⁻⁷X + 0.1641 | 0.0489 | 0.0842 | Y = 1.6 × 10⁻⁷X + 0.3316 | 0.0484 |
| NO | 8.89 × 10⁻⁷ | Y = 4 × 10⁻⁹X + 0.1640 | 0.0002 | 0.0578 | Y = 1 × 10⁻⁷X + 0.3316 | 0.0457 |
| NO2 | 1.11 × 10⁻⁵ | Y = −5 × 10⁻⁸X + 0.1640 | 0.0036 | 0.0436 | Y = 8 × 10⁻⁸X + 0.3316 | 0.0420 |
| CO | 2.44 × 10⁻⁵ | Y= 1 × 10⁻⁷X + 0.1641 | 0.9588 | 0.1526 | Y = 2.9 × 10⁻⁷X + 0.3317 | 0.9853 |
| BTEX | 1.11 × 10⁻⁶ | Y = −5 × 10⁻⁹X + 0.1641 | 0.0001 | 0.6315 | Y = 1 × 10⁻⁶X + 0.3314 | 0.1145 |
| Formaldehyde | 7.33 × 10⁻⁴ | Y = 3 × 10⁻⁶X + 0.1640 | 0.2067 | 0.6315 | Y = −1 × 10⁻⁶X + 0.3315 | 0.0001 |
| H2O | 2.44 × 10⁻³ | Y = −1 × 10⁻⁵X + 0.1641 | 0.9198 | 17.894 | Y = −3 × 10⁻⁵X + 0.3317 | 0.9957 |
© 2020 by the authors. Licensee MDPI, Basel, Switzerland. This article is an open access article distributed under the terms and conditions of the Creative Commons Attribution (CC BY) license (http://creativecommons.org/licenses/by/4.0/).
Share and Cite
Dinh, T.-V.; Lee, J.-Y.; Ahn, J.-W.; Kim, J.-C. Development of a Wide-Range Non-Dispersive Infrared Analyzer for the Continuous Measurement of CO2 in Indoor Environments. Atmosphere 2020, 11, 1024. https://doi.org/10.3390/atmos11101024
Dinh T-V, Lee J-Y, Ahn J-W, Kim J-C. Development of a Wide-Range Non-Dispersive Infrared Analyzer for the Continuous Measurement of CO2 in Indoor Environments. Atmosphere. 2020; 11(10):1024. https://doi.org/10.3390/atmos11101024
Chicago/Turabian StyleDinh, Trieu-Vuong, Joo-Yeon Lee, Ji-Won Ahn, and Jo-Chun Kim. 2020. "Development of a Wide-Range Non-Dispersive Infrared Analyzer for the Continuous Measurement of CO2 in Indoor Environments" Atmosphere 11, no. 10: 1024. https://doi.org/10.3390/atmos11101024
APA StyleDinh, T.-V., Lee, J.-Y., Ahn, J.-W., & Kim, J.-C. (2020). Development of a Wide-Range Non-Dispersive Infrared Analyzer for the Continuous Measurement of CO2 in Indoor Environments. Atmosphere, 11(10), 1024. https://doi.org/10.3390/atmos11101024