The Impact of Global Warming on Wind Energy Resources and Ramp Events in Japan


Abstract
1. Introduction
2. Data and Methods
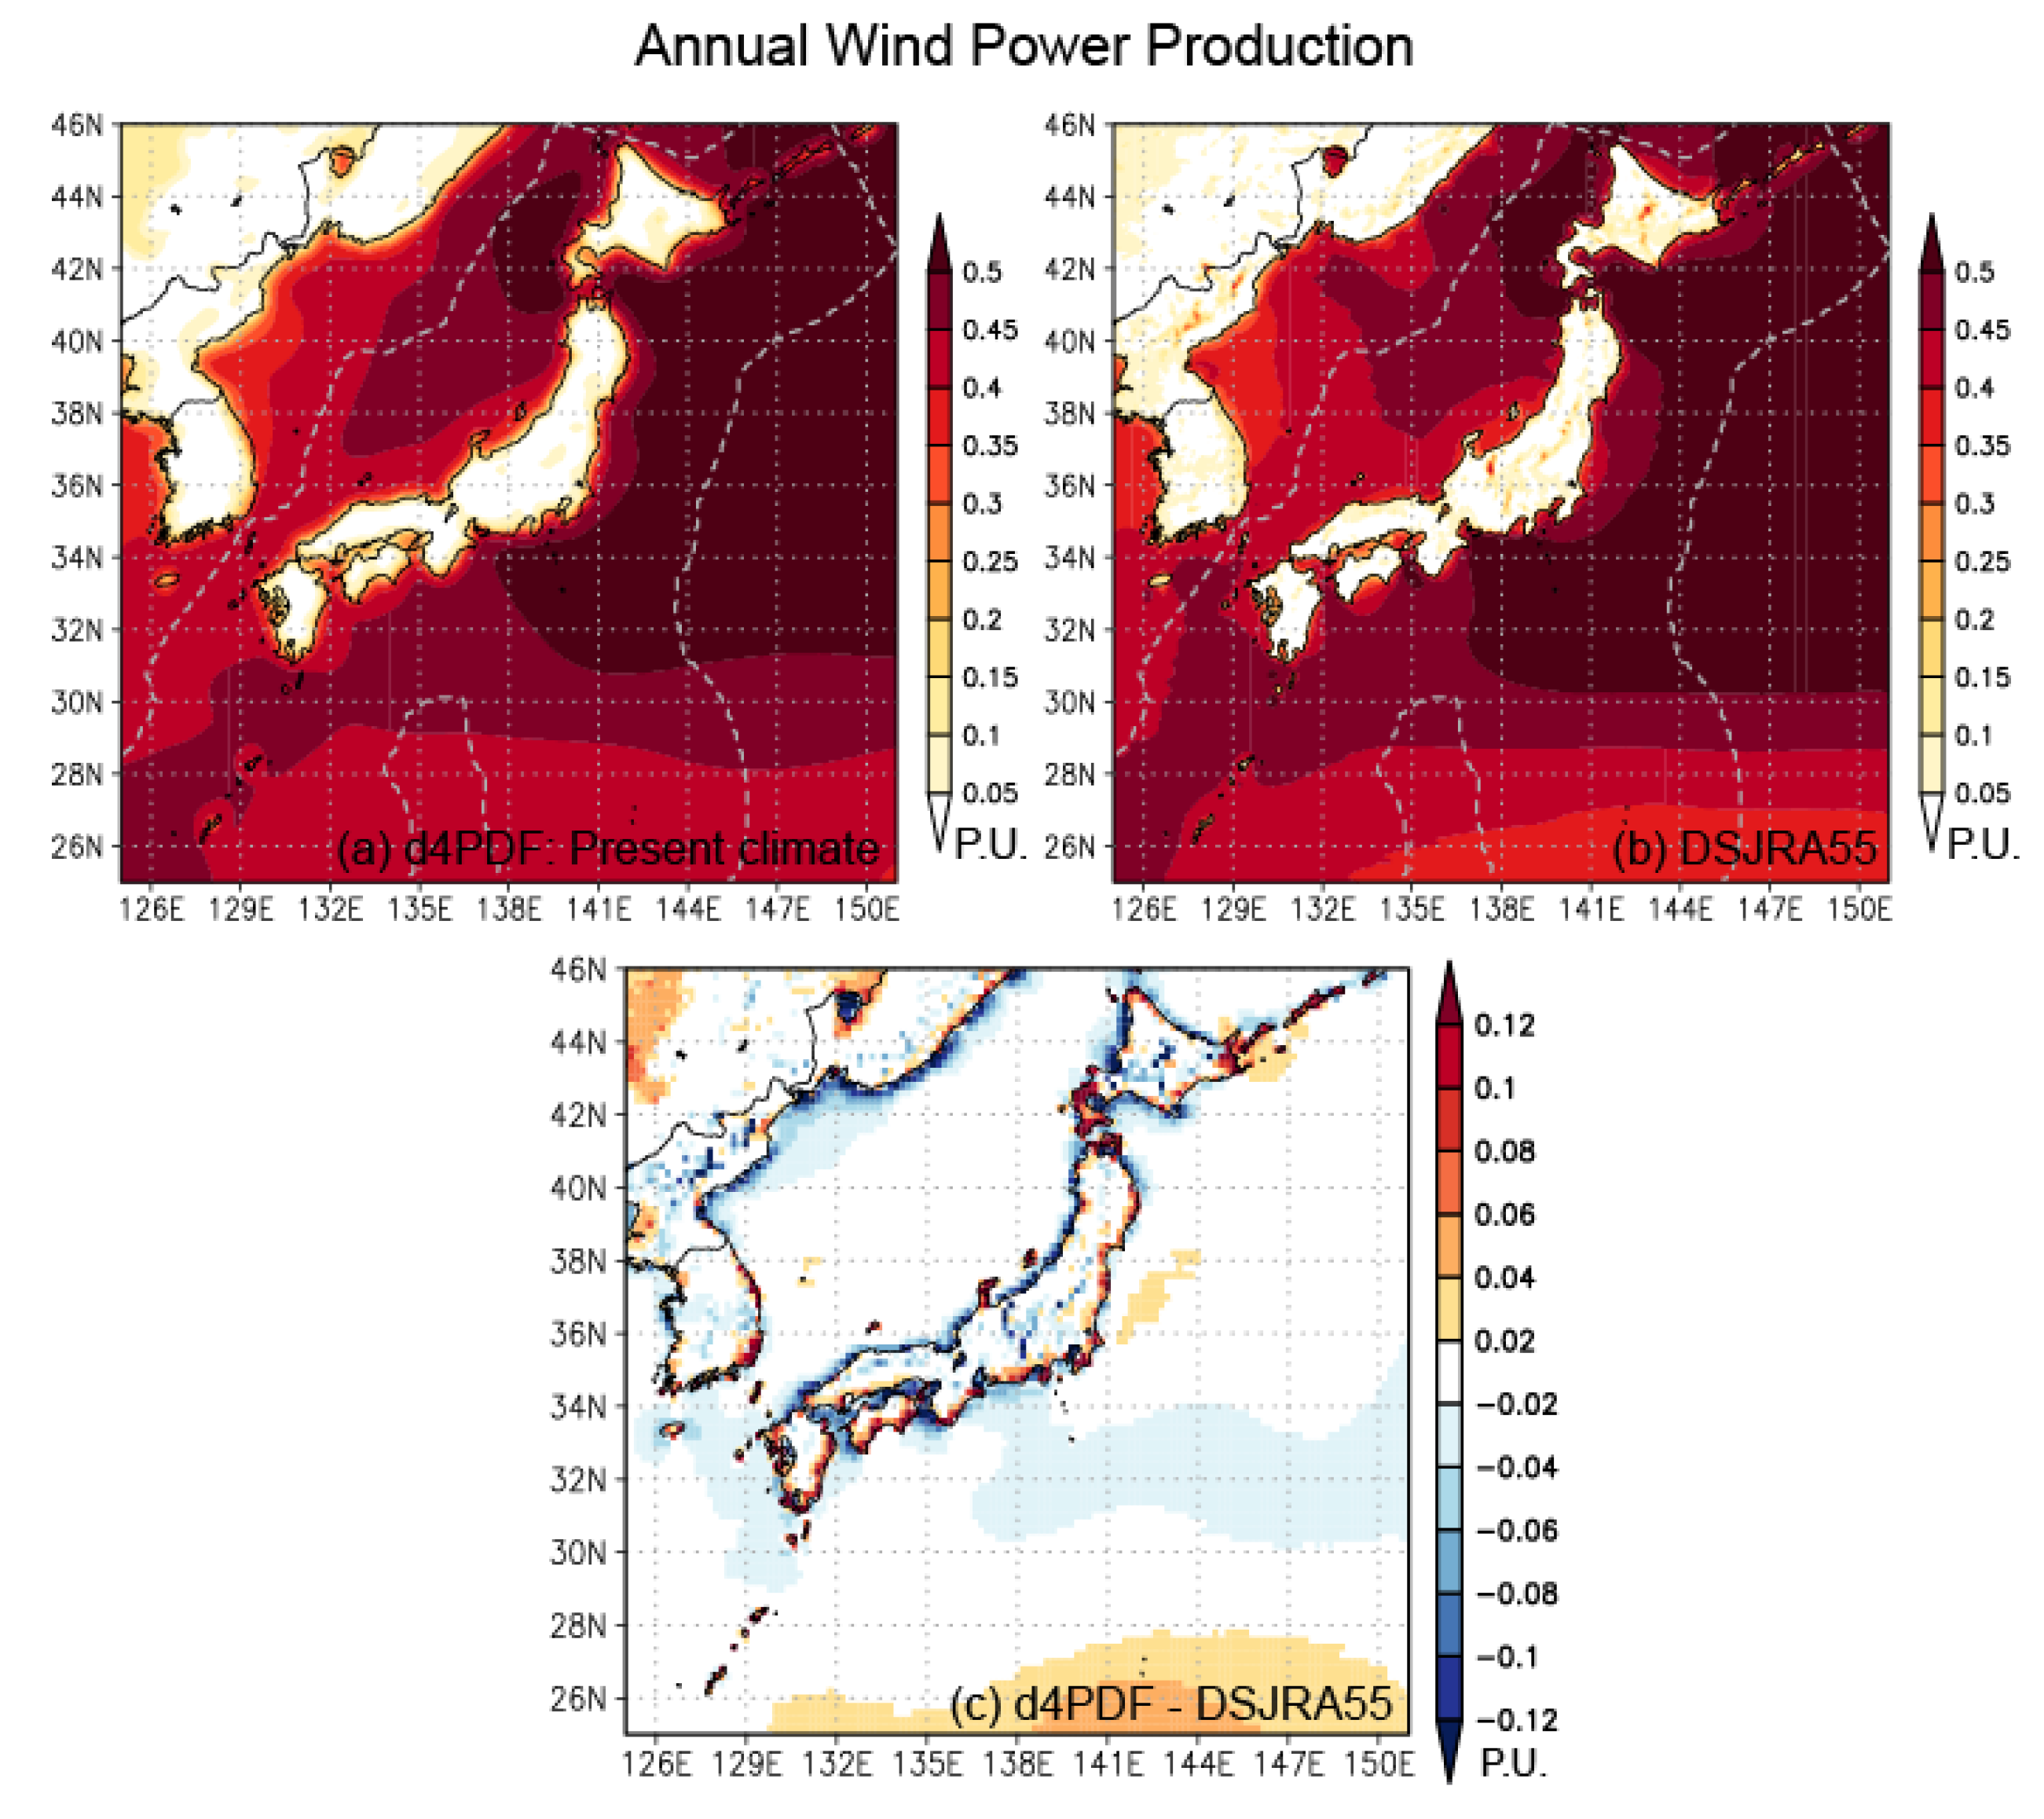
2.1. Data
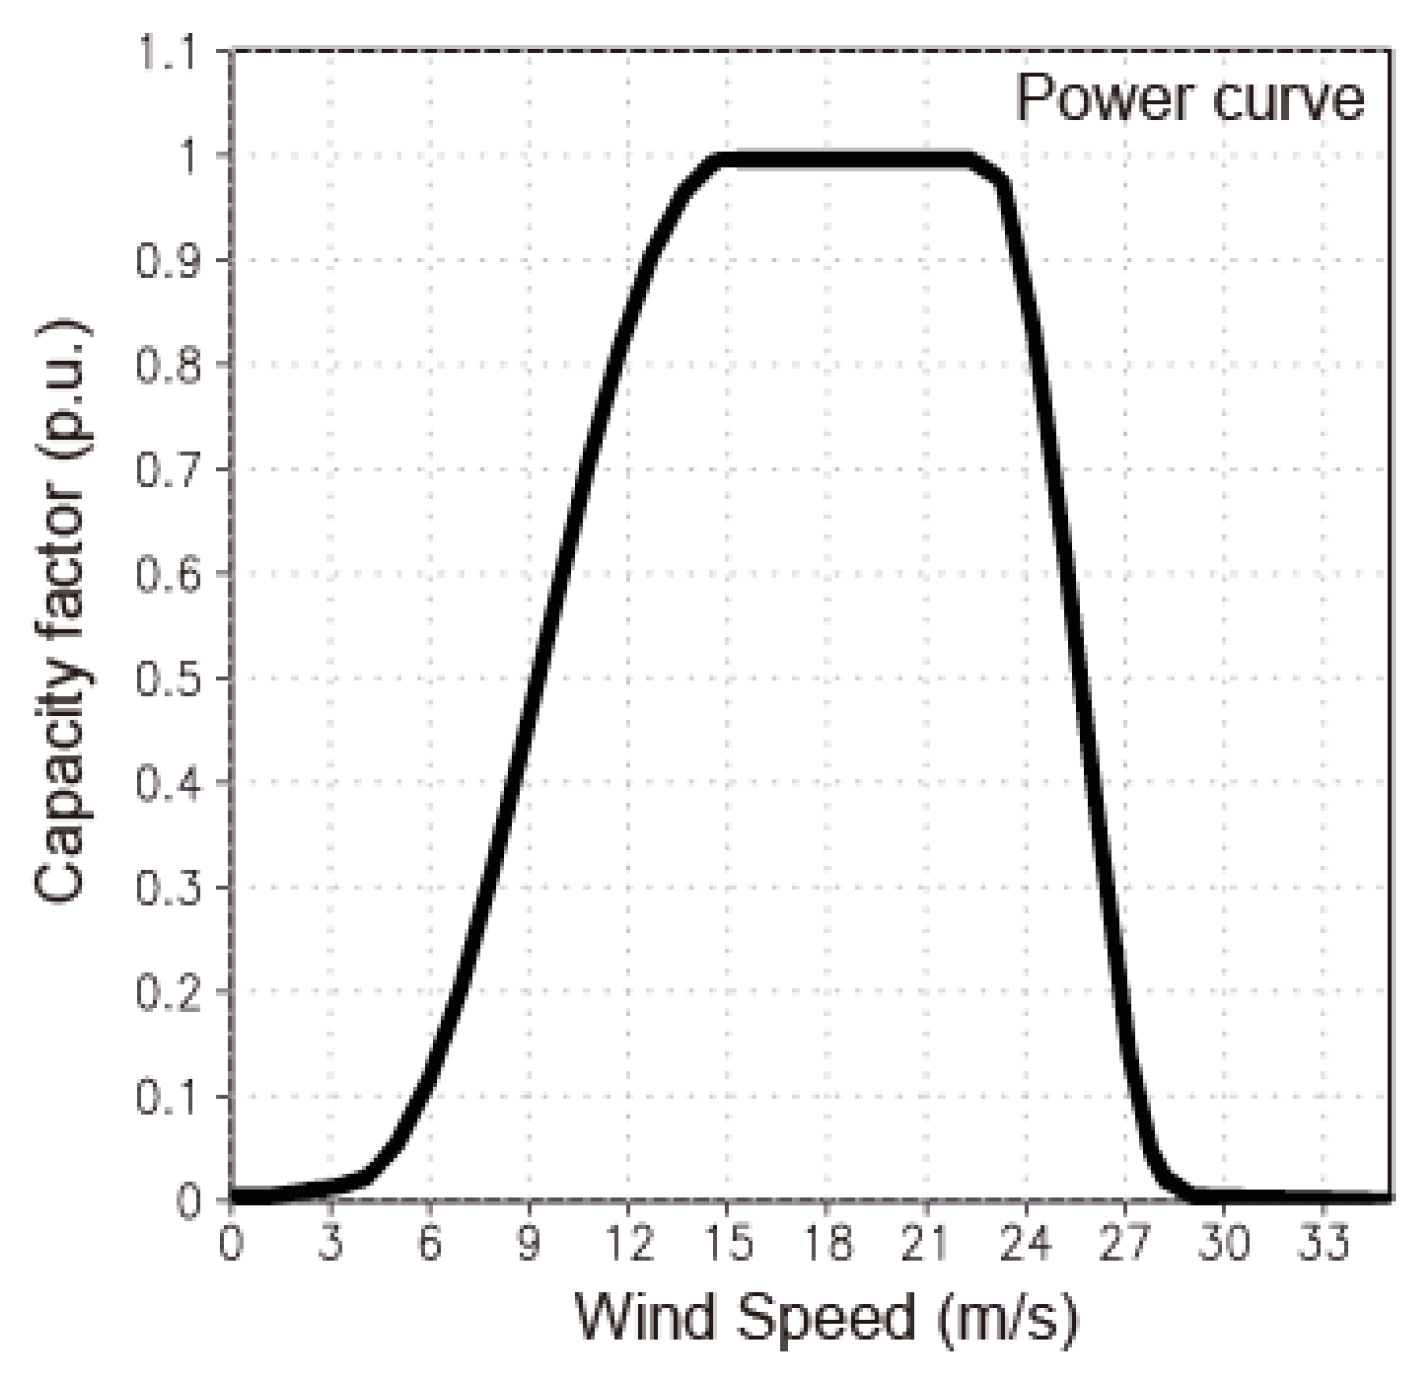
2.2. Power Curve
2.3. Self-Organizing Maps
2.4. Separation of Dynamical and Thermodynamic Contributions by Circulation Analogs
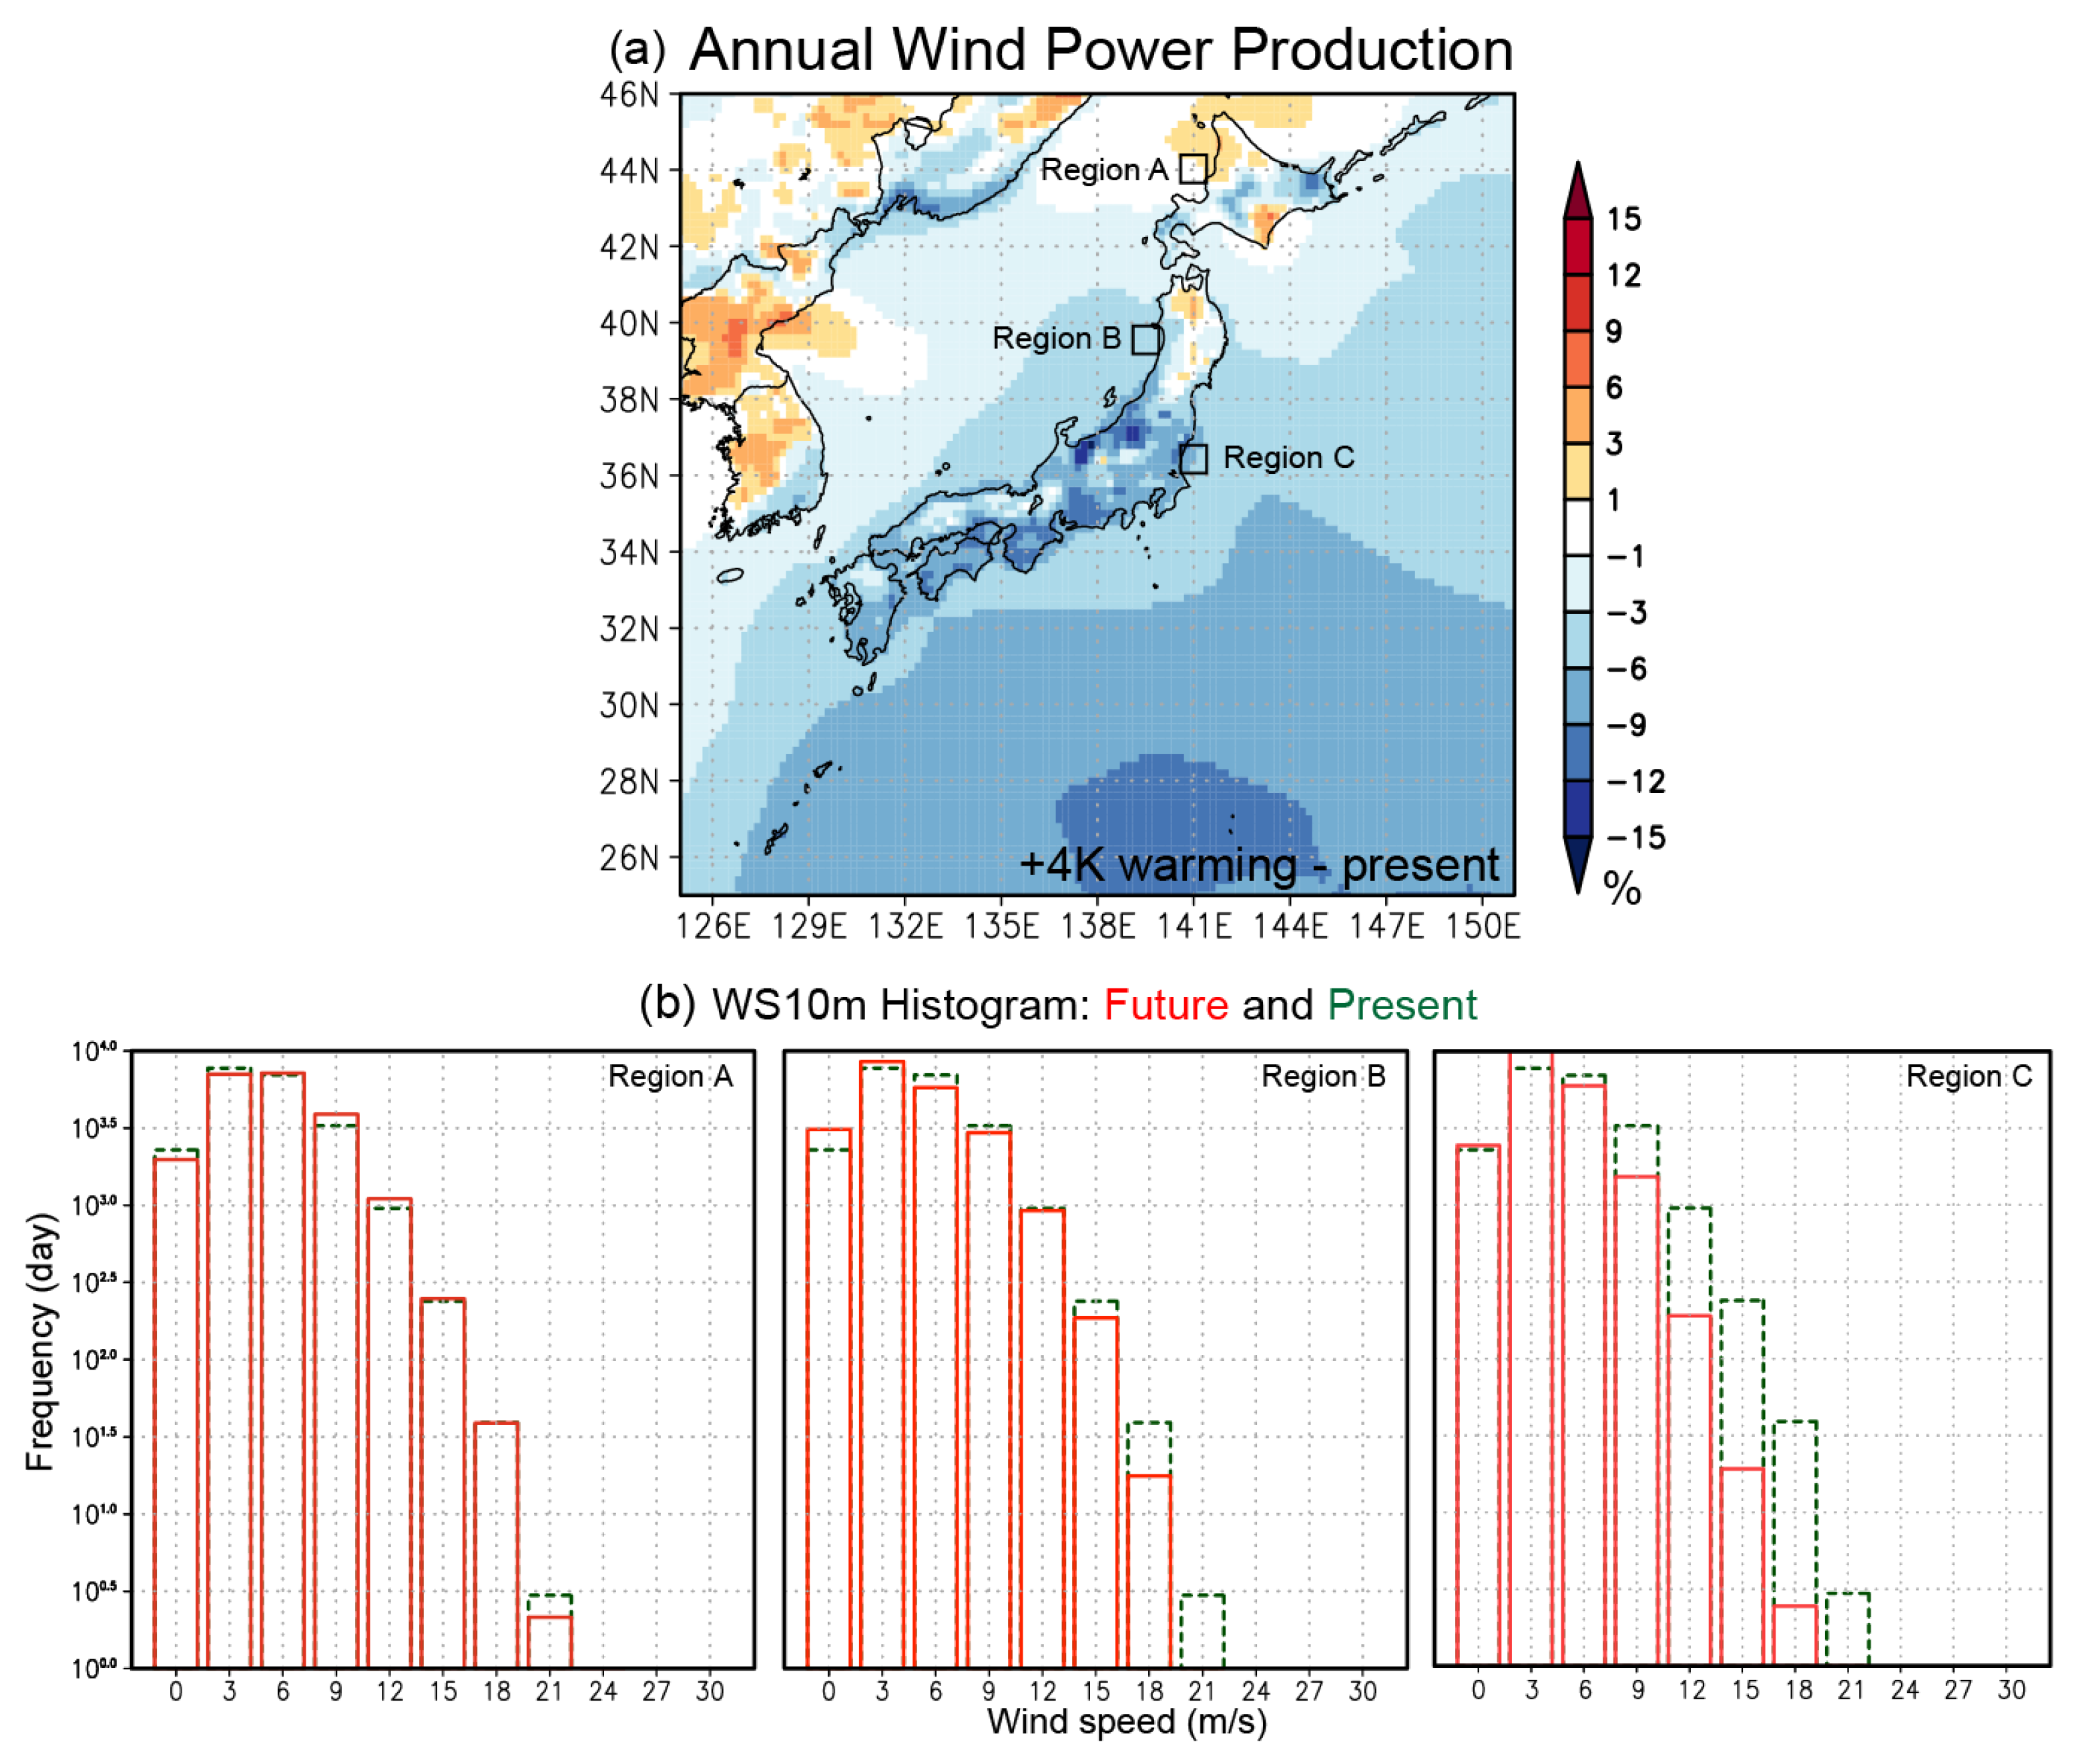
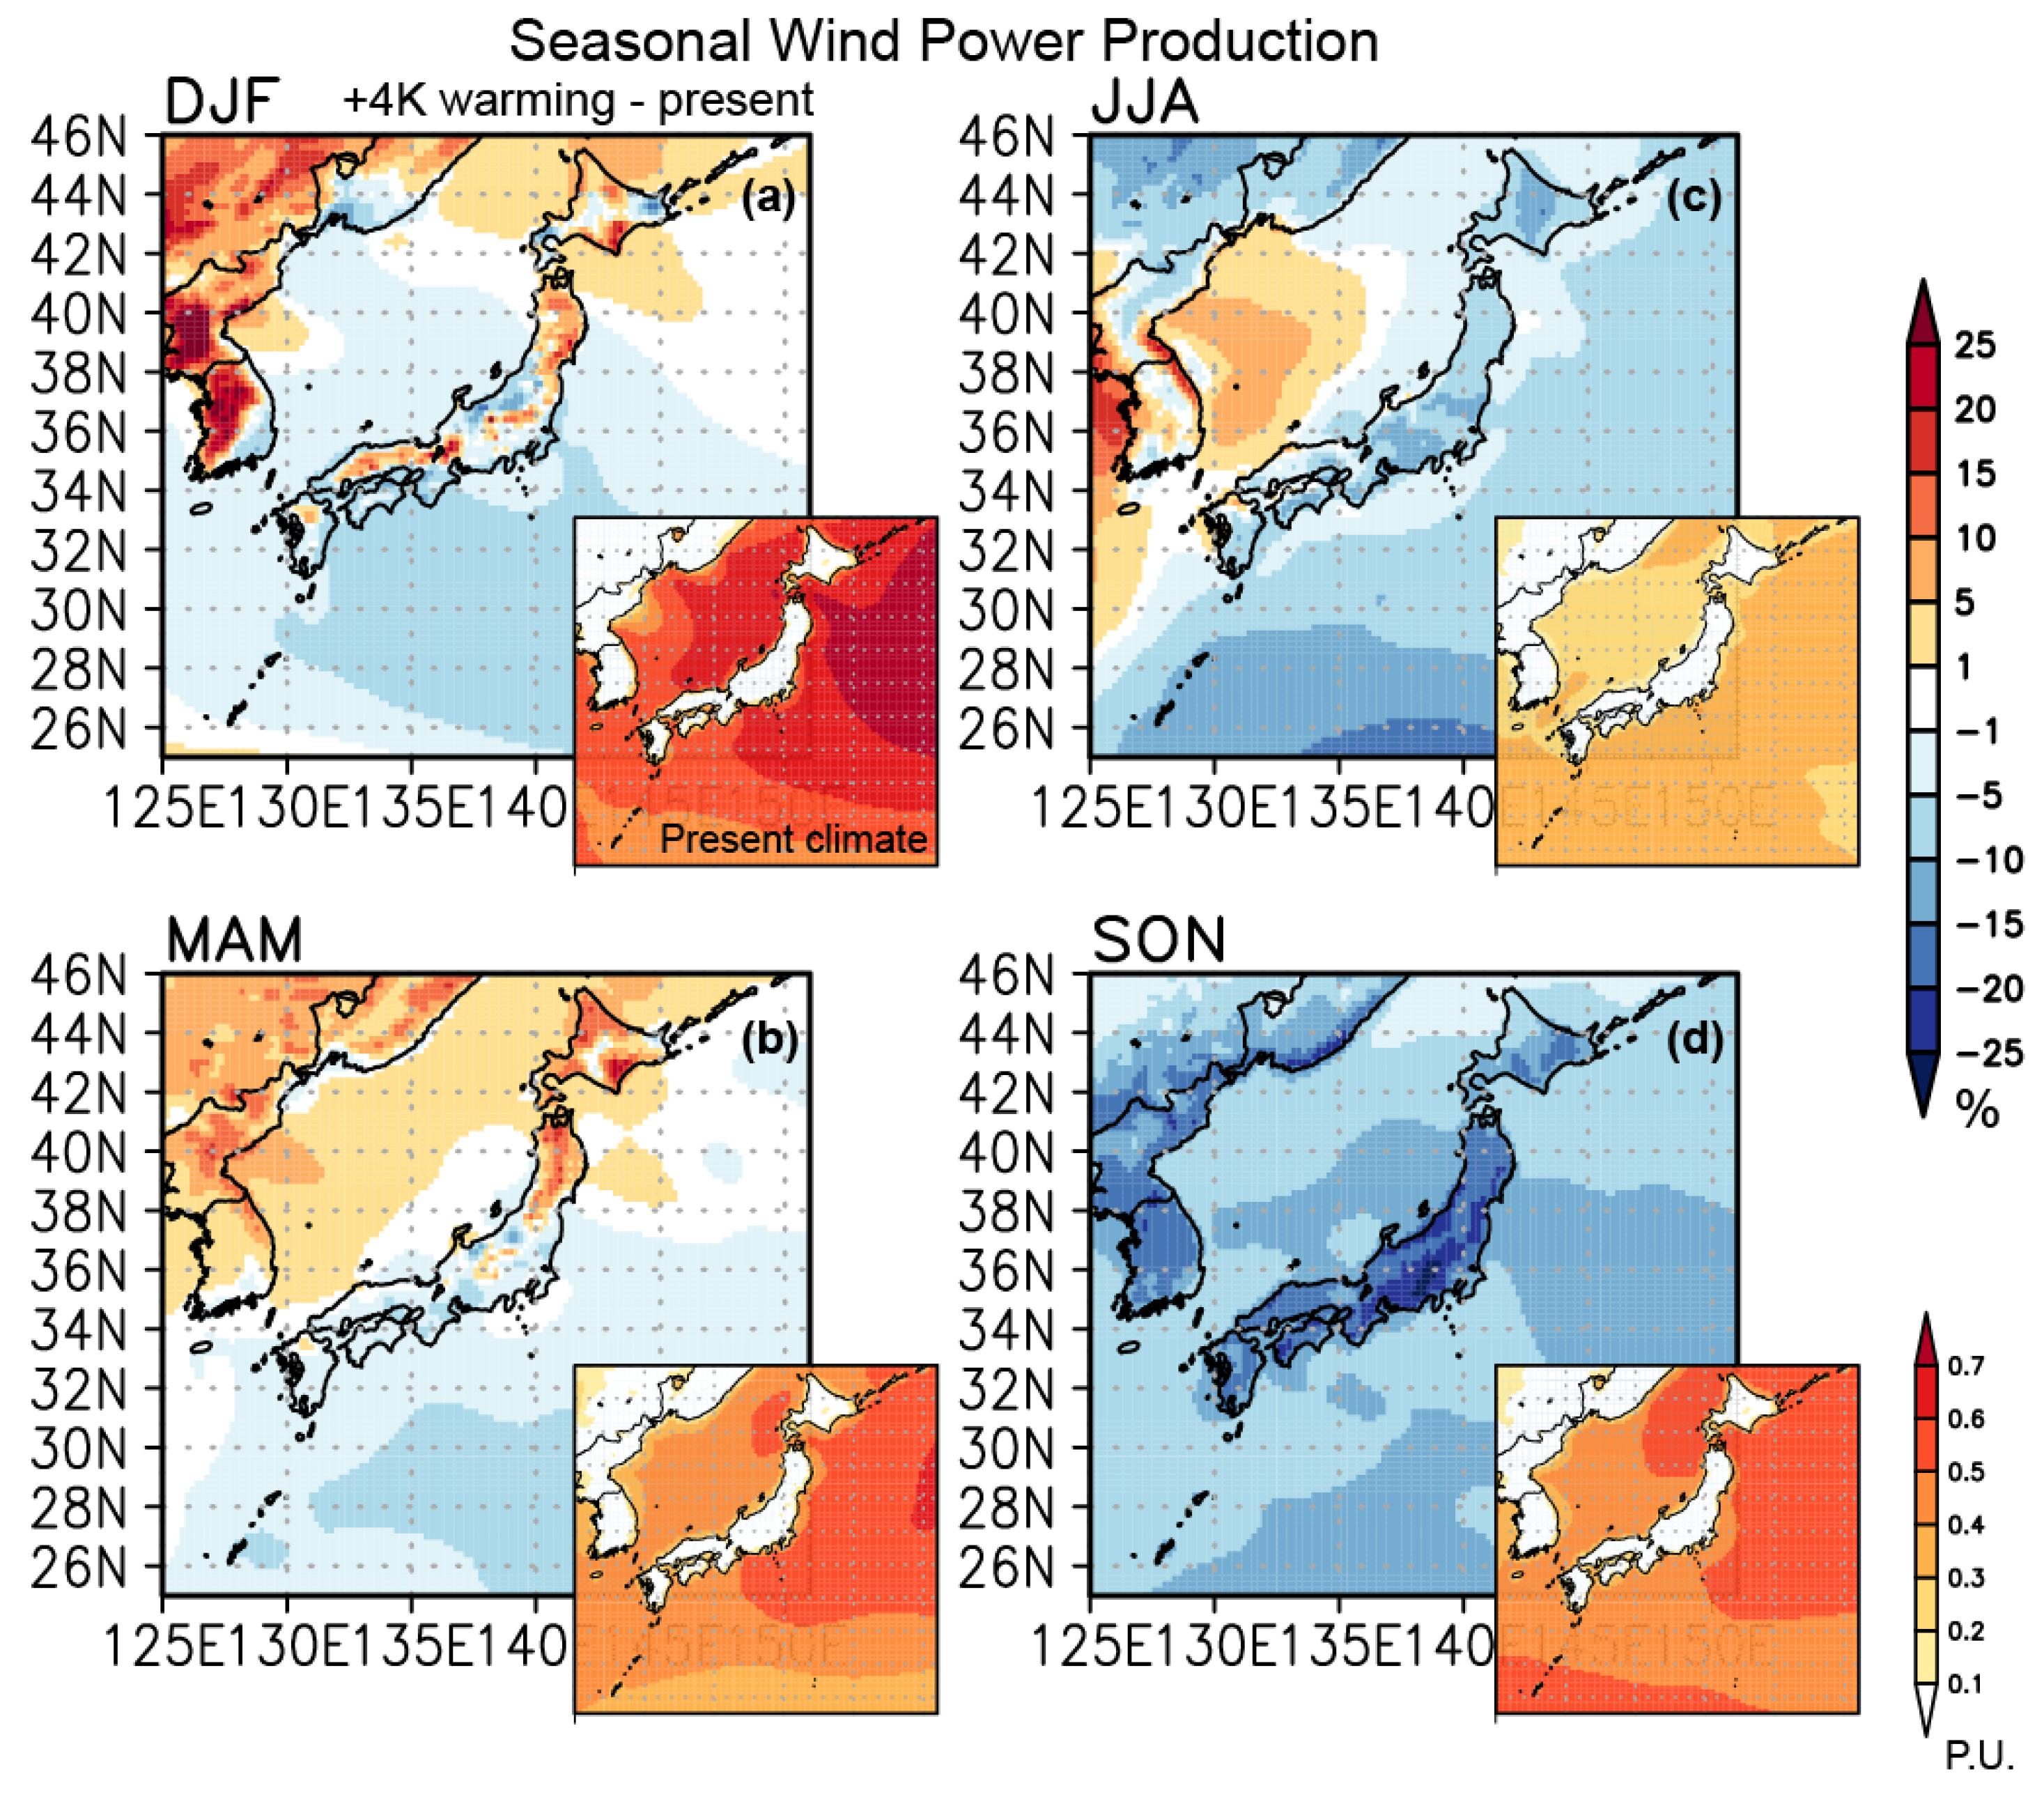
3. Projected Changes in Wind Resources and Ramps in Japan
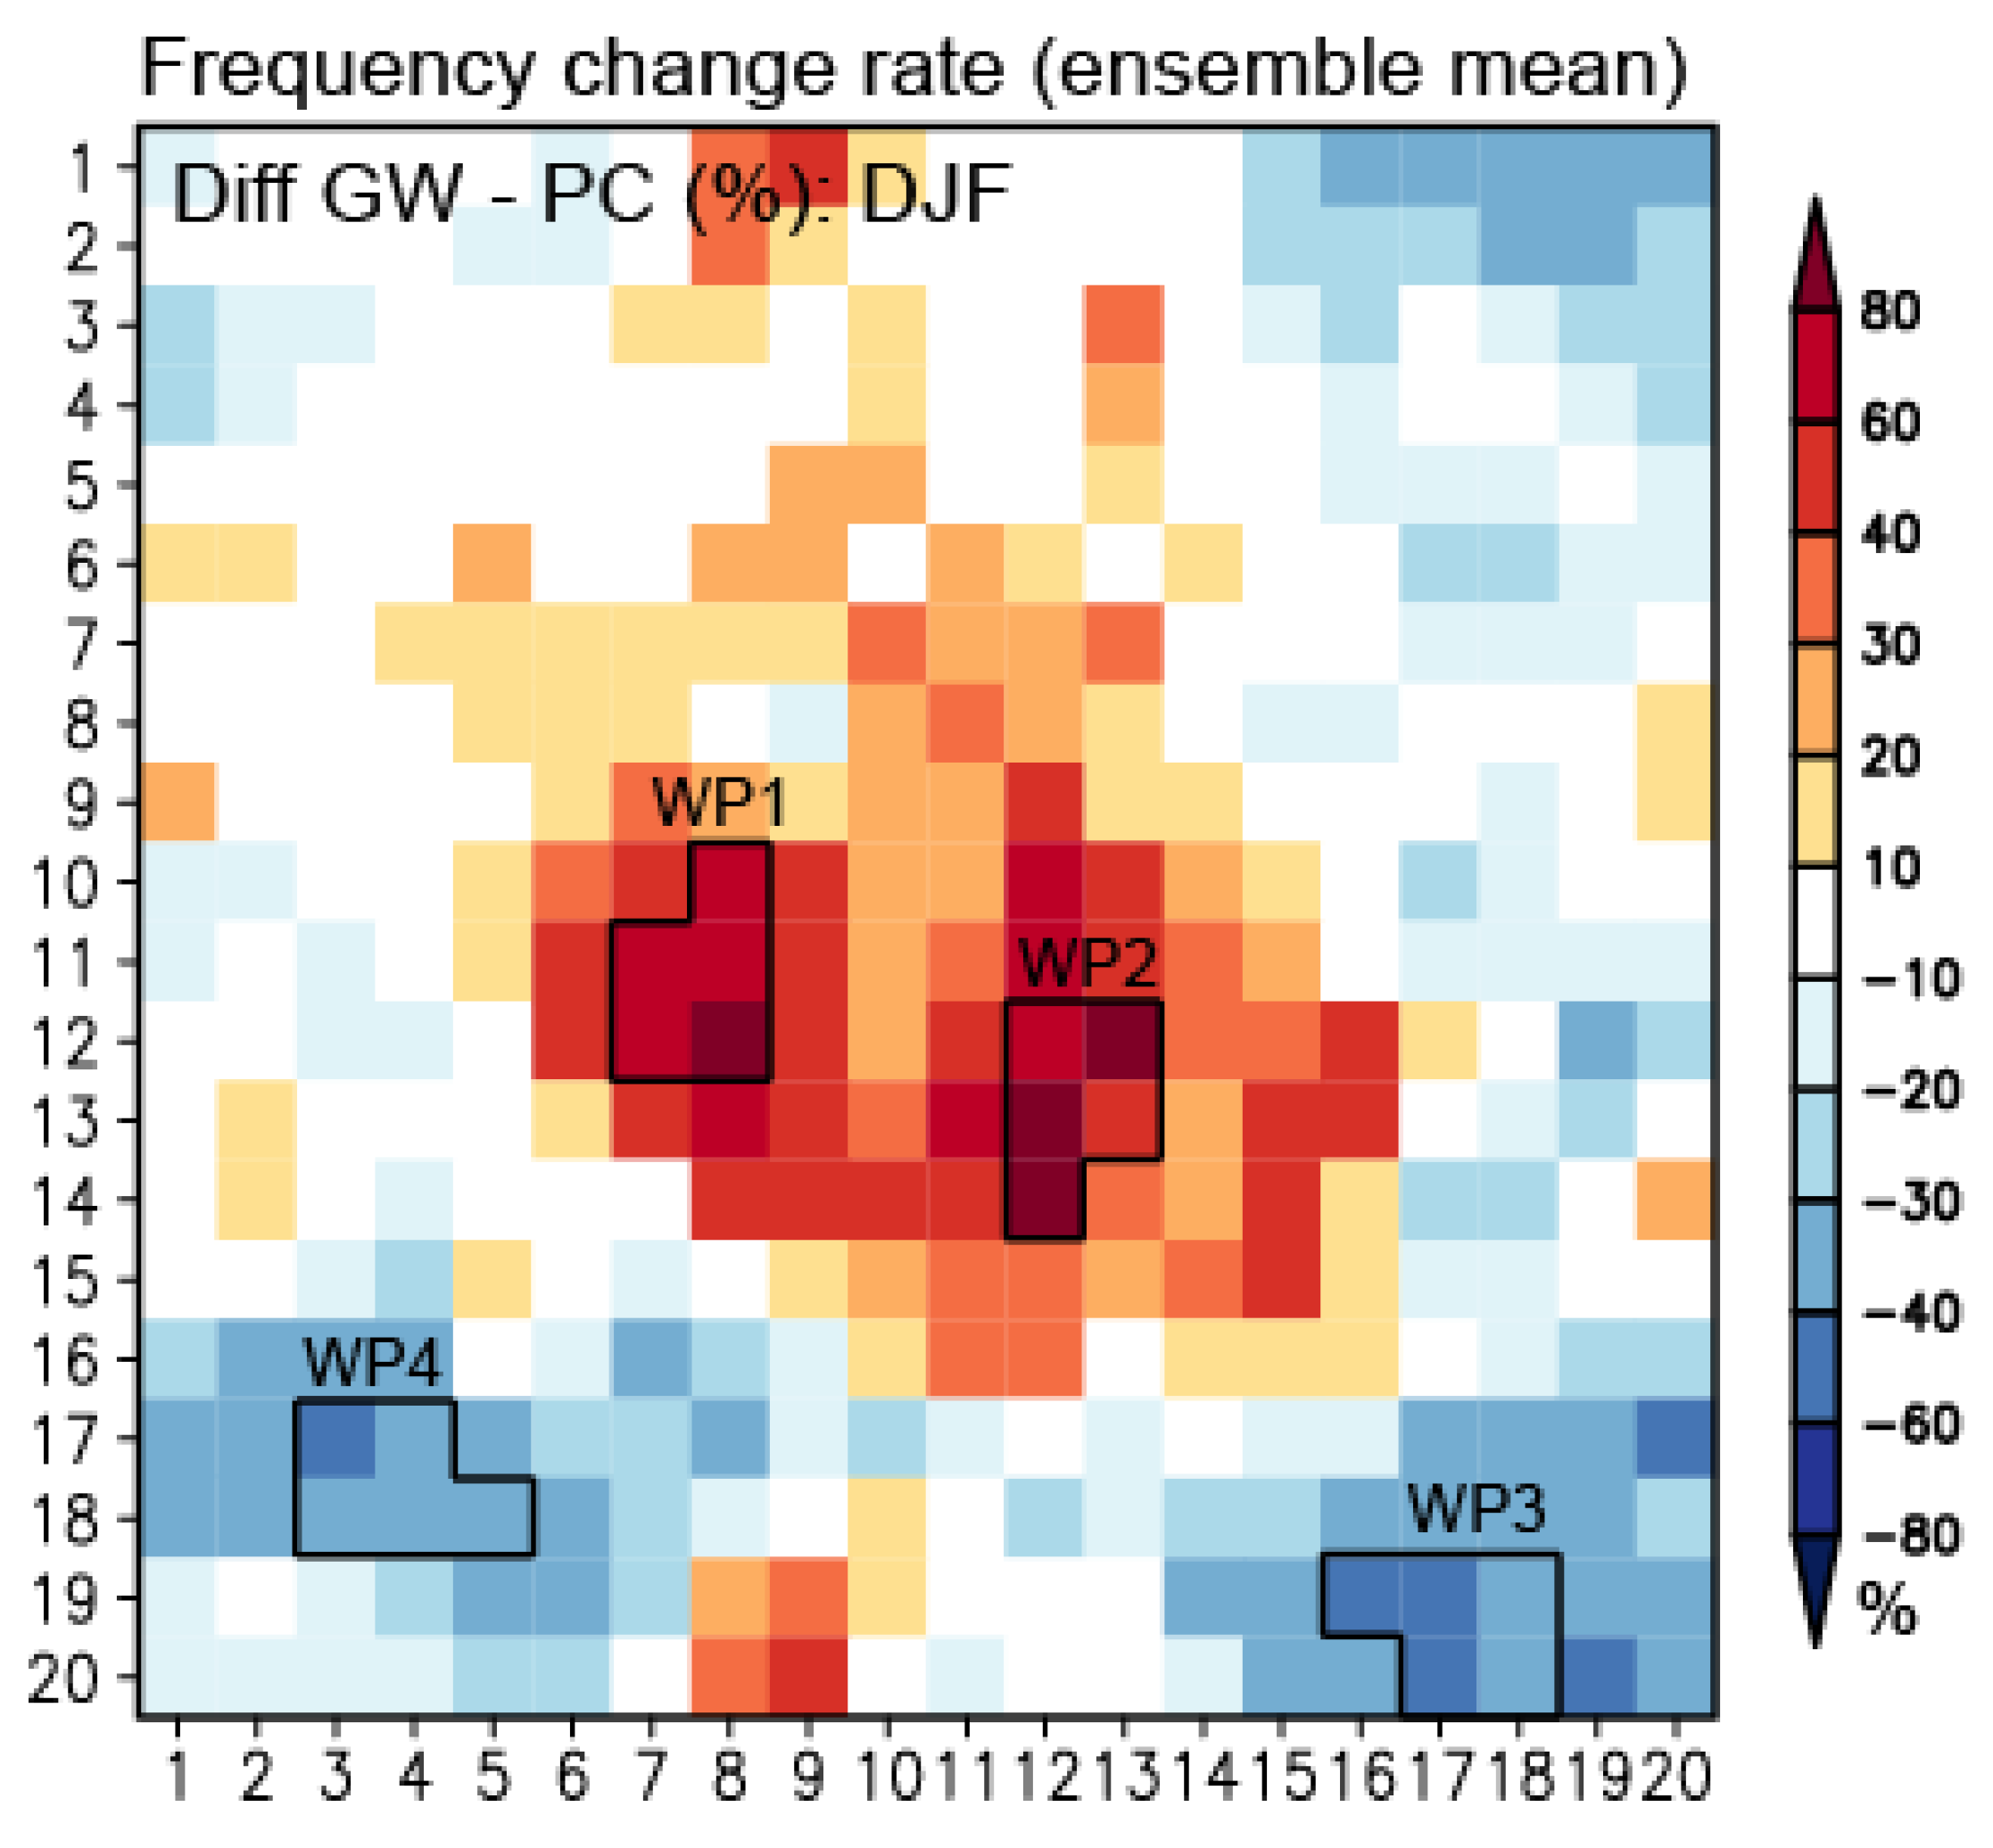
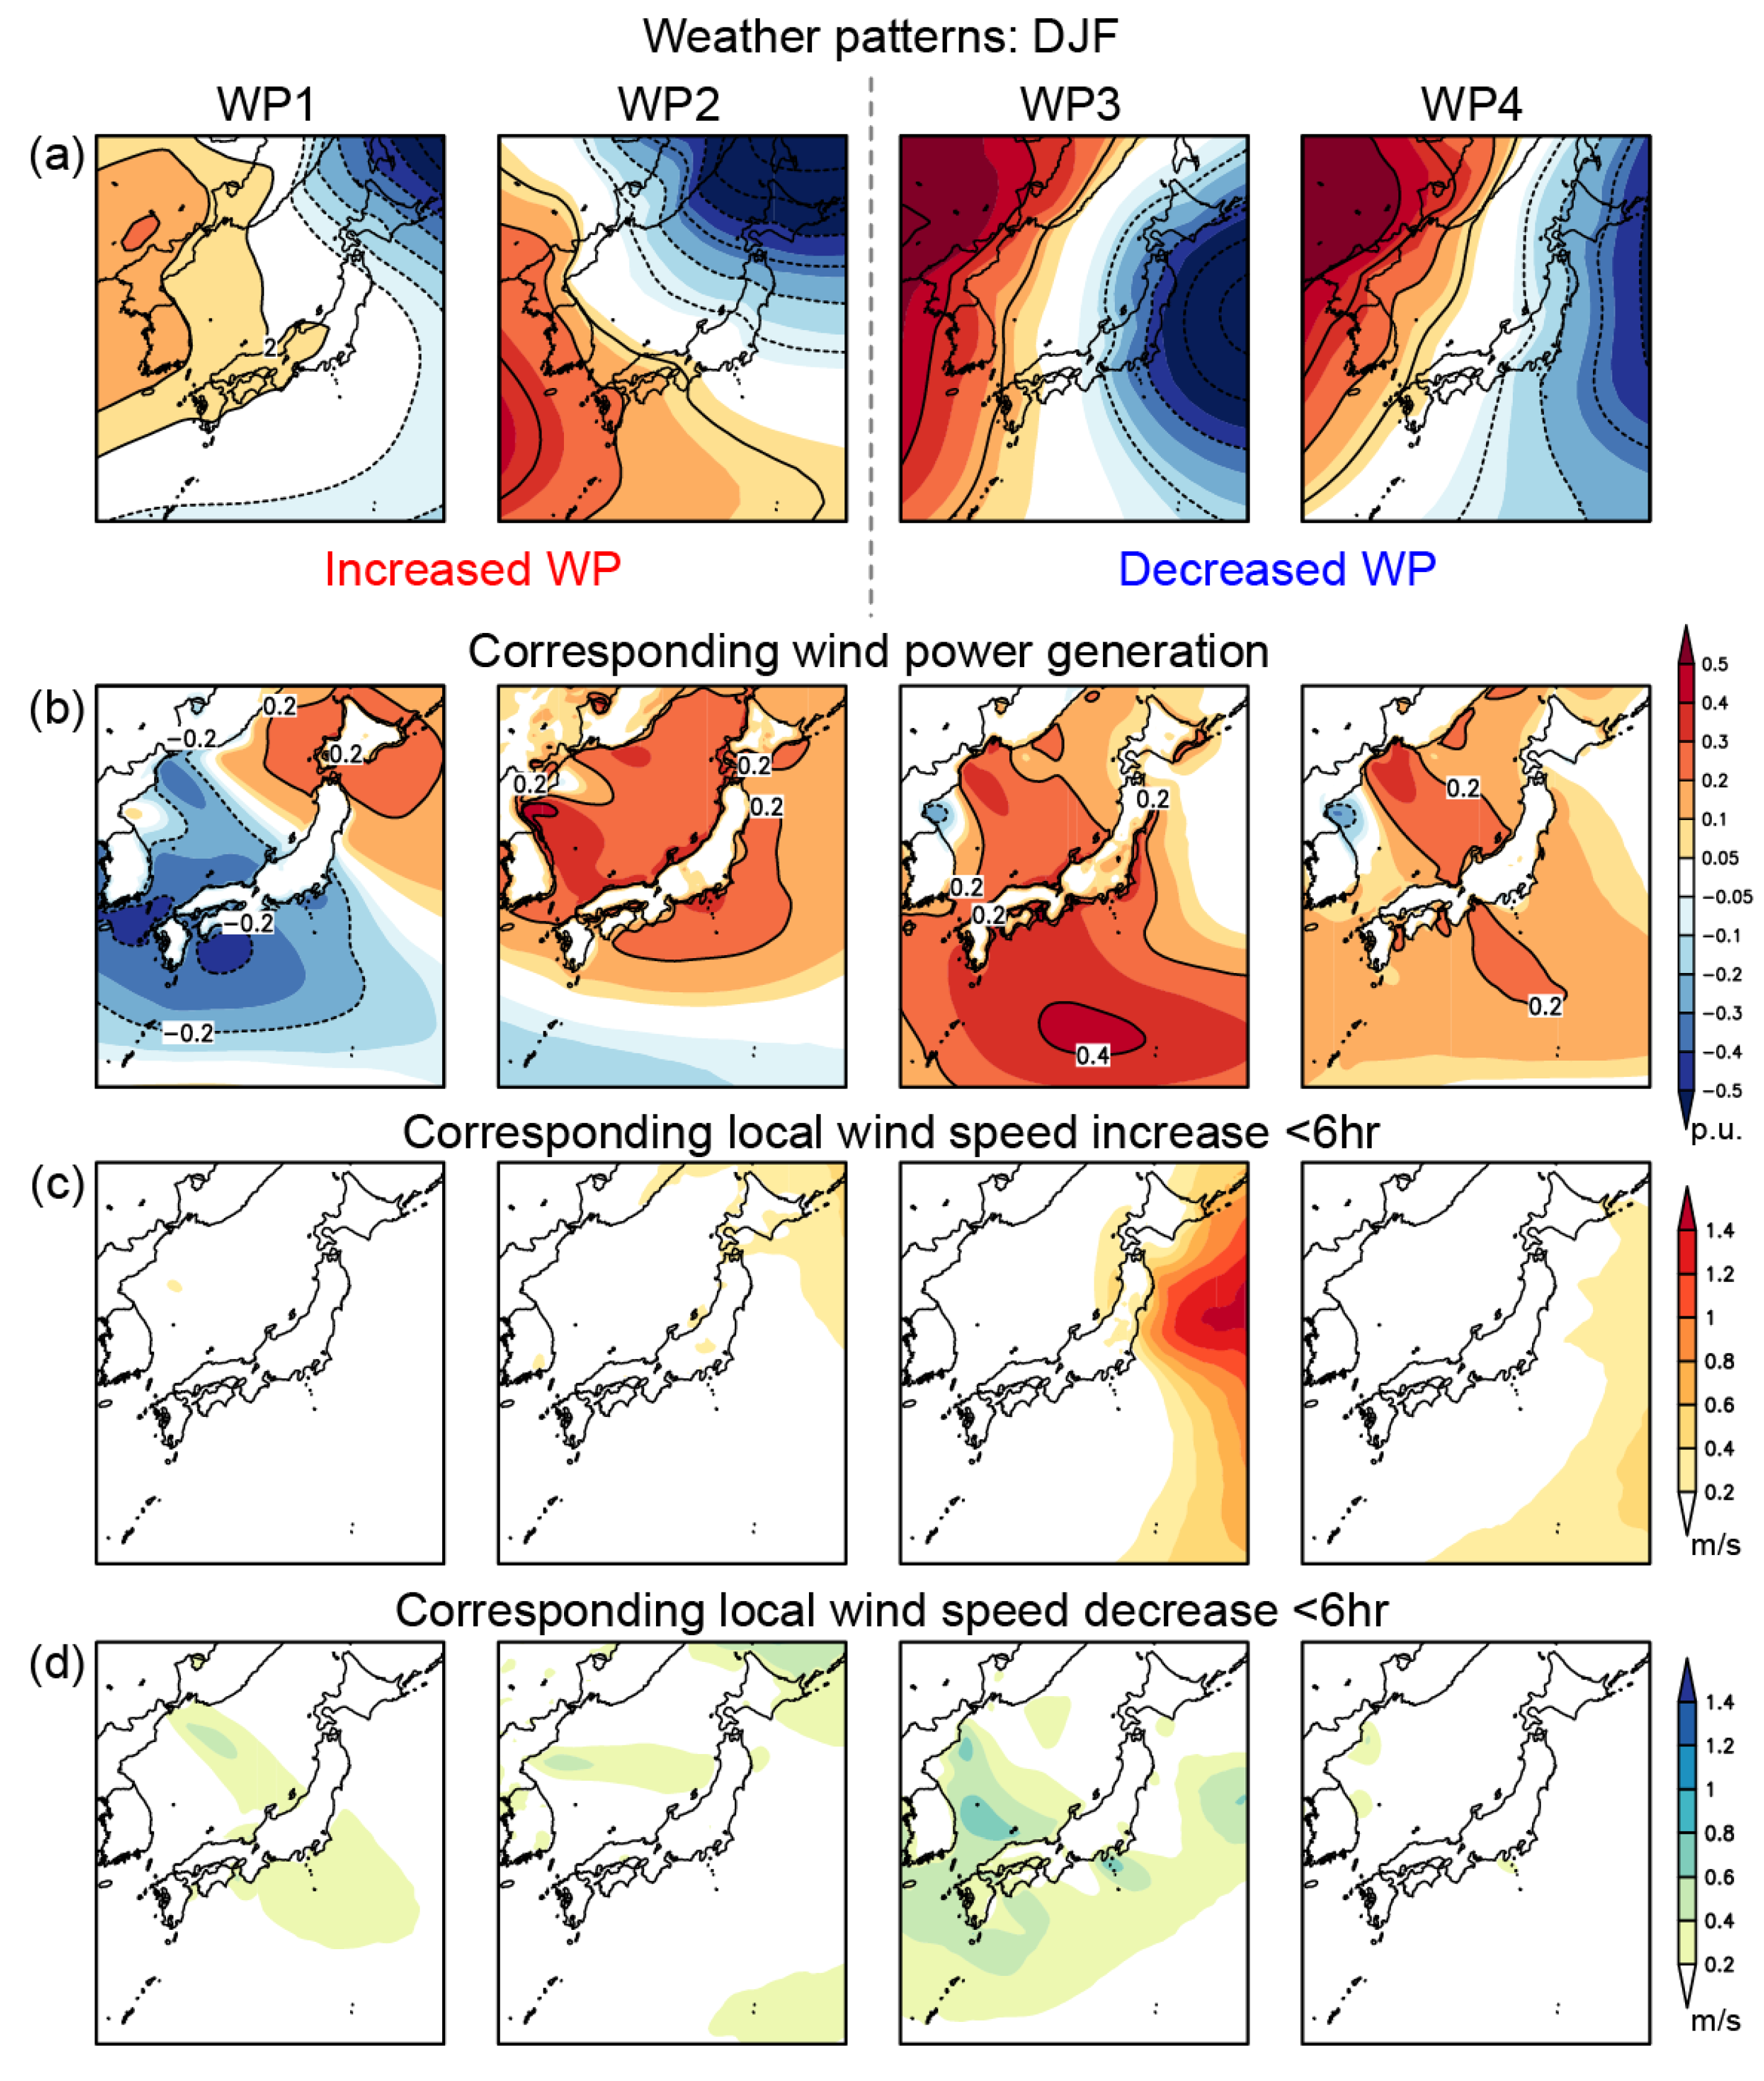
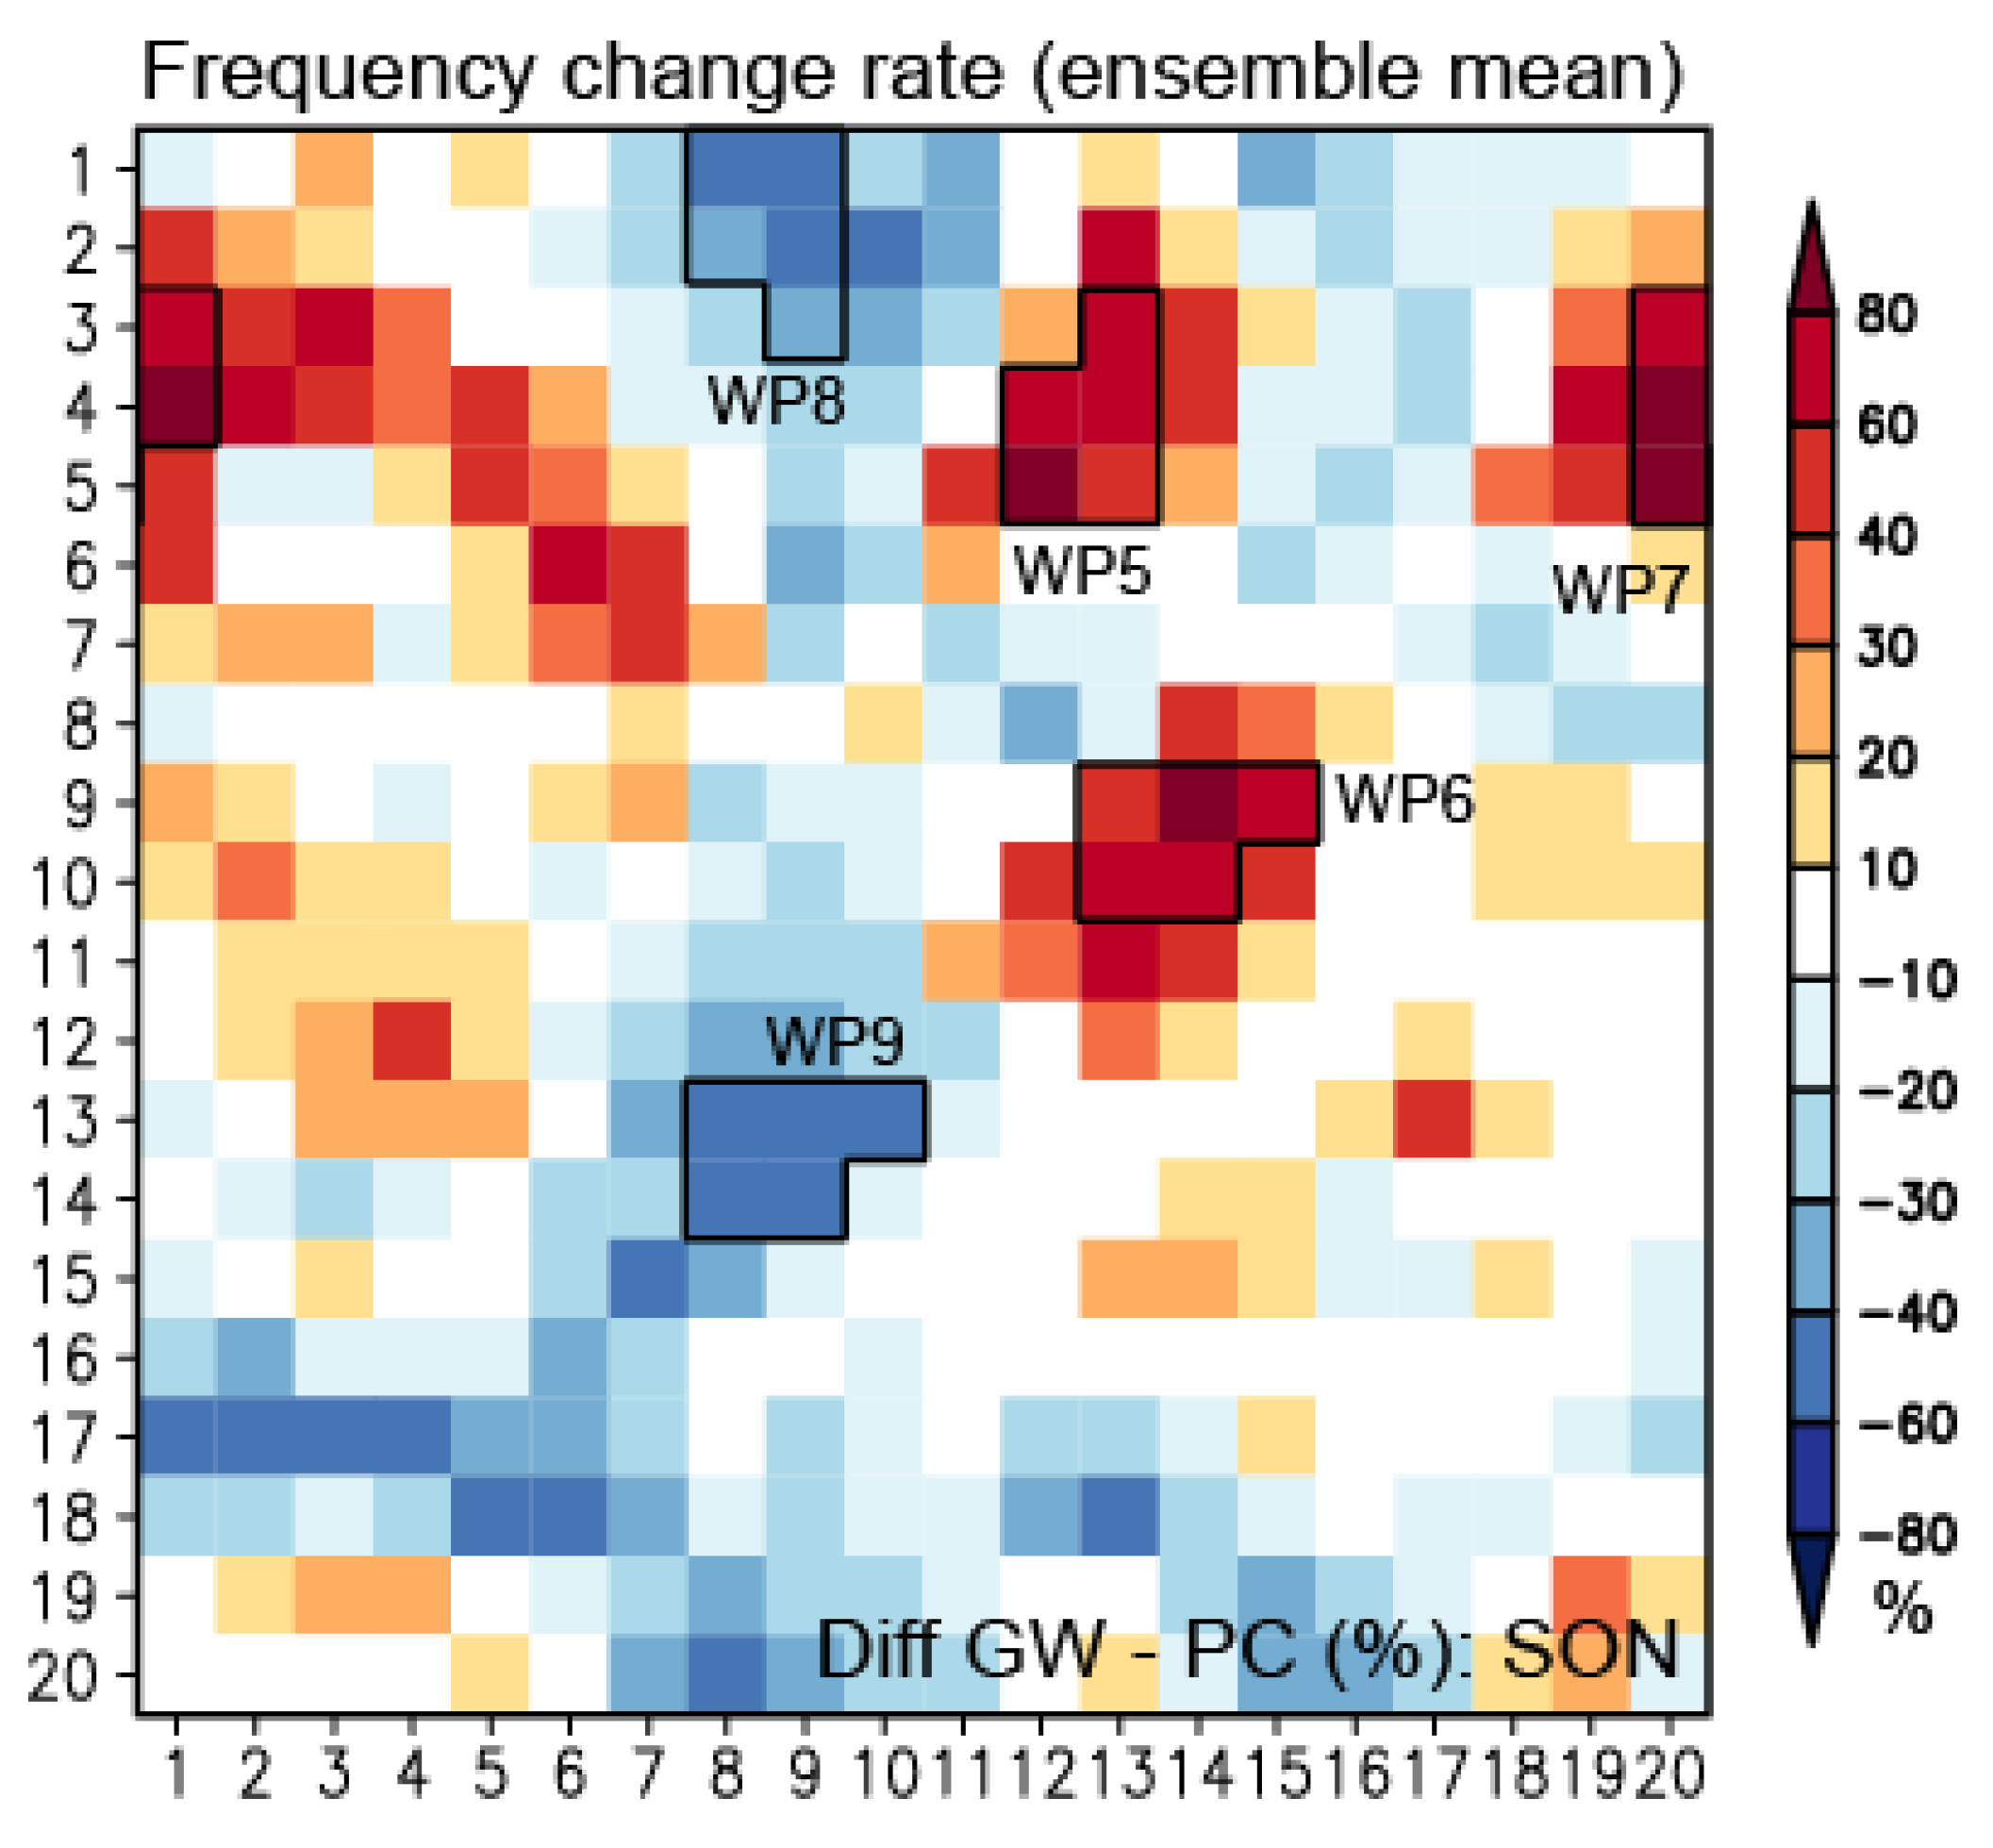
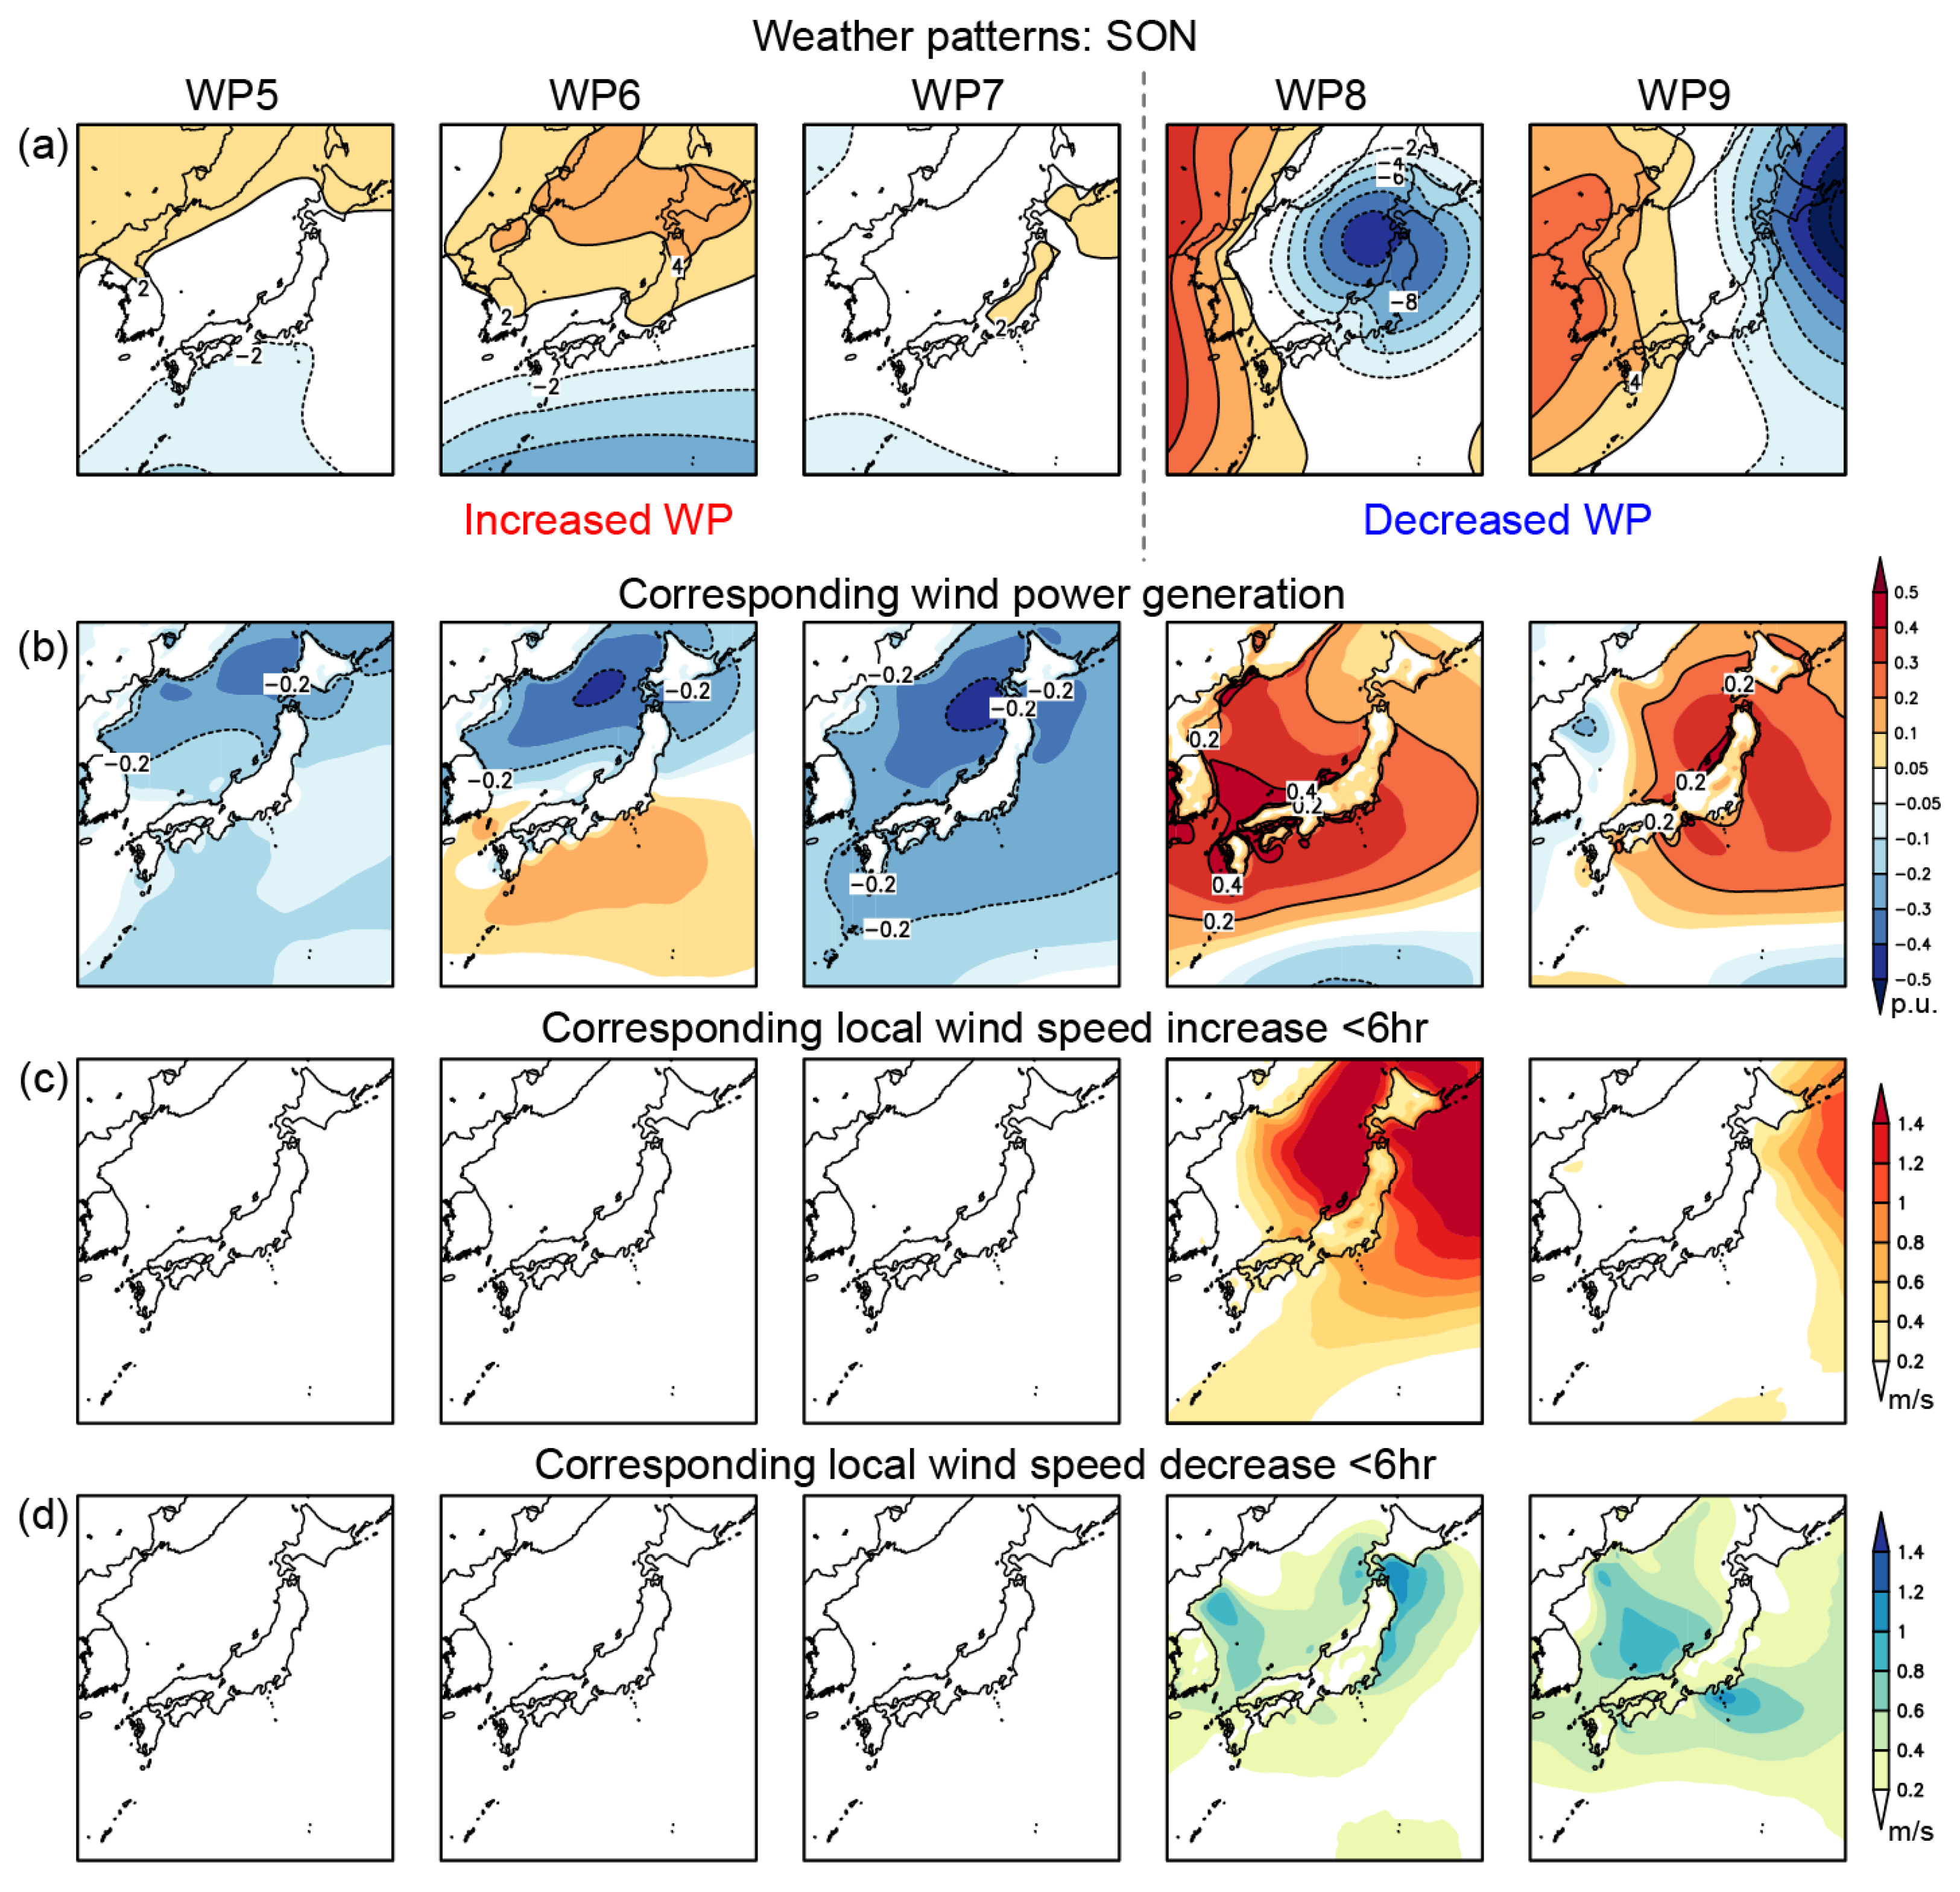
4. Frequency Change in Weather Patterns
5. Discussion
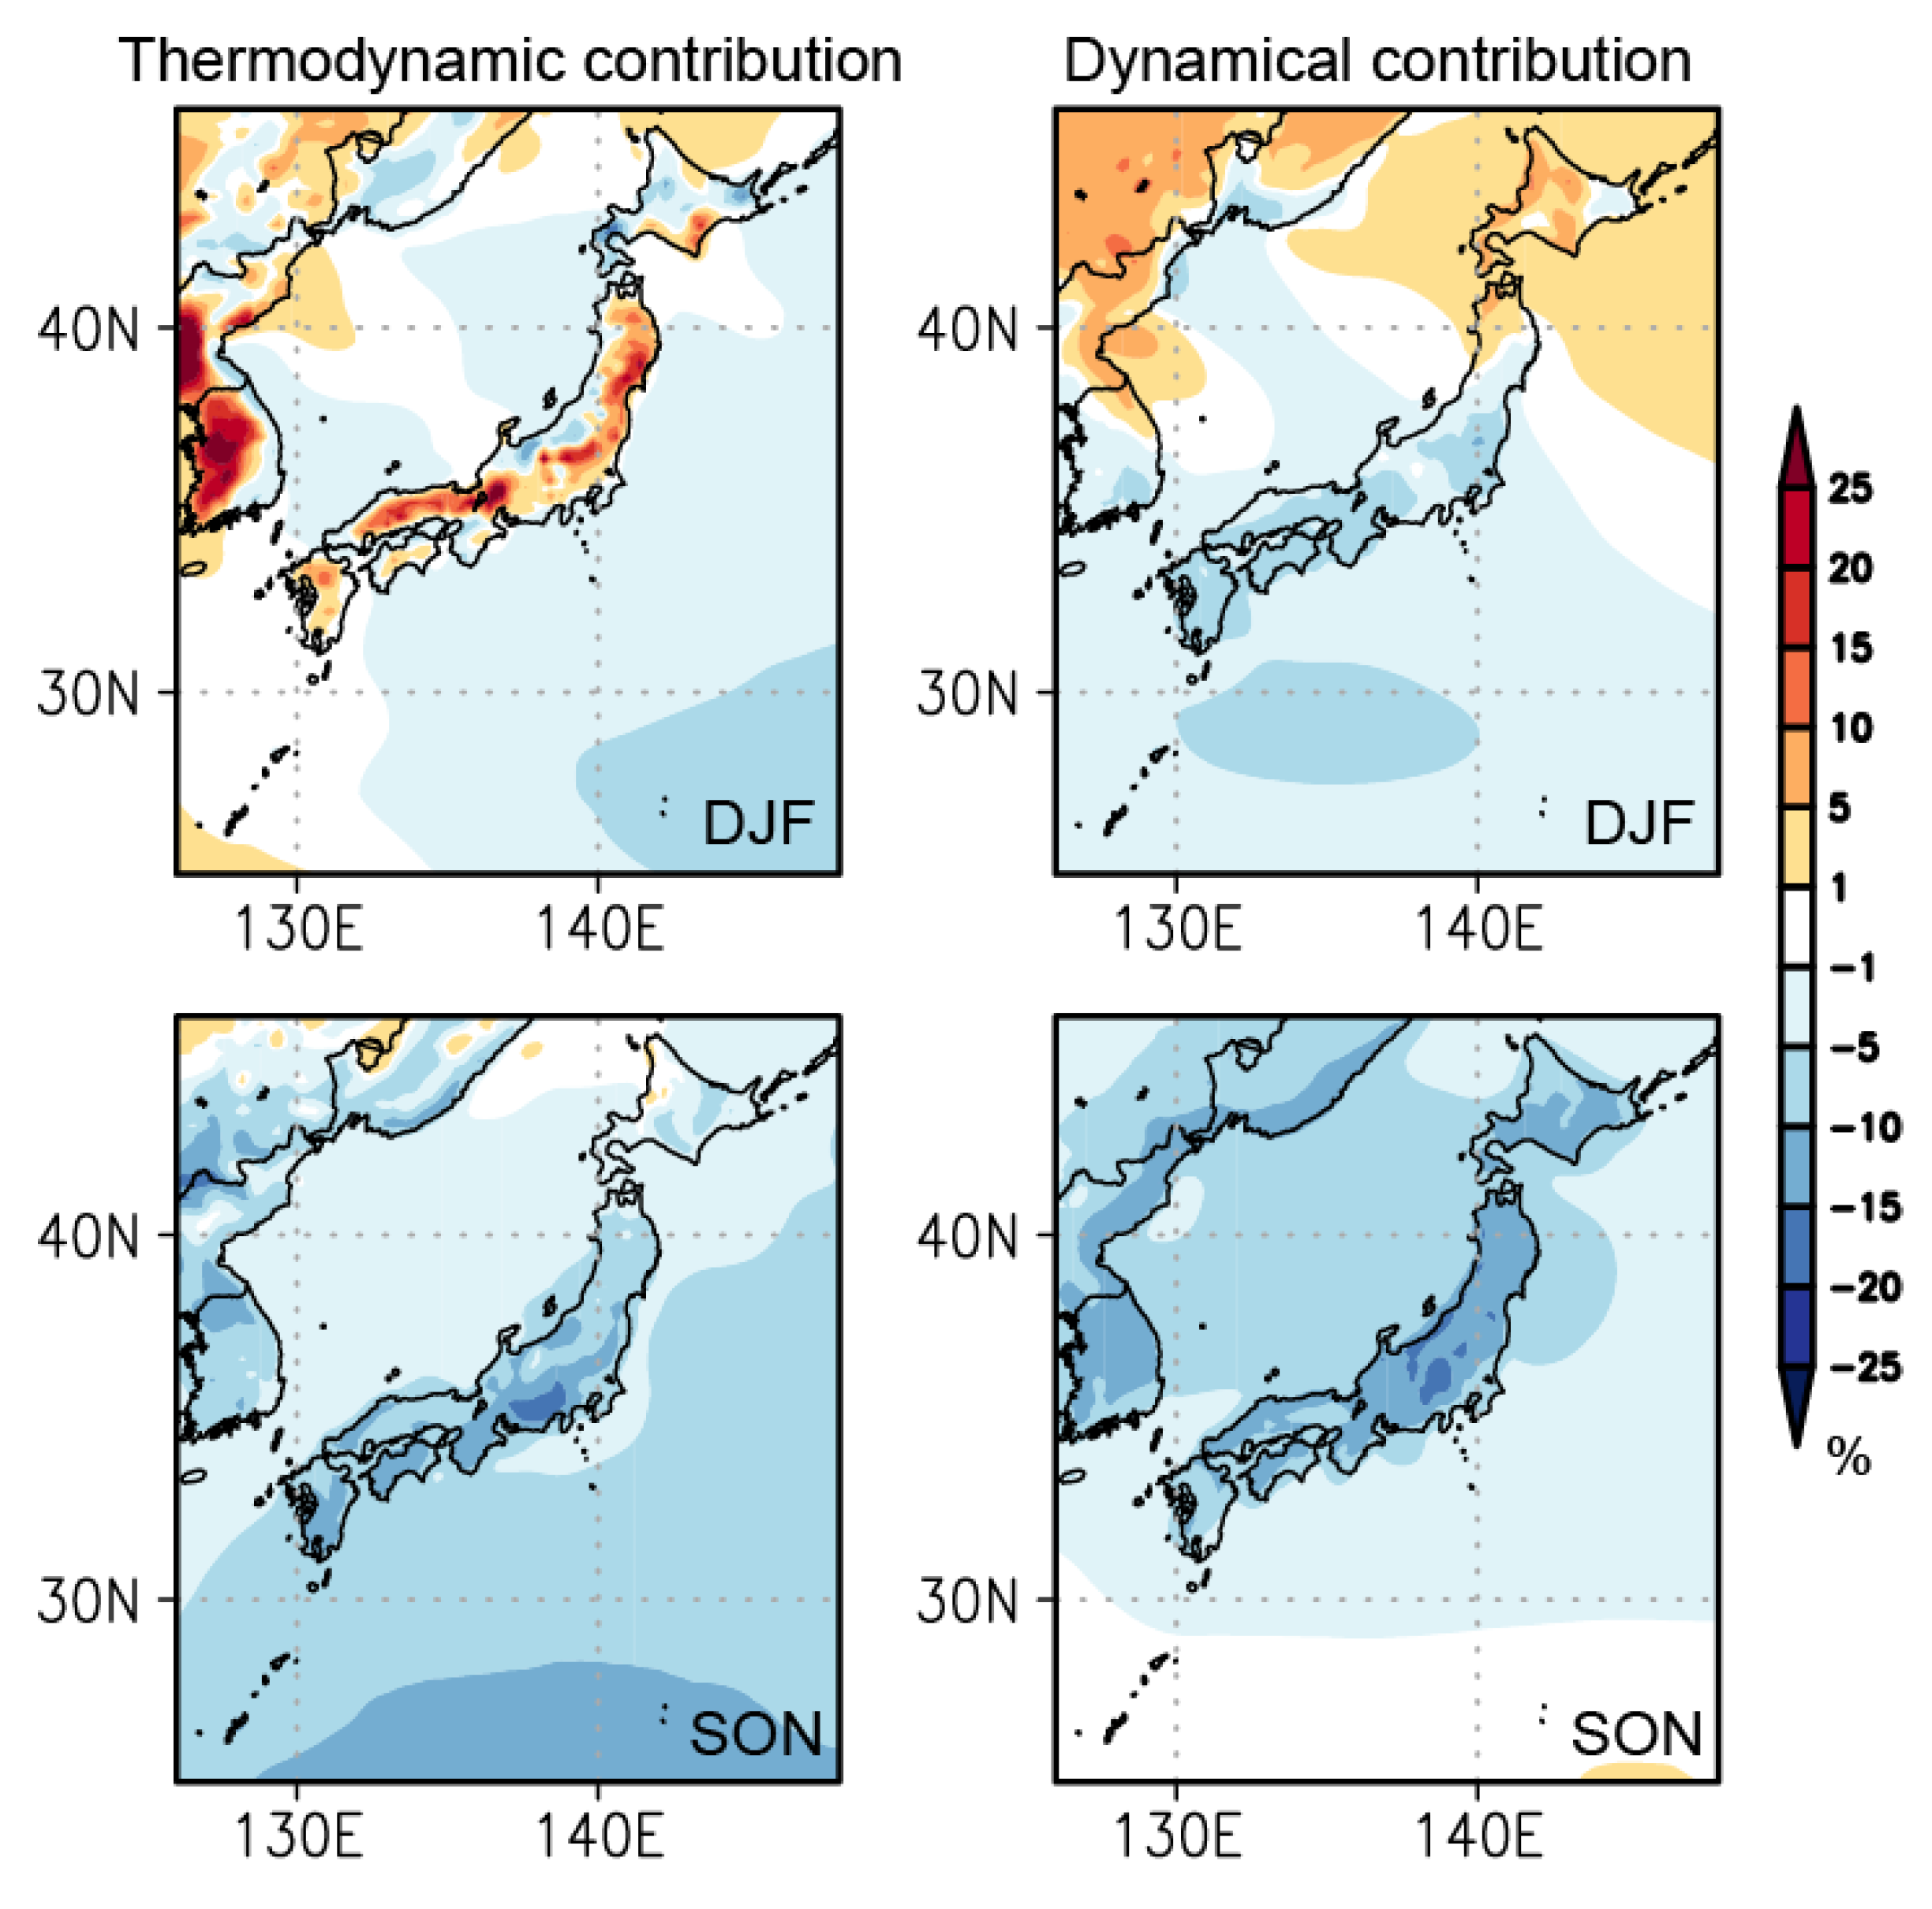
5.1. Dynamical and Thermodynamic Contributions
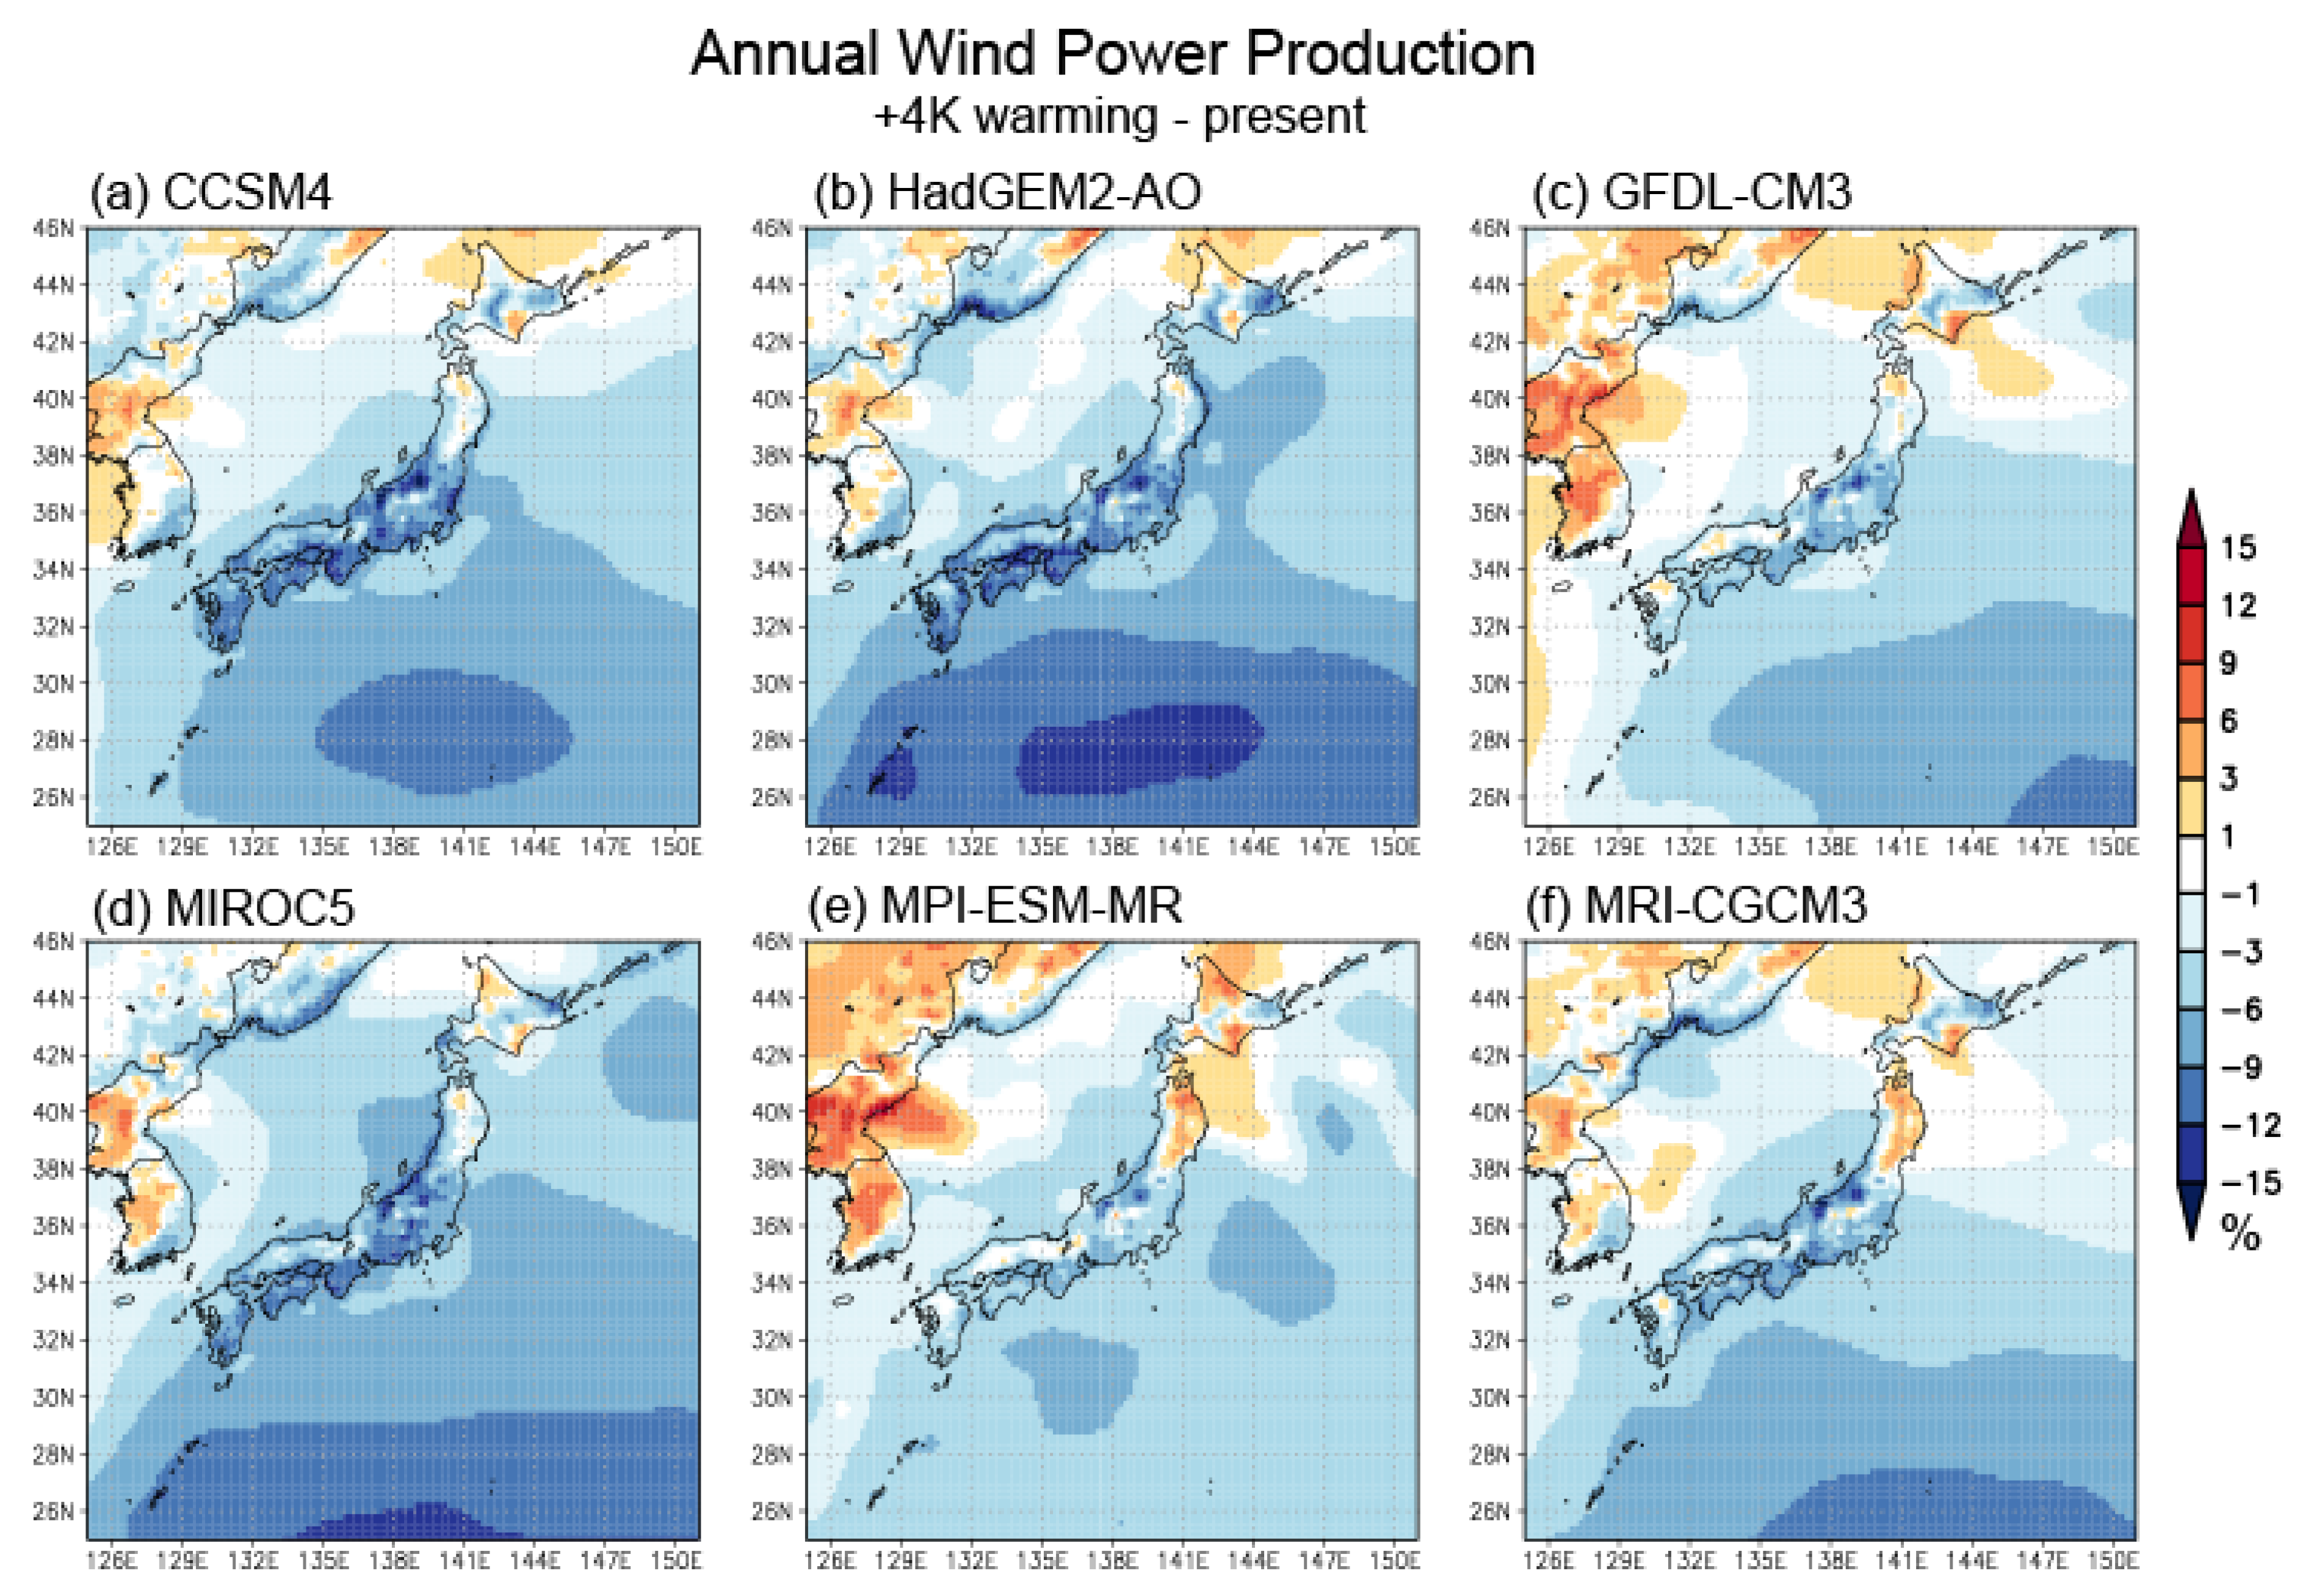
5.2. Diversity from Model SST
6. Conclusions
Funding
Acknowledgments
Conflicts of Interest
References
- Mizuno, E. Overview of wind energy policy and development in Japan. Renew Sustain. Energy Rev. 2014, 40, 999–1018. [Google Scholar] [CrossRef]
- Pryor, S.C.; Barthelmie, R.J. Climate change impacts on wind energy: A review. Renew Sustain. Energy Rev. 2010, 14, 430–437. [Google Scholar] [CrossRef]
- Pryor, S.; Barthelmie, R.J.; Clausen, N.E.; Drews, M.; MacKellar, N.; Kjellström, E. Analyses of possible changes in intense and extreme wind speeds over northern Europe under climate change scenarios. Clim. Dyn. 2012, 38, 189–208. [Google Scholar] [CrossRef]
- Nolan, P.; Lynch, P.; McGrath, R.; Semmler, T.; Wang, S. Simulating climate change and its effects on the wind energy resource of Ireland. Wind Energy 2012, 15, 593–608. [Google Scholar] [CrossRef]
- Hueging, H.; Haas, R.; Born, K.; Jacob, D.; Pinto, J.G. Regional changes in wind energy potential over Europe using regional climate model ensemble projections. J. Appl. Meteorol. Climatol. 2013, 52, 903–917. [Google Scholar] [CrossRef]
- Tobin, I.; Vautard, R.; Balog, I.; Breon, F.-M.; Jerez, S.; Ruti, P.M.; Thais, F.; Vrac, M.; Yiou, P. Assessing climate change impacts on European wind energy from ENSEMBLES high-resolution climate projections. Clim. Change 2015, 128, 99–112. [Google Scholar] [CrossRef]
- Reyers, M.; Moemken, J.; Pinto, J.G. Future changes of wind energy potentials over Europe in a large CMIP5 multi-model ensemble. Int. J. Climatol. 2015, 36, 783–796. [Google Scholar] [CrossRef]
- Hdidouan, D.; Staffell, I. The impact of climate change on the levelised cost of wind energy. Renew Energy 2017, 101, 575–592. [Google Scholar] [CrossRef]
- Karnauskas, K.B.; Lundquist, J.K.; Zhang, L. Southward shift of the global wind energy resource under high carbon dioxide emissions. Nat. Geosci. 2017, 11, 38–43. [Google Scholar] [CrossRef]
- Brayshaw, D.J.; Troccoli, A.; Fordham, R.; Methven, J. The impact of large scale atmospheric circulation patterns on wind power generation and its potential predictability: A case study over the UK. Renew Energy 2011, 36, 2087–2096. [Google Scholar] [CrossRef]
- Ohba, M.; Kadokura, S.; Nohara, D. Impacts of synoptic circulation patterns on wind power ramp events in East Japan. Renew Energy 2016, 96, 591–602. [Google Scholar] [CrossRef]
- Yoshida, K.; Hayasaki, N.; Ohba, M.; Nohara, D.; Ogasawara, N.; Okada, M.; Mori, Y.; Ogimoto, K.; Kataoka, K. Analysis of meteorological factors of wind power ramps in Hokkaido and Tohoku area. IEEJ Trans. Power Energy 2017, 137, 71–78. [Google Scholar] [CrossRef]
- Ohba, M.; Nohara, D.; Kadokura, S. Medium-range probabilistic forecasts of wind power generation and ramps in Japan based on a hybrid ensemble. Atmosphere 2018, 9, 423. [Google Scholar] [CrossRef]
- Fujimoto, Y.; Takahashi, Y.; Hayashi, Y. Alerting to rare large-scale ramp events in wind power generation. IEEE Tran. Sustain. Energ 2019, 10, 55–65. [Google Scholar] [CrossRef]
- Marquis, M.; Wilczak, J.; Ahlstrom, M.; Sharp, J.; Stern, A.; Smith, J.C.; Calvert, S. Forecasting the wind to reach significant penetration levels of wind energy. Bull. Am. Meteorol. Soc. 2011, 92, 1159–1171. [Google Scholar] [CrossRef]
- Kozai, K.; Ohsawa, T.; Shimada, S.; Takeyama, Y.; Hasager, C.B.; Badger, M. Comparison of Envisat/ASAR-estimated offshore wind resource maps around Shirahama with those from mesoscale models MM5 and WRF. In Proceedings of the European Offshore Wind 2009, Stockholm, Sweden, 14–16 September 2009; p. 7. [Google Scholar]
- Shimada, S.; Ohsawa, T. Accuracy and characteristics of offshore wind speeds simulated by WRF. SOLA 2011, 7, 21–24. [Google Scholar] [CrossRef]
- Shimada, S.; Ohsawa, T.; Kogaki, T.; Steinfeld, G.; Heinemann, D. Effects of sea surface temperature accuracy on offshore wind resource assessment using a mesoscale model. Wind Energy 2015, 18, 1839–1854. [Google Scholar] [CrossRef]
- Takeyama, Y.; Ohsawa, T.; Kozai, K.; Hasager, C.B.; Badger, M. Effectiveness of WRF wind direction for retrieving coastal sea surface wind from synthetic aperture radar. Wind Energy 2013, 16, 865–878. [Google Scholar] [CrossRef]
- Ohsawa, T.; Shimada, S.; Tambke, J.; Lange, B. A study on effective usage of mesoscale model for accurate offshore wind simulation. In Proceedings of the European Offshore Wind Conference 2009, Stockholm, Sweden, 14–16 September 2009; p. 10. [Google Scholar]
- Ohsawa, T.; Tubouchi, N.; Niwa, R.; Tanemoto, J.; Shimada, S.; Takeyama, Y. Characteristics of offshore wind speed simulated with WRF in the seas around Japan. In Proceedings of the European Offshore Wind Conference 2011, Amsterdam, The Netherlands, 29 November–1 December 2011; p. 9. [Google Scholar]
- Ohsawa, T.; Orita, T.; Kozai, K.; Shimada, S.; Steinfeld, G.; Heinemann, D. Accuracy evaluation of hub-height wind speeds estimated from scatterometer and mesoscale model. In Proceedings of the EWEA OFFSHORE 2015, Copenhagen, Denmark, 10–12 March 2015; p. 7. [Google Scholar]
- Ohba, M.; Ueda, H. A role of zonal gradient of SST between the Indian Ocean and the Western Pacific in localized convection around the Philippines. SOLA 2006, 2, 176–179. [Google Scholar] [CrossRef][Green Version]
- Xie, S.P.; Hu, K.; Hafner, J.; Tokinaga, H.; Du, Y.; Huang, G.; Sampe, T. Indian Ocean capacitor effect on Indo-western Pacific climate during the summer following El Nino. J. Clim. 2009, 22, 730–747. [Google Scholar] [CrossRef]
- Kosaka, Y.; Xie, S.P.; Lau, N.C.; Vecchi, G.A. Origin of seasonal predictability for summer climate over the Northwestern Pacific. Proc. Natl. Acad. Sci. USA 2013, 110, 7574–7579. [Google Scholar] [CrossRef] [PubMed]
- Mizuta, R.; Nurata, A.; Ishii, M. Over 5000 years of ensemble future climate simulations by 60 km global and 20 km regional atmospheric models. Bull. Amer. Meteor. Soc. 2017, 98, 1383–1398. [Google Scholar] [CrossRef]
- Ohba, M.; Nohara, D.; Ueda, H. Simulation of asymmetric ENSO transition in WCRP CMIP3 multi-model experiments. J. Clim. 2010, 23, 6051–6067. [Google Scholar] [CrossRef]
- Ohba, M.; Sugimoto, S. Differences in climate change impacts between weather patterns: Possible effects on spatial heterogeneous changes of future extreme rainfall. Clim. Dyn. 2018, 52, 4177–4191. [Google Scholar] [CrossRef]
- Kayaba, N.; Yamada, T.; Hayashi, S.; Onogi, K.; Kobayashi, S.; Yoshimoto, K.; Kamiguchi, K.; Yamashita, K. Dynamical regional downscaling using the JRA-55 reanalysis (DSJRA-55). SOLA 2016, 12, 1–5. (In Japanese) [Google Scholar] [CrossRef][Green Version]
- Kobayashi, S.; Ota, Y.; Harada, Y.; Ebita, A.; Moriya, M.; Onoda, H.; Onogi, K.; Kamahori, H.; Kobayashi, C.; Endo, H.; et al. The JRA-55 reanalysis: General specifications and basic characteristics. J. Meteor. Soc. Japan 2015, 93, 5–48. [Google Scholar] [CrossRef]
- Holttinen, H. Hourly wind power variations in the Nordic countries. Wind Energy 2004, 8, 73–95. [Google Scholar] [CrossRef]
- Laslett, D.; Creagh, C.; Jennings, P. A simple hourly wind power simulation for the south-west region of Western Australia using MERRA data. Renew Energy 2016, 96, 1003–1014. [Google Scholar] [CrossRef]
- Drew, D.R.; Cannon, D.J.; Brayshaw, D.J.; Barlow, J.F.; Coker, P.J. The impact of future offshore wind farms on wind power generation in Great Britain. Resources 2015, 4, 155–171. [Google Scholar] [CrossRef]
- Cannon, D.J.; Brayshaw, D.J.; Methven, J.; Coker, P.J.; Lenaghan, D. Using reanalysis data to quantify extreme wind power generation statistics: A 33 year case study in Great Britain. Renew Energy 2015, 75, 767–778. [Google Scholar] [CrossRef]
- Klink, K. Atmospheric circulation effects on wind speed variability at turbine height. J. Appl. Meteorol. Climatol. 2007, 46, 445–456. [Google Scholar] [CrossRef]
- Gibson, P.B.; Cullen, N.J. Synoptic and sub-synoptic circulation effects on wind resource variability—A case study from a coastal terrain setting in New Zealand. Renew Energy 2015, 78, 253–263. [Google Scholar] [CrossRef]
- Hamlington, B.D.; Hamlington, P.E.; Collins, S.G.; Alexander, S.R.; Kim, K.Y. Effects of climate oscillations on wind resource variability in the United States. Geophys. Res. Lett. 2015, 42, 145e152. [Google Scholar] [CrossRef]
- Kohonen, T. Self-organized formation of topologically correct feature maps. Biol. Cybern. 1982, 43, 59–69. [Google Scholar] [CrossRef]
- Ohba, M.; Kadokura, S.; Nohara, D.; Toyoda, Y. Rainfall downscaling of weekly ensemble forecasts using self-organizing maps. Tellus A 2016b, 68, 29293. [Google Scholar] [CrossRef]
- Cassano, J.J.; Uotila, P.; Lynch, A.H.; Cassano, E.N. Predicted changes in synoptic forcing of net precipitation in large Arctic river basins during the 21st century. J. Geophys. Res. 2007, 112, G04S49. [Google Scholar] [CrossRef]
- Gibson, P.B.; Perkins-Kirkpatrick, S.E.; Renwick, J.A. Projected changes in synoptic weather patterns over New Zealand examined through self-organizing maps. Int. J. Climatol. 2016, 36, 3934–3948. [Google Scholar] [CrossRef]
- Vesanto, J.; Alhoniemi, E. Clustering of the self-organizing map. IEEE Trans. Neural. Netw. 2000, 11, 586–600. [Google Scholar] [CrossRef]
- Leloup, J.A.; Lachkar, Z.; Boulanger, J.P.; Thiria, S. Detecting decadal changes in ENSO using neural networks. Clim. Dyn. 2007, 28, 147–162. [Google Scholar] [CrossRef]
- Ohba, M.; Kadokura, S.; Yoshida, Y.; Nohara, D.; Toyoda, Y. Anomalous weather patterns in relation to heavy precipitation events in Japan during the Baiu season. J. Hydrometeorol. 2015, 16, 688–701. [Google Scholar] [CrossRef]
- Ward, J.H., Jr. Hierarchical grouping to optimize an objective function. J. Am. Stat. Assoc. 1963, 58, 236–244. [Google Scholar] [CrossRef]
- Van den Dool, H.M.; Huang, J.; Fan, Y. Performance and analysis of the constructed analogue method applied to U.S. soil moisture over 1981–2001. J. Geophys. Res. 2003, 108, 8617. [Google Scholar] [CrossRef]
- Deser, C.; Terray, L.; Phillips, A.S. Forced and internal components of winter air temperature trends over North America during the past 50 years: Mechanisms and implications. J. Clim. 2016, 29, 2237–2258. [Google Scholar] [CrossRef]
- Mizuta, R.; Matsueda, M.; Endo, H.; Yukimoto, S. Future change in extratropical cyclones associated with change in the upper troposphere. J. Clim. 2011, 24, 6456–6470. [Google Scholar] [CrossRef]
- Yoshida, K.; Sugi, M.; Mizuta, R.; Murakami, H.; Ishii, M. Future changes in tropical cyclone activity in high-resolution large-ensemble simulations. Geophys. Res. Lett. 2017, 44, 9910–9917. [Google Scholar] [CrossRef]
- Pryor, S.C.; Schoof, J.T.; Barthelmie, R.J. Empirical downscaling of wind speed probability distributions. J. Geophys. Res. 2005, 110, D19109. [Google Scholar] [CrossRef]
- Harvey, B.J.; Shaffrey, L.C.; Woollings, T.J.; Zappa, G.; Hodges, K.I. How large are projected 21st century storm track changes? Geophys. Res. Lett. 2012, 39, L18707. [Google Scholar] [CrossRef]
- Harvey, B.J.; Shaffrey, L.C.; Woollings, T.J. Equator-to-pole temperature differences and the extra-tropical storm track responses of the CMIP5 climate models. Clim. Dyn. 2014, 43, 1171–1182. [Google Scholar] [CrossRef]
- Zappa, G.; Shaffrey, L.C.; Hodges, K.I.; Sansom, P.G.; Stephenson, D.B. A multimodel assessment of future projections of North Atlantic and European extratropical cyclones in the CMIP5 climate models. J. Clim. 2013, 26, 5846–5862. [Google Scholar] [CrossRef]
- Archer, C.L.; Jacobson, M.Z. Evaluation of global wind power. J. Geophys. Res. 2005, 110, D12110. [Google Scholar] [CrossRef]
- Evans, J.P.; Kay, M.; Prasad, A.; Pitman, A. The resilience of Australian wind energy to climate change. Environ. Res. Lett. 2018, 13, 024014. [Google Scholar] [CrossRef]
- Ohba, M.; Ueda, H. Role of Nonlinear Atmospheric Response to SST on the Asymmetric Transition Process of ENSO. J. Clim. 2009, 22, 177–192. [Google Scholar] [CrossRef]


© 2019 by the author. Licensee MDPI, Basel, Switzerland. This article is an open access article distributed under the terms and conditions of the Creative Commons Attribution (CC BY) license (http://creativecommons.org/licenses/by/4.0/).
Share and Cite
Ohba, M. The Impact of Global Warming on Wind Energy Resources and Ramp Events in Japan. Atmosphere 2019, 10, 265. https://doi.org/10.3390/atmos10050265
Ohba M. The Impact of Global Warming on Wind Energy Resources and Ramp Events in Japan. Atmosphere. 2019; 10(5):265. https://doi.org/10.3390/atmos10050265
Chicago/Turabian StyleOhba, Masamichi. 2019. "The Impact of Global Warming on Wind Energy Resources and Ramp Events in Japan" Atmosphere 10, no. 5: 265. https://doi.org/10.3390/atmos10050265
APA StyleOhba, M. (2019). The Impact of Global Warming on Wind Energy Resources and Ramp Events in Japan. Atmosphere, 10(5), 265. https://doi.org/10.3390/atmos10050265