Abstract
Background: Mycetia, a subshrub genus within the subfamily Rubioideae (Rubiaceae), is predominantly distributed in tropical Asia, lacking comprehensive plastid genomic resources. This study aimed to characterize the complete plastid genomes of two Mycetia species and explore their structural features and evolutionary relationships. Methods: The plastid genomes of Mycetia hirta and Mycetia sinensis were sequenced and assembled. We analyzed genome structure, simple sequence repeats (SSRs), long repeats, codon usage, nucleotide diversity (π), and Ka/Ks and conducted phylogenetic analysis. Results: Both genomes exhibited a typical quadripartite structure (153,989–154,588 bp; GC content 37.7–37.8%), encoding 127 genes (86 protein-coding, 8 rRNA, and 32 tRNA). Both chloroplast genomes contained 52–60 SSRs and three repeat types with minor interspecific differences. Junction regions and codon usage were highly conserved, with slight variations in RSCU values. The average π was 0.0096, and the non-coding trnE-trnT (π = 0.0817) emerged as a potential DNA barcode. The average Ka/Ks was 0.2900, indicating purifying selection. Phylogenetic analysis confirmed the monophyly of Mycetia within Argostemmateae. Conclusions: This study provides the first comparative plastid genomic analysis for Mycetia, enhancing our understanding of its genetic diversity and supporting future phylogenetic and taxonomic research on the genus.
1. Introduction
Rubiaceae Juss. is the fourth largest angiosperm family, comprising 615 genera and 14,266 species [1]. As currently circumscribed, the family is divided into 2 subfamilies (Rubioideae and Cinchonoideae) and 72 tribes, among which the tribe Argostemmateae includes 6 genera, viz., Argostemma Wall., Clarkella Hook.f., Leptomischus Drake, Mouretia Pit., Mycetia Reinw., and Neohymenopogon Bennet [2].
Mycetia Reinw. is a moderately sized genus belonging to the tribe Argostemmaea, comprising over 50 species of shrubs or subshrubs distributed predominantly in tropical and subtropical Asia [3]. This genus can be distinguished from other members of the tribe based on the following characters: the bark often is straw-yellow to nearly white, soft, and often corky; calyx lobes are mostly glandular; and the berry-like fruits turn white when mature [4,5]. It is simple to distinguish Mycetia from other genera due to berry fruits; however, differentiating among species within this genus remains challenging. Many specimens deposited in herbaria are awaiting identification. Some species in the genus are used as medicine in Asia, such as M. longifolia (Wall.) Kuntze and M. sinensis (Hemsl.) Craib [6,7,8].
Plastid genome sequences play an important role in interspecific genetic diversity and the reconstruction of plant phylogeny [9,10,11,12,13]. In recent years, complete plastid genomes of numerous angiosperm species have been sequenced and made available in the NCBI database [14,15,16,17,18,19]. Plastid phylogenomic analyses focused on Rubiaceae members have also been conducted extensively in recent years, and have provided significant insights into the evolutionary history of this large family [20,21,22,23,24]. Although Thureborn et al. [23] included two Mycetia species (one unidentified) in their study, their work primarily focused on investigating large-scale phylogenetic relationships within the subfamily Rubioideae (Rubiaceae) and exploring the evolutionary characteristics (structure, gene content, and arrangement) of its plastid genome, without detailed examination of the structure of the plastid genome, gene composition, or variation within the genus.
To fill this research gap and additionally select potential molecular markers suitable for species delimitation, this study reports the complete plastid genome sequences of two Mycetia species., M. hirta Hutch. and M. sinensis. Furthermore, we conducted comparative analyses of plastid genome structure between Mycetia and its close relatives and performed a plastid phylogenomic analysis of representative Rubiaceae taxa. These results provide fundamental insights into the genomic characteristics of Mycetia and establish a reliable genomic resource for future phylogenetic studies.
2. Materials and Methods
2.1. Plant Material, DNA Extraction, and Sequencing
Materials of M. hirta and M. sinensis were collected on 23 December 2017 from Jinghong City, Yunnan Province, China, and on 31 October 2014 from Napo County, Guangxi Province, China, respectively. The vouchers of the two species are Z.Q. Song 2017003 and Napo Exped. 451026141031038, respectively (Figure 1), and are deposited in the herbaria of the South China Botanical Garden, Chinese Academy of Sciences (IBSC), Guangdong Province, China. Total DNA was extracted from silica-gel-dried leaves using a modified CTAB method [25]. Genomic sequences were obtained through a genome skimming approach [26]. Paired-end (PE) sequencing was conducted on the Illumina HiSeq X-Ten instrument at the Beijing Genomics Institute (BGI) in Wuhan, China.
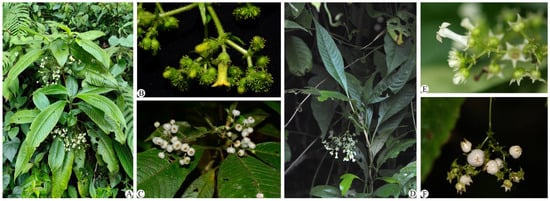
Figure 1.
The morphology of Mycetia hirta Hutch. ((A) habitat, (B) inflorescence and flowers, (C) fruits) and Mycetia sinensis (Hemsl.) Craib ((D) habitat, (B) inflorescence and (E) flowers, (F) fruits).
2.2. Assembly and Annotation of Plastid Genome
We employed the GetOrganelle pipeline [27] to assemble the plastome sequence from clean sequencing reads, and Geneious v.9.1.8 [28] and PGA v1.x [29] software were used to verify the accuracy of the assembly and to annotate the plastome obtained.
2.3. Data Analysis
2.3.1. Repeat Analysis
MISA software v2.1 [30] (https://webblast.ipk-gatersleben.de/misa (accessed on 20 February 2024)) was utilized to identify simple sequence repeat (SSR) sites in the plastid genome of two Mycetia species. Dispersed repeats of four types, i.e., forward repeats (F), reverse repeats (R), complement repeats (C), and palindromic repeats (P), were detected in the plastid genome using REPute v2.5 [31] (https://bibiserv.cebitec.uni-bielefeld.de/reputer (accessed on 26 October 2023)). The parameters were set as follows: minimum length of 30 bp and hamming distance of 3.
2.3.2. IR Junction Analyses
The borders of the inverted repeat (IR) region, large single-copy (LSC) region, and small single-copy (SSC) region junction positions among the Mycetia plastome sequences were visualized using IRscope v2.01 (https://irscope.shinyapps.io/irapp/ (accessed on 7 Novermber 2025)) [32].
2.3.3. Relative Condon Usage Analysis
The analysis of relative synonymous codon usage (RSCU) in the plastid genome coding genes was conducted using CodonW v1.4.2 [33] (https://www.softpedia.com/get/Science-CAD/CodonW.shtml (accessed on 25 October 2023)), with default parameter settings.
2.3.4. Genome Comparison Analysis
Homologous gene sequences of different species were compared globally using MAFFT v7.520 [34], and nucleotide variability (π) values were calculated for each gene using DnaSP v6.12.03 [35]. Following this, scatter fold plots were plotted.
2.3.5. Selective Pressure Analysis
Selective pressure analysis was also conducted by calculating the rate of synonymous (Ks) and nonsynonymous (Ka) substitutions and their ratio (Ka/Ks) for all coding gene sequences of the two Mycetia species using DnaSP v6.12.03 [35].
2.3.6. Phylogenetic Analysis
Phylogenetic analysis was conducted using 82 plastid coding genes of 2 Mycetia species and a further 21 species in Rubiaceae (see Supplement Files Table S5), with Gentiana delavayi selected as the outgroup. 16 data were downloaded from NCBI, and 5 data were from Thureborn et al. [23]. The nucleotide sequences were aligned using the plugin of MAFFT v7.520. IQ-TREE v3.0.1 [36] was used to reconstruct the maximum likelihood (ML) tree. According to the Bayesian information criterion (BIC),the best substitution model was recommended with the parameter “-m MFP”; therefore, the TVM+F+R2 model was chosen. To assess the reliability of the phylogenetic tree, the Shimodaira–Hasegawa (SH-aLRT) approximate likelihood ratio test and the ultrafast bootstrap (UFboot) approximation with parameters set at “-alrt 1000 -bb 1000” were used. Clades were considered well-supported if they exhibited an SH-aLRT value of 80% or greater and an UFboot value of 95% or greater.
3. Results
3.1. Plastid Genome Structure of M. hirta and M. sinensis
The structures of plastid genomes of two species were highly similar. The complete plastid genomes of M. hirta and M. sinensis are 153,989 bp and 154,588 bp, respectively (Figure 2, Table 1).
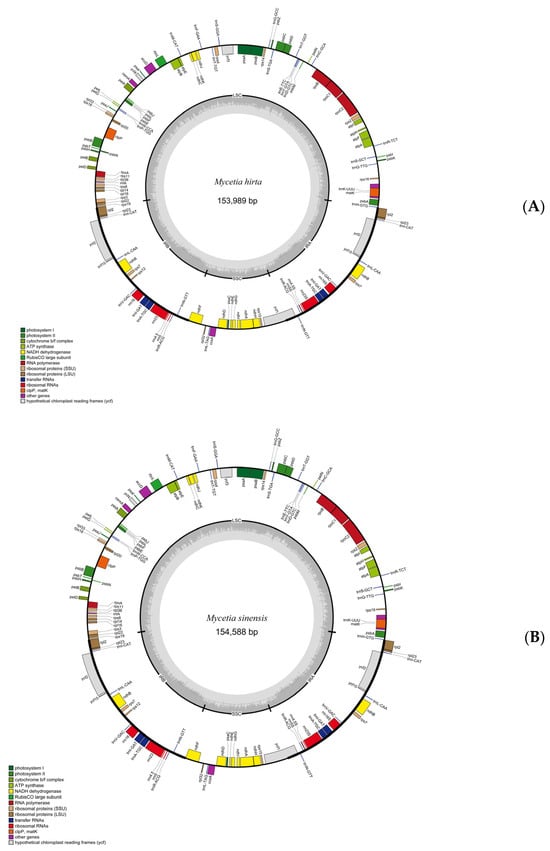
Figure 2.
Gene map of M. hirta (A) and M. sinensis (B) plastid genomes. LSC and SSC indicate the large and small single-copy regions. IR indicates inverted repeat regions.

Table 1.
The characteristics of Mycetia hirta and Mycetia sinensis plastomes.
The plastid genome structures displayed a typical quadripartite structure with a large single-copy (LSC) region (84,171 bp, 84,736 bp), a small single-copy (SSC) region (17,068 bp, 17,138 bp), and two inverted repeat (IR) regions (52,750 bp, 52,714 bp). The overall GC content was 37.8% in M. hirta and 37.7% in M. sinensis. In both plastid genomes, the GC contents in the LSC, SSC, and IR regions were 35.6%, 32.3%, and 43.0% in M. hirta, and 35.5%, 32.1%, and 43.0% in M. sinensis, respectively.
Both plastid genomes contained 127 genes, including 86 CDS genes, 8 rRNAs, and 32 tRNAs. The LSC region contained 61 CDS and 17 tRNA genes, whereas the SSC region comprised 12 CDS genes and only one tRNA gene. Six CDS (rpl2, rpl23, ycf2, ycf15, ndhB and rps7), seven tRNA (trnI-CAT, trnL-CAA, trnV-GAC, trnI-GAT, trnA-TGC, trnR-ACG, trnN-GT), and four rRNA (rrn4.5, rrn5, rrn16, and rrn23) genes were repeated in the IR regions (Table S1). There were nine genes with introns, of which seven (ndhA, ndhB, atpF, rpl2, rpoC1 and trnA-TGC) had only one intron, while the others (clpP, ycf3) had two (Table S1).
3.2. SSR Analysis and Long Repeat Sequences
3.2.1. SSR Analysis
SSR microsatellites, also known as simple sequence repeats, were identified in the two Mycetia plastid genomes (Figure 3 and Table 2). The number of SSRs discovered in each species ranges from 52 to 60.
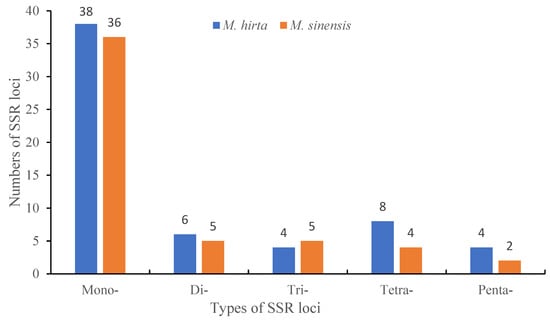
Figure 3.
SSR type and number of plastid genomes in M. hirta and M. sinensis.
Table 2.
Analysis of simple sequence repeats (SSRs) in M. hirta and M. sinensis plastid genomes.
Based on SSR analysis, a total of 60 and 52 SSRs were detected in M. hirta and M. sinensis, respectively. In addition to other plant genes, the most abundant were mono-nucleotide repeats, accounting for 63.3% and 69.2% in M. hirta and M. sinensis, respectively, followed by di-nucleotides accounting for 10.0% and 9.6%, tri-nucleotides accounting for 6.7% and 9.6%, tetra-nucleotides accounting for 13.3% and 7.7%, and penta-nucleotides accounting for 6.7% and 3.8% in M. hirta and M. sinensis, respectively. Among the mono-nucleotide repeats, A/T repeats accounted for the total percent.
3.2.2. Long Repeats
To characterize the repeat sequence patterns in the target species, the REPuter softwarev2.5 was employed for detection, and three repeat types were identified, with detailed distribution results presented in Figure 4A. Specifically, in M. hirta, a total of 33 repeat sequences were detected, which could be further categorized into three types (Figure 4B): 12 forward repeats (F), 4 reverse repeats (R), and 17 palindromic repeats (P). For Mycetia sinensis, the total number of detected repeats was 28, comprising 10 forward repeats (F), 2 reverse repeats (R), and 16 palindromic repeats (P). Moreover, an analysis of repeat length distribution (as shown in Figure 5) revealed that the majority of these identified repeats fell within the length range of 30–40 base pairs (bp).
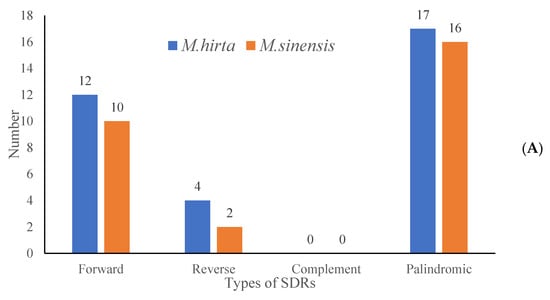
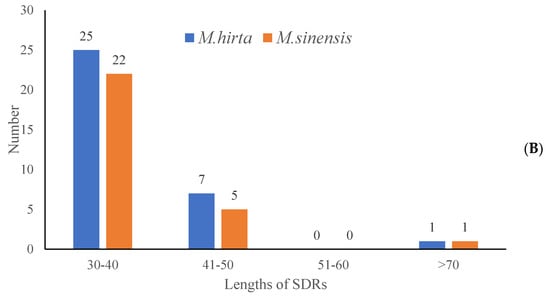
Figure 4.
Analysis of short dispersed repeats (SDRs) in M. hirta and M. sinensis. (A) Numbers of four types of SDR; (B) numbers of different lengths of SDRs.
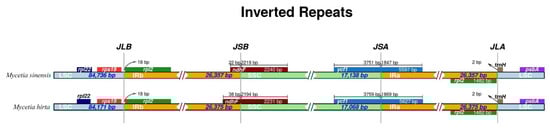
Figure 5.
Comparison of the LSC, IR, and SSC borders of M. hirta and M. sinensis.
3.3. IR Expansion and Contraction
The junctions of LSC/IRb, IRb/SSC, SSC/Ira, and IRa/LSC were very similar in the two Mycetia species (Figure 5). The rpsl19 and rpl2 genes flanked the LSC/IRb (JLB). The IRb/SSC (JSB) and IRa/LSC borders were the trnN/ndhF and rpl2/trnH genes. NdhF was entirely found in the SSC region, with lengths of 38 and 22 bp inserted in the IRb/SSC junctions of M. hirta and M. sinensis, respectively. The ycf1 gene, crossed the SSC/IRa borders, and was located at the SSC and IRa regions with 3759–3751 bp and 1869–1847 bp lengths in M. hirta and M. sinensis, respectively.
3.4. Codon Usage
The codon usage pattern of the two Mycetia species was uniform. A total of 64 codons encoded twenty amino acids. Among the 20 amino acids, methionine (Met) and tryptophan (Trp) were encoded by a single codon, whereas arginine (Arg), leucine (Leu), and serine (Ser) had the maximum codons of six. The relative synonymous codon usage (RSCU) values of the same codon in two species are slightly different (Figure 6 and Figure 7). Both species have 11 high preferences (RSCU > 1.3), 8 moderate preferences (1.2 < RSCU < 1.3), and 14 and 13 low preferences (1.0 < RSCU < 1.2) in M. hirta and M. sinensis, respectively. Overall, 3, 3, and 13 codons prefer synonymous (RSCU > 1) and C-, G-, and U-ending codons, while 14 (M. hirta) and 13 (M. sinensis) prefer A-ending codons.
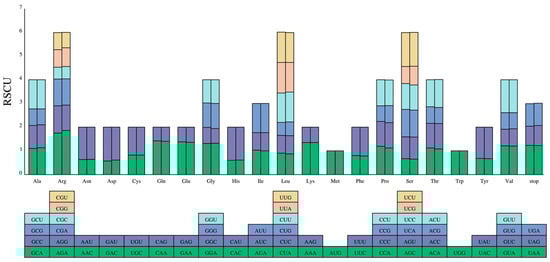
Figure 6.
Codon content of 20 amino acids and stop codons in all protein-coding genes of the cp genomes of two Mycetia species. Left: M. hirta; right: M. sinensis. The histogram above each amino acid shows codon usage within Mycetia. Colors in the column graph reflected codons in the same colors shown below the figure. RSCU: relative synonymous codon usage.
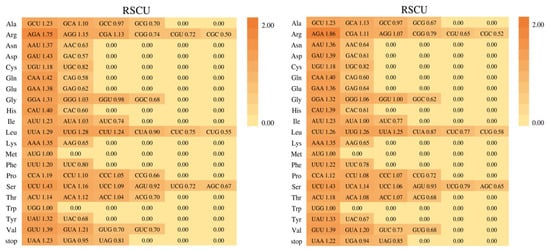
Figure 7.
The codon usage of all protein-coding genes of M. hirta and M. sinensis.
3.5. Nucleotide Diversity (Pi)
DnaSP software V. 6.12.03 was used to analyze nucleotide polymorphism in the chloroplast genomes of M. hirta and M. sinensis. The results showed that their nucleotide variability (π) ranged from 0 to 0.08167, with an average value of 0.0096 (Figure 8). Among them, trnE-trnT, trnT-psbD, trnS-trnR, and ndhF-rpl32 exhibited relatively high variation, with all π values exceeding 0.02. The highest π value was trnE-trnT (0.08167) localized in the LSC region, while most high π values were distributed in the LSC region, and the remainder were located in the SSC region.
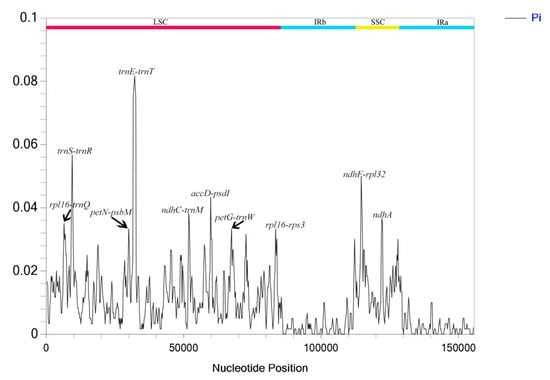
Figure 8.
The nucleotide diversity of the plastid genomes of M. hirta and M. sinensis. LSC: large single-copy region; IR: inverted repeat region; SSC small single-copy region.
3.6. Selection Pressure Analysis
This study investigated the adaptive evolution of Mycetia by analyzing the Ka/Ks ratio. A ratio greater than one indicated positive selection, a ratio less than one indicated purifying selection, and a ratio of one indicated neutral evolution. The average value of Ka was 0.0062, with the highest value of 0.0401 (psaJ), and the lowest being 0. The average value of Ks was 0.0090, with the highest value of 0.0441 (ycf15) and the lowest being 0 (Figure 9A).
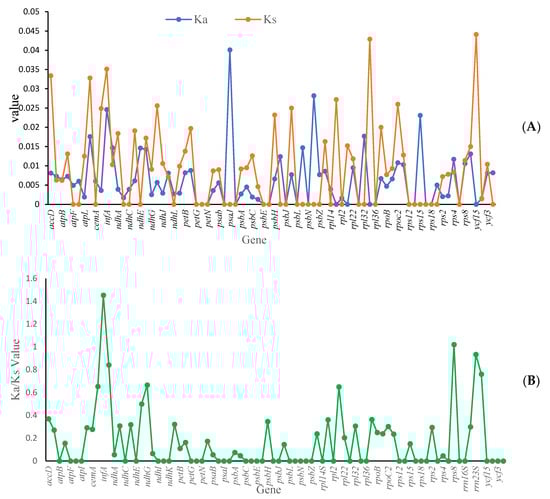
Figure 9.
Selective pressure of protein-coding genes in two Mycetia species. (A) blue line: Ka, orange line: Ks; (B) Ka/Ks ratio. Ka: rate of nonsynonymous substitution. Ks: rate of synonymous substitution.
The Ka/Ks ratio reflected selection pressure on genes, and it is a well-recognized marker, which is helpful for understanding the evolutionary forces shaping plastid genes. Generally, genes related to a specific habitat are considered to have undergone strong positive selection; thus, the diversification of habitat type may facilitate an increase in mutation rates. Although the habitats among Mycetia vary significantly, synonymous gene mutations occur more regularly than nonsynonymous mutations (Figure 9B). The average value of the Ka/Ks ratio was 0.2900, with the highest value being 1.4272 and the lowest being 0.
3.7. Phylogenetic Relationship
The plastome sequences provide much richer genetic information for revealing phylogeny. We used 82 coding genes to reconstruct phylogenetic trees to identify the phylogenetic position of two Mycetia species. The results are presented in Figure 10.
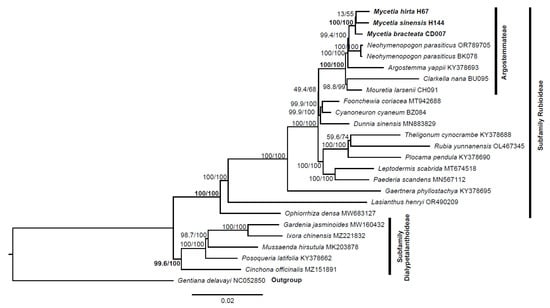
Figure 10.
Phylogenetic tree of two Mycetia species and other species in Rubiaceae based on the alignment of 82 coding genes. Numbers near branches are SH-aLRT and ultrafast bootstrap (UFBoot) support values (i.e., SH-aLRT/UFBoot).
The maximum likelihood (ML) tree reconstructed in this study showed that Mycetia species formed a highly robust and well-supported monophyletic clade. This clade was established with maximum bootstrap support values of 100/100, signifying an extremely high confidence level in the grouping of Mycetia as a monophyletic unit. The Mycetia clade was found to form a sister group with the genus Neohymenopogon. When considering the broader taxonomic context, Mycetia along with Argostemma, Clarkella, Mouretia, and Neohymenopogon jointly constitute the tribe Argostemmae.
On a broad phylogenetic branch, Foonchewia and Cyanoneuron were observed to form a distinct clade. The Foonchewia-Cyanoneuron clade formed a sister group with Dunnia, and the clade composed of these three genera is sister to the tribe Argostemmateae.
4. Discussion
This study presents complete plastid genomes of two Mycetia species. Within the Rubiaceae, plastid genome lengths range from 153,093 bp to 160,246 bp [14,23,37,38,39,40,41]. The sequenced Mycetia genomes fall within this span, with M. hirta at 153,989 bp and M. sinensis at 154,588 bp. Consistent with typical plastid genomes, which have a GC content of 30–40%, the overall GC content was 37.8% in M. hirta and 37.7% in M. sinensis. As expected, the inverted repeat (IR) regions exhibited a higher GC content (43.0% in both species) than the large single-copy (LSC; 35.6% and 35.5%) and small single-copy (SSC; 32.3% and 32.1%) regions. These results indicate that the plastid genome structure and key features of Mycetia are consistent with those of other Rubiaceae species.
Significant variation in simple sequence repeat (SSR) abundance is observed across Rubiaceae. For instance, SSR counts in Uncaria range from 49 in Uncaria lancifolia to 66 in U. sinensis [41]. In Mycetia, we identified 60 and 52 SSR loci in M. hirta and M. sinensis, respectively. Mononucleotide repeats were the most abundant type (63.3% in M. hirta and 69.2% in M. sinensis), and these intraspecific differences may provide valuable information for species delimitation. Congruent with other Rubiaceae taxa, the IR regions contained fewer SSRs than the LSC and SSC regions, and the SSR profile was dominated by mononucleotide A/T repeats. Furthermore, 33 long repeat sequences were detected in the two plastid genomes, categorized into three types. Most repeats were 30–40 bp in length, a characteristic congruent with other Rubiaceae species [38,39,40,41].
Expansion and contraction of the IR regions are common dynamics in plant plastid genomes and directly influence genome size variation. Our analysis of the IR boundaries revealed that there is essentially no variation within the genus Mycetia. The two Mycetia species are conservative, in agreement with other taxa in the tribe Argostemmateae (Supplement Figure S1), reflecting low interspecific variability in IR region structure within the family.
Codon usage bias, a common feature in most organisms, provides valuable insights into evolutionary mechanisms and patterns. The two sequenced Mycetia species exhibited highly consistent codon usage patterns. Of the 64 codons encoding 20 amino acids, methionine (Met) and tryptophan (Trp) were each specified by a single codon, while arginine (Arg), leucine (Leu), and serine (Ser) showed the highest redundancy with 6 codons each. The relative synonymous codon usage (RSCU) values of orthologous codons were similar between the two species. Both species possessed 11 highly preferred codons (RSCU > 1.3) and 8 moderately preferred codons (1.2 < RSCU < 1.3). M. hirta had 14 low-preference codons (1.0 < RSCU < 1.2), while M. sinensis had 13. Notably, 14 codons in M. hirta and 13 in M. sinensis showed a preference for A-ending nucleotides.
In plant plastid genomes, nucleotide variability (π) is influenced by core evolutionary processes, namely mutation, selection, genetic drift, and gene flow, as well as biological and environmental factors [42,43,44]. In this study, π values for Mycetia ranged from 0 to 0.08167, with a mean of 0.0096. This level of interspecific divergence is typical for closely related species within angiosperms, indicating moderate chloroplast genome differentiation between M. hirta and M. sinensis. The extreme values highlight the mosaic pattern of evolution in plastid genomes, with highly conserved regions under strong purifying selection (π ≈ 0) alongside hypervariable hotspots (π > 0.08), such as the trnE-trnT intergenic spacer.
Variation hotspots were primarily localized in non-coding regions, indicating relatively high nucleotide diversity in these areas. This uneven distribution of variability makes these regions particularly useful for investigating plant evolutionary processes and informing biodiversity conservation.
Phylogenetic analysis confirmed that the two Mycetia species with Mycetia bracteata in Thureborn et al. [23] form a well-supported monophyletic clade. This result reinforced the taxonomic integrity and evolutionary independence of the genus. Based on our taxon sampling, Mycetia and Neohymenopogon form a strongly supported sister clade, which aligns with the findings of Thureborn et al. [23]; however, it conflicts with their former work [45]. Such topological inconsistency points to nuclear-cytoplasmic discordance, which underscoring the necessity of integrating multi-locus nuclear data or expanded taxon sampling to resolve the phylogenetic placement of Mycetia and identify its authentic sister group. Within the large phylogenetic branch, the genus was nested within the tribe Argostemateae, with four other genera (Argostemma, Clarkella, Mouretia, and Neohymenopogon), and this result is also consistent with prior systematic molecular studies [2,23,44,45,46,47]. The formation of this tribe is based on a suite of shared morphological and molecular traits that have been identified through detailed taxonomic and phylogenetic studies [44,45]. Furthermore, our analysis recovered a strongly supported clade comprising the monotypic genera Foonchewia and Cyanoneuron, which is a sister to the genus Dunnia. This topology aligns with earlier phylogenetic research [2,47,48], providing additional support for this evolutionary relationship.
5. Conclusions
This study presents the complete plastid genomes of M. hirta and M. sinensis. Both plastomes exhibit the canonical quadripartite structure of angiosperms, a conserved gene repertoire (127 genes), and highly similar GC content (37.7–37.8%), reflecting strong structural conservation within the genus. Despite this structural conservation, analyses of nucleotide diversity (π) and selective pressure uncovered regions of significant divergence. Notably, the trnE-trnT intergenic spacer (a π hotspot) and genes such as psaJ and ycf15 exhibited higher evolutionary rates, marking them promising candidates for developing DNA barcodes. Predominantly low Ka/Ks ratios (mean = 0.2900) indicate widespread purifying selection. Phylogenomic results showed that Mycetia is monophyletic and robustly placed Mycetia within the tribe Argostemmateae, which is sister to the tribe Neohymenopogon, supporting its recent taxonomic delineation. Collectively, these findings establish a foundational plastome framework for Mycetia, deliver practical molecular markers for population studies, and enhance the genomic resources available for Rubiaceae systematics and conservation.
Supplementary Materials
The following supporting information can be downloaded at https://www.mdpi.com/article/10.3390/genes16121481/s1. Table S1 is the plastid genome function; Table S2 is SDR; Table S3 is RSCU; Table S4 is Ka and Ks; Table S5 is detailed species information for phylogenetic tree construction; Figure S1 is the whole Mycetia cp genome; Text S1 is M. hirta in GFF format; Text S2 is M. sinensis in GFF format.
Author Contributions
Conceptualization, D.X.; methodology, D.X.; validation, D.X.; formal analysis, D.X.; investigation, D.X.; resources, D.X.; writing—original draft preparation, D.X.; writing—review and editing, L.Z., C.Z., L.S., W.Q., H.L. and Q.Z. All authors have read and agreed to the published version of the manuscript.
Funding
This study was supported by the National Natural Science Foundation of China (32200169).
Institutional Review Board Statement
Not applicable.
Informed Consent Statement
Not applicable.
Data Availability Statement
The original contributions presented in this study are included in the Supplementary Materials. Further inquiries can be directed to the corresponding authors.
Acknowledgments
We thank Zhuqiu Song in South China Botanical Garden for helping field survey and phylogenetic reconstruction.
Conflicts of Interest
The authors declare no conflicts of interest.
References
- Verstraete, B.; De Block, P.; Robbrecht, E. A survey of generic names in Rubiaceae (Gentianales) with notes on context and patterns in naming. Taxon 2025, 74, 1153–1171. [Google Scholar] [CrossRef]
- Razafimandimbison, S.G.; Rydin, C. Phylogeny and classification of the coffee family (Rubiaceae, Gentianales): Overview and outlook. Taxon 2024, 73, 673–717. [Google Scholar] [CrossRef]
- Hassler, M. World Plants. Synonymic Checklist and Distribution of the World Flora. Version 25. 2025. Available online: https://www.worldplants.de (accessed on 3 October 2025).
- Lo, H.S. Mycetia Reinw. and Myrioneuron R. Br. ex Kurz; Lo, H.S., Ed.; Science Press: Beijing, China, 1999; Volume 71, pp. 309–326. (In Chinese) [Google Scholar]
- Chen, T.C.; Taylor, M. Mycetia Reinwardt and Myrioneuron R. Brown ex Bentham & J. D. Hooker. In Flora of China; Wu, Z.Y., Raven, P.H., Eds.; Science Press: Beijing, China; Missouri Botanical Garden Press: St. Louis, MO, USA, 2011; Volume 19, pp. 242–249. [Google Scholar]
- Lu, Y.L.; Liang, Y.Q.; Chen, Z.H.; Guan, Y.L. Preliminary Study on the Morphogenesis of Mycetia sinensis. Hereditas 1989, 11, 9. (In Chinese) [Google Scholar]
- Nur Kabidul Azam, M.; Biswas, P.; Mohaimenul Islam Tareq, M.; Ridoy Hossain, M.; Bibi, S.; Anisul Hoque, M.; Khandker, A.; Ashraful Alam, M.; Nazmul Hasan Zilani, M.; Shahedur Rahman, M.; et al. Identification of antidiabetic inhibitors from Allophylus villosus and Mycetia sinensis by targeting α-glucosidase and PPAR-γ: In-vitro, in-vivo, and computational evidence. Saudi Pharm. J. 2024, 32, 101884. [Google Scholar] [CrossRef] [PubMed]
- Nur Kabidul Azam, M.; Biswas, P.; Amia Khandker, M.; Mohaimenul Islam, T.; Tauhida, S.J.; Shishir, T.A.; Bibi, S.; Alam, A.; Zilani, M.N.H.; Albekairi, N.A.; et al. Profiling of antioxidant properties and identification of potential analgesic inhibitory activities of Allophylus villosus and Mycetia sinensis employing in vivo, in vitro, and computational techniques. J. Ethnopharmacol. 2025, 336, 118695. [Google Scholar] [CrossRef]
- Shaw, J.; Lickey, E.B.; Schilling, E.E.; Small, R.L. Comparison of Whole Chloroplast Genome Sequences to Choose Noncoding Regions for Phylogenetic Studies in Angiosperms: The Tortoise and the Hare III. Am. J. Bot. 2007, 94, 275–288. [Google Scholar] [CrossRef]
- Hong, Z.; He, W.; Liu, X.; Tembrock, L.R.; Wu, Z.; Xu, D.; Liao, X. Comparative Analyses of 35 Complete Chloroplast Genomes from the Genus Dalbergia (Fabaceae) and the Identification of DNA Barcodes for Tracking Illegal Logging and Counterfeit Rosewood. Forests 2022, 13, 626. [Google Scholar] [CrossRef]
- Zhou, J.; Niu, J.M.; Wang, X.Y.; Yue, J.R.; Zhou, S.L.; Liu, Z.W. Plastome evolution in the genus Sium (Apiaceae, Oenantheae) inferred from phylogenomic and comparative analyses. BMC Plant Biol. 2023, 23, 368. [Google Scholar] [CrossRef]
- Yuan, L.; Zhang, N.-N.; Zhu, S.-X.; Lu, Y. The Complete Chloroplast Genome of Purdom’s Rhododendron (Rhododendron purdomii Rehder & E. H.Wilson): Genome Structure and Phylogenetic Analysis. Forests 2025, 16, 1120. [Google Scholar] [CrossRef]
- Mo, Z.Q.; Fu, C.N.; Zhu, M.S.; Milne, R.I.; Yang, J.B.; Cai, J.; Qin, H.T.; Zheng, W.; Hollingsworth, P.M.; Li, D.Z.; et al. Resolution, Conflict and Rate Shifts: Insights from a Densely Sampled Plastome Phylogeny for Rhododendron (Ericaceae). Ann. Bot. 2022, 130, 687–701. [Google Scholar] [CrossRef]
- Zhang, Y.; Chen, S.; Wang, R.J. The complete chloroplast genome of Leptodermis scabrida (Rubiaceae): An endemic shrub in Himalaya-Hengduan Mountains. Mitochondrial DNA B Resour. 2019, 5, 169–170. [Google Scholar] [CrossRef]
- Arbizu, C.I.; Ferro-Mauricio, R.D.; Chávez-Galarza, J.C.; Guerrero-Abad, J.C.; Vásquez, H.V.; Maicelo, J.L. The complete chloroplast genome of the national tree of Peru, quina (Cinchona officinalis L., Rubiaceae). Mitochondrial DNA B Resour. 2021, 6, 2781–2783. [Google Scholar] [CrossRef]
- Tan, F.; Li, W.; Lü, J.; Pei, C.; Li, Q.; Jia, Y.; Wang, J. Characterization of the complete chloroplast genome of Trailliaedoxa gracilis (Rubiaceae). Mitochondrial DNA B Resour. 2023, 8, 1–3. [Google Scholar] [CrossRef]
- Safhi, F.A.; Jalal, A.S.; Alshegaihi, R.M.; Alshamrani, R.; Alamri, A.M.; Felemban, W.; Abuzaid, A.O.; Hussein, M.A.A.; Al Aboud, N.M.; Magdy, M.; et al. The complete chloroplast genome of Psydrax latifolia: Evolutionary dynamics, comparative genomics and phylogeny. Front. Ecol. Evol. 2024, 12, 1416876. [Google Scholar] [CrossRef]
- Shi, J.Z.; Chen, X.Y.; Jing, Y.Y.; Yan, Y.G.; Zhang, G.; Yang, B.Y.; Peng, L. The chloroplast genome sequence and phylogenetic analysis of Rubia alata Wall and Rubia ovatifolia Z. Ying Zhang. (Rubiaceae). Mol. Biol. Rep. 2024, 51, 1140. [Google Scholar] [CrossRef] [PubMed]
- Nguyen, H.D.; Luc, M.T.; Vu, M.T. Complete chloroplast genome of Ixora finlaysoniana: Comparative analysis and phylogenetic insights into Ixoroideae (Rubiaceae). J. Asia-Pac. Biodivers. 2025. [Google Scholar] [CrossRef]
- Ly, S.N.; Garavito, A.; De Block, P.; Asselman, P.; Guyeux, C.; Charr, J.C.; Janssens, S.; Mouly, A.; Hamon, P.; Guyot, R. Chloroplast genomes of Rubiaceae: Comparative genomics and molecular phylogeny in subfamily Ixoroideae. PLoS ONE 2020, 15, e0232295. [Google Scholar] [CrossRef]
- Amenu, S.G.; Wei, N.; Wu, L.; Oyebanji, O.; Hu, G.W.; Zhou, Y.D.; Wang, Q.F. Phylogenomic and comparative analyses of Coffeeae alliance (Rubiaceae): Deep insights into phylogenetic relationships and plastome evolution. BMC Plant. Biol. 2022, 22, 88. [Google Scholar] [CrossRef]
- Zhao, S.Y.; Muchuku, J.K.; Liang, H.Y.; Wang, Q.F. A complete chloroplast genome of a traditional Chinese medicine herb, Rubia podantha, and phylogenomics of Rubiaceae. Physiol. Mol. Biol. Plants 2023, 29, 843–853. [Google Scholar] [CrossRef]
- Thureborn, O.; WikstrÖm, N.; Razafimandimbison, S.G.; Rydin, C. Plastid phylogenomics and cytonuclear discordance in Rubioideae, Rubiaceae. PLoS ONE 2024, 19, e0302365. [Google Scholar] [CrossRef]
- Li, X.; Mo, X.; Wang, D. Phylogeny and evolutionary dynamics of the Rubia genus based on the chloroplast genome of Rubia tibetica. Sci. Rep. 2025, 15, 14370. [Google Scholar] [CrossRef]
- Doyle, J.J.; Doyle, J.L. A rapid DNA isolation procedure for small quantities of fresh leaf tissue. Phytochem. Bull. 1987, 19, 11–15. [Google Scholar]
- Zeng, C.X.; Hollingsworth, P.M.; Yang, J.; He, Z.S.; Zhang, Z.R.; Li, D.Z.; Yang, J.B. Genome skimming herbarium specimens for DNA barcoding and phylogenomics. Plant Methods 2018, 14, 43. [Google Scholar] [CrossRef]
- Yan, K.J.; Xu, D.X.; Song, Z.Q. Mycetia fangii (Rubiaceae), a new species from South China, with notes on M. cauliflora. Syst. Bot. 2016, 41, 229–237. [Google Scholar] [CrossRef]
- Kearse, M.; Moir, R.; Wilson, A.; Stones-Havas, S.; Cheung, M.; Sturrock, S.; Buxton, S.; Cooper, A.; Markowitz, S.; Duran, C.; et al. Geneious Basic: An integrated and extendable desktop software platform for the organization and analysis of sequence data. Bioinformatics 2012, 28, 1647–1649. [Google Scholar] [CrossRef] [PubMed]
- Qu, X.J.; Fan, S.J.; Wicke, S.; Yi, T.S. Plastome reduction in the only parasitic gymnosperm Parasitaxus is due to losses of photosynthesis but not housekeeping genes and apparently involves the secondary gain of a large inverted repeat. Genome Biol. Evol. 2019, 11, 2789–2796. [Google Scholar] [CrossRef]
- Beier, S.; Thiel, T.; Münch, T.; Scholz, U.; Mascher, M. MISA-web: A web server for microsatellite prediction. Bioinformatics 2017, 33, 2583–2585. [Google Scholar] [CrossRef]
- Kurtz, S.; Choudhuri, J.V.; Ohlebusch, E.; Schleiermacher, C.; Stoye, J.; Giegerich, R. REPuter: The Manifold Applications of Repeat Analysis on a Genomic Scale. Nucleic Acids Res. 2001, 29, 4633–4642. [Google Scholar] [CrossRef]
- Amiryousefi, A.; Hyvönen, J.; Poczai, P. IRscope: An online program to visualize the junction sites of chloroplast genomes. Bioinformatics 2018, 34, 3030–3031. [Google Scholar] [CrossRef]
- Sharp, M.; Tuohy, T.M.F.; Mosurski, K.R. Codon usage in yeast: Cluster analysis dearly differentiates highly and lowly expressed genes. Nucleic Acids Res. 1986, 14, 5125–5143. [Google Scholar] [CrossRef]
- Katoh, K.; Rozewicki, J.; Yamada, K.D. MAFFT online service: Multiple sequence alignment, interactive sequence choice and visualization. Brief. Bioinform. 2019, 20, 1160–1166. [Google Scholar] [CrossRef] [PubMed]
- Rozas, J.; Ferrer-Mata, A.; Sánchez-DelBarrio, J.C.; Guirao-Rico, S.; Librado, P.; Ramos-Onsins, S.E.; Sánchez-Gracia, A. DnaSP 6: DNA Sequence Polymorphism Analysis of Large Data Sets. Mol. Biol. Evol. 2019, 34, 3299–3302. [Google Scholar] [CrossRef]
- Nguyen, L.T.; Schmidt, H.A.; von Haeseler, A.; Minh, B.Q. IQTREE: A fast and effective stochastic algorithm for estimating maximum likelihood phylogenies. Mol. Biol. Evol. 2015, 32, 268–274. [Google Scholar] [CrossRef]
- Yu, W.; Li, X.J.; Lv, Z.; Yang, L.E.; Peng, D.L. The complete chloroplast genome sequences of monotypic genus Pseudogalium, and comparative analyses with its relative genera. BMC Genom. 2025, 26, 93. [Google Scholar] [CrossRef]
- Xue, L. Comparative Chloroplast Genomics and Phylogenetic Relationships of Subtribe Paederiinae Miq. Master’s Thesis, Central South University of Forestry & Technology, Changsha, China, 2025. [Google Scholar]
- Zhang, Y.; Song, M.F.; Tang, D.Y.; Li, X.J.; Xu, N.J.; Li, H.T.; Lu, Q.; Wang, Y.Q.; Yin, C.Y.; Zhang, L.X.; et al. Comprehensive comparative analysis and development of molecular markers for Lasianthus species based on complete chloroplast genome sequences. BMC Plant Biol. 2024, 24, 867. [Google Scholar] [CrossRef]
- Dai, J.P.; Liu, Q.Z.; Xu, X.Y.; Tan, Z.J.; Lin, Y.X.; Gao, X.X.; Zhu, S. Comparative and phylogenetic analysis of the complete chloroplast genomes of Uncaria (Rubiaceae) species. Front. Plant Sci. 2023, 14, 1271689. [Google Scholar] [CrossRef]
- Wolfe, K.H.; Li, W.H.; Sharp, P.M. Rates of nucleotide substitution vary greatly among plant mitochondrial, chloroplast and nuclear DNAs. Proc. Natl. Acad. Sci. USA 1987, 84, 9054–9058. [Google Scholar] [CrossRef]
- Long, H.; Sung, W.; Kucukyildirim, S.; Williams, E.; Miller, S.F.; Guo, W.; Patterson, C.; Gregory, C.; Strauss, C.; Stone, C.; et al. Evolutionary determinants of genome-wide nucleotide composition. Nat. Ecol. Evol. 2018, 2, 237–240. [Google Scholar] [CrossRef]
- Sun, J.H.; Wang, Y.H.; Qiao, P.; Zhang, L.; Li, E.Z.; Dong, W.P.; Zhao, Y.P.; Huang, L.Q. Pueraria montana population structure and genetic diversity based on chloroplast genome data. Plants 2023, 12, 2231. [Google Scholar] [CrossRef]
- Ginter, A.; Razafimandimbison, S.G.; Bremer, B. Phylogenetic affinities of Myrioneuron and Cyanoneuron, generic limits of the tribe Argostemmateae and description of a new Asian tribe, Cyanoneuroneae (Rubiaceae). Taxon 2015, 64, 286–298. [Google Scholar] [CrossRef]
- Thureborn, O.; Razafimandimbison, S.G.; Wikström, N.; Rydin, C. Target capture data resolve recalcitrant relationships in the coffee family (Rubioideae, Rubiaceae). Front. Plant Sci. 2022, 13, 967456. [Google Scholar] [CrossRef]
- Bremer, B.; Manen, J.F. Phylogeny and classification of the subfamily Rubioideae (Rubiaceae). Plant Syst. Evol. 2000, 225, 43–72. [Google Scholar] [CrossRef]
- Rydin, C.; Razafimandimbison, S.G.; Khodabandeh, A.; Bremer, B. Evolutionary relationships in the Spermacoceae alliance (Rubiaceae) using information from six molecular loci: Insights into systematic affinities of Neohymenopogon and Mouretia. Taxon 2009, 58, 793–810. [Google Scholar] [CrossRef]
- Wen, H.Z.; Wang, R.J. Foonchewia guangdongensis gen. et sp. nov. (Rubioideae: Rubiaceae) and its systematic position inferred from chloroplast sequences and morphology. J. Syst. Evol. 2012, 50, 467–476. [Google Scholar] [CrossRef]
Disclaimer/Publisher’s Note: The statements, opinions and data contained in all publications are solely those of the individual author(s) and contributor(s) and not of MDPI and/or the editor(s). MDPI and/or the editor(s) disclaim responsibility for any injury to people or property resulting from any ideas, methods, instructions or products referred to in the content. |
© 2025 by the authors. Licensee MDPI, Basel, Switzerland. This article is an open access article distributed under the terms and conditions of the Creative Commons Attribution (CC BY) license (https://creativecommons.org/licenses/by/4.0/).