Abstract
Background: Parkinson’s disease (PD) is a complex neurodegenerative disorder in aged people with multifaceted molecular underpinnings. It poses a severe threat to millions of older adults worldwide. The understanding of the molecular mechanisms of PD development and the performance of its therapeutic strategies has not yet reached a satisfactory level. Methods: This study integrated six transcriptomic datasets to uncover key genes (KGs) and their underlying pathogenic mechanisms, providing insights into potential therapeutic strategies for PD. We designed a comprehensive computational pipeline using various bioinformatics tools and databases to investigate PD-causing KGs, focusing on their functions, pathways, regulatory mechanisms, and potential therapeutic drug molecules. Results: In order to explore PD-causing KGs, we initially identified 303 differentially expressed genes (DEGs) between PD and control samples with 204 upregulated and 99 downregulated DEGs using the LIMMA approach with threshold values at Adj. p-value < 0.05 and abs (log2FC) ≥ 1.0. Then, protein–protein interaction (PPI) network analysis pinpointed seven top-ranked DEGs (GAPDH, PTEN, CCND1, APOE, ESR1, MAPK3/ERK1, and SNCA) as KGs or central modulators of PD pathogenesis. Regulatory network analysis of KGs identified 3 top-ranked transcription factors (FOXC1, NFKB1, and TFAP2A) and 6 microRNAs (hsa-let-7b-5p, hsa-mir-16-5p, and others) as the pivotal regulators of KGs. Gene Ontology (GO) terms and KEGG pathway enrichment analyses with KGs revealed several crucial biological processes, molecular functions, cellular components, and neurodegenerative pathways associated with the development of PD. Finally, the top five molecules guided by KGs (Nilotinib, Bromocriptine, Withaferin-A, Celastrol, and Donepezil) were identified as promising drug candidates against PD and validated computationally through ADME/T analysis and molecular dynamics simulation studies. Conclusions: The findings of this study may serve as valuable resources for developing effective treatment strategies for PD patients.
1. Introduction
Parkinson’s disease (PD) is the second most common neurodegenerative disorder, characterized by the progressive degeneration of dopaminergic neurons in the substantia nigra (SN) among the elderly. This degeneration leads to a significant reduction in dopamine levels, resulting in the hallmark motor symptoms of PD, such as tremors, rigidity, and bradykinesia [1]. Currently, more than 10 million people are suffering from PD complexities worldwide [2], with projections estimating that the global PD population might rise to 12–17 million by 2040. Between 1999 and 2019, the number of deaths from PD increased significantly in all age groups, both men and women, people of different races and ethnicities, and in both urban and rural areas [3]. Treatment options from available medications focus only on reducing symptoms of PD [4]. Despite its widespread impact, there is no definitive treatment for it [5,6]. Therefore, more research is required to explore better treatments for PD. Historically, PD was predominantly attributed to environmental causes, but recent studies indicate that its development stems from a complex interplay between genetic factors and environmental influences [7,8]. This complex interplay contributes to a major pathological hallmark of PD, which is the formation of filamentous cytoplasmic inclusions, primarily composed of aggregated α-synuclein, which form Lewy bodies (LB) or Lewy neurites (LN). Phosphorylation and fibrillization of α-synuclein lead to LB formation and neuronal death [3]. Mitochondrial dysfunction caused by various harmful factors contributes to ROS production and oxidative stress in PD. The mtDNA mutations cause mitochondrial dysfunction by impairing the ETC, leading to ROS production. ROS caused the collapse of mitochondrial membrane potential (MMP) and disruption of complex I, leading to increased cytosolic Ca2+ and cytochrome c, which triggered apoptosis pathways [4]. A schematic diagram illustrating the relationship between genetic factors and PD is shown in Figure 1.
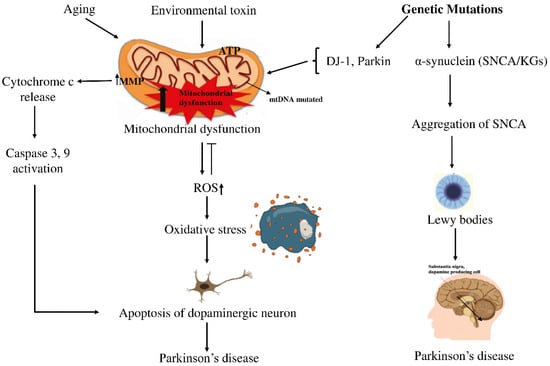
Figure 1.
Schematic view of how genetic and environmental factors intertwine in PD. On one side, aging and exposure to certain toxins seem to push mitochondria into dysfunction, raising oxidative stress and activating caspases, steps that often end with dopaminergic neurons dying off. On the other side, mutations in SNCA drive α-synuclein clumping into LBs, the protein deposits long associated with PD. In the end, both routes point to the same outcome: the gradual loss of dopaminergic neurons, which remains the defining feature of the disease. Arrows (→) indicate the direction of biological processes or causal relationships between molecular events, while upward arrows (↑) denote an increase in activity or levels (e.g., ROS↑, MMP↑). Perpendicular lines (⟂) represent inhibition or blockage of specific cellular functions or pathways.
The precise mechanisms underlying PD remain complex, emphasizing the need to identify novel PD-causing genes that may offer valuable insights and potential targets for developing effective treatments and therapies [9]. Several individual studies, based on one or multiple datasets, have identified PD-causing key genes (KGs) through differential expression patterns and protein–protein interaction (PPI) analyses [10,11,12,13,14]. In these studies, authors identified differentially expressed genes (DEGs) between PD and control samples for each dataset individually. Then, they identified common DEGs (cDEGs) for multiple datasets to detect PD-causing KGs. However, their KG sets were not as consistent with each other. This may have occurred due to the identification of DEGs based on a small sample size, as most datasets consisted of a small sample size (n < 30). It is worth noting that statistical consistency depends on the sample size [15]. Therefore, this study aimed to explore more consistent PD-causing KGs by increasing the sample size in the dataset by merging multiple datasets after removing their batch effects in order to disclose drug targets and agents. To unravel the pathogenic mechanisms of the identified KGs, GO terms, KEGG-pathway enrichment analysis, and gene regulatory network (GRN) analysis were performed. Molecular docking analysis was carried out to identify potential drug candidates guided by KGs. The proposed drugs were further evaluated through ADME/T analysis to assess their pharmacokinetic and toxicological properties, followed by Molecular Dynamics (MD) simulations to investigate their stability, binding interactions, and dynamic behavior at the atomic level.
2. Methods and Materials
2.1. Data Acquisition
In order to explore PD-causing KGs and candidate drugs, we collected transcriptomics profiles datasets from the NCBI database and drug molecules through a literature review. We downloaded six microarray gene expression datasets from the GEO platform of the NCBI database with accession IDs GSE8397-GPL96 [16], GSE20141 [17], GSE49036 [18], GSE20163 [19], GSE20292 [20], and GSE20164 [21]. These datasets were generated from SN in the brain. Details of these datasets are provided in Table 1.

Table 1.
Summary of gene expression datasets used for PD analysis. The table presents details of microarray experiments, including dataset IDs (GEO accession numbers), study platforms, sample sizes (Control vs. PD), and Country.
Furthermore, to investigate KG-guided candidate drug molecules for PD, 120 candidate molecules were collected from published articles and online databases, and then three-dimensional (3D) structures were retrieved from the PubChem database [22].
2.2. Integration of Transcriptomics Datasets and Identification of DEGs
The six datasets (CEL files) downloaded from GEO were processed using the Robust Multi-Array Average (RMA) algorithm [23]. Initial quality control involved removing low-expression genes, unannotated probe IDs, and non-overlapping probe sets between GPL96 and GPL570. All arrays were then normalized together using RMA, which performs background correction, quantile normalization, log2 transformation, and probe summarization based solely on the common probe set to minimize cross-platform bias. Dataset integration and batch harmonization were assessed using density plots, MA plots, and PCA before and after normalization (Figure S1). Following the approach of a previous study, the R (version 4.3.1) statistical package LIMMA (version 3.56.2) [24] was then applied to identify DEGs between PD and control samples. LIMMA employs a moderated t-test, which incorporates the square root of the moderated variance as the standard deviation [25]. DEGs between PD patient samples and healthy controls were significant at Adj.-p < 0.05 and |log2 Fold Change| ≥ 1. Both log2-fold change (log2FC) and Adj. p-values were used as criteria to determine upregulated and downregulated DEGs. Probes lacking gene annotations were excluded. The probe exhibiting the highest log2FC was selected for genes represented by multiple probes.
2.3. Identification of KGs from DEGs
Proteins work through interactions with other proteins within the cell, and the PPI network analysis is utilized to identify KGs [26]. To construct the PPI network, the distance matrix ‘D’ is computed [27] as follows
where Ni represents the set of neighbors for the ith protein, while Nj denotes the neighbor set for the jth protein. A PPI network of DEGs was constructed using the STRING database [28] to pinpoint KGs. To extract significant KGs from this network, various topological metrics, including Degree, MNC, Edge Percolated Component (EPC), Closeness, Stress, and Radiality, were applied through the CytoHubba plugin within Cytoscape software (v3.10.0) [28]. The application of multi-parametric topological analysis enabled the detection of seven KGs, derived from the highest-ranked proteins following an extensive network assessment.
2.4. Validation of KG Expression Profiles and Their Association with PD
To independently confirm the expression patterns of the identified key genes in PD, box-plot analyses were performed using datasets retrieved from the NCBI database. Specifically, the GSE7621 dataset [29] was employed to assess differential expression between PD and control samples, and the resulting box plots verified the observed expression trends across both groups. To validate the association between PD and KGs, we applied the methodology from our earlier work [30,31], conducting disease-KGs enrichment analysis through the Enrichr tool [32] in combination with the DisGeNET database [33]. DisGeNET is a comprehensive database of gene–disease associations (GDAs) and variant–disease associations (VDAs). It uses a scoring formula to rank gene–disease associations. This scoring approach follows a probabilistic model that integrates evidence from multiple independent sources, producing a final value between 0 (indicating weak support) and 1 (indicating strong support).
2.5. Detection of Key Regulators of KGs
Transcription factors (TFs) and microRNAs (miRNAs) act as transcriptional and post-transcriptional regulators of protein-coding genes, respectively, within gene regulatory networks (GRNs). To identify primary TFs regulating KGs, we conducted a TF-KG interaction analysis using the JASPAR database [34] with the NetworkAnalyst platform [35]. Similarly, key miRNAs that impact KGs were identified through miRNA-KG interaction analysis using the TarBase database [36], facilitated by NetworkAnalyst. The most significant regulators were selected, and their interactions were visualized with Cytoscape. This comprehensive approach highlighted critical TFs and miRNAs that influence KGs at both transcriptional and post-transcriptional levels.
2.6. Detection of GO-Terms and KEGG-Pathways Associated with PD
The Gene Ontology (GO) framework categorizes gene functions into three domains: Molecular Function (MF), Cellular Component (CC), and Biological Process (BP) [37]. These categories are employed to describe the roles of KGs, focusing on their molecular mechanisms, cellular activities, and specific locations within the cell where they operate. Additionally, the Kyoto Encyclopedia of Genes and Genomes (KEGG) pathway database is commonly used to explore metabolic pathways and gene interactions [38]. To investigate the biological relevance of KGs, the Enrichr database web server [32] was utilized for conducting GO-term and KEGG pathway enrichment analyses. Also Gene Set Enrichment Analysis (GSEA) [39] was performed to identify significantly enriched KEGG pathways associated with the disease condition. Ranked gene expression data were analyzed using the GSEA tool, comparing “disease” versus “control” groups. Enrichment scores (ES) were calculated to assess the correlation of predefined gene sets with each phenotype, and the significance of enrichment was determined based on the position of pathway-related genes within the ranked dataset.
2.7. Exploring KGs-Guided Repurposable Drug Molecules Against PD
Drug discovery uses two main computational methods: de novo design, which creates new molecules but is time-consuming and costly, and drug repurposing, which tests approved drugs-protein interactions to find new therapies [40]. To explore KG-guided drug repurposing for PD, we collected 120 candidate molecules, as outlined in Section 2.1 of the method. In addition, we considered KGs-guided receptor proteins along with their regulatory transcription factor (TF) proteins for the docking study. The 3D receptor structures were sourced from the Protein Data Bank (PDB) [41], the AlphaFold Protein Structure Database [42], and the SWISS-MODEL database [43]. Discovery Studio Visualizer [44] was used to visualize the 3D structures of protein interactions. AutoDock tools (v1.2.3) were utilized for receptor protein preprocessing, which involved removing water molecules and adding charges. The drug molecules underwent energy minimization using Avogadro and were also preprocessed with AutoDock tools.
After preparing these, MD between receptors and ligands was then performed using AutoDock Vina [45] to calculate their binding affinity scores (kcal/mol). Let Xab represent the binding affinity score between the ath receptor (a = 1, 2, …, v) and the bth ligand/agent (b = 1, 2, …, u). Receptors were organized in descending order according to their average binding scores;
and ligands/agents were similarly ranked based on their average scores in descending order as follows
This ranking process was utilized to identify the highest-scoring ligands/agents as potential drug candidates.
2.8. In Silico Validation of Top-Ranked Drug Molecules
2.8.1. ADME/T Analysis
ADME/T analysis appraises the absorption, distribution, metabolism, excretion, and toxicity of drug candidates, providing essential insights into their pharmacokinetic and safety profiles. This analysis is vital for the early identification of potential safety issues, guiding drug design and dosage optimization, and supporting regulatory approval by confirming the drug’s safety and efficacy. Therefore, the top six ranked drug compounds were evaluated for their drug-like characteristics and ADME/T profiles to gain deeper insight into their structural attributes and chemical properties. Compliance with Lipinski’s rule was assessed through the SCFBio web application [46]. Following this, ADME/T properties were predicted using the SwissADME database [47] and pkCSM databases [48]. These predictions were based on the most favorable drug compound structures, represented in SMILES format, to ensure accurate calculations.
2.8.2. Molecular Dynamics (MD) Simulations
MD simulations were performed using YASARA dynamics software (version 22.8.22.W.64) [49] with the AMBER14 force field [50] to explore the dynamic behavior and stability of the top protein–ligand complexes. Six distinct systems were utilized to run MD. The top three leading interactions included MAPK3_Nilotinib, PTEN_Withaferin-A, and GAPDH_Bromocriptine, corresponding to our candidate receptors. Prior to the simulation, the hydrogen bond networks of the selected complexes were refined and immersed in a TIP3P water model. Solvent density was calibrated to 0.997 g/mL to ensure periodic boundary conditions. An initial energy minimization was performed using the steepest descent method over 5000 cycles. Simulations were conducted under standard physiological conditions (298 K, pH 7.4, 0.9% NaCl) and utilized a multi-time-step algorithm [51], incorporating a 2.50 femtosecond (fs) time-step interval [52]. A 100-nanosecond MD was carried out using a Berendsen thermostat [53] to regulate temperature and maintain constant pressure, ensuring a stable and realistic environment for the simulation. Simulation trajectories were recorded at 250-picosecond (ps) intervals, offering detailed snapshots of system behavior for comprehensive, in-depth analysis. The initial study was performed using the default script of the YASARA macro and SciDAVis (https://scidavis.sourceforge.net). Subsequently, binding free energy calculations based on MM-PBSA (MM-Poisson–Boltzmann surface aolecular Mechanics–Poisson–Boltzmann Surface area) were carried out with YASARA software (version 22.8.22.W.64), applying the following formula to compute the binding free energy [54].
Binding Free Energy = EpotReceptor + EsolvReceptor + EsolvLigand + EpotLigand − EsolvComplex − EpotComplex
The binding energies were determined through MM-PBSA analysis utilizing YASARA’s built-in macros with the AMBER 14 force field, where more positive values indicate stronger binding [55].
2.9. The Workflow of the Study
The workflow of this study, as described in Section 2.1, Section 2.2, Section 2.3, Section 2.4, Section 2.5, Section 2.6, Section 2.7, Section 2.8 and Section 2.9, is graphically illustrated in Figure 2 for convenience of presentation.
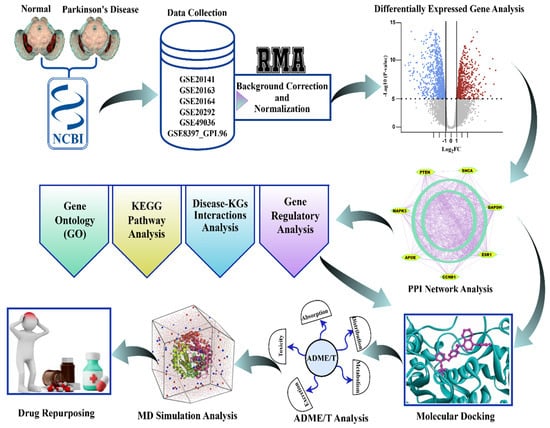
Figure 2.
The graphical workflow for the identification of biomarker genes and therapeutic agents for Parkinson’s disease. Normalized and corrected transcriptomic data downloaded from NCBI GEO underwent differential expression analysis. Significant genes went through GO, KEGG, disease-KG, and regulatory network analysis, after which PPI network analysis was conducted to identify the hub genes. Prospective drugs went through molecular docking, ADME/T, and MD simulation, resulting in candidate repurposing therapies for Parkinson’s disease.
3. Result
3.1. Quality Control and Batch Effect Integration
To ensure the reliability of the integrated gene expression dataset, we employed a rigorous quality control and batch correction workflow. The first steps focused on removing technical noise and reducing systematic bias present in the raw data. As expected, the unprocessed expression values (Figure S1A) exhibited a pronounced right-skewed distribution, a common feature in raw microarray data, where many genes display low signal intensity. Following
transformation and normalization, the distribution was successfully centered and became more symmetrical (Figure S1B), confirming that the data are appropriately scaled for downstream statistical methods.
Principal Component Analysis (PCA) was used to visualize the dominant sources of variation before and after integration. PCA of the combined, normalized data revealed that the primary source of variance was the technical batch effect (GSE Study ID). Samples clustered tightly and distinctly based on their original batch (color), with PC1 explaining a high percentage of the total variance (86.0%) (Figure S1C). This confirmed that the batch effect was strong enough to completely mask any underlying biological signal. After applying the batch correction, the PCA plot showed that the batch-specific clustering was eliminated (Figure S1D). Samples from different batches (colors) became well-intermingled and overlapping (Figure S1D). The explained variance was more evenly distributed across the principal components, signifying that the most significant remaining sources of variation were now related to biological factors, such as the differences between the Control and Disease groups.
We assessed intensity-dependent bias by comparing a representative pair of samples. The MA plot for the pre-normalized data (Figure S1E) showed a clear curved trend and high variance (fanning) at low average expression values, indicating a strong systematic bias. Following normalization, the data were successfully aligned to the horizontal M = 0 axis (Figure S1F), demonstrating the effective removal of this bias and establishing data comparability across the intensity spectrum.
3.2. Differential Gene Expression Patterns Identified from Integrated Transcriptomes
At first, the CEL file formats of the six datasets were downloaded from the GEO platform of the NCBI database. Then, their batch effects (background correction) were removed and normalized using the robust multi-array averaging (RMA) algorithm. Afterward, these datasets were combined, comprising 79 patients with PD and 63 age-matched controls, as shown in Table 1. Then, we performed differential expression analysis by applying the statistical LIMMA technique and identified 303 DEGs that exhibited significant alterations in PD compared to controls (Adj. p-value < 0.05 & |log2FC| ≥ 1). Among these DEGs, 204 demonstrated upregulation, while 99 showed downregulation in PD samples (Table S1), suggesting substantial transcriptional remodeling in the disease state.
3.3. Key Genes Identified from Differentially Expressed Gene Analysis
The PPI network analysis was conducted utilizing the STRING database [56], with 303 DEGs. Implementation of multi-parametric topological analytics facilitated the identification of seven KGs. These pivotal molecular modulators (GAPDH, PTEN, CCND1, APOE, ESR1, MAPK3/ERK1, and SNCA) appeared as central orchestrators within the constructed interactome network, of which GAPDH, CCND1, and ESR1 were upregulated; in contrast, SNCA, PTEN, APOE, and MAPK3 were downregulated (Figure 3 and Table S2).
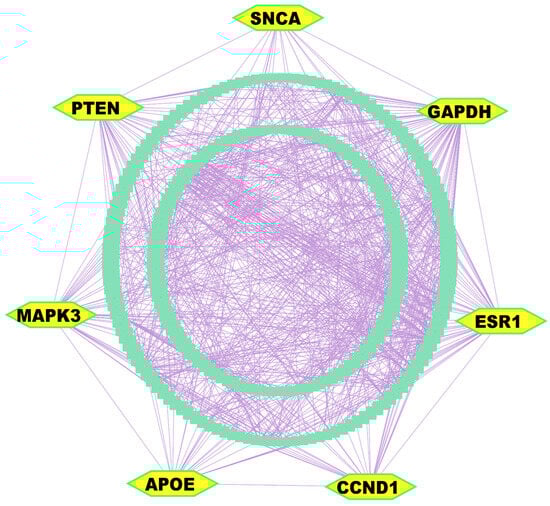
Figure 3.
PPI network analysis of DEGs revealed KGs, highlighted as yellow nodes within the interactome network.
3.4. Regulatory Network Analysis Reveals Key Regulators of Key Genes
We investigated the regulatory networks involving TFs and miRNAs that govern the expression of the identified KGs. This analysis aimed to uncover both the transcriptional and post-transcriptional mechanisms controlling the KGs. For the transcriptional regulators, we selected the top three TFs, such as FOXC1, NFKB1, and TFAP2A, based on their high values for the topological metrics of betweenness ≥ 85.60 and degree ≥ 4 within the regulatory network (Figure 4A).
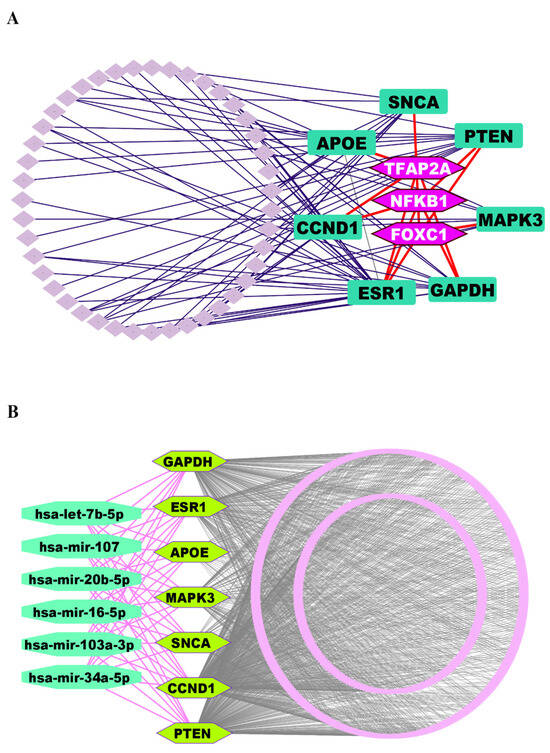
Figure 4.
(A) TFs-KGs interactome network to explore key regulatory factors of KGs, where KGs are ornamented as round rectangle-shaped markers in dark green color, and TFs are highlighted in hexagon-shaped markers with light purple color. (B) The miRNA-KGs interactome network, where KGs are depicted as hexagon-shaped markers in pure green color, and miRNAs are displayed as round octagon markers in lime green.
Similarly, to identify the post-transcriptional regulators, we applied the same topological criteria, this time using a degree cutoff of ≥7 and a betweenness cutoff of ≥588.89. This led us to select the top six miRNAs (hsa-mir-16-5p, hsa-mir-34a-5p, hsa-let-7b-5p, hsa-mir-103a-3p, hsa-mir-107, and hsa-mir-20b-5p) as key regulators of the KGs at the post-transcriptional level (Figure 4B).
3.5. KGs Validation of KG Expression Profiles and Their Association with PD
We validated the differential expression of the KGs using an independent dataset, comprising 16 PD and 9 control samples, and visualized the results through box-plot analysis (Figure S2). This assessment confirmed our initial observations, showing that three KGs were upregulated and four were downregulated in PD. Disease-gene association analysis was performed by querying the DisGeNET database within the Enrichr platform [31]. This revealed that the identified KGs exhibited statistically significant relationships (Adj. p-value < 0.05) with several prominent neurological disorders (Alzheimer’s disease, Brain neoplasms, Motor symptoms, Neuroblastoma, Astrocytoma), including PD. These findings suggest the centrality of the detected KGs in the pathogenesis of Parkinson’s and related neuronal diseases (Table S3).
3.6. Functional Enrichment Analysis Reveals GO Terms and KEGG Pathways Associated with PD
GO-terms and KEGG-pathway enrichment analyses were conducted on the KGs to gain comprehensive mechanistic insights into the underlying pathobiology of PD. The significantly enriched BPs, MFs, and CCs are demonstrated in Figure 5A–C and Table S4, respectively. Additionally, the considerably overrepresented KEGG pathway is illustrated in Figure 5D and Table S4. Also, we have conducted GSEA that revealed significant enrichment of pathways associated with neurodegenerative and signaling processes (Figure S3).
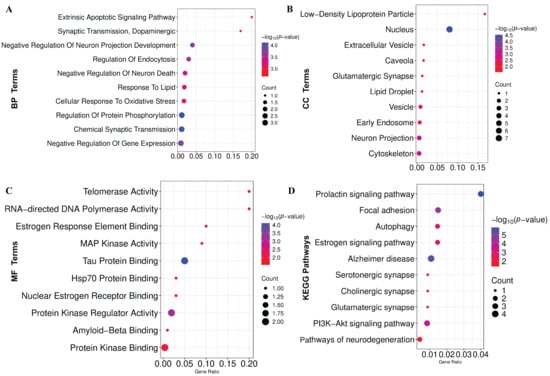
Figure 5.
Functional enrichment of KGs. (A) Biological process (BP). (B) Cellular component (CC). (C) Molecular function (MF). (D) KEGG pathway enrichment analysis.
3.7. Exploring KGs-Guided Drug Molecules by Molecular Docking Analysis
For selecting top-ranked candidate drug molecules by molecular docking analysis, as introduced in Section 2.7, we considered 120 candidate drug compounds (ligands) (Table S5) and ten target proteins (receptors) derived from our identified seven KGs and their three principal transcriptional regulators. To do so, 3D structures of 9 receptors (GAPDH, PTEN, CCND1, APOE, ESR1, MAPK3, SNCA, NFKB1, and TFAP2A) were downloaded from the Protein Data Bank (PDB) with source IDs 4WNC, 5BZZ, 6P8E, 2KC3, 5T0X, 4QTB, 1XQ8, 1MDI, and 8J0L, respectively. The remaining one (FOXC1) was downloaded from AlphaFold with the UniProt ID Q12948 as the source. On the other hand, 120 ligands with 3D structures were taken out from the PubChem database [22], as previously noted. Following this, a molecular docking analysis was conducted to assess the binding interactions between 10 target receptors and 120 drug compounds. The resulting BA scores, expressed in kcal/mol, were organized into a binding matrix M = (Mij). Ordinal ranking was established by arranging receptors and drug agents in descending order based on their respective row and column sums of the BA matrix (Figure 6 and Table S6). Nilotinib emerged as the top lead compound, demonstrating strong binding affinity (BAS < −6.5 kcal/mol) with all 10 target receptor proteins. Additionally, four other leading candidates (Bromocriptine, Withaferin-A, Celastrol, and Donepezil) also showed significant binding (BAS < −6.5 kcal/mol) with 8 out of 10 receptors. Based on these results, these five drugs were identified as promising therapeutic candidates for PD. Detailed interaction profiles between the top three receptor targets and compounds are provided in Table S7, suggesting their potential therapeutic efficacy.
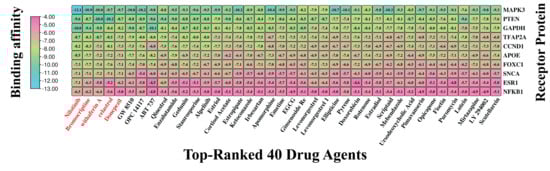
Figure 6.
Molecular docking outcomes display the highest-ranking 40 drug candidates aligned with their specific receptors. Binding scores are represented, where sky hues denote strong interactions between the drug compounds and target proteins, while pink hues signify weaker affinities. Also, a larger negative value indicates a stronger binding affinity. This visual representation places the top 40 drug agents (out of 120) on the X-axis and the 10 proposed target proteins along the Y-axis. Drug names highlighted in red indicate the top five compounds with the strongest binding affinities across multiple receptor proteins.
3.8. In Silico Validation Confirms the Potential of Top-Ranked Drug Molecules
3.8.1. Pharmacokinetic Analysis
The ADME profile of a drug molecule is fundamental to defining its pharmacokinetic properties and overall therapeutic performance. A detailed analysis of these properties is essential to confirm that the drug achieves high bioavailability, distributes adequately across target tissues, follows well-defined metabolic pathways, and is effectively eliminated from the body. The ADME/T characteristics of the five drugs were assessed using different parameters. Withaferin-A and Donepezil fully adhered to Lipinski’s rule [57], confirming their drug-like properties, whereas Nilotinib, Bromocriptine, and Celastrol each exhibited a single rule violation. The lipophilicity (LogP values) of these five compounds aligns with Lipinski’s range (1 to ≤5), confirming their classification as lipophilic agents except Celastrol (Table 2). Several characteristics can be used to assess their toxicity and ADME. These compounds show potential as oral drug candidates due to their predicted high gastrointestinal absorption. A compound is generally regarded as well absorbed in the human intestines when its Human Intestinal Absorption (HIA) score exceeds 30% [48]. In our analysis, all five proposed drugs demonstrated robust absorption properties, each with an HIA score of ≥71%, indicating their strong potential for absorption in the human body. Blood–brain barrier (BBB) penetration is a critical determinant for therapeutic efficacy in neurological disorders.
Table 2.
Drug likeness profile of candidate drug molecules.
The BBB permeability index, expressed as logBB, quantitatively predicts a compound’s ability to traverse this physiological interface between systemic circulation and the central nervous system. Compounds exhibiting logBB values exceeding 0.3 demonstrate favorable BBB penetration, whereas those with logBB below −1 show limited brain distribution [58,59]. Given that our investigation focuses on PD, a progressive neurodegenerative disorder, BBB penetrance represents a crucial parameter for therapeutic efficacy, as candidate compounds must effectively traverse this barrier to reach their intended molecular targets within the brain parenchyma. The five drug candidates proposed in our study demonstrate a strong potential for BBB penetration (Table 3), suggesting their suitability for central nervous system activity. Toxicity assessments of our proposed compounds, including AMES testing, LD50 analysis, and minnow LC50 evaluation, demonstrated non-toxicity across almost all parameters. These findings suggest that the compounds exhibit drug-like characteristics and are suitable for oral administration.
Table 3.
ADME and Toxicity (ADME/T) profile of the 5 top-ranked drug molecules.
3.8.2. MD Simulations Validate the Binding Stability of Selected Drug Molecules
From the pool of potential therapeutic compounds, the top three were Nilotinib, Bromocriptine, and Withaferin-A (Figure 7). Consequently, these top three drugs were chosen for stability analysis using 100 ns MD-based MM-PBSA simulations. From Figure 7, our study revealed that all three systems maintained remarkable stability despite variations in both the movement and the initial configurations of the drug–target complexes. The root mean square deviation (RMSD) was computed to assess this. Figure 7A illustrates the RMSD values corresponding to the selected receptors, including PTEN, MAPK3, and GAPDH. Despite structural variations observed between the initial and dynamic drug-target complexes, all three systems demonstrated notable stability. The stability was evaluated using RMSD analysis, as shown in Figure 7A. For the predicted receptor complexes (MAPK3, PTEN, and GAPDH), RMSD values generally fell within a range of ~1 Å to 2.5 Å, with the exception of GAPDH, which exhibited a broader range of ~2 Å to 3.7 Å. The average RMSD values for the MAPK3, PTEN, and GAPDH complexes were 1.62 Å, 1.96 Å, and 2.43 Å, respectively. Among these, the MAPK3 complex exhibited a more rigid conformation compared to the other proteins. In contrast, the GAPDH complex demonstrated greater flexibility, with RMSD values gradually increasing from 2 Å to 3.7 Å throughout the simulation. By contrast, RMSF analysis, reflecting residue-level flexibility, revealed that the GAPDH–Bromocriptine complex exhibited the greatest structural stability, with a mean value of 1.1168 Å compared to 1.3679 Å for PTEN–Withaferin-A and 1.5046 Å for MAPK3–Nilotinib, indicating more consistent target interactions (Figure 7B).
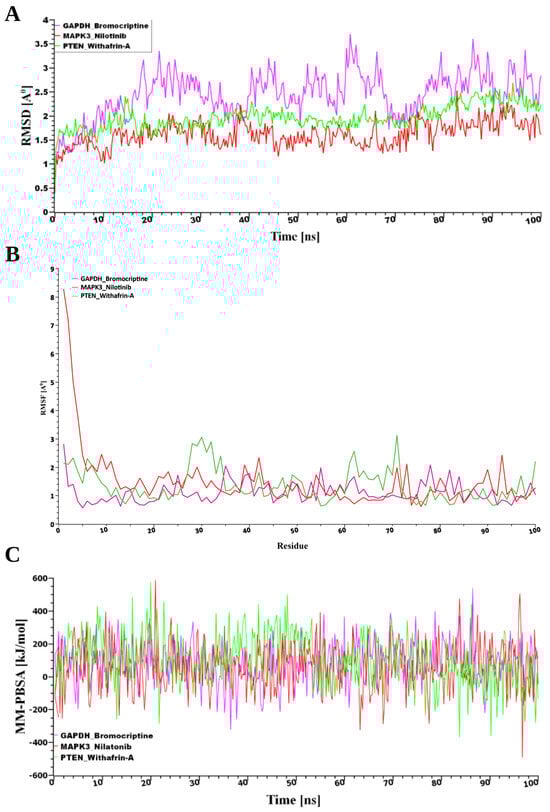
Figure 7.
(A) Time-dependent analysis of the RMSDs of the backbone atoms (C, Cα, and N) was conducted for each protein–ligand docked complex, (B) The root mean square fluctuation (RMSF), and (C) The binding free energy (expressed in kJ mol−1) for each simulation snapshot was assessed using the MM-PBSA method, indicating variations in binding stability throughout the simulation; higher values denote stronger binding interactions. The protein complexes are represented as follows: pink for GAPDH, green for PTEN, and red for MAPK3.
Furthermore, analysis of binding energies using MM-PBSA calculations revealed that PTEN had the strongest interaction with the drug (102.85 kJ/mol), followed by GAPDH (85.16 kJ/mol) and MAPK3 (59.18 kJ/mol), as shown in Figure 7B. This suggests that while MAPK3 maintained the most stable structural conformation, PTEN formed the most energetically favorable complex with the drug molecule.
4. Discussion
PD is a lifelong, progressive neurodegenerative disorder with no known cure, gradually worsening over time [60,61]. Despite extensive research, the precise molecular mechanisms underlying PD remain elusive [62], necessitating advanced bioinformatics analysis to elucidate pathogenetic mechanisms, therapeutic targets, and agents. In this study, we combined and analyzed six transcriptomics datasets using the LIMMA statistical framework and identified 303 DEGs between the PD and control groups. The PPI network analysis revealed seven DEGs as the KGs of PD pathogenesis. A disease–gene association study based on the DisGeNET database also revealed that KGs are significantly associated with various neurological disorders, including PD. The KGs-TFs and KGs-miRNAs interaction network analysis revealed three top-ranked TF proteins and six miRNAs that are associated with the transcriptional and post-transcriptional regulation of KGs. Functional enrichment analyses of KGs with GO-terms and KEGG pathways revealed some crucial biological processes (Chemical Synaptic Transmission, Negative Regulation Of Neuron Death, Cellular Response To Oxidative Stress, Positive Regulation Of Extrinsic Apoptotic Signaling, and Dopaminergic), molecular functions (Tau Protein Binding, Nuclear Estrogen Receptor Binding, Hsp70 Protein Binding), cellular components (Nucleus, Neuron Projection, Cytoskeleton, Extracellular Vesicle, and Glutamatergic Synapse), and KEGG-pathways (AD, PI3K-Akt signaling pathway, Autophagy, Pathways of neurodegeneration) that are associated with the PD pathogenesis.
4.1. KGs, Regulatory Networks, and Pathways in PD Pathogenesis
Importantly, most of the identified KGs are supported by prior PD studies and appear in PD-curated databases (DisGeNET), suggesting that their prioritization reflects genuine biological involvement rather than generic network centrality. Among PD-causing KGs, GAPDH (glyceraldehyde-3-phosphate dehydrogenase) is located on chromosome 12p13. The rs1136666 CC allele polymorphisms of GAPDH indicate a high risk of PD [63]. The S-nitrosylation of GAPDH under oxidative stress can trigger neuronal damage through nuclear translocation. It interacts with α-synuclein and other proteins implicated in neurodegenerative disorders [64,65,66]. This study revealed that NFKB1 and TFAP2A regulate the expression of GAPDH. Many researchers have reported that NFKB1, which encodes NF-κB, serves as a key transcription factor regulating the expression of inflammatory genes and innate immune responses [67,68].
Cyclin D1 (CCND1) is a key regulator of cell cycle progression driven by extracellular cues, and its abnormal expression has been associated with both tumorigenesis and apoptosis in terminally differentiated neurons [69,70]. Recent studies have further shown elevated CCND1 levels in PD cell models, linking its upregulation to α-synuclein-induced neurotoxicity. Conversely, silencing CCND1 has been demonstrated to protect against neuronal death [71].
The PTEN, governed by the transcriptional regulation of FOXC1 and NFKB1, is a major cause of neuronal cell death and may be a biological target for creating innovative treatment approaches for PD [72]. Its involvement in the autophagy pathway and increased oxidative stress contribute to neuronal apoptosis, leading to the loss of dopaminergic neurons in the SN, a key feature of PD [73]. Numerous research studies have highlighted that Apolipoprotein E (ApoE) is a key determinant of vulnerability in PD, predominantly secreted by astrocytes, and the most abundant apolipoprotein in cerebrospinal fluid (CSF) [74,75].
Enrichment analysis revealed a strong association between the regulation of nervous system development and cellular components, including endocytic vesicles and early endosomes. miRNA (hsa-let-7b-5p) was identified as a key post-regulator of ApoE, with evidence suggesting that it functions as a critical regulator of developmental pathways and has been linked to the pathogenesis of PD [76]. The overexpressed estrogen receptor-α (ESR1) gene encodes a protein associated with neuroinflammation [77], which is regulated by transcription factors including FOXC1, NFKB1, and TFAP2A. Neuroinflammation contributes to BBB disruption, enabling immune cells and toxins to enter the brain. This exacerbates the inflammatory response and accelerates neuronal damage [78].
The MAPK3 also known as ERK1 gene, which exhibits reduced expression in PD, is regulated by the transcription factor FOXC1 and plays a crucial role in the pathogenesis of the disease. An in vivo study demonstrated that nootkatone effectively suppresses MAPK3 expression by activating the PI3K/Akt signaling pathway, thereby alleviating neuroinflammation and ameliorating symptoms in a rotenone-induced PD model [79,80]. The SNCA gene, situated on chromosome 4, encodes the alpha-synuclein protein [81], a protein whose genetic variants are strongly associated with an increased risk of developing PD [82,83]. Additionally, the tau protein and SNCA risk genotypes showed a marginal association with PD susceptibility individually; however, their combined effect nearly doubled the risk of developing PD [84]. Tau aggregation, driven by post-translational modifications, disrupts microtubule networks, affects tau protein binding, and contributes to neuronal degeneration in PD [85].
4.2. Drug Discovery and Therapeutic Insights
4.2.1. New In Silico Results
Molecular docking analysis identified five top-ranked drug molecules as potential inhibitors of PTEN, CCND1, ESR1, and SNCA, and as activators of GAPDH, APOE, and MAPK3. To assess the viability of the identified drug candidates, we conducted drug-likeness evaluations along with comprehensive ADMET profiling. The drug-likeness assessment, guided by Lipinski’s Rule of Five, examined key pharmacokinetic parameters, including molar refractivity, log P, hydrogen bond donors, hydrogen bond acceptors, and molecular mass. All compounds were deemed drug-like, meeting at least four of Lipinski’s criteria. Additionally, the selected molecules exhibited favorable ADMET profiles, including sufficient water solubility, high Human Intestinal Absorption (HIA) levels ranging from 71.35% to 99.53%, and no observed carcinogenic effects. Finally, to assess the stability of the three highest-ranked compounds (Bromocriptine, Nilotinib, and Withaferin-A), MD simulations combined with MM-PBSA were conducted using 100 nanoseconds. These simulations were performed on the top three proposed receptor targets (GAPDH, MAPK3, and PTEN). The results demonstrated that the interactions of these drugs with the receptors were consistent and adhered to established physical principles [86].
It should be noted that all of our predicted drug molecules, Nilotinib [1,87], Bromocriptine [88,89], Withaferin-A [90,91], Celastrol [92,93], and Donepezil [94,95], have been validated experimentally as promising therapeutic options for PD in previous independent studies. As highlighted in the referenced article, Nilotinib has the potential to enhance dopamine metabolism, offering a therapeutic avenue for addressing both motor and nonmotor symptoms of PD. In vivo studies suggest that Bromocriptine holds significant potential as a novel therapeutic agent for PD. Notably, at a mean dose of 57 mg, Bromocriptine demonstrated a statistically significant improvement in rigidity, tremor, bradykinesia, gait disturbances, and overall clinical scores [88]. Withania somnifera (L.) Dunal, known as “Ashwagandha” in Sanskrit, is rich in bioactive compounds such as withaferin-A and withanolide-A. Emerging evidence from preclinical research and select clinical trials underscores its neuroprotective potential in combating neurodegenerative diseases like Parkinson’s, Alzheimer’s, and Huntington’s disease. Additionally, it alleviates apoptosis, inflammation, and oxidative stress processes [91]. Celastrol shows potential for preventing and treating PD by promoting mitophagy, which clears dysfunctional mitochondria and thereby prevents dopaminergic neuronal apoptosis, offering neuroprotection. Interestingly, in mice, it alleviates motor impairments, reduces neurodegeneration in the substantia nigra and striatum, and enhances striatal mitophagy [92,93].
4.2.2. A Previously Validated Drug
On top of that, Donepezil, also known as Aricept, is FDA-approved for treating Parkinson’s, Alzheimer’s, and other forms of dementia, as listed in the DrugBank database (DB00843). Mori et al. reported that Donepezil demonstrates significant efficacy in treating PD with dementia, leading to remarkable clinical improvements [94,95]. Therefore, the findings of this study might be valuable resources for taking an effective treatment plan against PD.
4.3. Limitations and Future Direction
This study, while aiming to mitigate dataset heterogeneity by merging multiple transcriptomic datasets and mitigate batch effects, still faces certain constraints. A major limitation is the incomplete and non-uniform metadata across the six GEO cohorts, which prevented the creation of a harmonized cohort-level table and limited the ability to perform covariate adjustment. Additionally, although cross-platform normalization helped reduce technical variation, the use of microarray-based data inherently carries less resolution and dynamic range compared to newer sequencing technologies. While in silico molecular docking and molecular dynamics simulations provided valuable insights into potential drug–target interactions, their predictive accuracy remains limited by the computational models and force fields employed. Therefore, experimental validation through in vitro and in vivo studies, as well as future analyses using larger and more diverse RNA-seq datasets, will be essential to confirm and extend these findings. Despite these limitations, the study offers robust bioinformatic evidence and a solid foundation for developing and validating novel therapeutic strategies for PD.
5. Conclusions
This study provides significant insights into the molecular underpinnings of PD through the identification of 303 DEGs, including KGs such as GAPDH, PTEN, CCND1, APOE, ESR1, MAPK3, and SNCA. The GO enrichment analysis revealed crucial BP, MF, and CC associated with PD, enhancing our understanding of its pathobiology. Additionally, KEGG-pathway analysis identified significantly overrepresented pathways that are pivotal in neurodegenerative processes, further elucidating the molecular mechanisms involved in PD. The regulatory network analysis identified the top three transcription factors (FOXC1, NFKB1, and TFAP2A) and six microRNAs (hsa-mir-16-5p, hsa-mir-34a-5p, hsa-let-7b-5p, hsa-mir-103a-3p, hsa-mir-107, and hsa-mir-20b-5p) that modulate these key genes, suggesting potential targets for therapeutic intervention. Finally, KGs-guided top-ranked five drug molecules (Nilotinib, Bromocriptine, Withaferin-A, Celastrol, and Donepezil) were recommended for PD, where Bromocriptine (DB01200) is an already-FDA-approved drug for hyperprolactinemia-related conditions and early Parkinson’s disease; Donepezil (DB00843) is approved for cognitive and behavioral symptoms in Alzheimer’s, Parkinson’s, and other dementias; Nilotinib (DB04868) is approved for treating Philadelphia chromosome-positive Chronic Myeloid Leukemia (CML), including imatinib-resistant cases; Withaferin-A, which is not yet approved for any diseases but a natural compound from Withania somnifera (Ashwagandha) with neuroprotective potential for PD; and Celastrol (DB18736), which is not yet FDA-approved but under investigation for cancer, metabolic, and neurodegenerative diseases. However, some of these drug molecules may require further experimental validation to confirm their therapeutic efficacy for PD.
Supplementary Materials
The following supporting information can be downloaded at: https://www.mdpi.com/article/10.3390/genes16121459/s1, Figure S1. Pre- and Post-Integration Quality Control, MA plot and PCA visualization. Figure S2. Expression patterns of KGs with Box-plots for Parkinson’s disease. Figure S3. Gene Set Enrichment Analysis (GSEA) plots. Table S1. List of upregulated and downregulated DEGs in PD from 6 datasets (GSE8397-GPL96, GSE20141, GSE49036, GSE20163, GSE20292, and GSE20164); Table S2. List of key genes (KGs) from PPI network based on different topological measures; Table S3. Verification of association between PD and KGs; Table S4. List of GO and KEGG terms based on Key Genes; Table S5. Collection of PD related candidate drug agents from published articles and others sources; Table S6. Docking/(binding affinity) scores (kcal/mol) between the proposed target genes/proteins (receptors) and top ordered 40 candidate drugs (out of 120); Table S7. The 3-dimension view of strong binding interactions between targets and drugs. References [96,97,98,99,100,101,102,103,104,105] are cited in the supplementary materials.
Author Contributions
Conceptualization: M.A.A.P. and M.N.H.M.; Data curation: M.A.A.P., M.A. and M.A.N.; Formal Analysis: M.A.A.P. and M.A.; Methodology: M.A.A.P., M.A.N., M.F.A., M.S.H., M.F.F. and M.N.H.M.; Software: M.A.A.P., M.A.L., M.H.S. and M.F.F.; Validation: M.A.A.P., A.A., S.A.A., N.A. and M.S.H.; Writing—original draft: M.A.A.P.; Writing—review & editing: M.N.H.M., A.A., S.A.A., N.A. and M.A.; Funding Acquisition: A.A., S.A.A. and N.A. Project administration & Supervision: M.A. and M.N.H.M. All authors have read and agreed to the published version of the manuscript.
Funding
The authors extend their appreciation to the King Salman Center for Disability Research for funding this work through Research Group no. KSRG-2024-120.
Institutional Review Board Statement
Not applicable.
Informed Consent Statement
Not applicable.
Data Availability Statement
All transcriptomics data used in this study were obtained from the Gene Expression Omnibus (GEO) database (https://www.ncbi.nlm.nih.gov/geo/) (accessed on 19 April 2025). of the National Center for Biotechnology Information (NCBI) through the following code: GSE8397-GPL96, GSE20141, GSE49036, GSE20163, GSE20292, and GSE20164.
Conflicts of Interest
The authors have declared that they have no competing interests.
Abbreviations
The following abbreviations are used in this manuscript:
| PD | Parkinson’s Disease |
| AD | Alzheimer’s Disease |
| SN | Substantia Nigra |
| LB | Lewy Bodies |
| LN | Lewy Neurites |
| MMP | Mitochondrial Membrane Potential |
| ROS | Reactive Oxygen Species |
| RMA | Robust Multi-Array Average |
| KGs | Key Genes |
| DEGs | Differentially Expressed Genes |
| cDEGs | Common Differentially Expressed Genes |
| GRN | Gene Regulatory Network |
| PPI | Protein–Protein Interaction |
| GDAs | Gene–Disease Associations |
| VDAs | Variant–Disease Associations |
| TFs | Transcription Factors |
| miRNAs | microRNAs |
| GO | Gene Ontology |
| KEGG | Kyoto Encyclopedia of Genes and Genomes |
| PDB | Protein Data Bank |
| BA | Binding Affinity |
| MM-PBSA | MM–Poisson–Boltzmann Surface Area |
| MD | Molecular Dynamics |
| ADME | Absorption, Distribution, Metabolism, and Excretion |
| BBB | Blood-Brain Barrier |
References
- Pagan, F.L.; Hebron, M.L.; Wilmarth, B.; Torres-Yaghi, Y.; Lawler, A.; Mundel, E.E.; Yusuf, N.; Starr, N.J.; Anjum, M.; Arellano, J. Nilotinib Effects on Safety, Tolerability, and Potential Biomarkers in Parkinson Disease: A Phase 2 Randomized Clinical Trial. JAMA Neurol. 2020, 77, 309–317. [Google Scholar] [CrossRef]
- DeMarco, E.C.; Zhang, Z.; Robinson, H.; Hinyard, L. Anxiety in Parkinson’s Patients: What’s Timing Got to Do with It? J. Geriatr. Psychiatry Neurol. 2023, 36, 496–504. [Google Scholar] [CrossRef] [PubMed]
- Rong, S.; Xu, G.; Liu, B.; Sun, Y.; Snetselaar, L.G.; Wallace, R.B.; Li, B.; Liao, J.; Bao, W. Trends in Mortality from Parkinson Disease in the United States, 1999–2019. Neurology 2021, 97, e1986–e1993. [Google Scholar] [CrossRef]
- Armstrong, M.J.; Okun, M.S. Diagnosis and Treatment of Parkinson Disease: A Review. JAMA 2020, 323, 548–560. [Google Scholar] [CrossRef] [PubMed]
- Lew, M. Overview of Parkinson’s Disease. Pharmacother. J. Hum. Pharmacol. Drug Ther. 2007, 27, 155S–160S. [Google Scholar] [CrossRef]
- Vacchi, E.; Burrello, J.; Burrello, A.; Bolis, S.; Monticone, S.; Barile, L.; Kaelin-Lang, A.; Melli, G. Profiling Inflammatory Extracellular Vesicles in Plasma and Cerebrospinal Fluid: An Optimized Diagnostic Model for Parkinson’s Disease. Biomedicines 2021, 9, 230. [Google Scholar] [CrossRef]
- Kalia, L.V.; Lang, A.E. Parkinson’s Disease. Lancet 2015, 386, 896–912. [Google Scholar] [CrossRef] [PubMed]
- Tan, C.; Liu, X.; Chen, J. Microarray Analysis of the Molecular Mechanism Involved in Parkinson’s Disease. Parkinsons Dis. 2018, 2018, 1590465. [Google Scholar] [CrossRef]
- Whittle, B.J.; Izuogu, O.G.; Lowes, H.; Deen, D.; Pyle, A.; Coxhead, J.; Lawson, R.A.; Yarnall, A.J.; Jackson, M.S.; Santibanez-Koref, M. Early-Stage Idiopathic Parkinson’s Disease Is Associated with Reduced Circular RNA Expression. npj Parkinsons Dis. 2024, 10, 25. [Google Scholar] [CrossRef]
- Diao, H.; Li, X.; Hu, S.; Liu, Y. Gene Expression Profiling Combined with Bioinformatics Analysis Identify Biomarkers for Parkinson Disease. PLoS ONE 2012, 7, e52319. [Google Scholar] [CrossRef]
- Zhou, Y.; Li, Z.; Chi, C.; Li, C.; Yang, M.; Liu, B. Identification of Hub Genes and Potential Molecular Pathogenesis in Substantia Nigra in Parkinson’s Disease via Bioinformatics Analysis. Parkinsons Dis. 2023, 2023, 6755569. [Google Scholar] [CrossRef]
- Xin, G.; Niu, J.; Tian, Q.; Fu, Y.; Chen, L.; Yi, T.; Tian, K.; Sun, X.; Wang, N.; Wang, J. Identification of Potential Immune-Related Hub Genes in Parkinson’s Disease Based on Machine Learning and Development and Validation of a Diagnostic Classification Model. PLoS ONE 2023, 18, e0294984. [Google Scholar] [CrossRef]
- Su, L.; Wang, C.; Zheng, C.; Wei, H.; Song, X. A Meta-Analysis of Public Microarray Data Identifies Biological Regulatory Networks in Parkinson’s Disease. BMC Med. Genom. 2018, 11, 40. [Google Scholar] [CrossRef]
- George, G.; Parambath, S.V.; Lokappa, S.B.; Varkey, J. Construction of Parkinson’s Disease Marker-Based Weighted Protein-Protein Interaction Network for Prioritization of Co-Expressed Genes. Gene 2019, 697, 67–77. [Google Scholar] [CrossRef]
- Javali, S.B.; Gudaganavar, N.V.; Raj, S.M. Effect of Varying Sample Size in Estimation of Coefficients of Internal Consistency. WEbmed Cent. Biostat. 2011, 2, WMC001649. [Google Scholar]
- Chakrabarti, A.; Verma, S. Identifying Potential Genes Driving Ferroptosis in the Substantia Nigra and Dopaminergic Neurons in Parkinson’s Disease. Mol. Cell. Neurosci. 2025, 132, 103993. [Google Scholar] [CrossRef] [PubMed]
- Li, Y.; Jia, W.; Chen, C.; Chen, C.; Chen, J.; Yang, X.; Liu, P. Identification of Biomarkers Associated with Inflammatory Response in Parkinson’s Disease by Bioinformatics and Machine Learning. PLoS ONE 2025, 20, e0320257. [Google Scholar] [CrossRef] [PubMed]
- Liu, H.; Huang, Y.; Li, J. Bioinformatic Analysis for the Identification of Key Candidate Genes and Pathways in the Substantia Nigra in Parkinson’s Disease. J. Integr. Neurosci. 2018, 17, 619–631. [Google Scholar] [CrossRef] [PubMed]
- Huang, J.; Li, B.; Wei, H.; Li, C.; Liu, C.; Mi, H.; Chen, S. Integrative Analysis of Gene Expression Profiles of Substantia Nigra Identifies Potential Diagnosis Biomarkers in Parkinson’s Disease. Sci. Rep. 2024, 14, 2167. [Google Scholar] [CrossRef]
- Jin, X.; Li, J.; Li, W.; Wang, X.; Du, C.; Geng, Z.; Geng, Y.; Kang, L.; Zhang, X.; Wang, M. Weighted Gene Co-Expression Network Analysis Reveals Specific Modules and Biomarkers in Parkinson’s Disease. Neurosci. Lett. 2020, 728, 134950. [Google Scholar] [CrossRef]
- Chen, L.; Wang, Y.; Huang, J.; Hu, B.; Huang, W. Identification of Immune-Related Hub Genes in Parkinson’s Disease. Front. Genet. 2022, 13, 914645. [Google Scholar] [CrossRef] [PubMed]
- Kim, S.; Chen, J.; Cheng, T.; Gindulyte, A.; He, J.; He, S.; Li, Q.; Shoemaker, B.A.; Thiessen, P.A.; Yu, B.; et al. PubChem 2019 Update: Improved Access to Chemical Data. Nucleic Acids Res. 2019, 47, D1102–D1109. [Google Scholar] [CrossRef] [PubMed]
- Irizarry, R.A.; Hobbs, B.; Collin, F.; Beazer-Barclay, Y.D.; Antonellis, K.J.; Scherf, U.; Speed, T.P. Exploration, Normalization, and Summaries of High Density Oligonucleotide Array Probe Level Data. Biostatistics 2003, 4, 249–264. [Google Scholar] [CrossRef]
- Ritchie, M.E.; Phipson, B.; Wu, D.; Hu, Y.; Law, C.W.; Shi, W.; Smyth, G.K. Limma Powers Differential Expression Analyses for RNA-Sequencing and Microarray Studies. Nucleic. Acids. Res. 2015, 43, e47. [Google Scholar] [CrossRef]
- Ben-Hur, A.; Noble, W.S. Kernel Methods for Predicting Protein-Protein Interactions. Bioinformatics 2005, 2, i38–i46. [Google Scholar] [CrossRef]
- Mahmud, S.; Ajadee, A.; Sarker, A.; Ahmmed, R.; Noor, T.; Pappu, M.A.A.; Islam, M.S.; Mollah, M.N.H. Exploring Common Genomic Biomarkers to Disclose Common Drugs for the Treatment of Colorectal Cancer and Hepatocellular Carcinoma with Type-2 Diabetes through Transcriptomics Analysis. PLoS ONE 2025, 20, e0319028. [Google Scholar] [CrossRef] [PubMed]
- Szklarczyk, D.; Gable, A.L.; Lyon, D.; Junge, A.; Wyder, S.; Huerta-Cepas, J.; Simonovic, M.; Doncheva, N.T.; Morris, J.H.; Bork, P.; et al. STRING V11: Protein-Protein Association Networks with Increased Coverage, Supporting Functional Discovery in Genome-Wide Experimental Datasets. Nucleic Acids Res. 2019, 47, D607–D613. [Google Scholar] [CrossRef]
- Shannon, P.; Markiel, A.; Ozier, O.; Baliga, N.S.; Wang, J.T.; Ramage, D.; Amin, N.; Schwikowski, B.; Ideker, T. Cytoscape: A Software Environment for Integrated Models of Biomolecular Interaction Networks. Genome Res. 2003, 13, 2498–2504. [Google Scholar] [CrossRef]
- Lesnick, T.G.; Papapetropoulos, S.; Mash, D.C.; Ffrench-Mullen, J.; Shehadeh, L.; de Andrade, M.; Henley, J.R.; Rocca, W.A.; Ahlskog, J.E.; Maraganore, D.M. A Genomic Pathway Approach to a Complex Disease: Axon Guidance and Parkinson Disease. PLoS Genet. 2007, 3, e98. [Google Scholar] [CrossRef]
- Pappu, M.A.A.; Alamin, M.; Sultana, M.H.; Azad, A.K.M.; Auwul, M.R.; Mahmud, S.; Ajadee, A.; Sarker, A.; Alyami, S.A.; Mollah, M.N.H. Single Nucleus RNA Sequencing Profile Analysis to Reveal Cell Type Specific Common Molecular Drivers of Parkinson’s Disease and Therapeutic Agents. Sci. Rep. 2025, 15, 27086. [Google Scholar] [CrossRef] [PubMed]
- Ahmed, M.F.; Al Noman, M.; Ahmed, M.F.; Latif, M.A.; Pappu, M.A.A.; Islam, M.S.; Hossain, M.S.; Hossen, M.B.; Faysal, M.F.; Hasan, M.M.; et al. In-Silico Discovery of Pediatric Acute-Myeloid-Leukemia (PAML) Causing Druggable Molecular Signatures Highlighting Their Pathogenetic Processes and Therapeutic Agents through Single-Cell RNA-Seq Profile Analysis. PLoS ONE 2025, 20, e0335410. [Google Scholar] [CrossRef]
- Kuleshov, M.V.; Jones, M.R.; Rouillard, A.D.; Fernandez, N.F.; Duan, Q.; Wang, Z.; Koplev, S.; Jenkins, S.L.; Jagodnik, K.M.; Lachmann, A.; et al. Enrichr: A Comprehensive Gene Set Enrichment Analysis Web Server 2016 Update. Nucleic Acids Res. 2016, 44, W90–W97. [Google Scholar] [CrossRef]
- Piñero, J.; Ramírez-Anguita, J.M.; Saüch-Pitarch, J.; Ronzano, F.; Centeno, E.; Sanz, F.; Furlong, L.I. The DisGeNET Knowledge Platform for Disease Genomics: 2019 Update. Nucleic Acids Res. 2020, 48, D845–D855. [Google Scholar] [CrossRef] [PubMed]
- Fornes, O.; Castro-Mondragon, J.A.; Khan, A.; van der Lee, R.; Zhang, X.; Richmond, P.A.; Modi, B.P.; Correard, S.; Gheorghe, M.; Baranašić, D.; et al. JASPAR 2020: Update of the Open-Access Database of Transcription Factor Binding Profiles. Nucleic Acids Res. 2020, 48, D87–D92. [Google Scholar] [CrossRef]
- Xia, J.; Gill, E.E.; Hancock, R.E.W. NetworkAnalyst for Statistical, Visual and Network-Based Meta-Analysis of Gene Expression Data. Nat. Protoc. 2015, 10, 823–844. [Google Scholar] [CrossRef]
- Sethupathy, P.; Corda, B.; Hatzigeorgiou, A.G. TarBase: A Comprehensive Database of Experimentally Supported Animal MicroRNA Targets. Rna 2006, 12, 192–197. [Google Scholar] [CrossRef] [PubMed]
- Doms, A.; Schroeder, M. GoPubMed: Exploring PubMed with the Gene Ontology. Nucleic Acids Res. 2005, 33, W783–W786. [Google Scholar] [CrossRef]
- Kanehisa, M.; Araki, M.; Goto, S.; Hattori, M.; Hirakawa, M.; Itoh, M.; Katayama, T.; Kawashima, S.; Okuda, S.; Tokimatsu, T.; et al. KEGG for Linking Genomes to Life and the Environment. Nucleic Acids Res. 2008, 36, D480–D484. [Google Scholar] [CrossRef] [PubMed]
- Subramanian, A.; Tamayo, P.; Mootha, V.K.; Mukherjee, S.; Ebert, B.L.; Gillette, M.A.; Paulovich, A.; Pomeroy, S.L.; Golub, T.R.; Lander, E.S. Gene Set Enrichment Analysis: A Knowledge-Based Approach for Interpreting Genome-Wide Expression Profiles. Proc. Natl. Acad. Sci. USA 2005, 102, 15545–15550. [Google Scholar] [CrossRef]
- Wang, T.; Jiang, X.; Ruan, Y.; Zhuang, J.; Yin, Y. Based on Network Pharmacology and in Vitro Experiments to Prove the Effective Inhibition of Myocardial Fibrosis by Buyang Huanwu Decoction. Bioengineered 2022, 13, 13767–13783. [Google Scholar] [CrossRef]
- Berman, H.M.; Westbrook, J.; Feng, Z.; Gilliland, G.; Bhat, T.N.; Weissig, H.; Shindyalov, I.N.; Bourne, P.E. The Protein Data Bank. Nucleic Acids Res. 2000, 28, 235–242. [Google Scholar] [CrossRef] [PubMed]
- Varadi, M.; Anyango, S.; Deshpande, M.; Nair, S.; Natassia, C.; Yordanova, G.; Yuan, D.; Stroe, O.; Wood, G.; Laydon, A.; et al. AlphaFold Protein Structure Database: Massively Expanding the Structural Coverage of Protein-Sequence Space with High-Accuracy Models. Nucleic Acids Res. 2022, 50, D439–D444. [Google Scholar] [CrossRef]
- Schwede, T.; Kopp, J.; Guex, N.; Peitsch, M.C. SWISS-MODEL: An Automated Protein Homology-Modeling Server. Nucleic Acids Res. 2003, 31, 3381–3385. [Google Scholar] [CrossRef]
- Baroroh, U.; Biotek, M.; Muscifa, Z.S.; Destiarani, W.; Rohmatullah, F.G.; Yusuf, M. Molecular Interaction Analysis and Visualization of Protein-Ligand Docking Using Biovia Discovery Studio Visualizer. Indones. J. Comput. Biol. (IJCB) 2023, 2, 22–30. [Google Scholar] [CrossRef]
- Trott, O.; Olson, A.J. AutoDock Vina: Improving the Speed and Accuracy of Docking with a New Scoring Function, Efficient Optimization, and Multithreading. J. Comput. Chem. 2010, 31, 455–461. [Google Scholar] [CrossRef]
- Jayaram, B.; Singh, T.; Mukherjee, G.; Mathur, A.; Shekhar, S.; Shekhar, V. Sanjeevini: A Freely Accessible Web-Server for Target Directed Lead Molecule Discovery. BMC Bioinform. 2012, 13, S7. [Google Scholar] [CrossRef] [PubMed]
- Daina, A.; Michielin, O.; Zoete, V. SwissADME: A Free Web Tool to Evaluate Pharmacokinetics, Drug-Likeness and Medicinal Chemistry Friendliness of Small Molecules. Sci. Rep. 2017, 7, 42717. [Google Scholar] [CrossRef]
- Pires, D.E.V.; Blundell, T.L.; Ascher, D.B. PkCSM: Predicting Small-Molecule Pharmacokinetic and Toxicity Properties Using Graph-Based Signatures. J. Med. Chem. 2015, 58, 4066–4072. [Google Scholar] [CrossRef]
- Krieger, E.; Koraimann, G.; Vriend, G. Increasing the Precision of Comparative Models with YASARA NOVA—A Self-Parameterizing Force Field. Proteins Struct. Funct. Bioinform. 2002, 47, 393–402. [Google Scholar] [CrossRef] [PubMed]
- Case, D.A.; Cheatham, T.E., III; Darden, T.; Gohlke, H.; Luo, R.; Merz, K.M., Jr.; Onufriev, A.; Simmerling, C.; Wang, B.; Woods, R.J. The Amber Biomolecular Simulation Programs. J. Comput. Chem. 2005, 26, 1668–1688. [Google Scholar] [CrossRef]
- Krieger, E.; Vriend, G. New Ways to Boost Molecular Dynamics Simulations. J. Comput. Chem. 2015, 36, 996–1007. [Google Scholar] [CrossRef]
- Krieger, E.; Nielsen, J.E.; Spronk, C.A.E.M.; Vriend, G. Fast Empirical PKa Prediction by Ewald Summation. J. Mol. Graph. Model 2006, 25, 481–486. [Google Scholar] [CrossRef]
- Berendsen, H.J.C.; Postma, J.P.M.; van Gunsteren, W.F.; DiNola, A.; Haak, J.R. Molecular Dynamics with Coupling to an External Bath. J. Chem. Phys. 1984, 81, 3684–3690. [Google Scholar] [CrossRef]
- Mitra, S.; Dash, R. Structural Dynamics and Quantum Mechanical Aspects of Shikonin Derivatives as CREBBP Bromodomain Inhibitors. J. Mol. Graph. Model 2018, 83, 42–52. [Google Scholar] [CrossRef] [PubMed]
- Srinivasan, E.; Rajasekaran, R. Computational Investigation of Curcumin, a Natural Polyphenol That Inhibits the Destabilization and the Aggregation of Human SOD1 Mutant (Ala4Val). RSC Adv. 2016, 6, 102744–102753. [Google Scholar] [CrossRef]
- Szklarczyk, D.; Franceschini, A.; Kuhn, M.; Simonovic, M.; Roth, A.; Minguez, P.; Doerks, T.; Stark, M.; Muller, J.; Bork, P.; et al. The STRING Database in 2011: Functional Interaction Networks of Proteins, Globally Integrated and Scored. Nucleic Acids Res. 2011, 39, D561–D568. [Google Scholar] [CrossRef]
- Chen, X.; Li, H.; Tian, L.; Li, Q.; Luo, J.; Zhang, Y. Analysis of the Physicochemical Properties of Acaricides Based on Lipinski’s Rule of Five. J. Comput. Biol. 2020, 27, 1397–1406. [Google Scholar] [CrossRef] [PubMed]
- Gabathuler, R. Approaches to Transport Therapeutic Drugs across the Blood–Brain Barrier to Treat Brain Diseases. Neurobiol. Dis. 2010, 37, 48–57. [Google Scholar] [CrossRef]
- Wong, A.D.; Ye, M.; Levy, A.F.; Rothstein, J.D.; Bergles, D.E.; Searson, P.C. The Blood-Brain Barrier: An Engineering Perspective. Front. Neuroeng. 2013, 6, 7. [Google Scholar] [CrossRef]
- Batista, P.; Pereira, A. Impact and Prevention of Neurodegenerative Diseases in Society: Alzheimer and Parkinson. In Neurodegenerative Diseases; SM Group Open Access eBooks: Brentford, UK, 2016. [Google Scholar]
- Lee, T.K.; Yankee, E.L. A Review on Parkinson’s Disease Treatment. Neuroimmunol. Neuroinflamm. 2021, 8, 222. [Google Scholar] [CrossRef]
- Wood-Kaczmar, A.; Gandhi, S.; Wood, N.W. Understanding the Molecular Causes of Parkinson’s Disease. Trends Mol. Med. 2006, 12, 521–528. [Google Scholar] [CrossRef]
- Ping, Z.; Xiaomu, W.; Xufang, X.; Wenfeng, C.; Liang, S.; Tao, W. GAPDH Rs1136666 SNP Indicates a High Risk of Parkinson’s Disease. Neurosci. Lett. 2018, 685, 55–62. [Google Scholar] [CrossRef] [PubMed]
- Tsuchiya, K.; Tajima, H.; Kuwae, T.; Takeshima, T.; Nakano, T.; Tanaka, M.; Sunaga, K.; Fukuhara, Y.; Nakashima, K.; Ohama, E. Pro-apoptotic Protein Glyceraldehyde-3-phosphate Dehydrogenase Promotes the Formation of Lewy Body-like Inclusions. Eur. J. Neurosci. 2005, 21, 317–326. [Google Scholar] [CrossRef]
- Liu, L.; Xiong, N.; Zhang, P.; Chen, C.; Huang, J.; Zhang, G.; Xu, X.; Shen, Y.; Lin, Z.; Wang, T. Genetic Variants in GAPDH Confer Susceptibility to Sporadic Parkinson’s Disease in a Chinese Han Population. PLoS ONE 2015, 10, e0135425. [Google Scholar] [CrossRef]
- Erekat, N.S. Apoptosis and Its Role in Parkinson’s Disease. Exon. Publ. 2018, 65–82. [Google Scholar] [CrossRef]
- Primiani, C.T.; Ryan, V.H.; Rao, J.S.; Cam, M.C.; Ahn, K.; Modi, H.R.; Rapoport, S.I. Coordinated Gene Expression of Neuroinflammatory and Cell Signaling Markers in Dorsolateral Prefrontal Cortex during Human Brain Development and Aging. PLoS ONE 2014, 9, e110972. [Google Scholar] [CrossRef]
- Kaltschmidt, B.; Helweg, L.P.; Greiner, J.F.W.; Kaltschmidt, C. NF-ΚB in Neurodegenerative Diseases: Recent Evidence from Human Genetics. Front. Mol. Neurosci. 2022, 15, 954541. [Google Scholar] [CrossRef]
- Santos-Lobato, B.L.; Vidal, A.F.; Ribeiro-dos-Santos, Â. Regulatory MiRNA–MRNA Networks in Parkinson’s Disease. Cells 2021, 10, 1410. [Google Scholar] [CrossRef] [PubMed]
- Findeiss, E.; Schwarz, S.C.; Evsyukov, V.; Rösler, T.W.; Höllerhage, M.; Chakroun, T.; Nykänen, N.P.; Shen, Y.; Wurst, W.; Kohl, M. Comprehensive MiRNome-Wide Profiling in a Neuronal Cell Model of Synucleinopathy Implies Involvement of Cell Cycle Genes. Front. Cell Dev. Biol. 2021, 9, 561086. [Google Scholar] [CrossRef]
- Zhang, H. CCND1 Silencing Suppresses Liver Cancer Stem Cell Differentiation through Inhibiting Autophagy. Hum. Cell 2020, 33, 140–147. [Google Scholar] [CrossRef] [PubMed]
- Ogino, M.; Ichimura, M.; Nakano, N.; Minami, A.; Kitagishi, Y.; Matsuda, S. Roles of PTEN with DNA Repair in Parkinson’s Disease. Int. J. Mol. Sci. 2016, 17, 954. [Google Scholar] [CrossRef] [PubMed]
- Pivtoraiko, V.N.; Stone, S.L.; Roth, K.A.; Shacka, J.J. Oxidative Stress and Autophagy in the Regulation of Lysosome-Dependent Neuron Death. Antioxid Redox Signal 2009, 11, 481–496. [Google Scholar] [CrossRef]
- Singh, N.K.; Banerjee, B.D.; Bala, K.; Mitrabasu; Dung Dung, A.A.; Chhillar, N. APOE and LRPAP1 Gene Polymorphism and Risk of Parkinson’s Disease. Neurol. Sci. 2014, 35, 1075–1081. [Google Scholar] [CrossRef] [PubMed]
- Emamzadeh, F.N. Role of Apolipoproteins and α-Synuclein in Parkinson’s Disease. J. Mol. Neurosci. 2017, 62, 344–355. [Google Scholar] [CrossRef]
- Han, S.; Fang, J.; Yu, L.; Li, B.; Hu, Y.; Chen, R.; Li, C.; Zhao, C.; Li, J.; Wang, Y. Serum-derived Exosomal Hsa-let-7b-5p as a Biomarker for Predicting the Severity of Coronary Stenosis in Patients with Coronary Heart Disease and Hyperglycemia. Mol. Med. Rep. 2023, 28, 203. [Google Scholar] [CrossRef]
- Liu, J.; Yuan, S.; Niu, X.; Kelleher, R.; Sheridan, H. ESR1 Dysfunction Triggers Neuroinflammation as a Critical Upstream Causative Factor of the Alzheimer’s Disease Process. Aging 2022, 14, 8595. [Google Scholar] [CrossRef]
- Sulhan, S.; Lyon, K.A.; Shapiro, L.A.; Huang, J.H. Neuroinflammation and Blood–Brain Barrier Disruption Following Traumatic Brain Injury: Pathophysiology and Potential Therapeutic Targets. J. Neurosci. Res. 2020, 98, 19–28. [Google Scholar] [CrossRef]
- Yao, Z.; Li, J.; Bian, L.; Li, Q.; Wang, X.; Yang, X.; Wei, X.; Wan, G.; Wang, Y.; Shi, J. Nootkatone Alleviates Rotenone-induced Parkinson’s Disease Symptoms through Activation of the PI3K/Akt Signaling Pathway. Phytother. Res. 2022, 36, 4183–4200. [Google Scholar] [CrossRef]
- Sun, A.; Li, Y.; Miao, Y.; Wang, H.; Zhang, L. Research on the Mechanism of Ursolic Acid for Treating Parkinson’s Disease by Network Pharmacology and Experimental Verification. Heliyon 2024, 10, e34113. [Google Scholar] [CrossRef]
- das Campêlo, C.L.C.; Silva, R.H. Genetic Variants in SNCA and the Risk of Sporadic Parkinson’s Disease and Clinical Outcomes: A Review. Parkinsons Dis. 2017, 2017, 4318416. [Google Scholar] [CrossRef] [PubMed]
- Pedersen, C.C.; Lange, J.; Førland, M.G.G.; Macleod, A.D.; Alves, G.; Maple-Grødem, J. A Systematic Review of Associations between Common SNCA Variants and Clinical Heterogeneity in Parkinson’s Disease. npj Parkinsons Dis. 2021, 7, 54. [Google Scholar] [CrossRef]
- Irene Litvan, M.D.; Parkkinen, L. α-Synuclein Genetic Variability: A Biomarker for Dementia in Parkinson’s Disease. Ann. Neurol. 2016, 79, 991–999. [Google Scholar] [CrossRef]
- Goris, A.; Williams-Gray, C.H.; Clark, G.R.; Foltynie, T.; Lewis, S.J.G.; Brown, J.; Ban, M.; Spillantini, M.G.; Compston, A.; Burn, D.J. Tau and A-synuclein in Susceptibility to, and Dementia in, Parkinson’s Disease. Ann. Neurol. 2007, 62, 145–153. [Google Scholar] [CrossRef]
- Chu, Y.; Hirst, W.D.; Federoff, H.J.; Harms, A.S.; Stoessl, A.J.; Kordower, J.H. Nigrostriatal Tau Pathology in Parkinsonism and Parkinson’s Disease. Brain 2024, 147, 444–457. [Google Scholar] [CrossRef]
- Lovering, A.L.; Lee, S.S.; Kim, Y.W.; Withers, S.G.; Strynadka, N.C.J. Mechanistic and Structural Analysis of a Family 31 α-Glycosidase and Its Glycosyl-Enzyme Intermediate. J. Biol. Chem. 2005, 280, 2105–2115. [Google Scholar] [CrossRef]
- Pagan, F.L.; Hebron, M.L.; Wilmarth, B.; Torres-Yaghi, Y.; Lawler, A.; Mundel, E.E.; Yusuf, N.; Starr, N.J.; Arellano, J.; Howard, H.H. Pharmacokinetics and Pharmacodynamics of a Single Dose Nilotinib in Individuals with Parkinson’s Disease. Pharmacol. Res. Perspect. 2019, 7, e00470. [Google Scholar] [CrossRef] [PubMed]
- Lieberman, A.; Kupersmith, M.; Estey, E.; Goldstein, M. Treatment of Parkinson’s Disease with Bromocriptine. New Engl. J. Med. 1976, 295, 1400–1404. [Google Scholar] [CrossRef]
- Van Hilten, J.J.; Ramaker, C.C.; Stowe, R.; Ives, N.J. Bromocriptine versus Levodopa in Early Parkinson’s Disease. Cochrane Database Syst. Rev. 2007, 2009, CD002258. [Google Scholar] [CrossRef]
- Birla, H.; Keswani, C.; Rai, S.N.; Singh, S.S.; Zahra, W.; Dilnashin, H.; Rathore, A.S.; Singh, S.P. Neuroprotective Effects of Withania Somnifera in BPA Induced-Cognitive Dysfunction and Oxidative Stress in Mice. Behav. Brain Funct. 2019, 15, 9. [Google Scholar] [CrossRef] [PubMed]
- Dar, N.J.; Ahmad, M. Neurodegenerative Diseases and Withania Somnifera (L.): An Update. J. Ethnopharmacol. 2020, 256, 112769. [Google Scholar] [CrossRef]
- Lin, M.W.; Lin, C.C.; Chen, Y.H.; Yang, H.B.; Hung, S.Y. Celastrol Inhibits Dopaminergic Neuronal Death of Parkinson’s Disease through Activating Mitophagy. Antioxidants 2019, 9, 37. [Google Scholar] [CrossRef] [PubMed]
- Bai, X.; Fu, R.J.; Zhang, S.; Yue, S.J.; Chen, Y.Y.; Xu, D.Q.; Tang, Y.P. Potential Medicinal Value of Celastrol and Its Synthesized Analogues for Central Nervous System Diseases. Biomed. Pharmacother. 2021, 139, 111551. [Google Scholar] [CrossRef]
- Mori, S. Responses to Donepezil in Alzheimer’s Disease and Parkinson’s Disease. Ann. N. Y. Acad. Sci. 2002, 977, 493–500. [Google Scholar] [CrossRef]
- Dubois, B.; Tolosa, E.; Katzenschlager, R.; Emre, M.; Lees, A.J.; Schumann, G.; Pourcher, E.; Gray, J.; Thomas, G.; Swartz, J. Donepezil in Parkinson’s Disease Dementia: A Randomized, Double-blind Efficacy and Safety Study. Mov. Disord. 2012, 27, 1230–1238. [Google Scholar] [CrossRef] [PubMed]
- Morgan, J.C.; Sethi, K.D. Emerging drugs for Parkinson’s disease. Expert Opin. Emerg. Drugs 2006, 11, 403–417. [Google Scholar] [CrossRef]
- Whitney, C.M. Medications for Parkinson’s disease. Neurologist 2007, 13, 387–388. [Google Scholar] [CrossRef]
- Schwab, R.S.; England, A.C., Jr.; Poskanzer, D.C.; Young, R.R. Amantadine in the treatment of Parkinson’s disease. JAMA 1969, 208, 1168–1170. [Google Scholar] [CrossRef]
- Rondón-Villarreal, P.; López, W.O.C. Identification of potential natural neuroprotective molecules for Parkinson’s disease by using chemoinformatics and molecular docking. J. Mol. Graph. Model. 2020, 97, 107547. [Google Scholar] [CrossRef]
- Agúndez, J.A.G.; García-Martín, E.; Alonso-Navarro, H.; Jiménez-Jiménez, F.J. Anti-Parkinson’s disease drugs and pharmacogenetic considerations. Expert Opin. Drug Metab. Toxicol. 2013, 9, 859–874. [Google Scholar] [CrossRef]
- Hubble, J.P. Novel drugs for Parkinson’s disease. Med. Clin. N. Am. 1999, 83, 525–536. [Google Scholar] [CrossRef] [PubMed]
- McOmish, C.; Pavey, G.; McLean, C.; Horne, M.; Dean, B.; Scarr, E. Muscarinic receptor binding changes in postmortem Parkinson’s disease. J. Neural Transm. 2017, 124, 227–236. [Google Scholar] [CrossRef] [PubMed]
- Yoo, M.; Shin, J.; Kim, J.; Ryall, K.A.; Lee, K.; Lee, S.; Jeon, M.; Kang, J.; Tan, A.C. DSigDB: Drug signatures database for gene set analysis. Bioinformatics 2015, 31, 3069–3071. [Google Scholar] [CrossRef] [PubMed]
- Athauda, D.; Foltynie, T. Drug repurposing in Parkinson’s disease. CNS Drugs 2018, 32, 747–761. [Google Scholar] [CrossRef]
- Griffith, M.; Griffith, O.L.; Coffman, A.C.; Weible, J.V.; McMichael, J.F.; Spies, N.C.; Koval, J.; Das, I.; Callaway, M.B.; Eldred, J.M.; et al. DGIdb: Mining the druggable genome. Nat. Methods 2013, 10, 1209–1210. [Google Scholar] [CrossRef] [PubMed]


Disclaimer/Publisher’s Note: The statements, opinions and data contained in all publications are solely those of the individual author(s) and contributor(s) and not of MDPI and/or the editor(s). MDPI and/or the editor(s) disclaim responsibility for any injury to people or property resulting from any ideas, methods, instructions or products referred to in the content. |
© 2025 by the authors. Licensee MDPI, Basel, Switzerland. This article is an open access article distributed under the terms and conditions of the Creative Commons Attribution (CC BY) license (https://creativecommons.org/licenses/by/4.0/).