Article

Role of Different Members of the AGPAT Gene Family in Milk Fat Synthesis in Bubalus bubalis

1
Guangxi Key Laboratory of Animal Reproduction, Breeding and Disease Control, State Key Laboratory for Conservation and Utilization of Subtropical Agro-Bioresources, Guangxi University, Nanning 530004, China
2
Guangdong Provincial Key Laboratory of Animal Molecular Design and Precise Breeding, School of Life Science and Engineering, Foshan University, Foshan 528225, China
3
Guangxi Zhuang Autonomous Region Center for Analysis and Test Research, Nanning 530022, China
*
Author to whom correspondence should be addressed.
These authors contributed equally to this work.
Genes 2023, 14(11), 2072; https://doi.org/10.3390/genes14112072
Submission received: 9 October 2023 / Revised: 10 November 2023 / Accepted: 10 November 2023 / Published: 13 November 2023
(This article belongs to the Section Animal Genetics and Genomics)

Abstract

:
During triacylglycerol synthesis, the acylglycerol-3-phosphate acyltransferase (AGPAT) family catalyzes the conversion of lysophosphatidic acid to phosphatidic acid and the acylation of sn-2 fatty acids. However, the catalytic activity of different AGPAT members is different. Therefore, this study aimed to investigate the mechanism through which different AGPATs affect the efficiency of TAG synthesis and fatty acid composition. The conservation of amino acid sequences and protein domains of the AGPAT family was analyzed, and the functions of AGPAT1, AGPAT3, and AGPAT4 genes in buffalo mammary epithelial cells (BMECs) were studied using RNA interference and gene overexpression. Prediction of the protein tertiary structure of the AGPAT family demonstrated that four conservative motifs (motif1, motif2, motif3, and motif6) formed a hydrophobic pocket in AGPAT proteins, except AGPAT6. According to cytological studies, AGPAT1, AGPAT3, and AGPAT4 were found to promote the synthesis and fatty acid compositions of triacylglycerol, especially UFA compositions of triacylglycerol, by regulating ACSL1, FASN, GPAM, DGAT2, and PPARG gene expression. This study provides new insights into the role of different AGPAT gene family members involved in TAG synthesis, and a reference for improving the fatty acid composition of milk.

1. Introduction

Buffaloes produce the second-highest quantity of milk in the world, and buffalo milk contains higher contents of milk fat, milk protein, and total solids than milk from other livestock [1,2,3]. One of our previous studies showed that the milk fat in buffalo is significantly higher than that in the milk of the Holstein breed (7.88 ± 0.91 vs. 4.24 ± 0.80) [1]. The milk fat content and composition are crucial factors affecting milk flavor, and nutritional and economic value. Milk fat is among the main fat sources for humans, especially for Westerners. A high-fat diet, particularly the intake of saturated fatty acids (SFAs), has recently been considered the most crucial factor leading to hyperlipidemia and other cardiovascular diseases [4]. However, compared to Holstein milk, buffalo milk is rich in unsaturated fatty acids (UFAs), such as linoleic, linolenic, conjugated linoleic acid, eicosapentaenoic acid, and arachidonic acids, which are considered beneficial to human health [5]. Therefore, increasing the unsaturated fat content in milk has become a critical direction in dairy animal breeding. However, information available regarding the mechanism underlying UFA biosynthesis in buffalo milk is inadequate.
Fatty acids in milk are mainly taken up from blood (plasma) during the first lactation month, or derived from de novo synthesis by mammary cells from the second lactation month [6]. Triacylglycerol (TAG), which comprises 98% of the fat in buffalo milk [7], is synthesized from fatty acids and glycerin by enzymes, including glycerol-3-phosphate acyltransferases (GPATs), acylglycerol-3-phosphate acyltransferases (AGPATs), phosphatidic acid phosphatase, and diacylglycerol acyltransferases (DGATs) [8]. Among these, AGPATs catalyze the conversion of lysophosphatidic acid (LPA) to phosphatidic acid (PA), in addition to further dephosphorylation to form diacylglycerol (DAG). AGPAT1 and AGPAT6 are highly expressed in both buffalo and cattle mammary glands during lactation, and AGPAT1 or AGPAT6 knockdown can significantly decrease the TAG content in mammary epithelial cells by regulating the expressions of lipogenic-related genes [9]. Moreover, GPATs prefer to catalyze SFA acylation, whereas AGPATs prefer to catalyze UFAs [8,10]. During TAG synthesis, the AGPAT family catalyzes the acylation of sn-2 fatty acids. Meanwhile, the sn-2 site of TAGs is mostly UFA, which further indicates that AGPAT may have a higher affinity for UFAs. Another study showed that different AGPAT family members have different affinities for fatty acid acyl-CoA, among which AGPAT3 and AGPAT4 exhibited a significant preference for the polyunsaturated fatty acid (PUFA) acyl-CoA [11,12]. Therefore, systematically revealing the effects of different AGPAT gene family members on milk fat synthesis to increase the UFA content of milk is of great significance.
In this study, we aimed to investigate the mechanism through which different AGPATs affect the efficiency of TAG synthesis and fatty acid composition. We analyzed the conservation of amino acid sequences and protein domains of the AGPAT family, and studied the function of the AGPAT1, AGPAT3, and AGPAT4 genes in buffalo mammary epithelial cells (BMECs) via RNA interference and gene overexpression. Our study may provide novel insights into the function of the AGPAT gene family and offer references for the molecular breeding of dairy cows.

2. Materials and Methods

2.1. Experimental Animals and Sampling

The buffalo mammary gland tissues used in this study were collected in the Buffalo Breeding Farm of the Buffalo Research Institute, Chinese Academy of Agricultural Sciences, Nanning, Guangxi, China. Buffalo milk was also collected during early (30–100 days), mid (100–200 days), and late (>200 days) lactation using the aforementioned methods [13]. All of the selected buffaloes were in the second or third parity, with ages between 6.5 and 7 years. In brief, the milk samples were collected in summer (June–July), between 5:00–6:00 a.m., on the same day for each lactation stage. The samples were collected manually into sterile RNase-free tubes, taking care to avoid any contamination. The samples were immediately placed on ice and transported to the laboratory, and stored at −80 °C until further use.

2.2. Extraction of Total RNA from Milk Fat Globules

RNA from milk fat globules (MFG) was extracted and used for gene expression analysis. By referring to a previous report [1], the total RNA was extracted from the MFG at 4 °C and completed within 2 h to improve the quality of the mRNA. In brief, the milk samples were centrifuged at 2000× g for 10 min at 4 °C to isolate milk fat. The supernatant fat layer was separated, and 500 μL of fat was mixed with 1 mL of TRIzol solution (Invitrogen, Carlsbad, CA, USA). Following centrifugation (4000 rpm, 5 min), the top layer of fat was removed, and the bottom liquid was separated and mixed with 200 μL of chloroform. RNA from BMECs was also extracted using TRIzol solution (Invitrogen, Carlsbad, CA, USA). The RNA was precipitated using isopropyl alcohol and dissolved with 30 μL of RNase-free water. Agarose gel electrophoresis was performed, and only mRNA samples with a low 5S band were selected for the following experiment.

2.3. Single-Strand cDNA Synthesis

The RNA purity was evaluated based on absorbance readings (ratio of A260/A230 and A260/A280) using a Nano-Drop ND-2000 spectrophotometer (Thermo Fisher Scientific, Waltham, MA, USA). The genomic DNA was removed using DNase treatment. First-strand cDNA was then synthesized using the RevertAid First Strand cDNA synthesis kit (K1622, Thermo Fisher Scientific, Waltham, MA, USA). The single-strand cDNA obtained was stored at −20 °C.

2.4. Phylogenetic, Secondary Structure, and Multiple Sequence Alignment Analyses

Amino acid sequences of the AGPAT proteins of buffalo, cow, goat, sheep, camel, human, and mouse were downloaded from the NCBI database (Table S1) and were aligned with ClustalW using MEGA11 software (v11.0.11) [14]. A single alignment file was prepared. A neighbor-joining phylogenetic tree with a bootstrap value of 1000 replicas was constructed in MEGA11 (v11.0.11) [14]. The phylogeny was further optimized using the website tool of iTOL [15]. Motif analysis was performed using the MEME suite tool (v6) [16]. Using the NCBI conserved domain database [17] and CD-Search tool (v3.20) [18], the conserved domains of the AGPAT gene family were analyzed. TB tools (v1.098745) were used to integrate the results of the tree, motif, and protein-conserved domain analyses [19]. The amino acid sequences of all of the AGPAT proteins of buffalo and cattle were submitted to the online server Phyre2 (v2.0) [20] for designing the three-dimensional structure of each AGPAT protein, and the secondary structure features fold recognition end homology modeling was identified. The models with confidence higher than 99% were selected for subsequent analysis. In the tertiary structure, the motifs were characterized using PyMOL software (v2.5.2) [21] and distinguished using different colors. The electrostatic potential energy of the proteins were also predicted using PyMOL software (v2.5.2) [21]. The domains of the proteins were further characterized using the InterPro database [22].

2.5. Isolation, Culture, and Purification of Buffalo Mammary Epithelial Cells

The buffalo mammary epithelial cells (BMECs) were cultured and purified as reported previously [23]. Briefly, fresh buffalo mammary gland tissue was obtained from the butchery and washed three times with normal saline (0.9% NaCl). The acinus portion was extracted from the mammary gland tissue, washed with normal saline (0.9% NaCl), and transferred into high-resistance PBS (containing 400 IU mL−1 each of penicillin and streptomycin) until it was brought back to the laboratory. Then, the tissue pieces were placed in culture dishes on a clean bench, cut into 1–2 mm pieces, tiled on the bottom of the culture dish, and cultured in an incubator (38.5 °C) for 4 h. The tissue pieces were then inverted and cultured with F12/DMEN (Gibco, Waltham, MA, USA) containing 20% serum (Gibco, Waltham, MA, USA) in the upright position overnight. Once the epithelial cells started growing after approximately eight days, they were isolated through trypsin digestion combined with a cell adherence speed method. The purification procedure was repeated three times, and BMECs at 3–4 generations in the subculture were used for the following studies. The cells were cultured with F12/DMEN (Gibco, Waltham, MA, USA) containing 20% serum (Gibco, Waltham, MA, USA) with a cell incubator (Thermo Fisher Scientific, Waltham, MA, USA).

2.6. siRNA Synthesis and Overexpression Vector Construction of Buffalo AGPAT1, AGPAT3, and AGPAT4

siRNAs targeting AGPAT1, AGPAT3, and AGPAT4 were designed and synthesized by Sangon Biotech (Shanghai, China) with a control sequence (Table S2). The AGPAT1, AGPAT3, and AGPAT4 genes were cloned from BMECs according to the GenBank [24] sequences and inserted into the pcDNA3.1-eGFP vector to construct the respective overexpression vectors.

2.7. Transfection of BMECs

Transfection of siRNAs and overexpression vectors was performed using Lipofectamine™ 2000 (Invitrogen, Carlsbad, CA, USA) according to the manufacturer’s instructions. The overexpression vectors or siRNAs were added to the transfection reagent at a 1:2 ratio after the cell density reached 80%. At 24 h after the transfection, fluorescence was detected to determine the transfection efficiency. The cells were collected 48 h after the transfection, and qRT-PCR was performed to analyze the gene expression. Each transfection experiment was performed, and each sample was detected three times. Cells transfected with pcDNA3.1-eGFP vector, or random siRNA sequences were used as the negative control.

2.8. Extraction and Component Analysis of Fatty Acids

Fatty acid extraction and gas chromatography analysis were performed following a previous study [1]. In brief, the BMECs transfected with siRNAs or overexpression vectors were collected in a 100 mL colorimetric tube. A solution containing 2 mL of 95% ethanol, 4 mL of water, and 10 mL of 8.3 mol/L hydrochloric acid was added to the tube. The sample was extracted 3 times using a mixture of petroleum ether and ether. The combined extract was transferred into a new flask. The extracted fat was dried, weighed, and finally dissolved in hexane. The fatty acid composition was determined through gas chromatography using a Shimadzu GC-2014C (Kyoto, Japan) gas chromatograph equipped with an FID and a capillary column (30 m × 0.32 mm i.d.; film thickness: 0.25 μm) (Agilent DB23, Loveland, CO, USA). The injection port was set at 230 °C and the detector at 280 °C. The column was maintained at 180 °C for 5 min and heated up to 230 °C at 3 °C min−1. The carrier gas was maintained in high-purity nitrogen, and the injection volume was 1 μL. Individual FA methyl esters were identified through a comparison with a standard mixture of 37 Component FAME Mix (Supelco Analytical Products, Bellefonte, PA, USA). The standards of PUFA-2, nonconjugated C18:2 isomer mixture, and cis-5,8,11,14,17 C20:5, cis-4,7,10,13,16,19 C22:6 (Supelco Analytical Products, Bellefonte, PA, USA), cis-6,9,12 C18:3, and cis-9,12,15 C18:3 (Matreya LLC, Pleasant Gap, PA, USA) were used to identify the PUFAs. The C18:1 isomer was identified based on commercial standard mixtures (Supelco Analytical Products, Bellefonte, PA, USA) and published isomeric profiles. Using a nonadecanoic acid as an internal standard, the veracity of peak normalization was increased. For all of the studied fatty acids, the coefficient of variation [(SD/mean) × 100] was <3.5%, which suggested good repeatability of the GC data. All of the samples were detected three times. All fatty acid compositions of BMECs were expressed as mg per 100 g of fat.

2.9. qRT-PCR Analysis

The primers (Table S3) designed using Oligo 7.0 software [25] were synthesized by GenSys Biotech (Nanning, China). Using the SYBR qPCR master mix (Vazyme Biotech Co., Ltd., Nanjing, China) [26], qRT-PCR was performed following the manufacturer’s instructions. The fluorescence data were acquired using the fluorescence ratio PCR instrument (Roche, Shanghai, China). More than three biological and technical replicates were maintained. The relative gene expression was calculated using the 2−∆∆CT method [27], and Ribosomal Protein S9 (RPS9) served as the reference gene [28,29].

2.10. Statistical Analysis

The data were statistically processed using analysis of variance (ANOVA) with Duncan’s multiple range (DMR) test in SPSS version 23.0 software (IBM SPSS Statistics, New York, NY, USA) [1] to analyze the differences in gene expression and fatty acid content. The data are expressed as mean ± SEM, and p < 0.05 is considered statistically significant.

3. Results

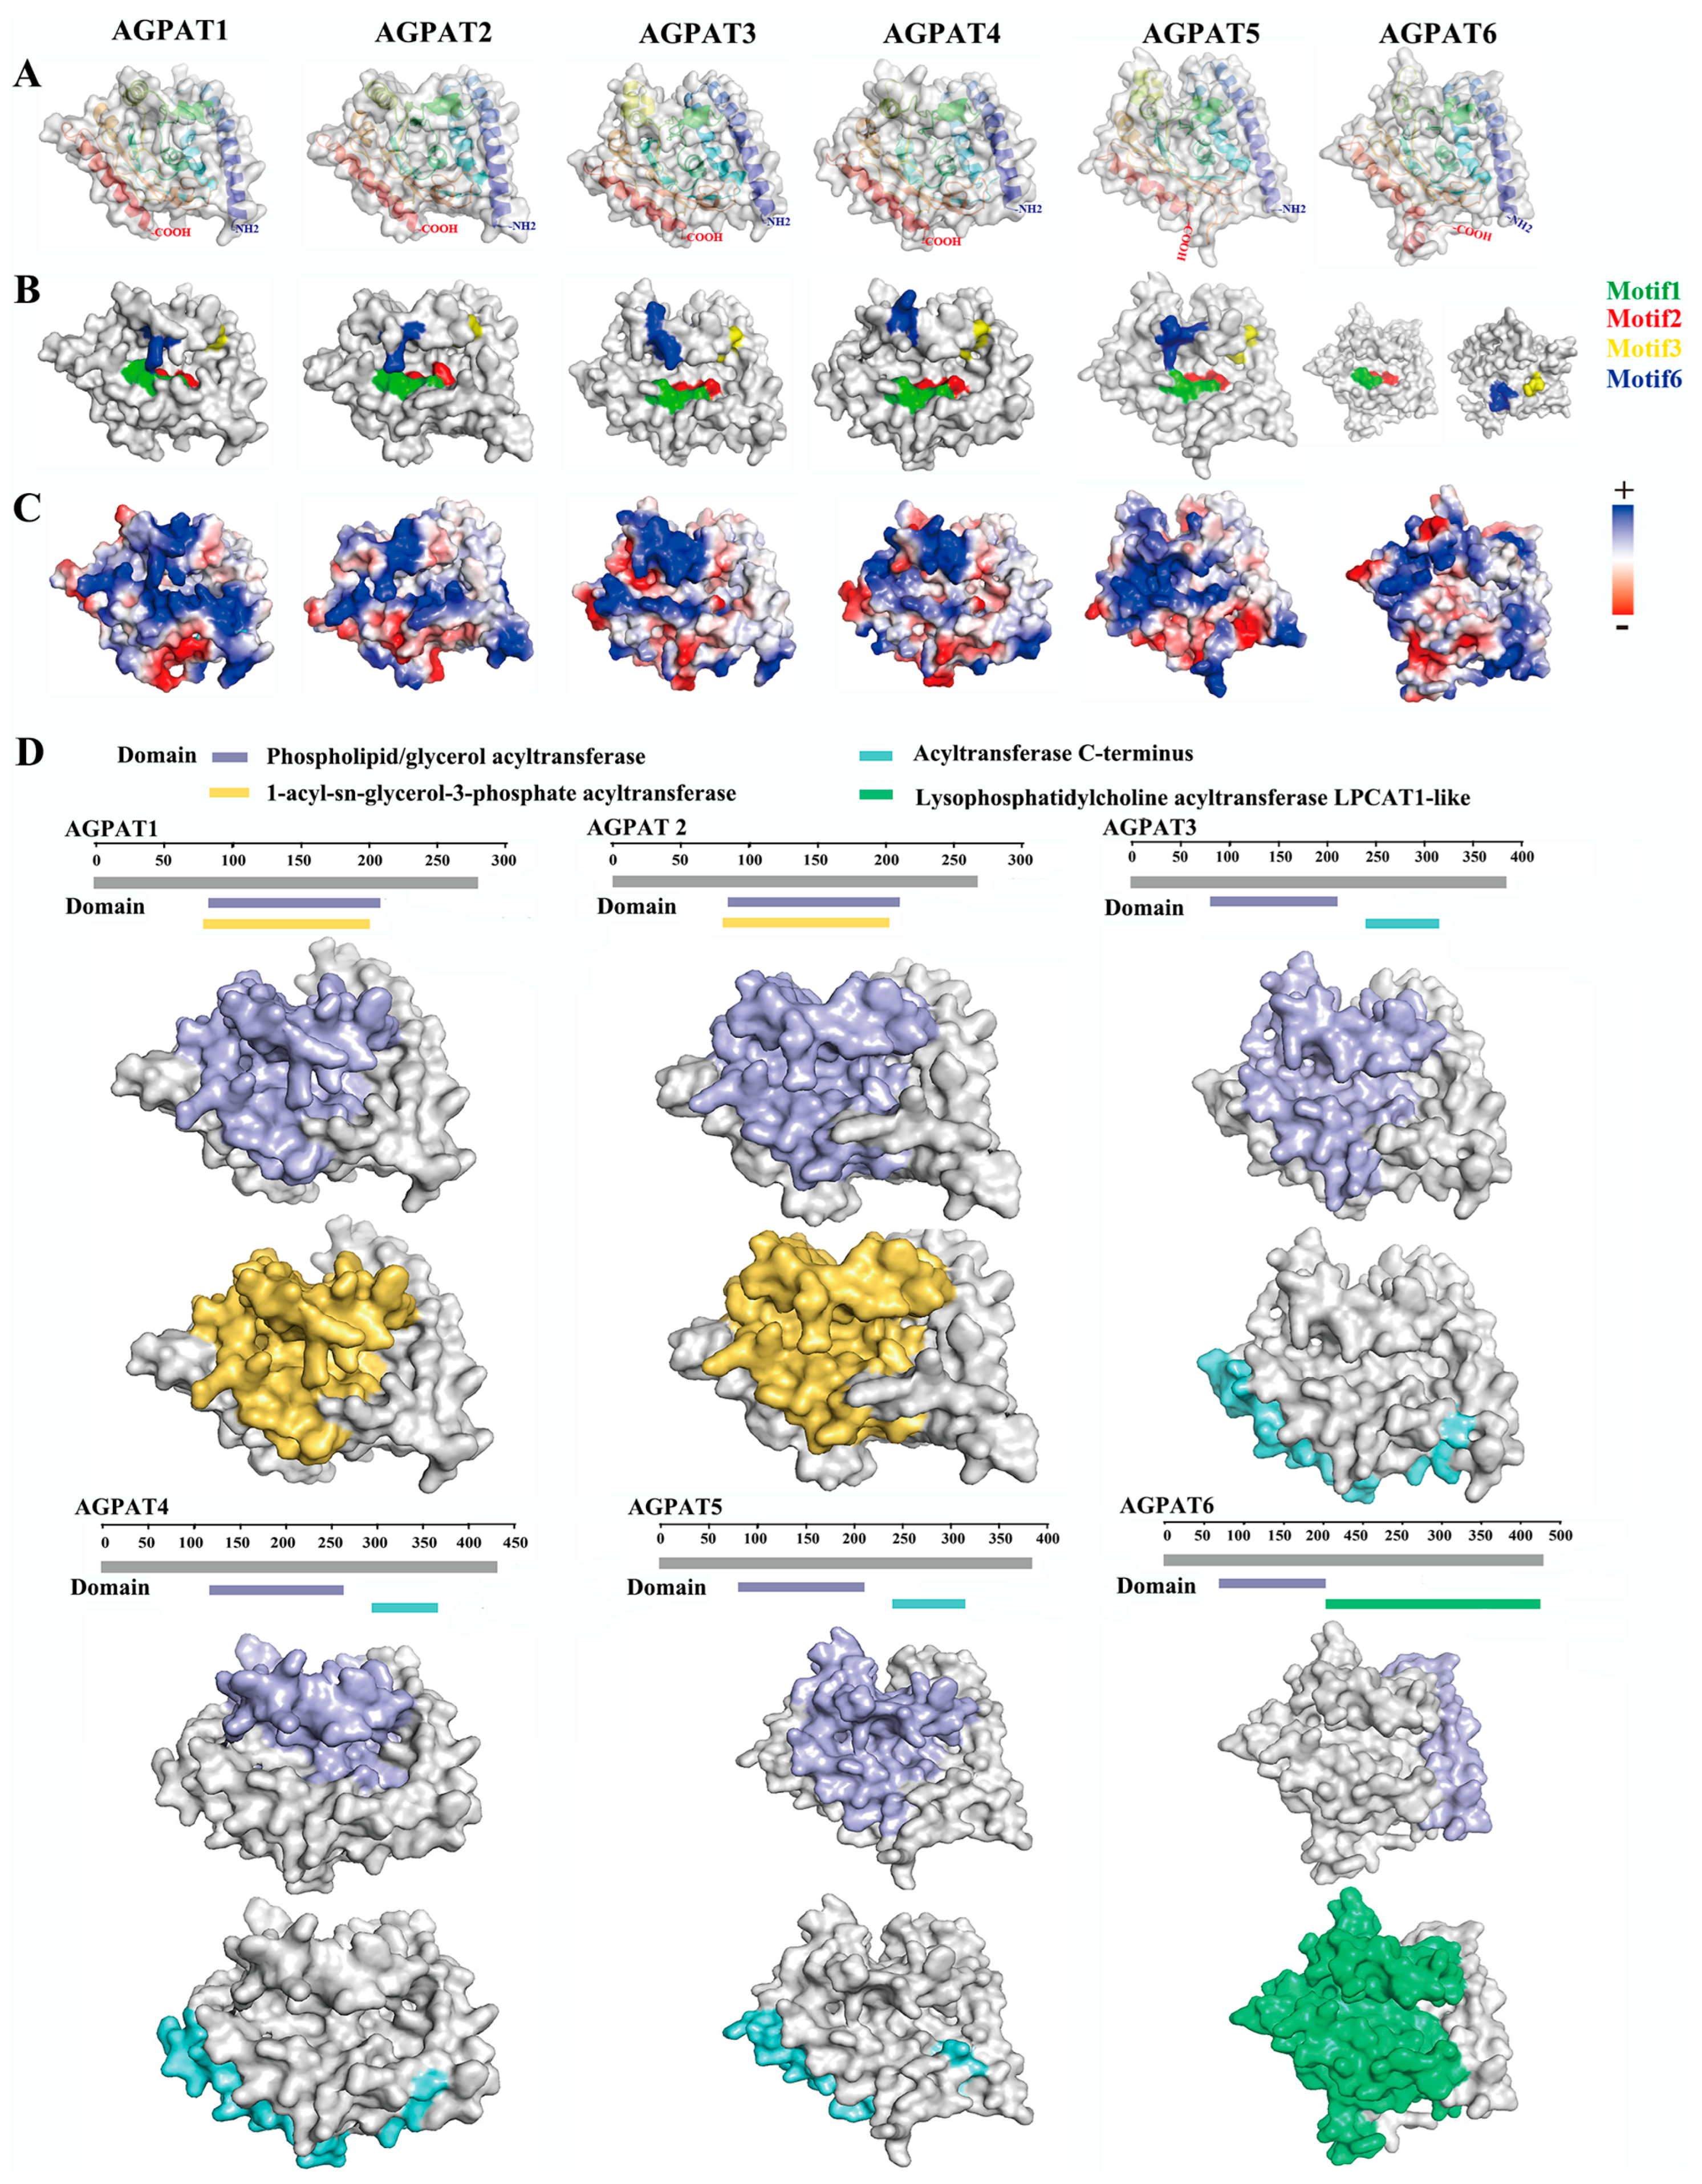
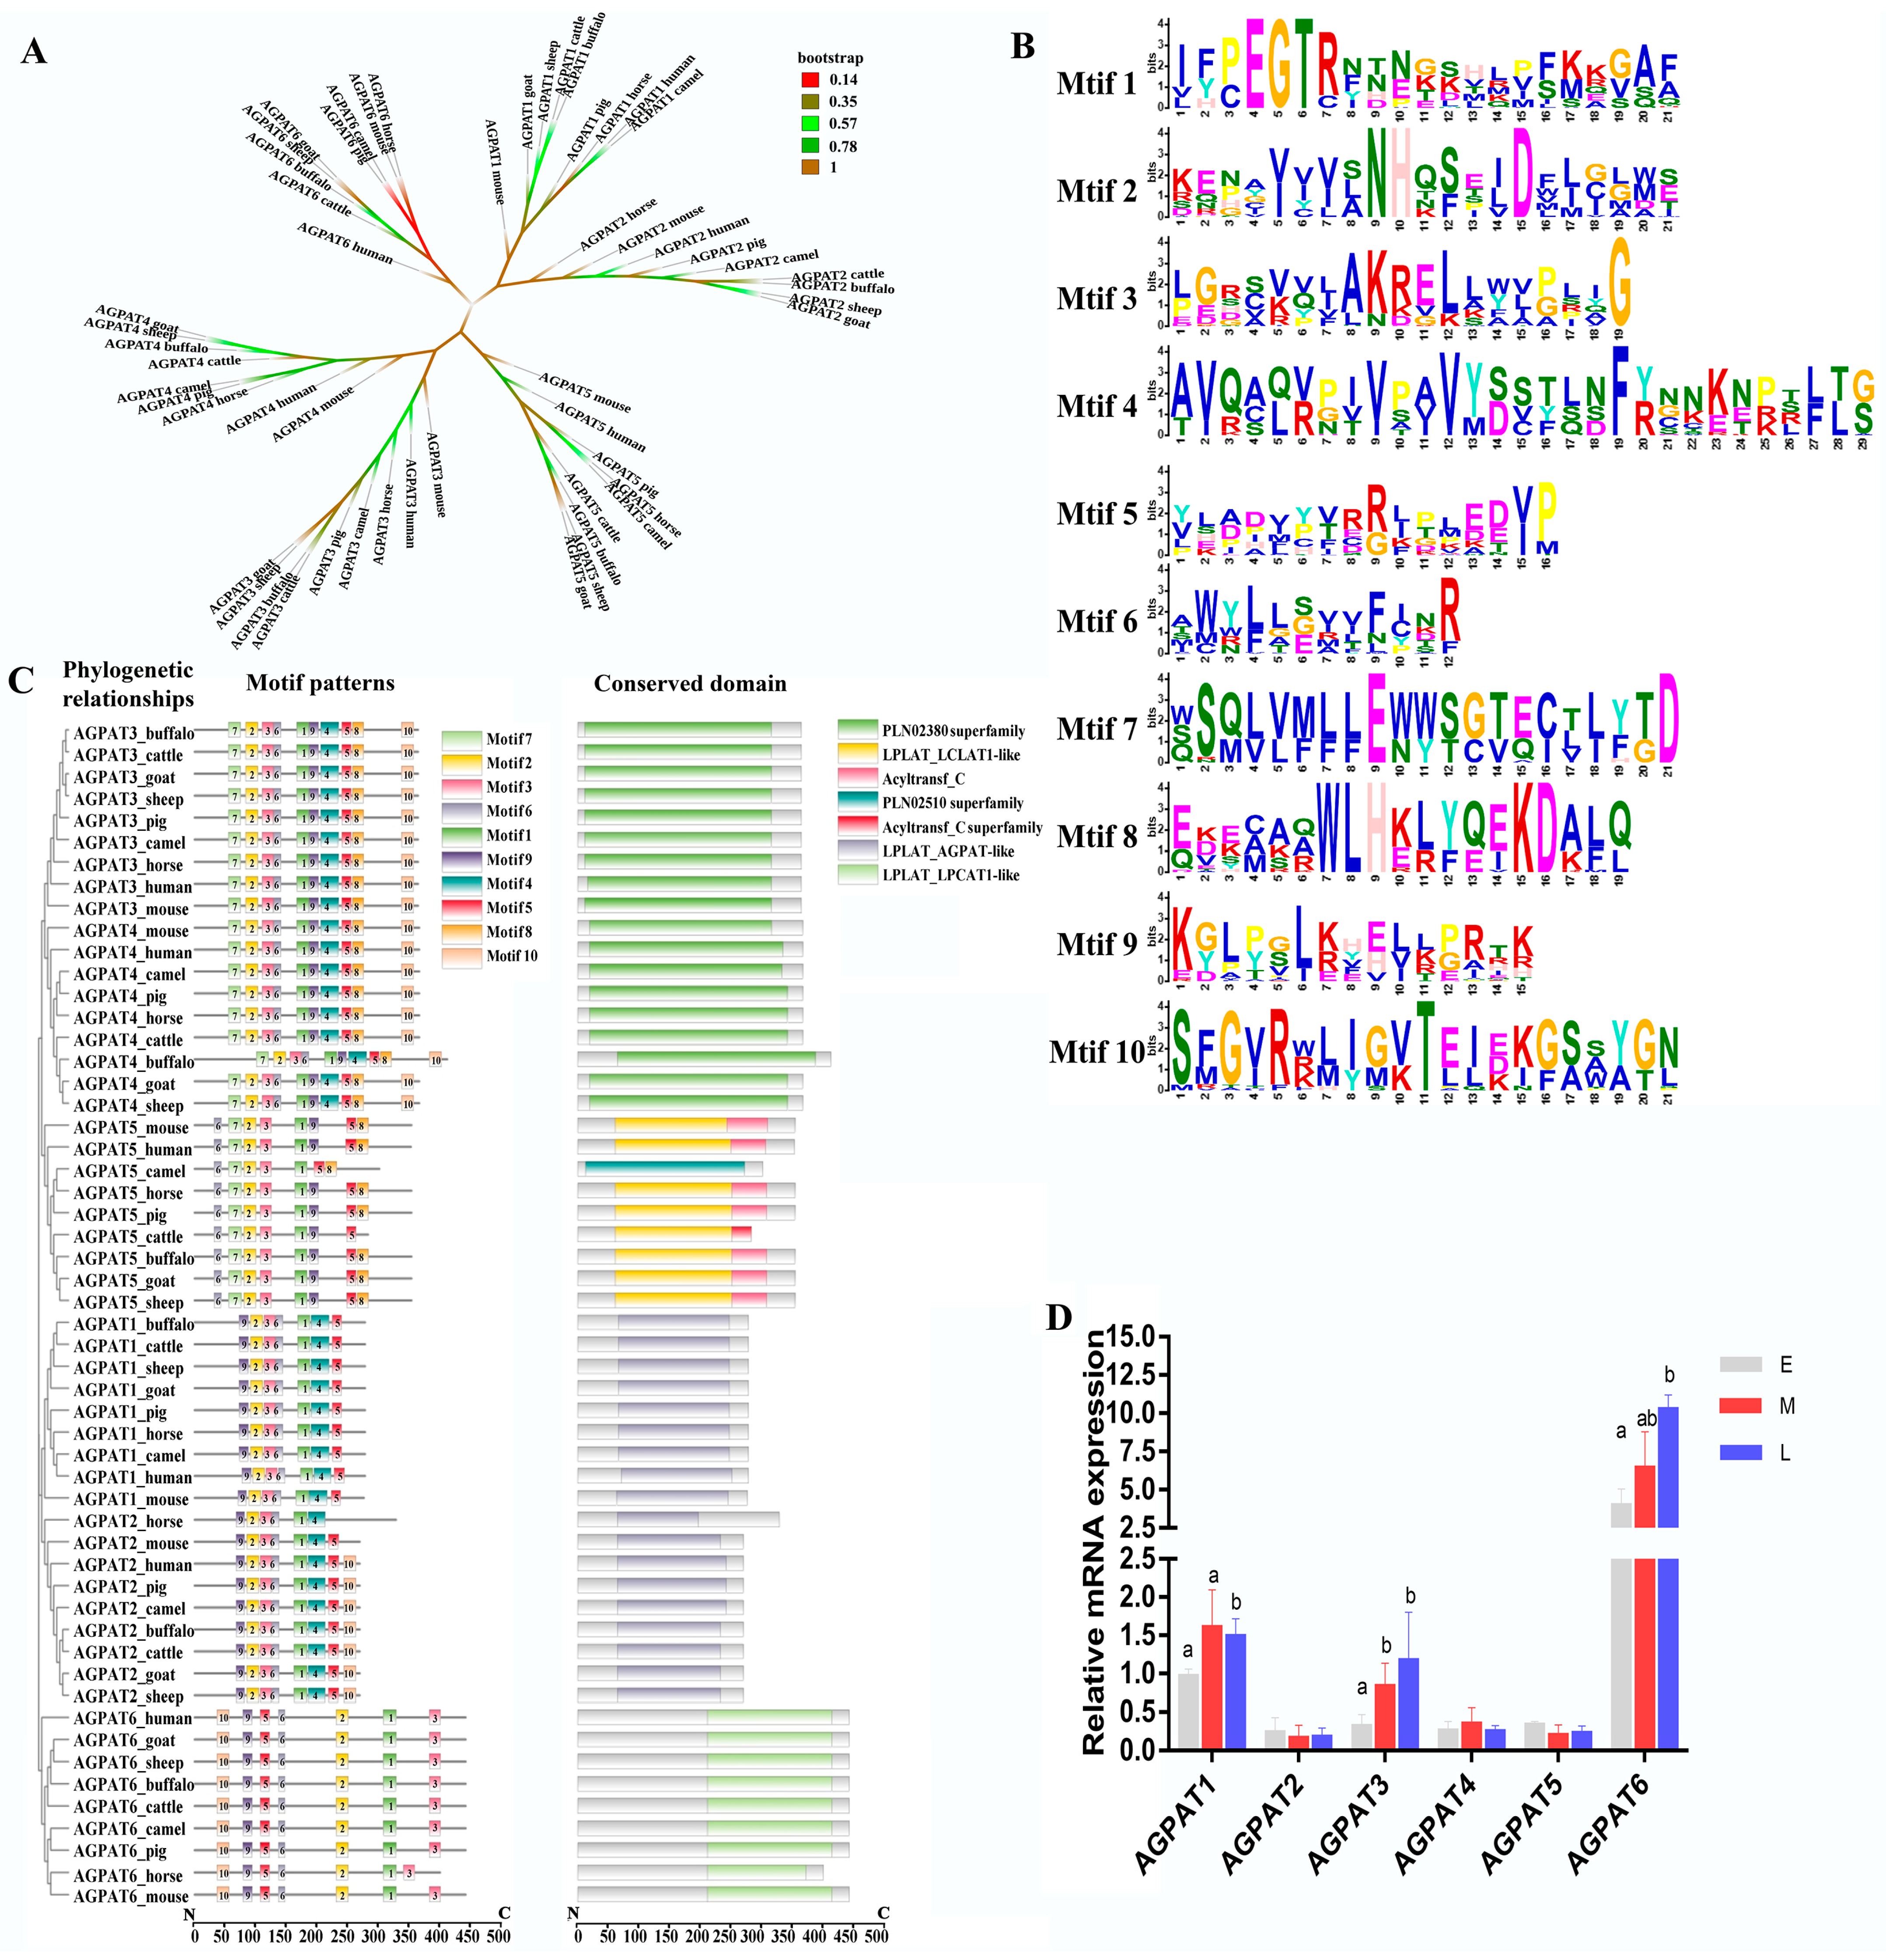
3.1. Analysis of Amino Acid and Protein Domain Conservation of Buffalo AGPAT Protein

By analyzing the AGPAT proteins of buffalo, cow, camel, goat, sheep, horse, pig, human, and mouse, the phylogeny of the AGPAT gene family was obtained (Figure 1A). In total, ten motifs were identified, and motif1 and motif2 were the most conserved (Figure 1B). Of the ten motifs, motif1, motif2, motif3, motif5, and motif6 were conserved in all proteins (Figure 1C). All of the AGPATs contain a PLN02380 superfamily, PLN02510 superfamily, or LPLAT-like domain (Figure 1C). Recent reports have confirmed that the aforementioned domain exhibited LPA acyltransferase activity, and used LPA as the substrate to catalyze acylation on the sn-2 site [30]. On analyzing the secondary structure of the AGPAT protein family, we observed that α and transmembrane helices are the main structures (Table 1). The tertiary structure analysis revealed that motif1, motif2, motif3, motif5, and motif6 of protein AGPAT1–5 formed a hydrophobic pocket (Figure 1D). The AGPAT6 tertiary structure exhibited a motif distribution significantly different from that of the other AGPAT proteins. qRT-PCR, performed for analyzing the expression of the buffalo AGPAT gene family during different lactation phases, revealed that AGPAT3 and AGPAT6 expressions were significantly higher in the middle and late lactation stages than in the earlier lactation stages (Figure 1D). We further analyzed the tertiary structure of the AGPAT family. Results showed that the tertiary structure of AGPAT1-5 is analogous except for one helix in the upper left corner, while that of AGPAT6 showed significant differences from other members (Figure 2A). The surface model further revealed that the four motifs form a “pocket” structure in AGPAT1-5 (Figure 2B). Electrostatic potential energy analysis revealed that this pocket is hydrophobic (Figure 2C). Further analysis of the domains showed that the phospholipid/glycerol acyltransferase domain was found in all of the AGPATs, suggesting that this “pocket” may be associated with the acylation function of the AGPAT gene in buffalo (Figure 2D). However, AGPAT6 showed a lysophosphatidylcholine acyltransferase LPCAT1-like domain, which is significantly different from other members (Figure 2D). The difference is consistent with the distribution difference in motifs found in the above spatial structure analysis. Based on the expression levels and tertiary structures of the AGPATs, we further explored the functions of AGPAT1, AGPAT3, and AGPAT4 in the following study.

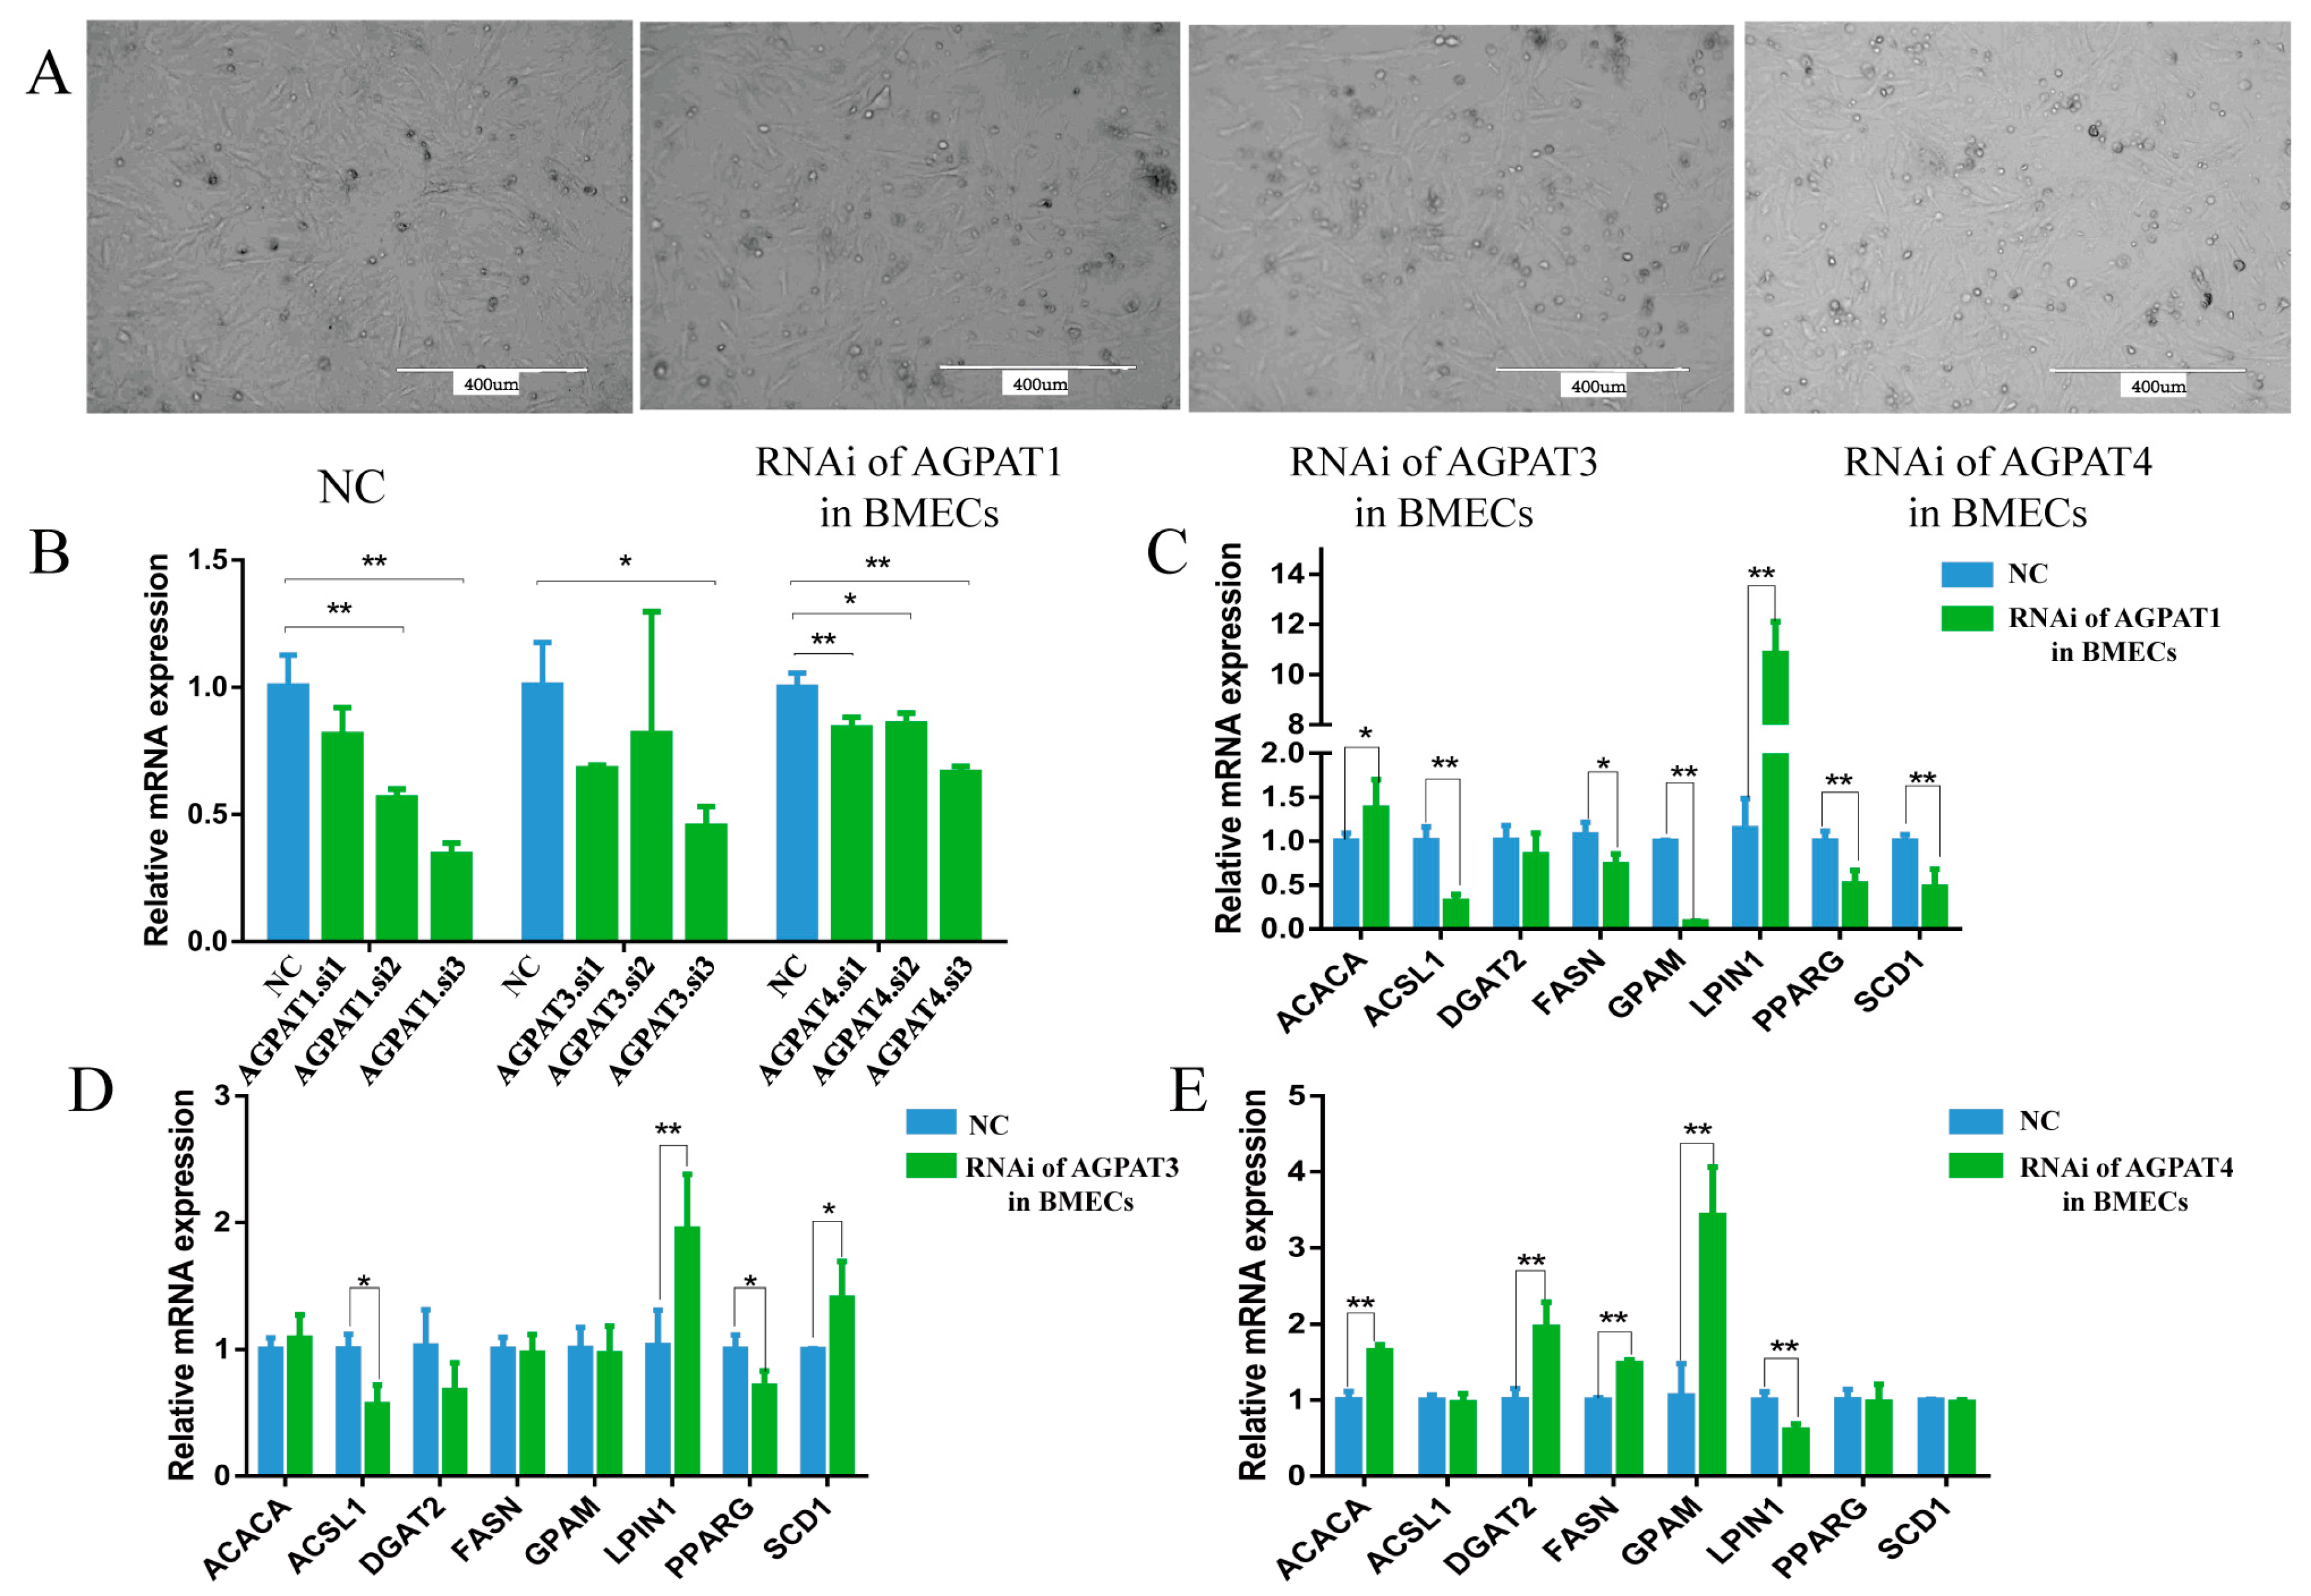
3.2. Effect of AGPAT Interference on Gene Expression and Fat Synthesis in BMECs

The siRNA of AGPAT1, AGPAT3, and AGPAT4 was transfected into the BMECs, and the transfected cells showed a typical cobblestone-like morphology (Figure 3A). The interference efficiency of each siRNA was analyzed, and the siRNA with the highest interference efficiency was then selected for the following experiments (Figure 3B). The transfection experiment was performed three times, and each sample was detected three times. The results show that after RNAi of AGPAT1 was performed, the expressions of GPAM (glycerol-3-phosphate acyltransferase, mitochondrial), PPARG (peroxisome proliferator-activated receptor γ), FASN (fatty acid synthase), and ACSL1 (acyl-CoA synthetase long chain family member 1) were significantly reduced (Figure 3C), and the total fatty acid content in the BMECs also reduced. After AGPAT3 was interfered with, the expressions of PPARG and ACSL1 were significantly reduced, whereas that of LPIN1 (phosphatidate phosphatase LPIN1) was significantly increased (Figure 3D). The expression levels of GPAM, DGAT2, and FASN were significantly increased after AGPAT4 interference, whereas the LPIN1 expression level significantly decreased (Figure 3E). When AGPAT1 and AGPAT3 were interfered, the content of most types of fatty acids in the BMECs decreased significantly, whereas the content increased significantly after AGPAT4 interference. Notably, the content of total fatty acids and UFAs in the BMECs decreased significantly after AGPAT1 or AGPAT3 interference (Table 2). However, after AGPAT4 interference, the content of total fatty acids and monounsaturated fatty acids (MUFA) increased significantly, but no significant difference was observed in the total UFA content. Among them, the palmitic acid (C16:0) content significantly decreased after AGPAT1 interference, whereas the content increased after AGPAT4 interference. Regardless of whether AGPAT1, AGPAT3, or AGPAT4 interference was performed, the content of α-linolenic acid (ALA, 18:3n-3), which is the precursor fatty acid of eicosapentaenoic acid (EPA, 20:5n-3) and DHA (docosahexaenoic acid, 22:6n-3), significantly decreased.

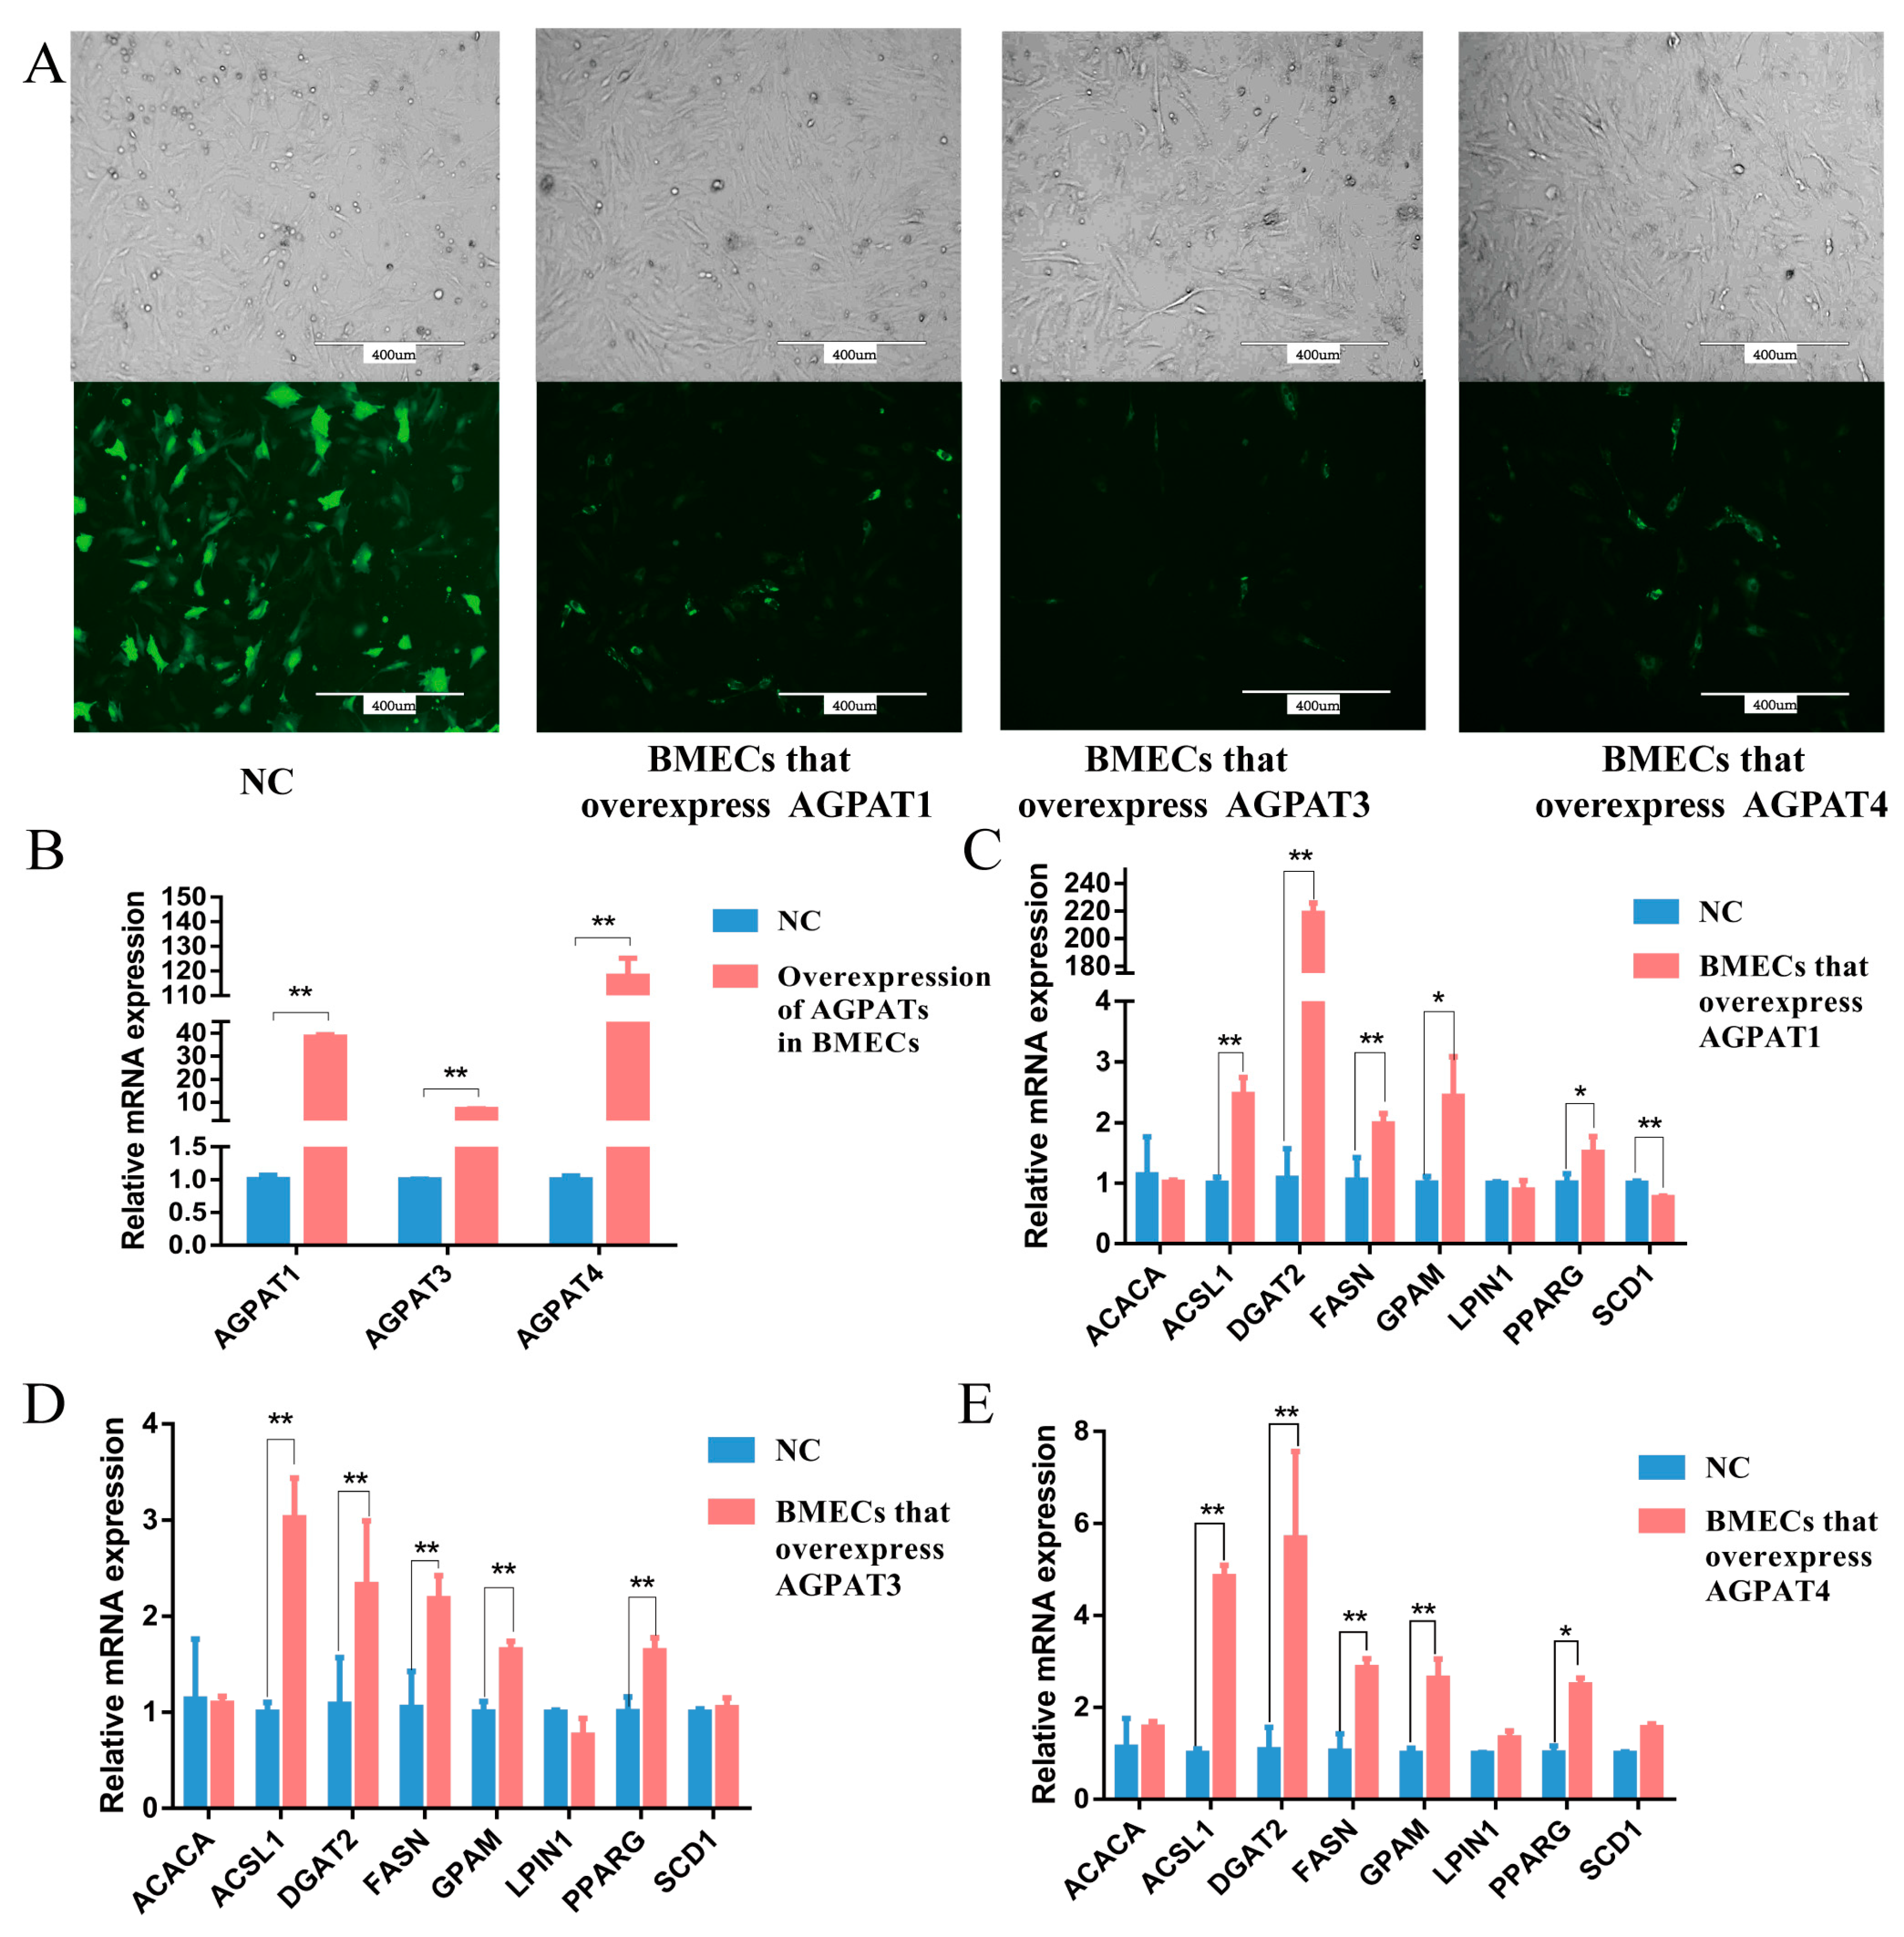
3.3. Effects of AGPATs Overexpression on Gene Expression and Fat Synthesis in BMECs

Following transfection of the AGPAT overexpression vector, green fluorescence was observed in the BMECs, indicating the successful expression of the overexpression vector in the cells (Figure 4A). The results show that at 48 h after the transfection, AGPAT1, AGPAT3, and AGPAT4 expression in the BMECs increased by 38.33, 6.95, and 117.94 times, respectively, as revealed through qRT-PCR (Figure 4B). The expression of fat synthesis-related genes, including ACSL1, DGAT2, FASN, GPAM, and PPARG, significantly increased (Figure 4C–E). After AGPAT1, AGPAT3, and AGPAT4 overexpression, the content of almost all types of fatty acids in the BMECs significantly increased, similar to the content of total fatty acids and total UFAs (Table 3). In addition, regardless of whether AGPAT1, AGPAT3, and AGPAT4 were overexpressed, the content of ALA, arachidonic acid (ARA, 20:4n-6), EPA, and DHA significantly increased.

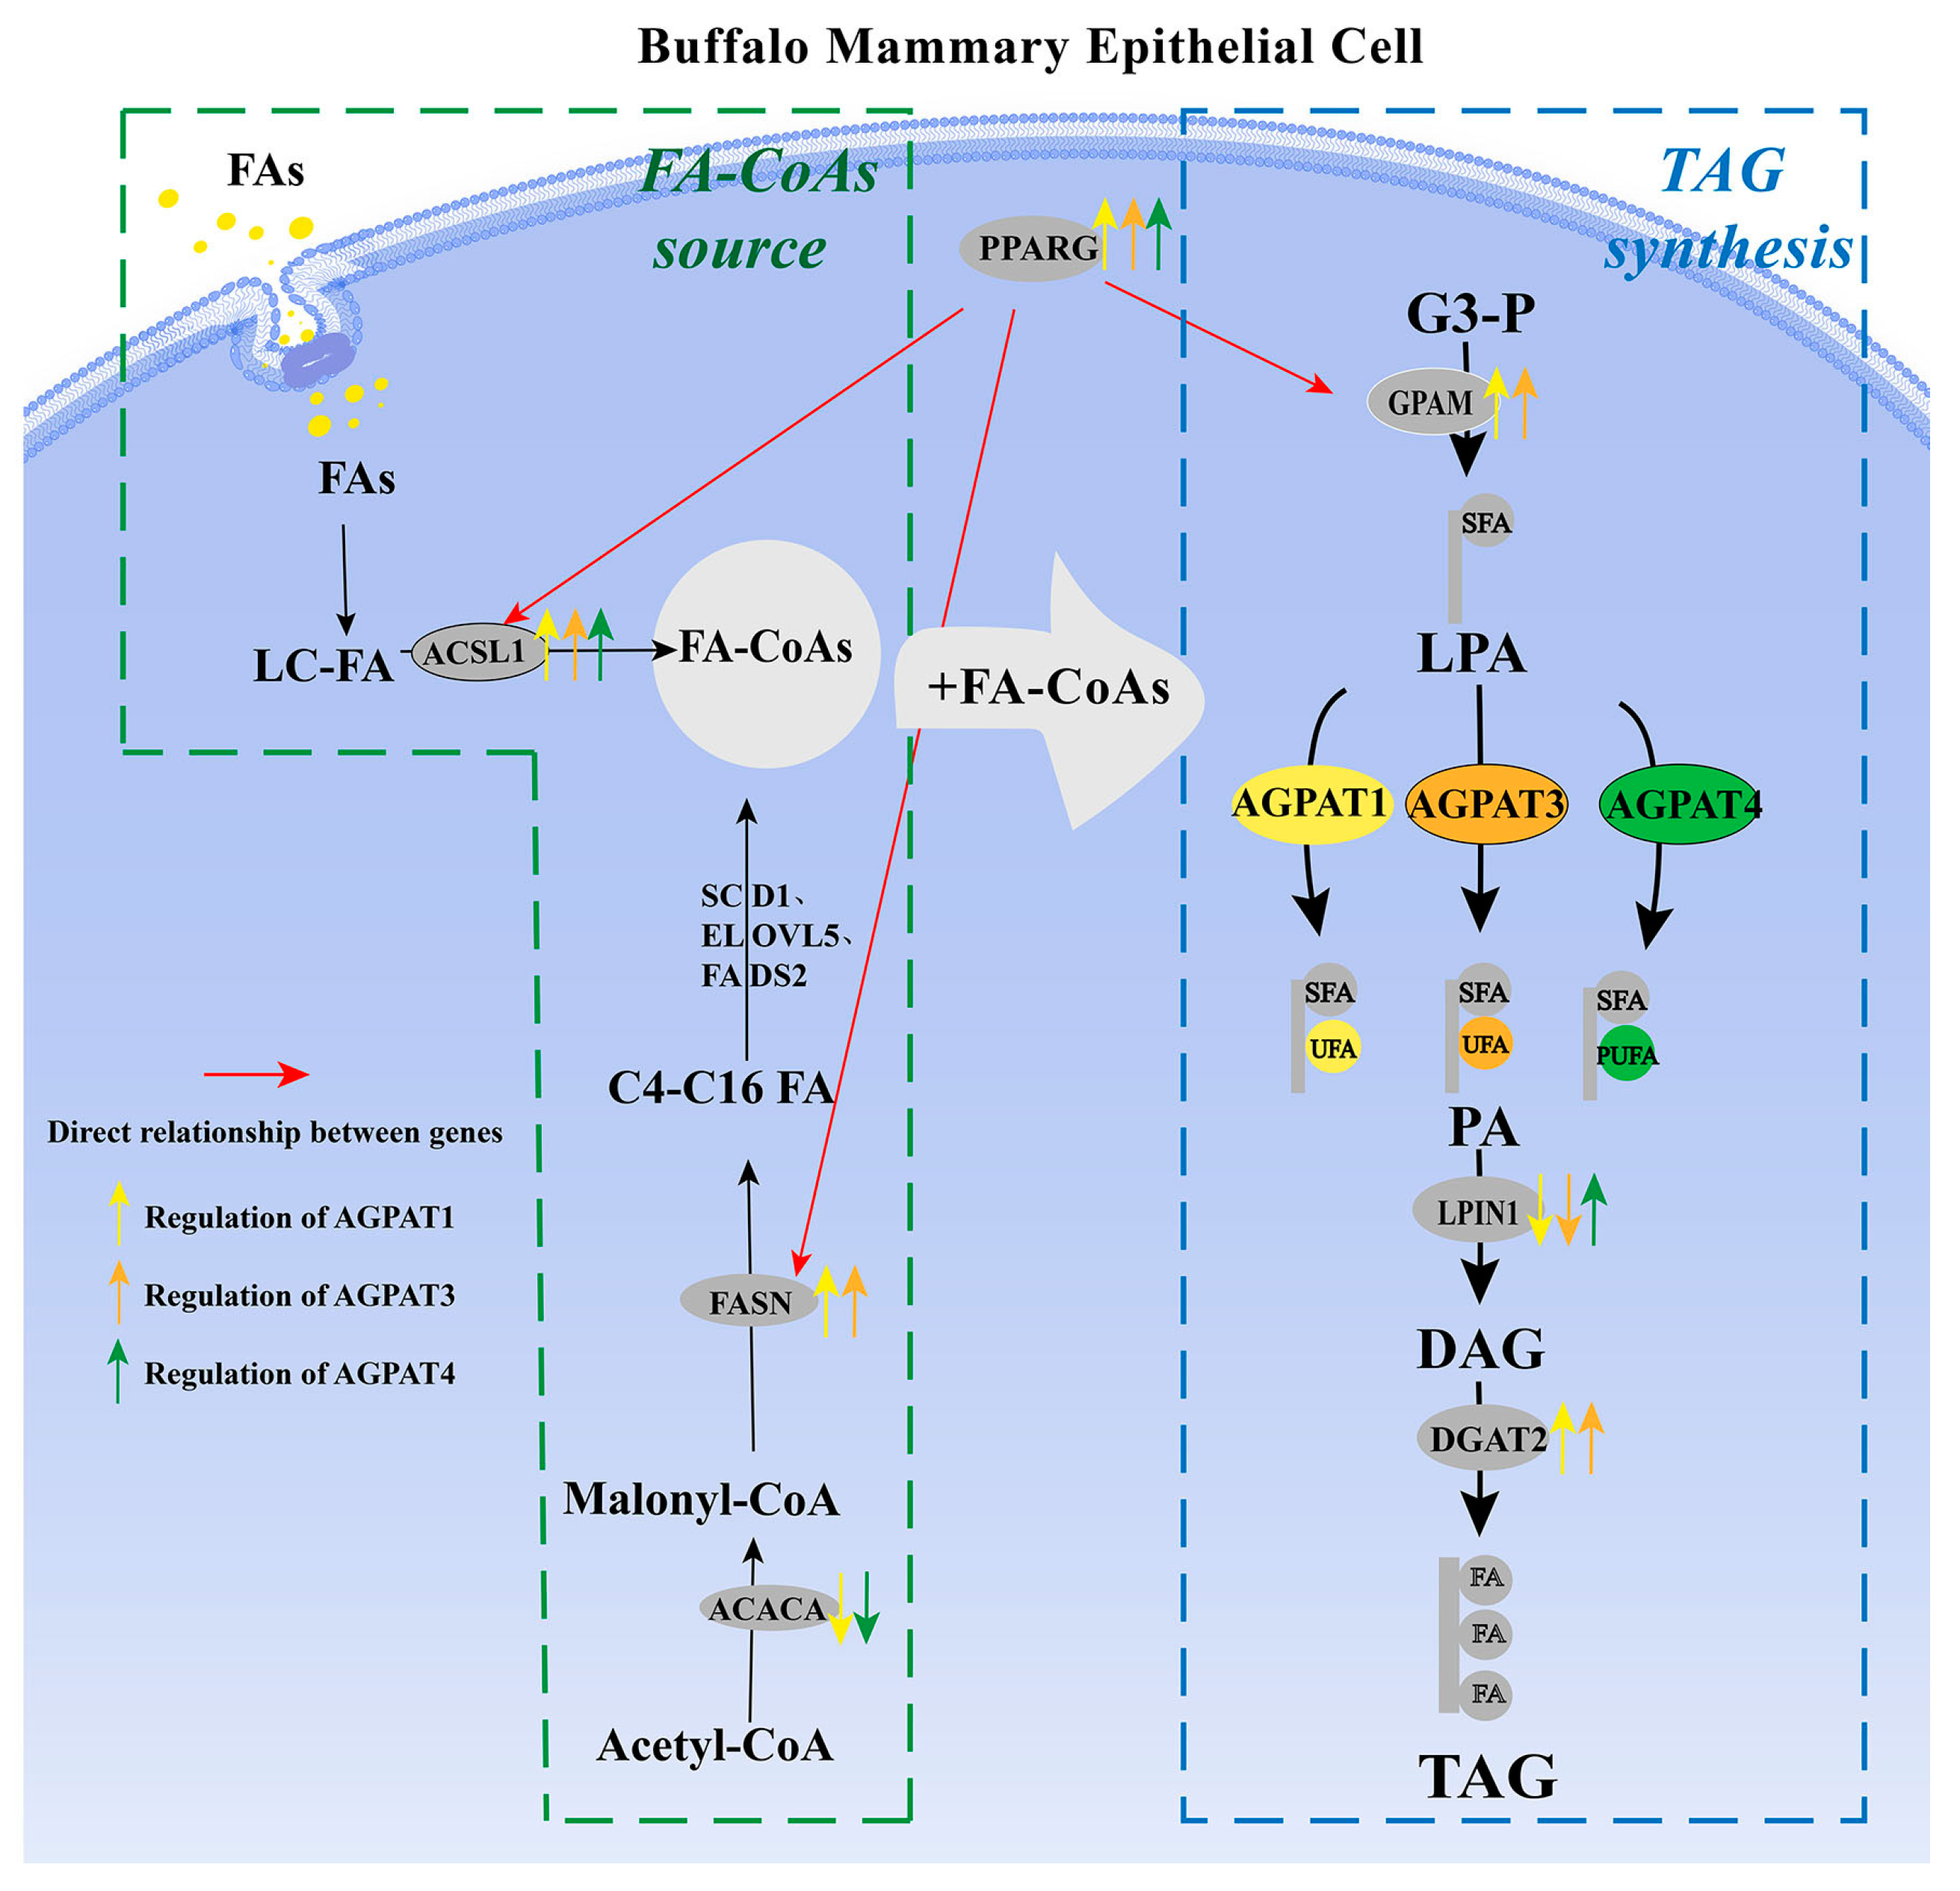
3.4. Potential Molecular Mechanism of AGPAT Gene Family Regulating Fat Synthesis in BMECs

Based on the aforementioned data, AGPAT1 and AGPAT3 expression were positively correlated with fat synthesis in the BMECs. AGPAT1 or AGPAT3 overexpression can increase the fat content in cells by promoting FASN, PPARG, ACSL1, GPAM, and DGAT2 expression. Moreover, AGPAT1 and AGPAT3 expression had a greater effect on the UFA content than the SFA content, indicating that AGPAT1 and AGPAT3 play a key role in unsaturated fat synthesis in the cells. AGPAT1 or AGPAT4 interference led to increased expression of ACACA, which catalyzes the carboxylation of acetyl-CoA to malonyl-CoA. This is the first rate-limiting step of de novo fatty acid synthesis. This suggests that AGPAT1 or AGPAT4 is negatively correlated with de novo fatty acid synthesis, while AGPAT1, AGPAT3, or AGPAT4 overexpression can promote the expression of ACSL1, which catalyzes the conversion of long-chain fatty acids (LCFAs) to their active form acyl-CoAs. Thus, AGPAT1, AGPAT3, or AGPAT4 expression is positively correlated with long-chain fat synthesis in cells. In addition, medium- and long-chain fatty acids are potent ACACA inhibitors in the mammary gland, which further confirms the negative correlation between AGPATs and de novo fatty acid synthesis. Surprisingly, AGPAT4 overexpression and interference can both promote DGAT2, FASN, and GPAM gene expression and significantly increase the fatty acid content in cells. However, no rational explanation is available for this result at present. AGPAT4 interference significantly decreased the PUFA content, whereas it significantly increased the SFA content. Simultaneously, AGPAT4 overexpression significantly promoted PUFA synthesis, indicating that AGPAT4 may exert a stronger catalytic effect on PUFA. Overall, AGPAT1, AGPAT3, and AGPAT4 expression can all promote lipid synthesis in BMECs (Figure 5).

4. Discussion

The fat content and composition of milk are chief factors that affect milk flavor, nutritional value, and economic value. The AGPAT gene family plays crucial roles in milk fat synthesis [31,32]. However, the underlying regulatory mechanism in the buffalo has not been completely elucidated. Furthermore, current studies have mainly focused on the role of the AGPAT gene family in regulating milk fat content, with few investigating its role in regulating fat composition. In a previous study, the authors identified 32 and 14 AGPAT isoform protein sequences encoded by 13 AGPAT genes predicted from the river and swamp buffalo genomes, respectively [9]. However, most of the identified AGPAT genes are only predicted by sequence analysis, and cannot be amplified from the mRNA of MFG. One possible reason is that the AGPAT gene may have different specific splicing in different tissues. In this study, we amplified six AGPATs from the MFG RNA of buffaloes and identified four conserved moieties in the amino acid sequences. Among them, the expressions of AGPAT2 and AGPAT5 are too low for further functional analysis. The functions of AGPAT1 and AGPAT6 in BMECs have been studied in a previous report [9,33]. We selected AGPAT1 to compare this study with the previous report. Meanwhile, considering that AGPAT1 has a similar hydrophobic pocket with AGPAT3 and AGPAT4, we finally selected AGPAT1, AGPAT3, and AGPAT4 for further study. RNAi and overexpression of AGPAT1, AGPAT3, and AGPAT4 in the BMECs revealed that AGPATs can promote fat synthesis in the BMECs by regulating the expression of fat synthesis-related genes, and had a stronger effect on UFA synthesis.
Milk fat synthesis is a highly coordinated process involving an extremely complex signal regulatory network. Diverse molecules participate in this process via multiple signal pathways. The main component of milk fat is TAG, and AGPAT catalyzes the conversion of LPA to PA, which is the second acylation step of TAG synthesis. AGPAT has been found to contribute to the diversity of glycerophospholipid species via selective esterification of fatty acyl chains at the sn-1 or sn-2 positions of membrane phospholipids. Many protein isoforms of the AGPAT gene family have been found, while the functions of different members may have a specialized role based on studies about genetic deficiencies in mice and/or humans. Based on sequence homologies, 11 LPAAT/AGPAT enzymes have been identified in mice and humans [34]. Among them, AGPAT4/LPAATδ is a physiologically essential enzyme that catalyzes the conversion of LPA (lysophosphatidic acid) to PA (phosphatidic acid), and is an essential component of the fission-inducing machinery driven by the protein BARS [34]. AGPAT2 mutations can lead to congenital lipodystrophy [35], which indicates that other family members cannot replace the AGPAT2 function. No significant differences in energy metabolism, food intake, and fat synthesis were observed in AGPAT4 knockout mice, suggesting that the AGPAT4 function may be compensated by other genes. In this study, both AGPAT4 gene overexpression and RNAi promoted the expression of fat synthesis-related genes in the BMECs, and increased the cell fat content [11], which is consistent with the results of a previous study. In addition, each member of the AGPAT gene family was found to constitute a different evolutionary branch. We also identified ten conserved motifs through MEME screening, with five of them present in all AGPAT genes. However, only four of the motifs could form hydrophobic pocket structures, namely motif1 (EGTR), motif2 (NHXXXXD), motif3 (XXPXX), and motif6 (FXXR). Previous studies have found that the AGPAT family has four conserved motifs that are essential for substrate recognition and enzymatic activity: motif1 (xHxxxxD), motif2 (GxxFxxR), motif3 (xxEGxx), and motif4 (xxxxPxx) [30,36], which is consistent with our study. The report also pointed out that the four AGPAT motifs surround the putative acyl-CoA-binding pocket [30], and this pocket was also found in our results. Increasing the PUFA level is a vital method to improve the nutritional value of milk and dairy products. Different members of the AGPAT gene family have shown different activity on different fatty acid substrates. A previous study found that AGPAT3 prefers arachidonoyl-CoA, and AGPAT1 and AGPAT4 incorporate oleoyl-CoAs to lysophosphatidylethanolamine and lysophosphatidylserine [37]. In this study, we found that the arachidonate significantly increased after overexpression of AGPAT3, while oleic acid increased after overexpression of AGPAT1 and AGPAT4, which is consistent with the report.
Milk fat is obtained from two main routes; one route is by taking it directly from the blood, and the other route is through de novo synthesis in breast cells [38]. When lactation begins, the fat in milk is mainly taken from the blood, while during the second lactation week, the mammary cells begin to synthesize fat using acetic acid and butyric acid, with the synthesis reaching a peak on the 30th day of lactation [6]. Therefore, fat in milk from the second lactation month is mainly from the de novo synthesis of mammary cells. The fatty acid biosynthetic pathway is highly conserved, starting with acetyl-CoA carboxylation to malonyl-CoA, followed by malonyl-CoA condensation with acetyl-CoA to form LCFAs. In the mammary gland, fatty acids of C4–C14 and 50% of C16 fatty acids in milk fat are synthesized by acetic acid and β-hydroxybutyric acid. UFAs are mainly synthesized by the action of stearoyl-CoA desaturase (SCD1) to synthesize unsaturated fatty acids [39]. In addition, breast cells can also absorb LCFA from albumin–fatty acid-binding proteins (NEFA) and lipoproteins [6,40]. Triglycerides are further synthesized from fatty acids by enzymes such as GPAT, AGPAT, LPIN, and DGAT [41]. Among these enzymes, AGPAT catalyzes the conversion of LPA to phosphatidic acid, then further dephosphorylation to form DAG [42].
The efficiency of milk fat synthesis in breast tissue is not fixed at different lactation stages, and the expression patterns of AGPAT subtypes in breast cells are also different [11,42,43]. AGPAT is highly correlated with milk production traits such as milk fat percentage, milk fat composition, and milk fatty acid synthesis [31,32]. AGPAT6 gene polymorphism can affect milk fat traits in dairy goats [44], and ELOVL6 can regulate fat synthesis in BMECs by regulating AGPAT6 expression [45]. AGPAT1, AGPAT2, AGPAT3, AGPAT5, and AGPAT6 expression levels are significantly increased in pigs after 17 days of delivery, which indicates that AGPAT family genes are crucial for lactation in pigs [31]. In this study, the AGPAT gene family had a positive effect on fat synthesis in buffalo milk. This gene family can promote the de novo synthesis of fatty acids and TAG synthesis, especially UFA synthesis, by promoting ACACA, FASN, ACSL1, GPAM, DGAT2, and PPARG expression. ACSL1 can promote milk fat synthesis and exhibits higher activity against the PUFA substrate [46]. In line with this, the study results also exhibited that ACSL1 expression in buffalo was positively correlated with PUFA synthesis. However, in this study, AGPAT4 overexpression or interference promoted DGAT2, FASN, and GPAM gene expression, and significantly increased the fatty acid content in cells. Currently, no rational explanation is available for this result, and further studies are warranted to reveal it.

5. Conclusions

In this study, we analyzed the amino acid sequences of the AGPAT gene family and identified 10 motifs in the proteins, among which motif1, motif2, motif3, and motif6 formed a hydrophobic pocket, which may be the functional domain in protein AGPAT1-5. Functional research showed that AGPAT1 and AGPAT3 plays a key role in the synthesis of fat, especially the UFA, in BMECs. However, further studies are required to reveal the function of AGPAT4 during fat synthesis. This study provides new insights into different members of the AGPAT gene family on TAG synthesis in BMECs, and theoretical references for improving the fatty acid composition of milk.

Supplementary Materials

The following supporting information can be downloaded at: https://www.mdpi.com/article/10.3390/genes14112072/s1. Table S1: Information of the access NO. of the AGPAT gene family used in this study; Table S2: The sequences of siRNA fragments used in this study; Table S3: Primers used in this study for qRT-PCR.

Author Contributions

Conceptualization, Z.L. and Q.L.; data curation, R.L. and S.W.; formal analysis, R.L.; funding acquisition, Z.L. and Q.L.; investigation, Z.L.; methodology, R.L., H.R., C.Q., J.S., S.W. and Y.L.; project administration, Z.L., Q.L. and K.C.; resources, Z.L., Q.L. and K.C.; software, J.S. and X.S.; supervision, K.C.; validation, R.L.; visualization, R.L. and X.S.; writing—original draft, Z.L. and R.L.; writing—review and editing, Z.L. All authors have read and agreed to the published version of the manuscript.

Funding

This research was funded by a Guangxi Science and Technology Major Project (AA22068099), the Guangxi Natural Science Foundation (2021GXNSFBA196036), and the National Natural Science Foundation of China (U20A2051).

Institutional Review Board Statement

All animals received humane care as outlined in the Guide for the Care and Use of Experimental Animals of the National Institutes of Health. The animal experiments were approved by the Animal Experiments Ethical Review Committee of Guangxi University, Nanning, Guangxi, China (Grant NO.: Gxu-2021-158).

Informed Consent Statement

Not applicable.

Data Availability Statement

The dates generated and analyzed during this study are included in this manuscript. Additional datasets used and/or analyzed during the current study are available from the corresponding author on reasonable request.

Conflicts of Interest

The authors declare no conflict of interest.

References

  1. Li, Z.; Lu, S.; Cui, K.; Shafique, L.; Luo, C.; Wang, Z.; Ruan, J.; Qian, Q.; Liu, Q. Fatty acid biosynthesis and transcriptional regulation of Stearoyl-CoA Desaturase 1 (SCD1) in buffalo milk. BMC Genet. 2020, 21, 23. [Google Scholar] [CrossRef] [PubMed]
  2. Minervino, A.H.H.; Zava, M.; Vecchio, D.; Borghese, A. Bubalus bubalis: A short story. Front. Vet. Sci. 2020, 7, 570413. [Google Scholar] [CrossRef] [PubMed]
  3. Medhammar, E.; Wijesinha Bettoni, R.; Stadlmayr, B.; Nilsson, E.; Charrondiere, U.R.; Burlingame, B. Composition of milk from minor dairy animals and buffalo breeds: A biodiversity perspective. J. Sci. Food Agric. 2012, 92, 445–474. [Google Scholar] [CrossRef]
  4. Žáček, P.; Bukowski, M.; Mehus, A.; Johnson, L.; Zeng, H.; Raatz, S.; Idso, J.P.; Picklo, M. Dietary saturated fatty acid type impacts obesity-induced metabolic dysfunction and plasma lipidomic signatures in mice. J. Nutr. Biochem. 2019, 64, 32–44. [Google Scholar] [CrossRef] [PubMed]
  5. Nie, P.; Pan, B.; Ahmad, M.J.; Zhang, X.; Chen, C.; Yao, Z.; Lv, H.; Wei, K.; Yang, L. Summer buffalo milk produced in China: A desirable diet enriched in polyunsaturated fatty acids and amino acids. Foods 2022, 11, 3475. [Google Scholar] [CrossRef]
  6. Bionaz, M.; Loor, J.J. Gene networks driving bovine milk fat synthesis during the lactation cycle. BMC Genom. 2008, 9, 366. [Google Scholar] [CrossRef] [PubMed]
  7. Mu, T.; Hu, H.; Ma, Y.; Feng, X.; Zhang, J.; Gu, Y. Regulation of key genes for milk fat synthesis in ruminants. Front. Nutr. 2021, 8, 765147. [Google Scholar] [CrossRef]
  8. Takeuchi, K.; Reue, K. Biochemistry, physiology, and genetics of GPAT, AGPAT, and lipin enzymes in triglyceride synthesis. Am. J. Physiol. Endocrinol. Metab. 2009, 296, E1195–E1209. [Google Scholar] [CrossRef]
  9. Ma, X.; Duan, A.; Lu, X.; Liang, S.; Sun, P.; Sohel, M.M.H.; Abdel-Shafy, H.; Amin, A.; Liang, A.; Deng, T. Novel Insight into the Potential Role of Acylglycerophosphate Acyltransferases Family Members on Triacylglycerols Synthesis in Buffalo. Int. J. Mol. Sci. 2022, 23, 6561. [Google Scholar] [CrossRef]
  10. Dircks, L.K.; Sul, H.S. Mammalian mitochondrial glycerol-3-phosphate acyltransferase. Biochim. Biophys. Acta (BBA)-Lipids Lipid Metab. 1997, 1348, 17–26. [Google Scholar] [CrossRef]
  11. Mardian, E.B.; Bradley, R.M.; Henao, J.J.A.; Marvyn, P.M.; Moes, K.A.; Bombardier, E.; Tupling, A.R.; Stark, K.D.; Duncan, R.E. Agpat4/Lpaatδ deficiency highlights the molecular heterogeneity of epididymal and perirenal white adipose depots. J. Lipid Res. 2017, 58, 2037–2050. [Google Scholar] [CrossRef] [PubMed]
  12. Koeberle, A.; Shindou, H.; Harayama, T.; Yuki, K.; Shimizu, T. Polyunsaturated fatty acids are incorporated into maturating male mouse germ cells by lysophosphatidic acid acyltransferase 3. FASEB J. 2012, 26, 169–180. [Google Scholar] [CrossRef] [PubMed]
  13. Arora, R.; Sharma, A.; Sharma, U.; Girdhar, Y.; Kaur, M.; Kapoor, P.; Ahlawat, S.; Vijh, R.K. Buffalo milk transcriptome: A comparative analysis of early, mid and late lactation. Sci. Rep. 2019, 9, 5993. [Google Scholar] [CrossRef]
  14. Tamura, K.; Stecher, G.; Kumar, S. MEGA11: Molecular evolutionary genetics analysis version 11. Mol. Biol. Evol. 2021, 38, 3022–3027. [Google Scholar] [CrossRef]
  15. Letunic, I.; Bork, P. Interactive Tree of Life (iTOL) v5: An online tool for phylogenetic tree display and annotation. Nucleic Acids Res. 2021, 49, W293–W296. [Google Scholar] [CrossRef]
  16. Bailey, T.L.; Johnson, J.; Grant, C.E.; Noble, W.S. The MEME suite. Nucleic Acids Res. 2015, 43, W39–W49. [Google Scholar] [CrossRef]
  17. Sayers, E.W.; Bolton, E.E.; Brister, J.R.; Canese, K.; Chan, J.; Comeau, D.C.; Connor, R.; Funk, K.; Kelly, C.; Kim, S. Database resources of the national center for biotechnology information. Nucleic Acids Res. 2022, 50, D20. [Google Scholar] [CrossRef]
  18. Wang, J.; Chitsaz, F.; Derbyshire, M.K.; Gonzales, N.R.; Gwadz, M.; Lu, S.; Marchler, G.H.; Song, J.S.; Thanki, N.; Yamashita, R.A. The conserved domain database in 2023. Nucleic Acids Res. 2023, 51, D384–D388. [Google Scholar] [CrossRef]
  19. Chen, C.; Wu, Y.; Xia, R. A painless way to customize Circos plot: From data preparation to visualization using TBtools. iMeta 2022, 1, e35. [Google Scholar] [CrossRef]
  20. Kelley, L.A.; Mezulis, S.; Yates, C.M.; Wass, M.N.; Sternberg, M.J. The Phyre2 web portal for protein modeling, prediction and analysis. Nat. Protoc. 2015, 10, 845–858. [Google Scholar] [CrossRef] [PubMed]
  21. DeLano Scientific LLC. The PyMOL Molecular Graphics System, version 2.5.2 ed.; DeLano Scientific LLC: San Francisco, CA, USA, 2022. [Google Scholar]
  22. Paysan-Lafosse, T.; Blum, M.; Chuguransky, S.; Grego, T.; Pinto, B.L.; Salazar, G.A.; Bileschi, M.L.; Bork, P.; Bridge, A.; Colwell, L. InterPro in 2022. Nucleic Acids Res. 2023, 51, D418–D427. [Google Scholar] [CrossRef]
  23. Zhou, F.; Fan, X.; Miao, Y. LPIN1 promotes triglycerides synthesis and is transcriptionally regulated by PPARG in buffalo mammary epithelial cells. Sci. Rep. 2022, 12, 2390. [Google Scholar] [CrossRef]
  24. Benson, D.A.; Cavanaugh, M.; Clark, K.; Karsch-Mizrachi, I.; Ostell, J.; Pruitt, K.D.; Sayers, E.W. GenBank. Nucleic Acids Res. 2018, 46, D41. [Google Scholar] [CrossRef]
  25. Rychlik, W. OLIGO 7 primer analysis software. PCR Primer Des. 2007, 402, 35–59. [Google Scholar]
  26. Zheng, M.; Chen, X.; Cui, Y.; Li, W.; Dai, H.; Yue, Q.; Zhang, H.; Zheng, Y.; Guo, X.; Zhu, H. TULP2, a new RNA-binding protein, is required for mouse spermatid differentiation and male fertility. Front. Cell. Dev. Biol. 2021, 9, 623738. [Google Scholar] [CrossRef] [PubMed]
  27. Rao, X.; Huang, X.; Zhou, Z.; Lin, X. An improvement of the 2ˆ(–delta delta CT) method for quantitative real-time polymerase chain reaction data analysis. Biostat. Bioinform. Biomath. 2013, 3, 71. [Google Scholar]
  28. Kaur, R.; Sodhi, M.; Sharma, A.; Sharma, V.L.; Verma, P.; Swami, S.K.; Kumari, P.; Mukesh, M. Selection of suitable reference genes for normalization of quantitative RT-PCR (RT-qPCR) expression data across twelve tissues of riverine buffaloes (Bubalus bubalis). PLoS ONE 2018, 13, e0191558. [Google Scholar] [CrossRef]
  29. Chen, Q.; Wu, Y.; Zhang, M.; Xu, W.; Guo, X.; Yan, X.; Deng, H.; Jiang, Q.; Yang, X.; Lan, G. Milk fat globule is an alternative to mammary epithelial cells for gene expression analysis in buffalo. J. Dairy Res. 2016, 83, 202–208. [Google Scholar] [CrossRef]
  30. Valentine, W.J.; Yanagida, K.; Kawana, H.; Kono, N.; Noda, N.N.; Aoki, J.; Shindou, H. Update and nomenclature proposal for mammalian lysophospholipid acyltransferases, which create membrane phospholipid diversity. J. Biol. Chem. 2022, 298, 101470. [Google Scholar] [CrossRef]
  31. Lv, Y.; Guan, W.; Qiao, H.; Wang, C.; Chen, F.; Zhang, Y.; Liao, Z. Veterinary medicine and omics (veterinomics): Metabolic transition of milk triacylglycerol synthesis in sows from late pregnancy to lactation. Omics A J. Integr. Biol. 2015, 19, 602–616. [Google Scholar] [CrossRef]
  32. Bionaz, M.; Loor, J.J. ACSL1, AGPAT6, FABP3, LPIN1, and SLC27A6 are the most abundant isoforms in bovine mammary tissue and their expression is affected by stage of lactation. J. Nutr. 2008, 138, 1019–1024. [Google Scholar] [CrossRef]
  33. Zhou, F.; Xue, J.; Shan, X.; Qiu, L.; Miao, Y. Functional roles for AGPAT6 in milk fat synthesis of buffalo mammary epithelial cells. Anim. Biotechnol. 2022, 34, 2120–2131. [Google Scholar] [CrossRef] [PubMed]
  34. Zhukovsky, M.A.; Filograna, A.; Luini, A.; Corda, D.; Valente, C. The Structure and Function of Acylglycerophosphate Acyltransferase 4/Lysophosphatidic Acid Acyltransferase Delta (AGPAT4/LPAATδ). Front. Cell. Dev. Biol. 2019, 7, 147. [Google Scholar] [CrossRef]
  35. Costa, S.; Sampaio, L.; Berta Sousa, A.; Xing, C.; Agarwal, A.K.; Garg, A. Face-sparing congenital generalized lipodystrophy type 1 associated with nonclassical congenital adrenal hyperplasia. J. Clin. Endocrinol. Metab. 2022, 107, 2433–2438. [Google Scholar] [CrossRef] [PubMed]
  36. Yamashita, A.; Nakanishi, H.; Suzuki, H.; Kamata, R.; Tanaka, K.; Waku, K.; Sugiura, T. Topology of acyltransferase motifs and substrate specificity and accessibility in 1-acyl-sn-glycero-3-phosphate acyltransferase 1. Biochim. Et Biophys. Acta (BBA)-Mol. Cell Biol. Lipids 2007, 1771, 1202–1215. [Google Scholar] [CrossRef] [PubMed]
  37. Hishikawa, D.; Shindou, H.; Kobayashi, S.; Nakanishi, H.; Taguchi, R.; Shimizu, T. Discovery of a lysophospholipid acyltransferase family essential for membrane asymmetry and diversity. Proc. Natl. Acad. Sci. USA 2008, 105, 2830–2835. [Google Scholar] [CrossRef]
  38. Ding, L.; Shen, Y.; Jawad, M.; Wu, T.; Maloney, S.K.; Wang, M.; Chen, N.; Blache, D. Effect of arginine supplementation on the production of milk fat in dairy cows. J. Dairy Sci. 2022, 105, 8115–8129. [Google Scholar] [CrossRef]
  39. Yoon, H.; Shaw, J.L.; Haigis, M.C.; Greka, A. Lipid metabolism in sickness and in health: Emerging regulators of lipotoxicity. Mol. Cell 2021, 81, 3708–3730. [Google Scholar] [CrossRef]
  40. Demmelmair, H.; Koletzko, B. Lipids in human milk. Best Pract. Res. Clin. Endoc. Metab. 2018, 32, 57–68. [Google Scholar] [CrossRef]
  41. Wang, H.; Airola, M.V.; Reue, K. How lipid droplets “TAG” along: Glycerolipid synthetic enzymes and lipid storage. Biochim. Biophys. Acta (BBA)-Mol. Cell Biol. Lipids 2017, 1862, 1131–1145. [Google Scholar] [CrossRef]
  42. Bradley, R.M.; Duncan, R.E. The lysophosphatidic acid acyltransferases (acylglycerophosphate acyltransferases) family: One reaction, five enzymes, many roles. Curr. Opin. Lipidol. 2018, 29, 110–115. [Google Scholar] [CrossRef] [PubMed]
  43. Agarwal, A.K.; Sukumaran, S.; Cortés, V.A.; Tunison, K.; Mizrachi, D.; Sankella, S.; Gerard, R.D.; Horton, J.D.; Garg, A. Human 1-acylglycerol-3-phosphate O-acyltransferase isoforms 1 and 2: Biochemical characterization and inability to rescue hepatic steatosis in Agpat2−/− gene lipodystrophic mice. J. Biol. Chem. 2011, 286, 37676–37691. [Google Scholar] [CrossRef] [PubMed]
  44. He, C.; Wang, C.; Chang, Z.H.; Guo, B.L.; Li, R.; Yue, X.P.; Lan, X.Y.; Chen, H.; Lei, C.Z. AGPAT6 polymorphism and its association with milk traits of dairy goats. Genet. Mol. Res. 2011, 10, 2747–2756. [Google Scholar] [CrossRef] [PubMed]
  45. Tian, X.; Li, S.; Ge, G. Apatinib promotes ferroptosis in colorectal cancer cells by targeting ELOVL6/ACSL4 signaling. Cancer Manag. Res. 2021, 13, 1333–1342. [Google Scholar] [CrossRef]
  46. Zhao, Z.; Raza, S.H.A.; Tian, H.; Shi, B.; Luo, Y.; Wang, J.; Liu, X.; Li, S.; Bai, Y.; Hu, J. Effects of overexpression of ACSL1 gene on the synthesis of unsaturated fatty acids in adipocytes of bovine. Arch. Biochem. Biophys. 2020, 695, 108648. [Google Scholar] [CrossRef]
Figure 1. Sequences analysis of the AGPAT gene family. (A) Phylogenetic relationship of the AGPAT gene family. Different colors represent the credibility of the branches of the tree. (B) Motif patterns and conserved domains of AGPAT proteins. Larger amino acid letters represent greater conservation. (C) Motif and conserved domain analyses of the AGPAT family. (D) Expressions of AGPATs in buffaloes at different lactation stages. Note: Different superscript letters indicate significantly differences (p < 0.05). E, M, and L indicate the early, middle, and late lactation stages, respectively.
Genes 14 02072 g001
Figure 2. Tertiary structure, surface model, and electrostatic potential energy distribution of the AGPAT proteins in buffalo. (A) Tertiary structure of the buffalo AGPAT proteins. (B) The four motifs (motif1, motif2, motif3, motif6) in the surface model showed a pocket-like structure. (C) Electrostatic potential energy distribution of AGPAT proteins. Red and blue indicate negatively charged and positively charged regions, respectively. White indicates neutral/hydrophobic regions. (D) Domain analysis of the AGPAT proteins.
Genes 14 02072 g002
Figure 3. Effect of AGPAT interference on the expressions of fat synthesis-related genes in BMECs. (A) The morphology of BMECs after RNA interference. Scale bars = 400 μm. (B) The relative expressions of AGPAT1, AGPAT3, and AGPAT4 after siRNA interference. (C) Effect of AGPAT1 RNAi on the expressions of fat synthesis-related genes in BMECs. (D) Effect of AGPAT3 RNAi on the expressions of fat synthesis-related genes in BMEC. (E) Effect of AGPAT4 RNAi on the expressions of fat synthesis-related genes in BMECs. “*” represents p < 0.05; “**” represents p < 0.01.
Genes 14 02072 g003
Figure 4. Effects of AGPAT overexpression on the expressions of fat synthesis-related genes in BMECs. (A) Transfection of the AGPAT overexpression vector in BMECs. Scale bars = 400 μm. (B) The relative expressions of AGPAT1, AGPAT3, and AGPAT4 after the transfection. (C) Effects of AGPAT1 overexpression on the expressions of fat synthesis-related genes in BMECs. (D) Effects of AGPAT3 overexpression on the expressions of fat synthesis-related genes in BMECs. (E) Effects of AGPAT4 overexpression on the expressions of fat synthesis-related genes in BMECs. “*” represents p < 0.05; “**” represents p < 0.01.
Genes 14 02072 g004
Figure 5. Effect of buffalo AGPAT on de novo synthesis of fatty acids and TAG synthesis. Note: FAs, fatty acids; LD, lipid droplet; and MFG, milk fat globules. The red arrow represents the change in gene expression with an increase in total fatty acid content. The black arrow represents the preferred fatty acid acyl group.
Genes 14 02072 g005
Table 1. Secondary structure analysis of AGPAT proteins in buffalo.
AGPAT1AGPAT2AGPAT3AGPAT4AGPAT5AGPAT6
Number of amino acids287278376425365456
Disordered13%14%12%19%11%14%
α helix52%52%56%53%56%58%
β strand14%14%12%10%14%11%
TM helix16%17%32%29%24%29%
Table 2. Changes in fatty acid content in BMECs after AGPAT1, AGPAT3, and AGPAT4 were interfered.
Fatty AcidNCAGPAT1 RNAiAGPAT3 RNAiAGPAT4 RNAi
C10:032.11 ± 1.0812.43 ± 3.01 *12.90 ± 2.49 *15.03 ± 0.47 *
C14:044.97 ± 1.2123.53 ± 0.58 *26.53 ± 1.13 *39.13 ± 2.96
C15:022.77 ± 0.5913.23 ± 0.64 *15.00 ± 0.45 *20.53 ± 1.51
C16:0120.40 ± 2.27104.87 ± 2.30 *119.27 ± 3.14212.00 ± 25.27 *
C17:023.92 ± 0.5016.70 ± 0.60 *17.93 ± 0.22 *24.27 ± 1.71
C18:089.91 ± 2.55119.00 ± 5.69 *122.03 ± 3.87 *173.63 ± 3.55 *
C20:048.98 ± 1.7929.93 ± 1.33 *31.83 ± 0.55 *41.50 ± 2.99 *
C22:052.44 ± 1.4141.30 ± 1.42 *42.50 ± 0.70 *54.13 ± 5.06
C23:023.89 ± 0.5716.67 ± 0.33 *15.60 ± 1.17 *20.23 ± 1.53
C16:124.36 ± 0.7617.47 ± 0.47 *19.97 ± 0.27 *29.20 ± 4.13
C18:1n9c90.58 ± 2.4643.87 ± 1.56 *44.60 ± 2.14 *85.60 ± 5.70
C18:2n6c30.86 ± 1.6423.50 ± 0.38 *27.23 ± 0.4342.77 ± 3.47 *
C18:3n325.76 ± 0.359.33 ± 0.89 *11.97 ± 1.51 *16.93 ± 1.33 *
C20:124.81 ± 0.7725.27 ± 0.6726.93 ± 0.9236.23 ± 2.18 *
C20:3n628.89 ± 1.1118.50 ± 0.35 *21.37 ± 0.63 *24.47 ± 1.11 *
C20:3n326.00 ± 1.176.97 ± 1.52 *7.50 ± 0.87 *11.30 ± 2.12 *
C22:1n979.03 ± 3.05121.03 ± 2.63 *114.90 ± 2.77 *155.07 ± 9.49 *
C20:4n630.55 ± 1.9417.53 ± 2.22 *21.77 ± 1.55 *28.73 ± 3.24
C22:223.98 ± 0.5719.20 ± 0.29 *19.67 ± 1.41 *27.90 ± 1.36
C20:5n326.07 ± 1.044.40 ± 0.35
C24:126.93 ± 0.8230.63 ± 1.0731.23 ± 0.69 *42.67 ± 3.50 *
C22:6n322.53 ± 0.6414.10 ± 1.75 *20.10 ± 1.9025.50 ± 3.48
LCFA887.63 ± 12.78713.97 ± 11.72 *759.17 ± 4.39 *1116.20 ± 25.56 *
Total SFA459.39 ± 2.72377.67 ± 10.27 *403.60 ± 5.99600.47 ± 11.98 *
Total MUFA245.72 ± 5.67238.27 ± 5.47237.63 ± 1.87348.77 ± 21.07 *
ω-3 PUFA100.36 ± 3.0631.73 ± 3.76 *40.80 ± 1.64 *58.13 ± 6.03 *
ω-6 PUFA114.28 ± 4.4878.73 ± 1.72 *90.03 ± 2.19 *123.87 ± 2.82
Total PUFA214.64 ± 7.52110.47 ± 5.36 *130.83 ± 2.10 *182.00 ± 8.63 *
Total UFA460.35 ± 11.92348.73 ± 2.91 *368.47 ± 0.87 *530.77 ± 29.34
Total FA919.74 ± 13.86764.50 ± 11.17 *810.67 ± 6.73 *1182.10 ± 27.78 *
Note: Data are shown as mean ± SEM. “*” indicates significant differences with the NC group. All fatty acid compositions are expressed as mg/100 g of fat. “—” indicates undetectable.
Table 3. Changes in fatty acid content in BMECs after AGPAT1, AGPAT3, and AGPAT4 overexpression.
Fat AcidNCAGPAT1AGPAT3AGPAT4
C14:08.87 ± 0.7533.40 ± 2.07 *53.83 ± 1.98 *33.40 ± 1.21 *
C15:04.20 ± 0.4518.27 ± 1.36 *28.10 ± 2.28 *18.27 ± 0.82 *
C16:0103.20 ± 8.59133.90 ± 9.89222.97 ± 36.02 *116.80 ± 7.02
C17:08.47 ± 0.7426.40 ± 1.54 *39.47 ± 3.18 *26.00 ± 0.95 *
C18:099.03 ± 11.17131.63 ± 8.92183.03 ± 6.68 *121.87 ± 10.59
C20:017.60 ± 2.0073.17 ± 4.65 *107.13 ± 9.15 *71.63 ± 2.93 *
C22:019.83 ± 2.0983.40 ± 5.03 *122.23 ± 10.13 *81.33 ± 2.84 *
C23:010.40 ± 0.9639.53 ± 2.20 *59.00 ± 5.26 *39.13 ± 1.56 *
C24:021.47 ± 2.3490.90 ± 5.19 *133.40 ± 11.62 *88.20 ± 3.06 *
C16:15.77 ± 0.5020.90 ± 1.27 *31.43 ± 2.75 *20.73 ± 0.92 *
C18:1n9c32.50 ± 2.7628.03 ± 2.8542.27 ± 9.3220.30 ± 4.59
C18:2n6c22.20 ± 2.6730.53 ± 2.9742.37 ± 4.09 *21.20 ± 1.24
C18:3n38.30 ± 0.8733.10 ± 1.83 *49.03 ± 4.37 *33.50 ± 1.41 *
C20:111.27 ± 1.0932.70 ± 1.94 *48.20 ± 4.45 *31.80 ± 1.26 *
C20:3n615.30 ± 1.7835.63 ± 2.02 *58.27 ± 4.74 *37.37 ± 2.19 *
C20:3n39.47 ± 1.0242.43 ± 2.37 *63.33 ± 5.84 *41.57 ± 2.12 *
C22:1n938.57 ± 3.97120.60 ± 10.13 *168.90 ± 18.05 *113.27 ± 2.50 *
C20:4n614.17 ± 3.0234.57 ± 1.89 *52.93 ± 4.30 *37.23 ± 1.34 *
C22:28.83 ± 1.1140.57 ± 3.14 *61.00 ± 6.42 *39.83 ± 1.56 *
C20:5n36.50 ± 1.1824.43 ± 0.88 *36.17 ± 3.14 *23.50 ± 0.86 *
C24:112.07 ± 1.1842.90 ± 2.65 *60.83 ± 5.28 *40.87 ± 1.39 *
C22:6n37.70 ± 0.9029.43 ± 2.58 *45.47 ± 6.13 *31.70 ± 2.31 *
LC-FA485.70 ± 43.851146.43 ± 74.91 *1709.37 ± 105.19 *1089.50 ± 37.93 *
Total SFA293.07 ± 28.80655.53 ± 41.89 *985.93 ± 38.59 *620.83 ± 26.22 *
Total MUFA100.17 ± 8.11245.13 ± 17.11 *351.63 ± 39.59 *226.97 ± 4.19 *
ω-331.97 ± 3.71129.40 ± 7.64 *194.00 ± 19.35 *130.27 ± 6.49 *
ω-660.50 ± 6.97141.30 ± 10.01 *214.57 ± 19.44 *135.63 ± 3.91 *
Total PUFA92.47 ± 10.61270.70 ± 17.50 *408.57 ± 38.77 *265.90 ± 10.19 *
Total UFA192.63 ± 18.60515.83 ± 34.58 *760.20 ± 78.28 *492.87 ± 13.69 *
Total FA507.60 ± 48.421171.37 ± 76.45 *1748.80 ± 110.65 *1113.70 ± 38.72 *
Note: Data are shown as mean ± SEM. “*” indicates significant differences with the NC group. All fatty acid compositions are expressed as mg/100 g of fat.
Disclaimer/Publisher’s Note: The statements, opinions and data contained in all publications are solely those of the individual author(s) and contributor(s) and not of MDPI and/or the editor(s). MDPI and/or the editor(s) disclaim responsibility for any injury to people or property resulting from any ideas, methods, instructions or products referred to in the content.

