
Identification and Association of Single Nucleotide Polymorphisms of the FTO Gene with Indicators of Overweight and Obesity in a Young Mexican Population


 , ,
, ,  ,
,  and
and 
Abstract
1. Introduction
2. Materials and Methods
2.1. Subjects and Genetic Sampling
2.2. Analysis of Genetic Material
2.3. Statistical Analysis
3. Results
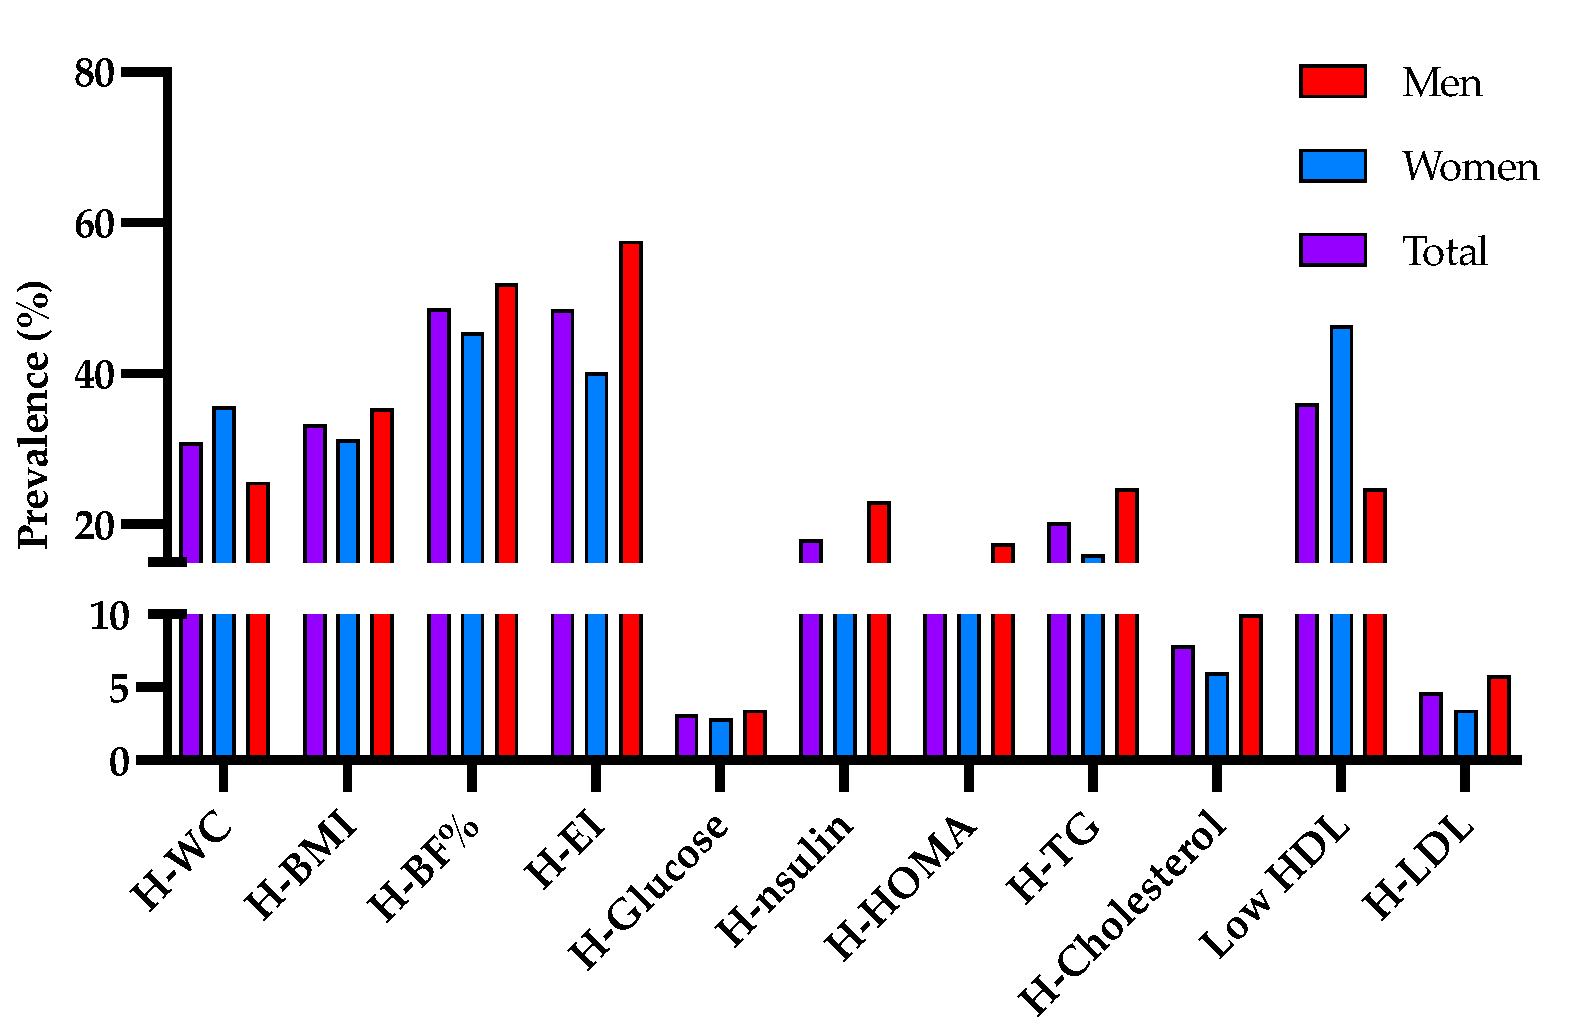
3.1. Description of the Population
3.2. Associations of FTO SNPs with Indicators of Obesity
3.3. Comparison of Means BMI, %BF, WC, TG, and Energy Consumption with Additive Models and Genotype
4. Discussion
5. Conclusions
Supplementary Materials
Author Contributions
Funding
Institutional Review Board Statement
Informed Consent Statement
Data Availability Statement
Acknowledgments
Conflicts of Interest
References
- WHO. Obesity and Overweight. Available online: https://www.who.int/news-room/fact-sheets/detail/obesity-and-overweight (accessed on 28 July 2022).
- Elks, C.E.; Den Hoed, M.; Zhao, J.H.; Sharp, S.J.; Wareham, N.J.; Loos, R.J.F.; Ong, K.K. Variability in the heritability of body mass index: A systematic review and meta-regression. Front. Endocrinol. 2012, 3, 29. [Google Scholar] [CrossRef] [PubMed]
- Tavalire, H.F.; Budd, E.L.; Natsuaki, M.N.; Neiderhiser, J.M.; Reiss, D.; Shaw, D.S.; Ganiban, J.M.; Leve, L.D. Using a sibling-adoption design to parse genetic and environmental influences on children’s body mass index (BMI). PLoS ONE 2020, 15, e0236261. [Google Scholar] [CrossRef]
- Rohde, K.; Keller, M.; la Cour Poulsen, L.; Blüher, M.; Kovacs, P.; Böttcher, Y. Genetics and epigenetics in obesity. Metabolism 2019, 92, 37–50. [Google Scholar] [CrossRef]
- Swinburn, B.A.; Sacks, G.; Hall, K.D.; McPherson, K.; Finegood, D.T.; Moodie, M.L.; Gortmaker, S.L. The global obesity pandemic: Shaped by global drivers and local environments. Lancet 2011, 378, 804–814. [Google Scholar] [CrossRef] [PubMed]
- Cominato, L.; Finardi, G.; Biagio, D.; Lellis, D.; Franco, R.R.; Mancini, M.C.; Melo, M.E. De Obesity Prevention: Strategies and Challenges in Latin America. Curr. Obes. Rep. 2018, 7, 97–104. [Google Scholar] [CrossRef]
- Saldaña-Alvarez, Y.; Salas-Martínez, M.G.; García-Ortiz, H.; Luckie-Duque, A.; García-Cárdenas, G.; Vicenteño-Ayala, H.; Cordova, E.J.; Esparza-Aguilar, M.; Contreras-Cubas, C.; Carnevale, A.; et al. Gender-dependent association of FTO polymorphisms with body mass index in Mexicans. PLoS ONE 2016, 11, e0145984. [Google Scholar] [CrossRef]
- González-Herrera, L.; Zavala-Castro, J.; Ayala-Cáceres, C.; Pérez-Mendoza, G.; López-González, M.J.; Pinto-Escalante, D.; Canto-Cetina, T.; García-Escalante, M.G.; Rubi-Castellanos, R.; Contreras-Capetillo, S.; et al. Genetic variation of FTO: rs1421085 T>C, rs8057044 G>A, rs9939609 T>A, and copy number (CNV) in Mexican Mayan school-aged children with obesity/overweight and with normal weight. Am. J. Hum. Biol. 2019, 31, e23192. [Google Scholar] [CrossRef] [PubMed]
- Zermeño-Rivera, J.J.; Astocondor-Pérez, J.P.; Valle, Y.; Padilla-Gutiérrez, J.R.; Orozco-Castellanos, R.; Figuera, L.E.; Gutiérrez-Amavizca, B.E. Association of the FTO gene SNP rs17817449 with body fat distribution in Mexican women. Genet. Mol. Res. 2014, 13, 8561–8567. [Google Scholar] [CrossRef]
- Speakman, J.R. The “Fat Mass and Obesity Related” (FTO) gene: Mechanisms of Impact on Obesity and Energy Balance. Curr. Obes. Rep. 2015, 4, 73–91. [Google Scholar] [CrossRef]
- Zhao, X.; Yang, Y.; Sun, B.F.; Zhao, Y.L.; Yang, Y.G. FTO and obesity: Mechanisms of association. Curr. Diab. Rep. 2014, 14, 486. [Google Scholar] [CrossRef] [PubMed]
- Tóth, B.B.; Arianti, R.; Shaw, A.; Vámos, A.; Veréb, Z.; Póliska, S.; Győry, F.; Bacso, Z.; Fésüs, L.; Kristóf, E. FTO Intronic SNP Strongly Influences Human Neck Adipocyte Browning Determined by Tissue and PPARγ Specific Regulation: A Transcriptome Analysis. Cells 2020, 9, 987. [Google Scholar] [CrossRef] [PubMed]
- Cha, S.W.; Choi, S.M.; Kim, K.S.; Park, B.L.; Kim, J.R.; Kim, J.Y.; Shin, H.D. Replication of genetic effects of FTO polymorphisms on BMI in a Korean population. Obesity 2008, 16, 2187–2189. [Google Scholar] [CrossRef] [PubMed]
- Ohashi, J.; Naka, I.; Kimura, R.; Natsuhara, K.; Yamauchi, T.; Furusawa, T.; Nakazawa, M.; Ataka, Y.; Patarapotikul, J.; Nuchnoi, P.; et al. FTO polymorphisms in oceanic populations. J. Hum. Genet. 2007, 52, 1031–1035. [Google Scholar] [CrossRef] [PubMed][Green Version]
- Villalobos-Comparán, M.; Teresa Flores-Dorantes, M.; Teresa Villarreal-Molina, M.; Rodríguez-Cruz, M.; García-Ulloa, A.C.; Robles, L.; Huertas-Vázquez, A.; Saucedo-Villarreal, N.; López-Alarcón, M.; Sánchez-Muñoz, F.; et al. The FTO gene is associated with adulthood obesity in the Mexican population. Obesity 2008, 16, 2296–2301. [Google Scholar] [CrossRef]
- O’Neill, D. Measuring obesity in the absence of a gold standard. Econ. Hum. Biol. 2015, 17, 116–128. [Google Scholar] [CrossRef] [PubMed]
- Abbasalizad Farhangi, M.; Nikniaz, L.; Nikniaz, Z. Higher dietary acid load potentially increases serum triglyceride and obesity prevalence in adults: An updated systematic review and meta-analysis. PLoS ONE 2019, 14, e0216547. [Google Scholar] [CrossRef]
- Fernández-Verdejo, R.; Marlatt, K.L.; Ravussin, E.; Galgani, J.E. Contribution of brown adipose tissue to human energy metabolism. Mol. Asp. Med. 2019, 68, 82–89. [Google Scholar] [CrossRef]
- Ilumina Inc. (Ed.) Infinium HTS Assay: Reference Guide; Illumina Way: San Diego, CA, USA, 2019; Volume 2, pp. 1–83. ISBN 1000000074604. [Google Scholar]
- Cadena-López, R.O.; Hernández-Rodríguez, L.V.; Aguilar-Galarza, A.; García-Muñoz, W.; Haddad-Talancón, L.; Anzures-Cortes, M.d.L.; Velázquez-Sánchez, C.; Flores-Viveros, K.L.; Anaya-Loyola, M.A.; García-Gasca, T.; et al. Association between SNPs in Leptin Pathway Genes and Anthropometric, Biochemical, and Dietary Markers Related to Obesity. Genes 2022, 13, 945. [Google Scholar] [CrossRef]
- Purcell, S.; Neale, B.; Todd-Brown, K.; Thomas, L.; Ferreira, M.A.R.; Bender, D.; Maller, J.; Sklar, P.; De Bakker, P.I.W.; Daly, M.J.; et al. PLINK: A tool set for whole-genome association and population-based linkage analyses. Am. J. Hum. Genet. 2007, 81, 559–575. [Google Scholar] [CrossRef]
- Peakall, R.; Smouse, P.E. GenAlEx 6.5: Genetic analysis in Excel. Population genetic software for teaching and research--an update. Bioinformatics 2012, 28, 2537–2539. [Google Scholar] [CrossRef]
- IBM Corp. IBM SPSS Statistics for Windows; IBM: Armonk, NY, USA, 2015. [Google Scholar]
- Chang, J.Y.; Park, J.H.; Park, S.E.; Shon, J.; Park, Y.J. The Fat Mass- and Obesity-Associated (FTO) Gene to Obesity: Lessons from Mouse Models. Obesity 2018, 26, 1674–1686. [Google Scholar] [CrossRef] [PubMed]
- Chauhdary, Z.; Rehman, K.; Akash, M.S.H. The composite alliance of FTO locus with obesity-related genetic variants. Clin. Exp. Pharmacol. Physiol. 2021, 48, 954–965. [Google Scholar] [CrossRef] [PubMed]
- Littleton, S.H.; Berkowitz, R.I.; Grant, S.F.A. Genetic Determinants of Childhood Obesity. Mol. Diagn. Ther. 2020, 24, 653–663. [Google Scholar] [CrossRef] [PubMed]
- Doaei, S.; Mosavi Jarrahi, S.A.; Sanjari Moghadam, A.; Akbari, M.E.; Javadi Kooshesh, S.; Badeli, M.; Azizi Tabesh, G.; Abbas Torki, S.; Gholamalizadeh, M.; Zhu, Z.H.; et al. The effect of rs9930506 FTO gene polymorphism on obesity risk: A meta-analysis. Biomol. Concepts 2020, 10, 237–242. [Google Scholar] [CrossRef]
- Younus, L.A.; Algenabi, A.H.A.; Abdul-Zhara, M.S.; Hussein, M.K. FTO gene polymorphisms (rs9939609 and rs17817449) as predictors of Type 2 Diabetes Mellitus in obese Iraqi population. Gene 2017, 627, 79–84. [Google Scholar] [CrossRef]
- Hosseini-Esfahani, F.; Koochakpoor, G.; Mirmiran, P.; Daneshpour, M.S.; Azizi, F. Dietary patterns modify the association between fat mass and obesity-associated genetic variants and changes in obesity phenotypes. Br. J. Nutr. 2019, 121, 1247–1254. [Google Scholar] [CrossRef] [PubMed]
- Chen, B.; Li, Z.; Chen, J.; Ji, J.; Shen, J.; Xu, Y.; Zhao, Y.; Liu, D.; Shen, Y.; Zhang, W.; et al. Association of fat mass and obesity-associated and retinitis pigmentosa guanosine triphosphatase (GTpase) regulator-interacting protein-1 like polymorphisms with body mass index in Chinese women. Endocr. J. 2018, 65, 783–791. [Google Scholar] [CrossRef]
- Inandiklioğlu, N.; Yaşar, A. Association between rs1421085 and rs9939609 Polymorphisms of Fat Mass and Obesity-Associated Gene with High-Density Lipoprotein Cholesterol and Triglyceride in Obese Turkish Children and Adolescents. J. Pediatr. Genet. 2021, 10, 009–015. [Google Scholar] [CrossRef]
- Sedaghati-khayat, B.; Barzin, M.; Akbarzadeh, M.; Guity, K.; Fallah, M.S.; Pourhassan, H.; Azizi, F.; Daneshpour, M.S. Lack of association between FTO gene variations and metabolic healthy obese (MHO) phenotype: Tehran Cardio-metabolic Genetic Study (TCGS). Eat. Weight Disord. 2020, 25, 25–35. [Google Scholar] [CrossRef]
- Liaw, Y.C.; Liaw, Y.P.; Lan, T.H. Physical activity might reduce the adverse impacts of the FTO gene variant rs3751812 on the body mass index of adults in Taiwan. Genes 2019, 10, 354. [Google Scholar] [CrossRef]
- Goutzelas, Y.; Kotsa, K.; Vasilopoulos, Y.; Tsekmekidou, X.; Stamatis, C.; Yovos, J.G.; Sarafidou, T.; Mamuris, Z. Association analysis of FTO gene polymorphisms with obesity in Greek adults. Gene 2017, 613, 10–13. [Google Scholar] [CrossRef] [PubMed]
- Czajkowski, P.; Adamska-Patruno, E.; Bauer, W.; Krasowska, U.; Fiedorczuk, J.; Moroz, M.; Gorska, M.; Kretowski, A. Dietary fiber intake may influence the impact of FTO genetic variants on obesity parameters and lipid profile—A cohort study of a caucasian population of Polish origin. Antioxidants 2021, 10, 1793. [Google Scholar] [CrossRef] [PubMed]
- Ruiz-Narváez, E.A.; Haddad, S.A.; Rosenberg, L.; Palmer, J.R. Birth weight modifies the association between central nervous system gene variation and adult body mass index. J. Hum. Genet. 2016, 61, 193–198. [Google Scholar] [CrossRef] [PubMed]
- Monda, K.L.; Chen, G.K.; Taylor, K.C.; Palmer, C.; Edwards, T.L.; Lange, L.A.; Ng, M.C.Y.; Adeyemo, A.A.; Allison, M.A.; Bielak, L.F.; et al. A meta-analysis identifies new loci associated with body mass index in individuals of African ancestry. Nat. Genet. 2013, 45, 690–696. [Google Scholar] [CrossRef] [PubMed]
- Tan, L.J.; Zhu, H.; He, H.; Wu, K.H.; Li, J.; Chen, X.D.; Zhang, J.G.; Shen, H.; Tian, Q.; Krousel-Wood, M.; et al. Replication of 6 obesity genes in a meta-analysis of genome-wide association studies from diverse ancestries. PLoS ONE 2014, 9, e96149. [Google Scholar] [CrossRef]
- Paternoster, L.; Evans, D.M.; Aagaard Nohr, E.; Holst, C.; Gaborieau, V.; Brennan, P.; Prior Gjesing, A.; Grarup, N.; Witte, D.R.; Jørgensen, T.; et al. Genome-wide population-based association study of extremely overweight young adults-the GOYA study. PLoS ONE 2011, 6, e24303. [Google Scholar] [CrossRef]
- López-Rodríguez, G.; Estrada-Neria, A.; Suárez-Diéguez, T.; Tejero, M.E.; Fernández, J.C.; Galván, M. Common polymorphisms in MC4R and FTO genes are associated with BMI and metabolic indicators in Mexican children: Differences by sex and genetic ancestry. Gene 2020, 754, 144840. [Google Scholar] [CrossRef]
- León-Mimila, P.; Villamil-Ramírez, H.; Villalobos-Comparán, M.; Villarreal-Molina, T.; Romero-Hidalgo, S.; López-Contreras, B.; Gutiérrez-Vidal, R.; Vega-Badillo, J.; Jacobo-Albavera, L.; Posadas-Romeros, C.; et al. Contribution of Common Genetic Variants to Obesity and Obesity-Related Traits in Mexican Children and Adults. PLoS ONE 2013, 8, e70640. [Google Scholar] [CrossRef]
- Ortega, P.E.N.; Meneses, M.E.; Delgado-Enciso, I.; Irecta-Nájera, C.A.; Castro-Quezada, I.; Solís-Hernández, R.; Flores-Guillén, E.; García-Miranda, R.; Valladares-Salgado, A.; Locia-Morales, D.; et al. Association of rs9939609-FTO with metabolic syndrome components among women from Mayan communities of Chiapas, Mexico. J. Physiol. Anthropol. 2021, 40, 11. [Google Scholar] [CrossRef]


| Men (307) | Women (329) | Total | ||||
|---|---|---|---|---|---|---|
| Mean | S.D. | Mean | S.D. | Mean | S.D. | |
| Age (years) | 19.58 | 3.46 | 19.12 | 1.94 | 19.34 | 2.78 |
| Weight (Kg) | 70.75 | 13.15 | 59.55 | 11.88 | 1.653 | 8.95 |
| Height (m) | 1.715 | 7.03 | 1.595 | 6.24 | 64.95 | 13.7 |
| Waist circumference (cm) | 84.03 | 11.46 | 77.88 | 11.53 | 80.85 | 11.89 |
| BMI(Kg/m2) | 24.03 | 4.09 | 23.41 | 4.38 | 23.71 | 4.25 |
| Body fat (%) | 21.13 | 7.94 | 31.21 | 7.31 | 26.35 | 9.13 |
| Energy intake (Kcal) | 2584.6 | 952.97 | 2227.6 | 815.60 | 2406.1 | 902.51 |
| Glucose (mg/dL) | 85.03 | 8.97 | 82.44 | 9.16 | 83.68 | 9.16 |
| Insulin (mg/dL) | 7.71 | 5.12 | 7.92 | 6.03 | 7.82 | 5.62 |
| HOMA-Index | 1.62 | 1.14 | 1.61 | 1.23 | 1.62 | 1.94 |
| Triglycerides (mg/dL) | 114.34 | 72.45 | 96.67 | 9.16 | 105.14 | 63.79 |
| Total cholesterol (mg/dL) | 157.57 | 32.65 | 157.88 | 27.76 | 157.74 | 30.17 |
| LDL (mg/dL) | 86.62 | 24.96 | 85.41 | 22.66 | 85.79 | 23.78 |
| HLD (mg/dL) | 48.053 | 11.02 | 53.27 | 13.28 | 50.76 | 12.51 |
| Clinical Marker | SNP | Model | OR | CI95% | p-Value | Effect | |
|---|---|---|---|---|---|---|---|
| Hight waist circumference (cm) | rs17817964 | CC + CT | 2.387 | 1.056 | 5.394 | 0.037 | Risk |
| TT * | |||||||
| rs6499662 | AA + AG | 2.412 | 1.051 | 5.537 | 0.038 | Risk | |
| GG * | |||||||
| BMI > 25 Kg/m2 | rs8043785 | AA + AG | 1.863 | 1.078 | 3.219 | 0.026 | Risk |
| GG * | |||||||
| rs35510800 | GG + GA | 1.920 | 1.070 | 3.444 | 0.029 | Risk | |
| AA * | |||||||
| rs6499662 | AA + AG | 2.514 | 1.101 | 5.737 | 0.029 | Risk | |
| GG * | |||||||
| rs12931859 | CC + CT | 1.644 | 1.057 | 2.559 | 0.028 | Risk | |
| TT * | |||||||
| rs17219983 | CC + CT | 0.477 | 0.231 | 0.986 | 0.046 | Protective | |
| TT * | |||||||
| rs1966435 | TT + TC | 0.641 | 0.418 | 0.981 | 0.041 | Protective | |
| CC * | |||||||
| rs12051261 | CC + CT | 0.475 | 0.246 | 0.917 | 0.026 | Protective | |
| TT * | |||||||
| BMI > 30 Kg/m2 | rs16945088 | AA + AG | 3.535 | 1.253 | 9.974 | 0.017 | Risk |
| GG * | |||||||
| rs17817449 | TT + TG | 2.414 | 1.154 | 5.050 | 0.019 | Risk | |
| GG * | |||||||
| rs8043757 | AA + AT | 2.167 | 1.042 | 4.505 | 0.038 | Risk | |
| TT * | |||||||
| rs12931859 | CC + CT | 2.181 | 1.104 | 4.310 | 0.025 | Risk | |
| TT * | |||||||
| rs7194243 | CC + CT | 1.960 | 1.062 | 3.618 | 0.031 | Risk | |
| TT * | |||||||
| Hight body fat (%) | rs4389136 | AA + AG | 1.616 | 1.098 | 2.38 | 0.015 | Risk |
| GG * | |||||||
| rs8043785 | AA + AG | 1.902 | 1.091 | 3.317 | 0.023 | Risk | |
| GG * | |||||||
| rs12232391 | TT + TG | 1.436 | 1.006 | 2.050 | 0.046 | Risk | |
| GG * | |||||||
| rs7194243 | CC + CT | 1.518 | 1.054 | 2.186 | 0.025 | Risk | |
| TT * | |||||||
| rs2111650 | TT + TC | 0.307 | 0.095 | 0.992 | 0.048 | Protective | |
| CC * | |||||||
| rs1966435 | TT + TC | 0.635 | 0.431 | 0.936 | 0.022 | Protective | |
| CC * | |||||||
| rs12051261 | CC + CT | 0.534 | 0.306 | 0.932 | 0.027 | Protective | |
| TT * | |||||||
| Hight triglycerides (mg/dL) | rs3751813 | GG + GT | 0.477 | 0.238 | 0.957 | 0.037 | Protective |
| TT * | |||||||
| Energy intake > 2400 Kcal | rs9939973 | GG + GA | 1.866 | 1.000 | 3.484 | 0.050 | Risk |
| AA * | |||||||
| rs9940128 | GG + GA | 1.866 | 1.000 | 3.484 | 0.050 | Risk | |
| AA * | |||||||
| rs1421085 | TT + TC | 1.966 | 1.005 | 3.842 | 0.048 | Risk | |
| CC * | |||||||
| rs3751812 | GG + GT | 2.772 | 1.112 | 6.912 | 0.029 | Risk | |
| TT * | |||||||
| rs9936385 | TT + TC | 2.738 | 1.160 | 6.462 | 0.022 | Risk | |
| CC * | |||||||
| rs11075990 | AA + AG | 2.738 | 1.160 | 6.462 | 0.022 | Risk | |
| GG * | |||||||
| rs9939609 | TT + TA | 2.738 | 1.160 | 6.462 | 0.022 | Risk | |
| AA * | |||||||
| rs7206629 | TT + TC | 1.866 | 0.999 | 3.482 | 0.050 | Risk | |
| CC * | |||||||
| rs7202116 | AA + AG | 2.738 | 1.160 | 6.462 | 0.022 | Risk | |
| GG * | |||||||
| rs7185735 | AA + AG | 2.738 | 1.160 | 6.462 | 0.022 | Risk | |
| GG * | |||||||
| rs9941349 | CC + CT | 2.213 | 1.121 | 4.366 | 0.022 | Risk | |
| TT * | |||||||
| rs17817964 | CC + CT | 2.560 | 1.018 | 6.439 | 0.046 | Risk | |
| TT * | |||||||
| rs9922619 | GG + GT | 2.102 | 1.086 | 4.072 | 0.028 | Risk | |
| TT * | |||||||
| rs12149832 | GG + GA | 2.427 | 1.022 | 5.765 | 0.045 | Risk | |
| AA * | |||||||
| rs11642841 | CC + CA | 3.330 | 1.185 | 9.363 | 0.023 | Risk | |
| AA * | |||||||
| rs9929152 | GG + GA | 1.444 | 1.019 | 2.048 | 0.039 | Risk | |
| AA * | |||||||
| rs1075440 | GG + GA | 0.631 | 0.404 | 0.984 | 0.042 | Protective | |
| AA * | |||||||
| rs7191566 | AA + AG | 0.243 | 0.067 | 0.879 | 0.031 | Protective | |
| GG * | |||||||
| Clinical Marker | SNP | Model | OR | CI95% | p-Value | Effect | |
|---|---|---|---|---|---|---|---|
| Hight body fat (%) | rs1421091 | AA | 1.683 | 1.158 | 2.444 | 0.006 | Risk |
| CC + AC * | |||||||
| rs4389136 | AA | 1.616 | 1.125 | 2.321 | 0.009 | Protective | |
| GG + AG * | |||||||
| rs12232391 | TT | 1.579 | 1.071 | 2.327 | 0.021 | Risk | |
| GG + TG * | |||||||
| rs7200972 | GG | 2.094 | 1.256 | 3.491 | 0.005 | Risk | |
| AA + GA * | |||||||
| rs12931859 | CC | 1.426 | 1.022 | 1.991 | 0.037 | Risk | |
| TT + CT * | |||||||
| rs7194243 | CC | 1.486 | 1.037 | 2.128 | 0.031 | Risk | |
| TT + CT * | |||||||
| rs7205986 | AA | 0.672 | 0.479 | 0.943 | 0.021 | Protective | |
| GG + AG * | |||||||
| rs7203521 | GG | 0.698 | 0.506 | 0.963 | 0.028 | Protective | |
| AA + GA * | |||||||
| rs6499640 | GG | 0.698 | 0.506 | 0.963 | 0.028 | Protective | |
| AA + GA * | |||||||
| rs2111650 | TT | 0.655 | 0.448 | 0.958 | 0.029 | Protective | |
| CC + TC * | |||||||
| rs17819033 | GG | 0.576 | 0.389 | 0.853 | 0.006 | Protective | |
| TT + GT * | |||||||
| rs17219983 | CC | 0.615 | 0.445 | 0.849 | 0.003 | Protective | |
| TT + CT * | |||||||
| rs9934504 | GG | 0.560 | 0.359 | 0.873 | 0.011 | Protective | |
| AA + GA * | |||||||
| rs56335873 | TT | 0.590 | 0.379 | 0.917 | 0.019 | Protective | |
| AA + TA * | |||||||
| rs12933996 | GG | 0.681 | 0.473 | 0.980 | 0.038 | Protective | |
| AA + GA * | |||||||
| rs35090620 | TT | 0.603 | 0.422 | 0.861 | 0.005 | Protective | |
| CC + TC * | |||||||
| rs16952686 | AA | 0.466 | 0.236 | 0.921 | 0.028 | Protective | |
| GG + AG * | |||||||
| Hight waist circumference (cm) | rs9934504 | GG | 0.590 | 0.357 | 0.975 | 0.040 | Protective |
| AA + GA * | |||||||
| Energy intake > 2400 Kcal | rs35510800 | GG | 1.530 | 1.099 | 2.130 | 0.012 | Risk |
| AA + GA * | |||||||
| rs71392011 | CC | 4.114 | 1.120 | 15.104 | 0.033 | Risk | |
| AA + CA * | |||||||
| rs74018195 | TT | 0.113 | 0.014 | 0.916 | 0.041 | Protective | |
| CC + TC * | |||||||
| rs74449711 | TT | 0.080 | 0.010 | 0.631 | 0.017 | Protective | |
| GG + TG * | |||||||
| rs7191566 | AA | 0.693 | 0.486 | 0.988 | 0.042 | Protective | |
| GG + AG * | |||||||
| rs17820328 | AA | 0.414 | 0.176 | 0.971 | 0.043 | Protective | |
| GG + AG * | |||||||
| rs16952657 | CC | 0.587 | 0.349 | 0.987 | 0.045 | Protective | |
| TT + CT * | |||||||
| BMI > 25 Kg/m2 | rs9934504 | GG | 0.577 | 0.352 | 0.947 | 0.030 | Protective |
| AA + GA * | |||||||
| rs12933996 | GG | 0.686 | 0.472 | 0.999 | 0.049 | Protective | |
| AA + GA * | |||||||
| rs16952686 | AA | 0.379 | 0.164 | 0.875 | 0.023 | Protective | |
| GG + AG * | |||||||
| rs1966435 | TT | 0.685 | 0.481 | 0.975 | 0.036 | Protective | |
| CC + CT * | |||||||
| BMI > 30 Kg/m2 | rs10852523 | TT | 2.998 | 1.420 | 6.328 | 0.004 | Risk |
| CC + CT * | |||||||
| rs61743972 | GG | 2.395 | 1.051 | 5.458 | 0.038 | Risk | |
| CC + GC * | |||||||
| rs3826169 | GG | 4.459 | 1.062 | 18.725 | 0.041 | Risk | |
| AA + GA * | |||||||
| rs7203572 | AA | 1.898 | 1.042 | 3.456 | 0.036 | Risk | |
| CC + AC * | |||||||
| Hight triglycerides (mg/dL) | rs4389136 | AA | 1.692 | 1.033 | 2.770 | 0.037 | Risk |
| GG + AG * | |||||||
| Clinical Marker | SNP | Model | Mean | S.D. | p-Value |
|---|---|---|---|---|---|
| Waist circumference (cm) | rs12232391 | (TT + TG) | 80.35 | 11.9 | 0.043 |
| GG | 82.47 | 11.78 | |||
| BMI Kg/m2 | rs12232391 | (TT + TG) | 23.47 | 4.21 | 0.024 |
| GG | 24.33 | 4.41 | |||
| rs12051261 | (CC + TC) | 23.87 | 4.31 | 0.012 | |
| TT | 22.42 | 3.86 | |||
| Body fat (%) | rs9939973 | (GG + GA) | 26.19 | 9.26 | 0.027 |
| AA | 28.79 | 7.46 | |||
| rs9940128 | (GG + GA) | 26.19 | 9.26 | 0.027 | |
| AA | 28.79 | 7.46 | |||
| rs1421085 | (TT + TC) | 26.18 | 9.23 | 0.033 | |
| CC | 29.29 | 7.63 | |||
| rs17817449 | (TT + TG) | 26.02 | 9.14 | 0.007 | |
| GG | 29.07 | 8.87 | |||
| rs3751812 | (GG + GT) | 26.21 | 9.17 | 0.018 | |
| TT | 30.63 | 7.8 | |||
| rs9936385 | (TT + TC) | 26.22 | 9.19 | 0.038 | |
| CC | 29.9 | 7.73 | |||
| rs11075990 | (AA + AG) | 26.22 | 9.19 | 0.038 | |
| GG | 29.9 | 7.73 | |||
| rs9939609 | (TT+ TA) | 26.22 | 9.19 | 0.038 | |
| AA | 29.9 | 7.73 | |||
| rs7206629 | (TT + TC) | 26.17 | 9.26 | 0.040 | |
| CC | 28.99 | 7.5 | |||
| rs7202116 | (AA + AG) | 26.22 | 9.19 | 0.038 | |
| GG | 29.9 | 7.73 | |||
| rs7185735 | (AA + AG) | 26.22 | 9.19 | 0.038 | |
| GG | 29.9 | 7.73 | |||
| rs9941349 | (CC + CT) | 26.19 | 9.23 | 0.044 | |
| TT | 29.13 | 7.72 | |||
| rs17817964 | (CC + CT) | 26.23 | 9.18 | 0.031 | |
| TT | 30.34 | 7.84 | |||
| rs12051261 | (CC + TC) | 26.73 | 9.17 | 0.006 | |
| TT | 23.33 | 8.56 |
| Clinical Marker | SNP | Model | Mean | S.D. | p-Value |
|---|---|---|---|---|---|
| Waist circumference (cm) | rs1421091 | AA | 79.50 | 10.45 | 0.049 |
| (AC + CC) | 81.46 | 12.33 | |||
| rs4389136 | AA | 79.53 | 10.41 | 0.042 | |
| (AG + GG) | 81.51 | 12.40 | |||
| rs16952686 | AA | 81.215 | 12.0515 | 0.011 | |
| (AG + GG) | 77.368 | 8.8911 | |||
| BMI Kg/m2 | rs9934504 | GG | 23.90 | 4.34 | 0.022 |
| (GA + AA) | 22.84 | 3.90 | |||
| rs56335873 | TT | 23.87 | 4.34 | 0.046 | |
| (TA + AA) | 22.95 | 3.94 | |||
| rs12232391 | TT | 22.99 | 3.77 | 0.021 | |
| (TG + GG) | 23.93 | 4.40 | |||
| rs16952686 | AA | 23.818 | 4.3441 | 0.011 | |
| (AG + GG) | 22.438 | 3.1919 | |||
| Body fat (%) | rs7191566 | AA | 27.04 | 9.22 | 0.013 |
| (AG + GG) | 25.09 | 8.92 | |||
| rs1421085 | TT | 25.82 | 9.12 | 0.040 | |
| (TC + CC) | 27.40 | 9.16 | |||
| rs3751812 | GG | 25.82 | 9.13 | 0.031 | |
| (GT + TT) | 27.50 | 9.13 | |||
| rs17817964 | CC | 25.86 | 9.11 | 0.048 | |
| (CT + TT) | 27.41 | 9.19 | |||
| rs2111650 | TT | 26.95 | 9.10 | 0.007 | |
| (CT + CC) | 24.64 | 9.14 | |||
| rs11642841 | CC | 25.86 | 9.09 | 0.042 | |
| (CA + AA) | 27.46 | 9.22 | |||
| rs9934504 | GG | 26.80 | 9.21 | 0.013 | |
| (GA + AA) | 24.32 | 8.64 | |||
| rs56335873 | TT | 26.76 | 9.22 | 0.023 | |
| (TA + AA) | 24.49 | 8.62 | |||
| rs12232391 | TT | 24.73 | 8.92 | 0.015 | |
| (TG + GG) | 26.88 | 9.18 | |||
| rs7200972 | GG | 24.3212 | 8.87798 | 0.036 | |
| (GA + AA) | 26.6877 | 9.17234 | |||
| Triglycerides (mg/dL) | rs17817449 | TT | 107.58 | 70.10 | 0.028 |
| (TG + GG) | 96.43 | 52.05 | |||
| rs8043757 | AA | 107.68 | 70.17 | 0.025 | |
| (AT + TT) | 96.30 | 51.96 | |||
| rs9936385 | TT | 107.67 | 70.17 | 0.025 | |
| (TC + CC) | 96.31 | 51.96 | |||
| rs11075990 | AA | 107.67 | 70.17 | 0.025 | |
| (AG + GG) | 96.31 | 51.96 | |||
| rs9939609 | TT | 107.67 | 70.17 | 0.025 | |
| (TA + AA) | 96.31 | 51.96 | |||
| rs7202116 | AA | 107.67 | 70.17 | 0.025 | |
| (AG + GG) | 96.31 | 51.96 | |||
| rs7185735 | AA | 107.67 | 70.17 | 0.025 | |
| (AG + GG) | 96.31 | 51.96 | |||
| Energy intake (Kcal/day) | rs74449711 | TT | 2518.26 | 906.91 | 0.001 |
| (TG + GG) | 1731.67 | 404.54 | |||
| rs16952657 | CC | 2534.22 | 914.66 | 0.020 | |
| (CT + TT) | 2265.71 | 808.14 | |||
| rs35510800 | GG | 2430.1252 | 891.44287 | 0.049 | |
| (GA + AA) | 2577.7083 | 916.83851 |
| Clinical Marker | SNP | Genotype | Mean | S.D. | p-Value | p. adj |
|---|---|---|---|---|---|---|
| Waist circumference (cm) | rs12232391 | TT | 79.32 | 11.76 | 0.058 | 0.052 |
| TG | 80.84 | 11.96 | ||||
| GG | 82.47 | 11.78 | ||||
| rs17817449 | TT | 81.51 | 11.94 | 0.042 | 0.061 | |
| TG | 78.89 | 10.54 | ||||
| GG | 82.2 | 13.74 | ||||
| BMI (Kg/m2) | rs17817449 | TT | 23.82 | 4.33 | 0.04 | 0.047 |
| TG | 23.07 | 3.95 | ||||
| GG | 24.52 | 4.54 | ||||
| rs12232391 | TT | 22.99 | 3.77 | 0.021 | 0.016 | |
| TG | 23.7 | 4.39 | ||||
| GG | 24.33 | 4.41 | ||||
| Body fat (%) | rs7191566 | AA | 27.04 | 9.22 | 0.027 | 0.089 |
| AG | 25.29 | 8.96 | ||||
| GG | 22.82 | 8.36 | ||||
| rs1421085 | TT | 25.82 | 9.12 | 0.04 | 0.059 | |
| TC | 26.96 | 9.45 | ||||
| CC | 29.29 | 7.63 | ||||
| rs17817449 | TT | 26.12 | 9.08 | 0.026 | 0.033 | |
| TG | 25.78 | 9.32 | ||||
| GG | 29.07 | 8.87 | ||||
| rs3751812 | GG | 25.82 | 9.13 | 0.019 | 0.032 | |
| GT | 27.08 | 9.24 | ||||
| TT | 30.63 | 7.8 | ||||
| rs17817964 | CC | 25.86 | 9.11 | 0.035 | 0.059 | |
| CT | 27.02 | 9.3 | ||||
| TT | 30.34 | 7.84 | ||||
| rs2111650 | TT | 26.95 | 9.1 | 0.027 | 0.041 | |
| TC | 24.73 | 9.32 | ||||
| CC | 23.95 | 7.61 | ||||
| rs12232391 | TT | 24.73 | 8.92 | 0.027 | 0.022 | |
| TG | 26.5 | 9.28 | ||||
| GG | 27.52 | 8.99 | ||||
| Energy intake (Kcal/Day) | rs9936385 | TT | 2530.51 | 886.2 | 0.044 | 0.067 |
| TC | 2399.05 | 897.45 | ||||
| CC | 2831.74 | 1154.44 | ||||
| rs11075990 | AA | 2350.51 | 886.2 | 0.044 | 0.067 | |
| AG | 2399.05 | 897.45 | ||||
| GG | 2831.74 | 1154.44 | ||||
| rs9939609 | TT | 2530.51 | 886.2 | 0.044 | 0.067 | |
| TA | 2399.05 | 897.45 | ||||
| AA | 2831.74 | 1154.44 | ||||
| rs7202116 | AA | 2530.51 | 886.2 | 0.044 | 0.067 | |
| AG | 2399.05 | 897.45 | ||||
| GG | 2831.74 | 1154.44 | ||||
| rs7185735 | AA | 2530.51 | 886.2 | 0.044 | 0.067 | |
| AG | 2399.05 | 897.45 | ||||
| GG | 2831.74 | 1154.44 |
Disclaimer/Publisher’s Note: The statements, opinions and data contained in all publications are solely those of the individual author(s) and contributor(s) and not of MDPI and/or the editor(s). MDPI and/or the editor(s) disclaim responsibility for any injury to people or property resulting from any ideas, methods, instructions or products referred to in the content. |
© 2023 by the authors. Licensee MDPI, Basel, Switzerland. This article is an open access article distributed under the terms and conditions of the Creative Commons Attribution (CC BY) license (https://creativecommons.org/licenses/by/4.0/).
Share and Cite
Chama-Avilés, A.; Flores-Viveros, K.L.; Cabrera-Ayala, J.A.; Aguilar-Galarza, A.; García-Muñoz, W.; Haddad-Talancón, L.; de Lourdes Anzures-Cortés, M.; Velázquez-Sánchez, C.; Chávez-Servín, J.L.; Anaya-Loyola, M.A.; et al. Identification and Association of Single Nucleotide Polymorphisms of the FTO Gene with Indicators of Overweight and Obesity in a Young Mexican Population. Genes 2023, 14, 159. https://doi.org/10.3390/genes14010159
Chama-Avilés A, Flores-Viveros KL, Cabrera-Ayala JA, Aguilar-Galarza A, García-Muñoz W, Haddad-Talancón L, de Lourdes Anzures-Cortés M, Velázquez-Sánchez C, Chávez-Servín JL, Anaya-Loyola MA, et al. Identification and Association of Single Nucleotide Polymorphisms of the FTO Gene with Indicators of Overweight and Obesity in a Young Mexican Population. Genes. 2023; 14(1):159. https://doi.org/10.3390/genes14010159
Chicago/Turabian StyleChama-Avilés, Alonso, Karla Lucero Flores-Viveros, Jorge Alberto Cabrera-Ayala, Adriana Aguilar-Galarza, Willebaldo García-Muñoz, Lorenza Haddad-Talancón, Ma. de Lourdes Anzures-Cortés, Claudia Velázquez-Sánchez, Jorge Luis Chávez-Servín, Miriam Aracely Anaya-Loyola, and et al. 2023. "Identification and Association of Single Nucleotide Polymorphisms of the FTO Gene with Indicators of Overweight and Obesity in a Young Mexican Population" Genes 14, no. 1: 159. https://doi.org/10.3390/genes14010159
APA StyleChama-Avilés, A., Flores-Viveros, K. L., Cabrera-Ayala, J. A., Aguilar-Galarza, A., García-Muñoz, W., Haddad-Talancón, L., de Lourdes Anzures-Cortés, M., Velázquez-Sánchez, C., Chávez-Servín, J. L., Anaya-Loyola, M. A., García-Gasca, T., Rodríguez-García, V. M., & Moreno-Celis, U. (2023). Identification and Association of Single Nucleotide Polymorphisms of the FTO Gene with Indicators of Overweight and Obesity in a Young Mexican Population. Genes, 14(1), 159. https://doi.org/10.3390/genes14010159