Article

Network Meta-Analysis of Chicken Microarray Data following Avian Influenza Challenge—A Comparison of Highly and Lowly Pathogenic Strains

by
Azadeh Moradi Pirbaluty
1,
Hossein Mehrban
1,
Saeid Kadkhodaei
2,
Rudabeh Ravash
3,
Ahmad Oryan
4,
Mostafa Ghaderi-Zefrehei
5,* and
Jacqueline Smith
6,*
1
Department of Genetics and Animal Breeding, Faculty of Agriculture, Shahrekord University, Shahrekord 88186-34141, Iran
2
Agricultural Biotechnology Research Institute of Iran (ABRII), Center of Iran, Isfahan 14968-13151, Iran
3
Department of Plant Breeding and Biotechnology, Faculty of Agriculture, Shahrekord University, Shahrekord 88186-34141, Iran
4
Department of Pathology, School of Veterinary Medicine, Shiraz University, Shiraz 71557-13876, Iran
5
Department of Genetics and Animal Breeding, Faculty of Agriculture, Yasouj University, Yasouj 75918-74831, Iran
6
The Roslin Institute, University of Edinburgh, Easter Bush Campus, Midlothian EH25 9RG, UK
*
Authors to whom correspondence should be addressed.
Genes 2022, 13(3), 435; https://doi.org/10.3390/genes13030435
Submission received: 21 January 2022 / Revised: 18 February 2022 / Accepted: 24 February 2022 / Published: 26 February 2022
(This article belongs to the Section Animal Genetics and Genomics)

Abstract

:
The current bioinformatics study was undertaken to analyze the transcriptome of chicken (Gallus gallus) after influenza A virus challenge. A meta-analysis was carried out to explore the host expression response after challenge with lowly pathogenic avian influenza (LPAI) (H1N1, H2N3, H5N2, H5N3 and H9N2) and with highly pathogenic avian influenza (HPAI) H5N1 strains. To do so, ten microarray datasets obtained from the Gene Expression Omnibus (GEO) database were normalized and meta-analyzed for the LPAI and HPAI host response individually. Different undirected networks were constructed and their metrics determined e.g., degree centrality, closeness centrality, harmonic centrality, subgraph centrality and eigenvector centrality. The results showed that, based on criteria of centrality, the CMTR1, EPSTI1, RNF213, HERC4L, IFIT5 and LY96 genes were the most significant during HPAI challenge, with PARD6G, HMG20A, PEX14, RNF151 and TLK1L having the lowest values. However, for LPAI challenge, ZDHHC9, IMMP2L, COX7C, RBM18, DCTN3, and NDUFB1 genes had the largest values for aforementioned criteria, with GTF3C5, DROSHA, ATRX, RFWD2, MED23 and SEC23B genes having the lowest values. The results of this study can be used as a basis for future development of treatments/preventions of the effects of avian influenza in chicken.

1. Introduction

Global monitoring of influenza is crucial for improvements in disease management, rapid intervention and decreasing the potential impact of an influenza pandemic. Avian Influenza (AI) is caused by three types of viruses: types A, B and C. Influenza A viruses (IAVs) are potentially zoonotic viruses that can cause infection in birds and a small number of mammals [1]. Influenza A virus is the only species of the alpha influenza virus genus in the Orthomyxoviridae family. Most human influenza pandemics of the 20th century were caused by IAVs that originated, either wholly or in part, from avian influenza A viruses [2]. The virus can be transmitted from wild birds to native poultry, which provides the opportunity for a zoonotic influenza epidemic [3], and can significantly affect the evolution of influenza viruses that circulate within human populations [4].
All strains of influenza A subtypes have been isolated from wild birds. Some isolates of influenza A virus cause severe disease in both domestic poultry and occasionally humans. The various subtypes are named according to the type of hemagglutinin and neuraminidase molecules present on the viral surface. There are 18 distinct known H antigens (H1 to H18) and 11 distinct known N antigens (N1 to N11) [5]. Based on their pathogenicity, avian influenza A subtypes can be classified into two classes: lowly pathogenic avian influenza (LPAI) and highly pathogenic avian influenza (HPAI). Lowly pathogenic avian influenza (LPAI) viruses rarely cause human infections but could contribute to future pandemic outbreaks; however, little is known about inter-species differences in the host responses to these viruses [6]. Studies are being undertaken to try and understand differences in the host response after challenge with viral strains with different propensities for evolution to high pathogenicity [7].
Human infections with the swine-origin influenza virus A (H1N1) were first detected in April 2009, and then spread rapidly across the globe. Children and young adults are particularly susceptible to the 2009 H1N1 virus infection because they have no or low immunity to the novel 2009 H1N1 strains [8,9]. The widespread and rapid distribution of the 2009 H1N1 viruses in humans raises a concern about the evolution of more virulent strains during passage in the population. One fear is that mutant forms of the 2009 H1N1 viruses may exhibit significantly increased virulence [10,11].
Highly pathogenic avian influenza (HPAI) H5N1 viruses cause severe infection in chickens at near complete mortality, but corresponding infection in ducks is typically mild or asymptomatic [12]. In particular, the Eurasian lineage of HPAI H5N1 virus causes severe disease in humans with a fatality rate of about 60% [13]. Most human influenza pandemics of the 20th century were caused by influenza A viruses (IAVs) that originated, either wholly or in part, from avian influenza A viruses [2]. Ducks and other waterfowl are reservoirs for most IAVs, including the hemagglutinin (HA) and neuraminidase (NA) subtypes that have caused previous human pandemics [14]. Despite being susceptible to infection with a wide range of IAVs, such birds often show little or no clinical signs [15,16]. In contrast, most HPAI H5N1 virus strains produce very severe disease in chickens, turkeys and quails, often causing up to 100% mortality within 2–3 days [17,18]. With their natural resistance, ducks support genetic reassortment of influenza viruses, providing a mechanism of evolution of genetically diverse IAVs including HPAI H5N1 viruses [19,20].
Naturally, viral genome mutations play a big role in the severity of viral diseases. For instance, PA-X is a newly discovered protein that is known to affect viral replication and host gene expression [21]. Loss of PA-X expression increases the viral virulence in mice, chickens, and mallard ducks, as shown in the reductions of virulence in the 1918 H1N1 pandemic virus in mice when PA-X expression was decreased [22]. Two CK10-based PA-X deficient viruses were created as subtypes of the H5N1 virus to demonstrate the ability of PA-X to reduce the severity of the H5N1 virus in mice, chickens, and ducks [23]. The influenza A virus endoribonuclease PA-X usurps RNA splicing to selectively target host RNAs for destruction. Proximity-labeling proteomics reveals that PA-X interacts with cellular RNA processing proteins, some of which are partially required for host shutoff. Thus, PA-X taps into host nuclear pre-mRNA processing mechanisms to destroy nascent mRNAs shortly after their synthesis. This mechanism sets PA-X apart from other viral host shutoff proteins that target actively translating mRNAs in the cytoplasm [24].
Enhanced surveillance needs fast, robust and cheap analytical methods to provide a thorough analysis of influenza virus strains [25]. This is where sophisticated network-based tools can prove beneficial. The theory of intricate networks plays a main role in a wide variety of disciplines [26]. In general, the mathematical discipline which underpins the study of complex networks in biology is based on graph theory, where Graph G = (V, E) with V = vertices and E = edges. The edge may have direction (digraph) or no direction (multigraph). Figure 1 delineates both directed and undirected graphs with their adjacency matrices.
Potential applications within the field of biology include the identification of drug targets and the design of effective control strategies for infectious diseases [27], to name but two. A basic premise of designing a gene network is that knowledge regarding the structure of genetic relationships enriches existing knowledge of the function of each individual gene. Supplementary Table S1 summarizes some network-based studies that have been applied in poultry transcriptomic research. However, these network-based analyses have not been utilized for studying the host response to influenza infection in chicken. Gene network analysis goes beyond knowledge of single gene effects and shows relational interaction of numerous genes. This is therefore an effective way to construct gene modules to gain a deeper understating of the biological pathways and networks underpinning response to disease. In this study, for the first time, we use indirect graph analyses to look at the biological effects of influenza infection in chickens and identify the core genes involved in transcriptional change. We believe it is vital to understand the path and pace of the virus which culminates in the identified host–virus interactions, with a view to formulating decisions regarding mitigation strategies, virus containment, antiviral therapy and vaccination.

2. Materials and Methods

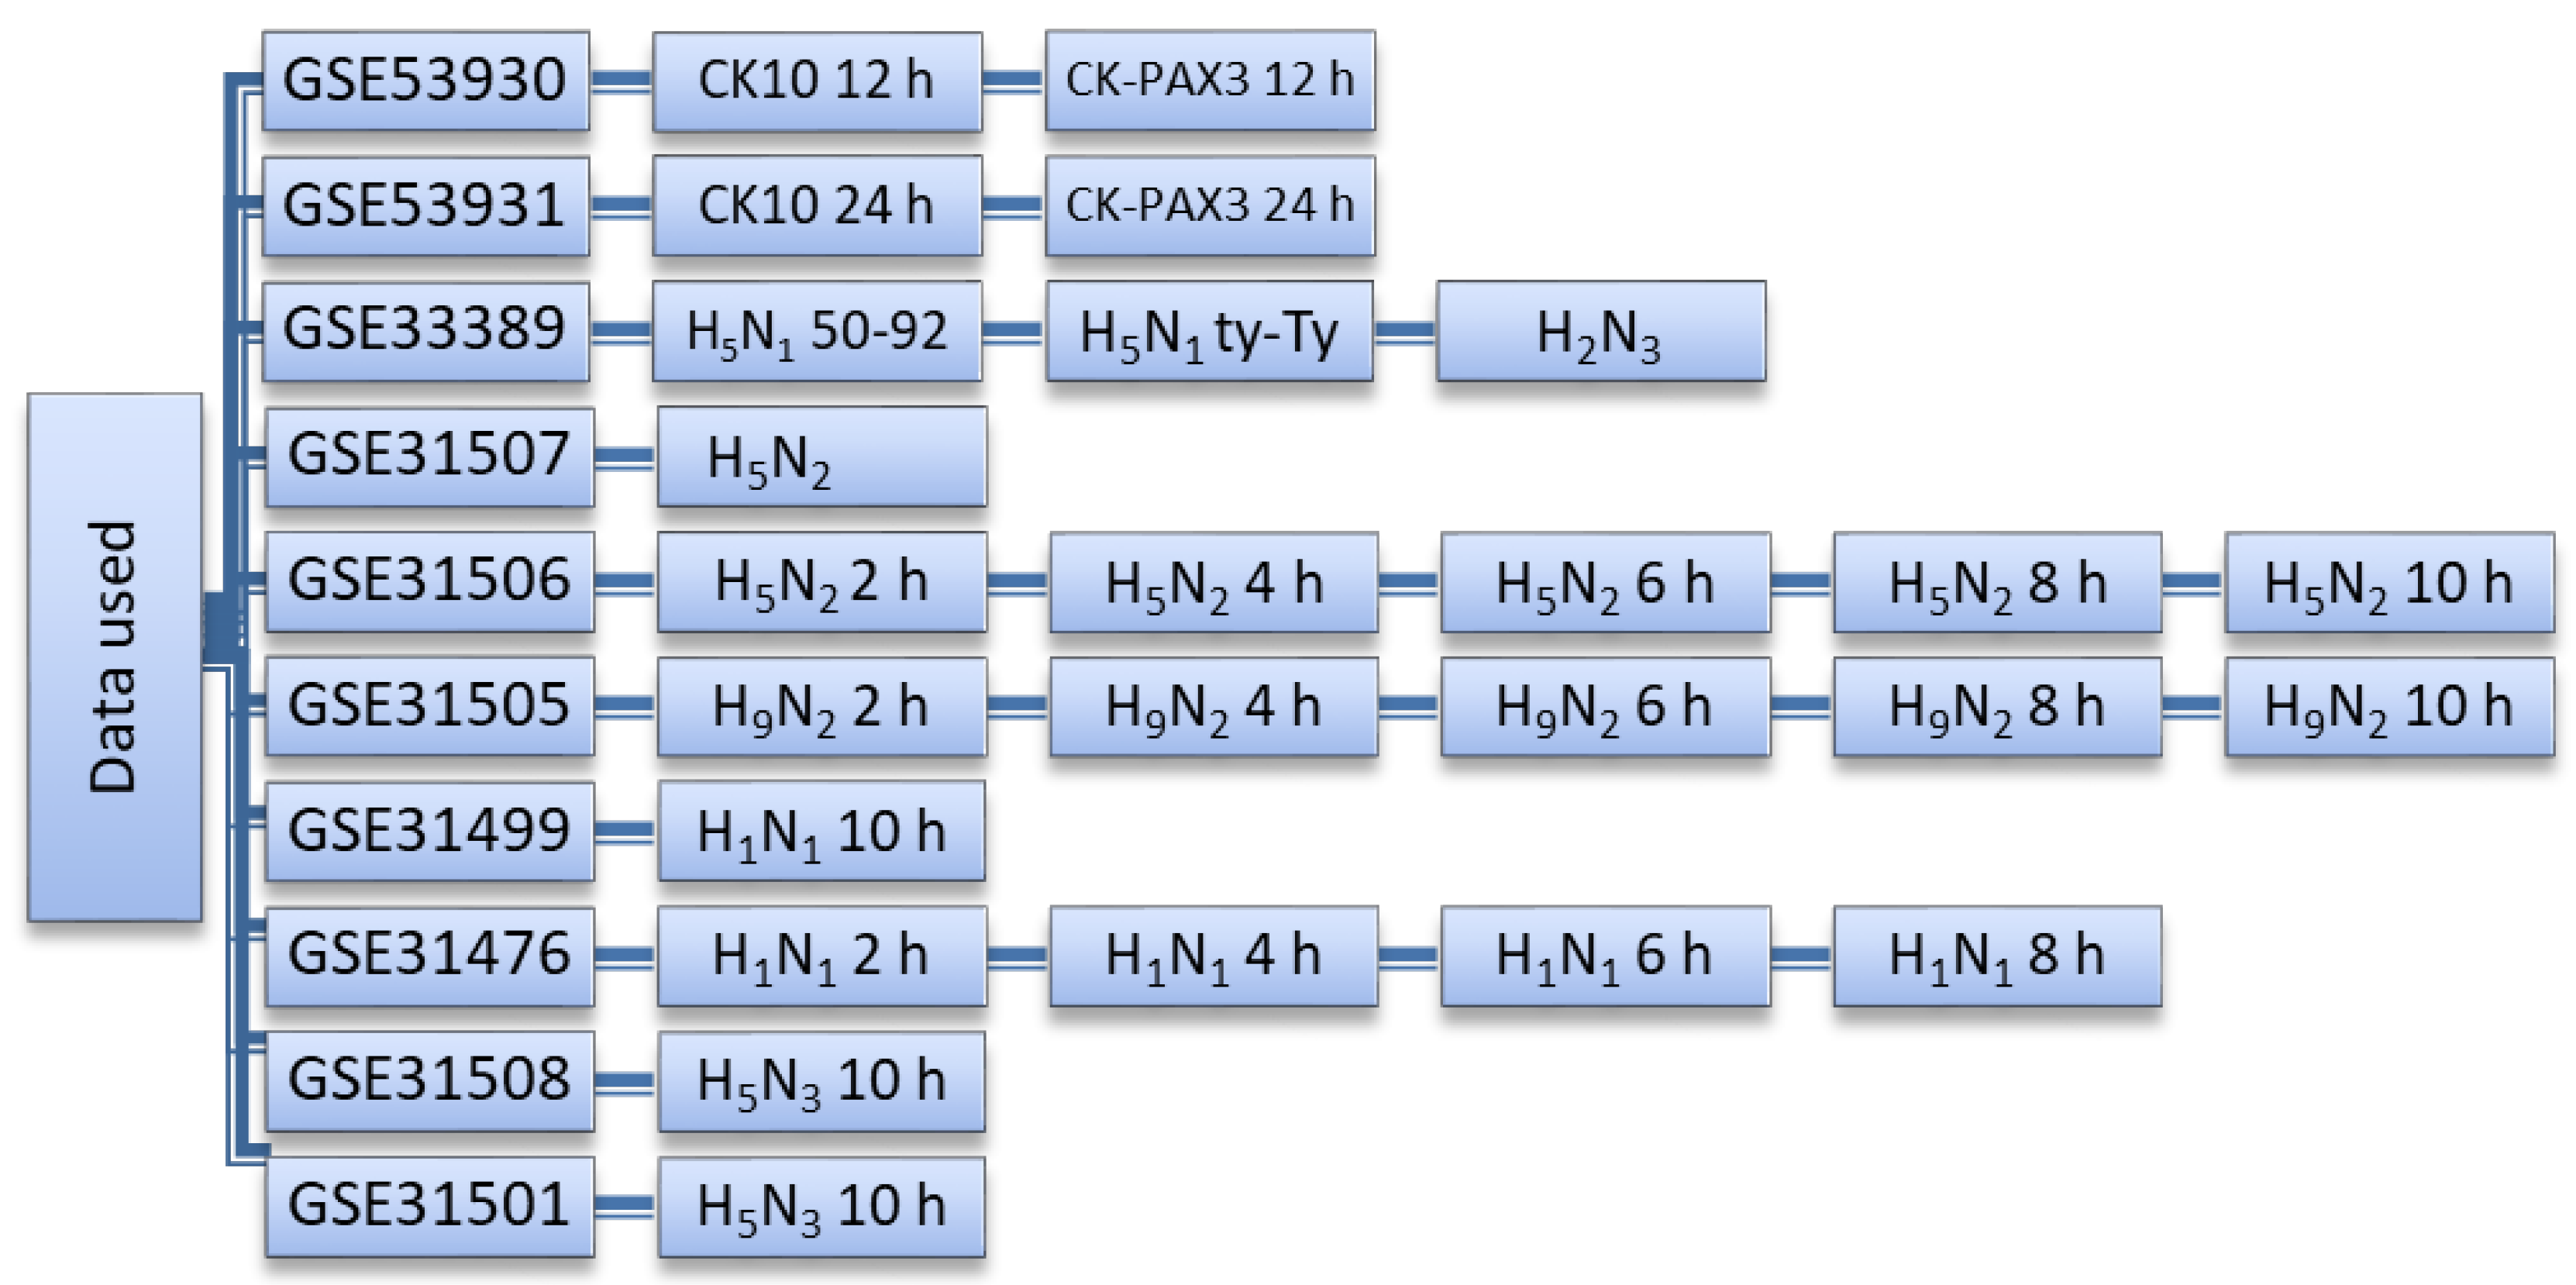
2.1. Datasets Used in This Study

Microarray expression profiles from chicken after influenza challenge were downloaded from the Gene Expression Omnibus (GEO) database (http://www.ncbi.nlm.nih.gov/geo (accessed on 22 October 2018). Data relating to LPAI studies included challenge with H2N3, H5N3, H9N2, H5N2 and H1N1 strains and data relating to HPAI involved H5N1 challenge. Each dataset consisted of infected and control groups. For HPAI, 24 samples were examined (consisting of 16 infected and 8 control samples) and for LPAI, 76 samples (consisting of 56 infected and 20 controls) were studied (Figure 2).

2.2. Normalization of Microarray Data

Figure 3 shows the bioinformatics pipeline used in this study. The CEL files from each dataset were normalized using the RMA normalization method in the Affymetrix Expression console software package (version: 1.1). RMA is a normalization algorithm for microarray data, correcting background, normalizing and summarizing the probe level information without the use of the information from the Mis-Match probe. Correct normalization is an absolute prerequisite for accurate evaluation of gene expression [28].

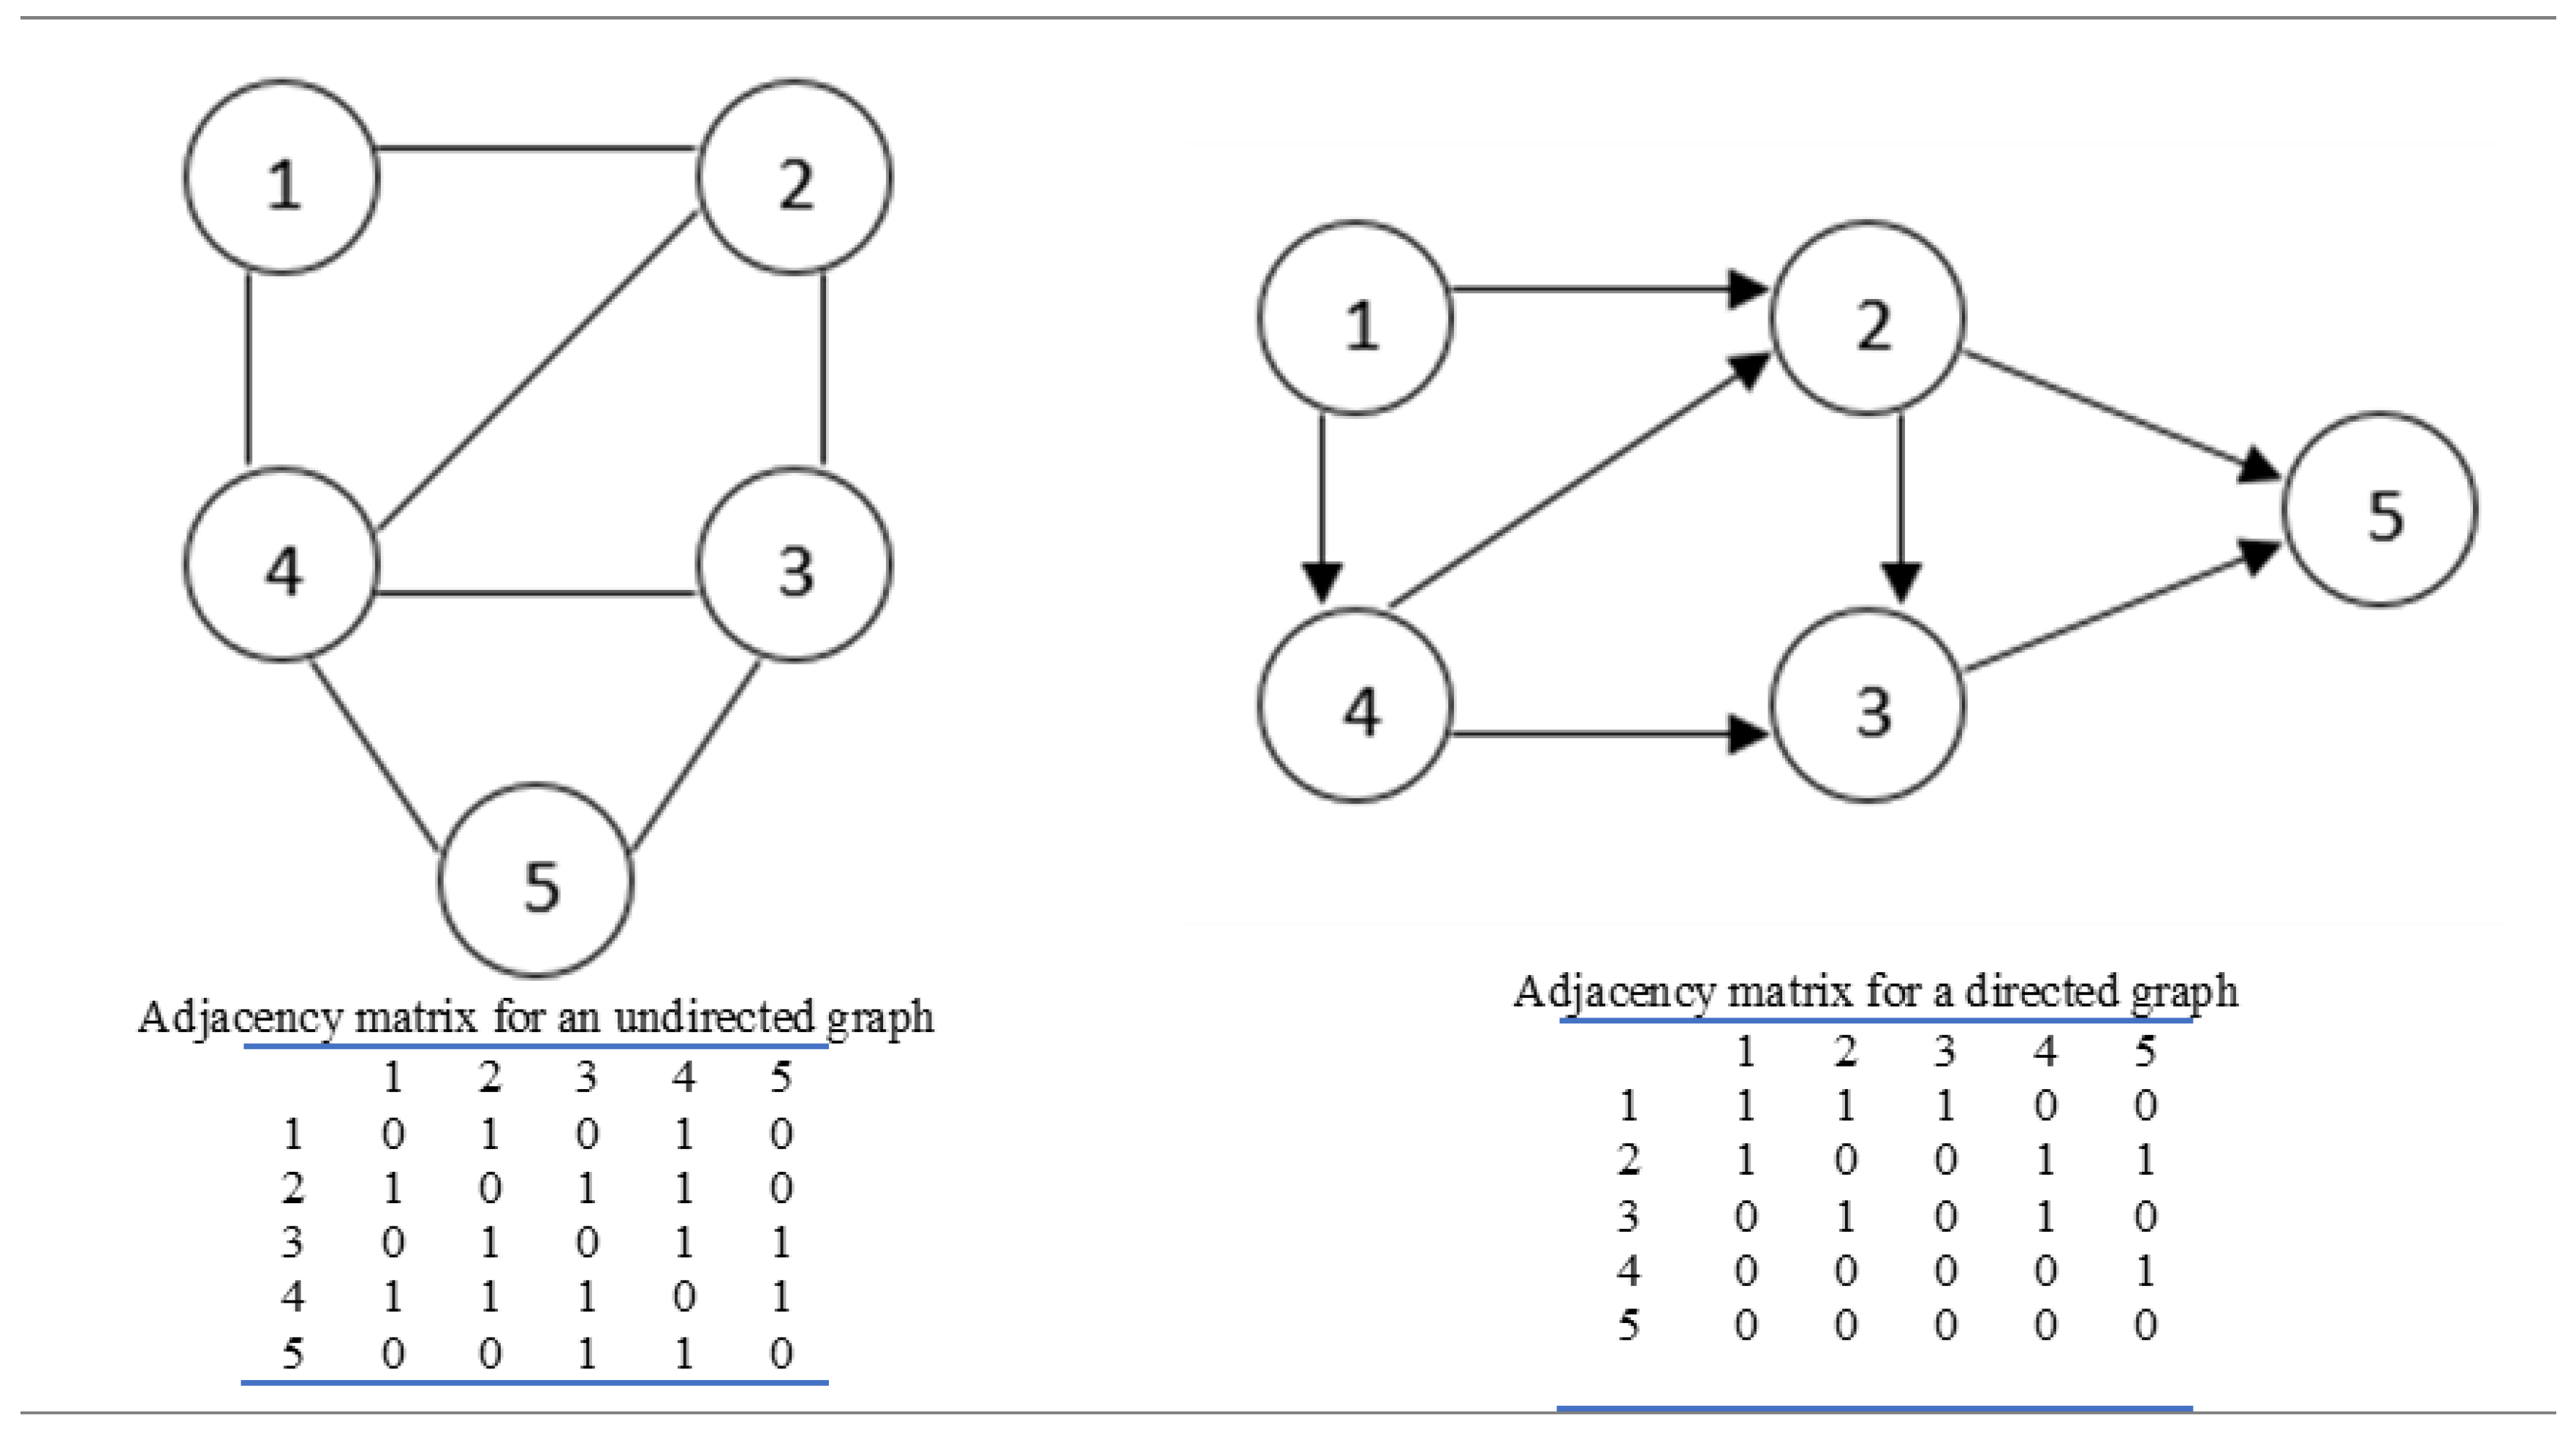
2.3. Network Construction

We used the rank product meta-analysis algorithm on normalized microarray data from the various avian influenza challenge experiments shown in Figure 2. The rank product is a non-parametric statistic that was originally aimed at identifying differentially expressed genes (DEGs) in a dataset [29]. Using the RankProd (RP) package (Version 1.1.383) [30], an add-on R package, a set of DEGs with FDR < 0.05 were obtained. The RP is a statistical approach that is widely used to detect differentially expressed features in -omics data e.g., transcriptomics, metabolomics and proteomics studies. Standardized expression values of meta-genes from all samples were used to rank and select the most important genes.

2.4. Derivation of Network Metrics

Up-regulated and down-regulated DEGs were used to train the network. Differentially expressed genes were obtained using meta-analysis by comparing fold change between disease and control groups from each data series. The gene expression data were then standardized. The Pearson correlation between the gene expression data was then obtained and genes with correlation values higher than 95% (ad-hoc) were used in Networkx (version 2.4 for python3.7 via anaconda) (https://networkx.github.io/ (accessed on 16 November 2018) to draw the undirected gene network and its metric measures cited in Table 1. NeworkX is a Python-based software package, used to extract the network metric measures, manipulate data, and study the structure, dynamics, and functions of complex networks (Supplementary Table S2). It has many standard graph algorithms for data structures for graphs, digraphs, and multigraphs. We developed individual networks based on both up-regulated and down-regulated genes. Investigation of complete sets of DEGs did not produce meaningful networks.

2.5. Downstream Analysis of Network Genes

The obtained results were used to construct a Venn diagram to identify genes overlapping between different strains. This was done using the Jvenn package (http://jvenn.toulouse.inra.fr/app/example.html (accessed on 20 May 2019). Gene IDs of DEGs were also uploaded to the PANTHER [31] website (http://www.pantherdb.org/ (accessed on 1 July 2019) to investigate the differences in gene expression between the samples after the viral challenge compared to the control samples. Network ranking algorithms created using Cytoscape software package ClueGo + Clue Pedia (version: 3.8.0.) (https://cytoscape.org/ (accessed on 28 September 2019) were then used to identify genes overlapping with the Python-based network results. Biological pathways, functions and networks relating to identified DEGs were investigated by means of Ingenuity Pathway Analysis (IPA) software (Qiagen: https://digitalinsights.qiagen.com/products-overview/discovery-insights-portfolio/analysis-and-visualization/qiagen-ipa/ (accessed on 12 April 2021). Differentially expressed genes with adjusted p < 0.05 and FC > 1.5 were used in the IPA analysis.

3. Results

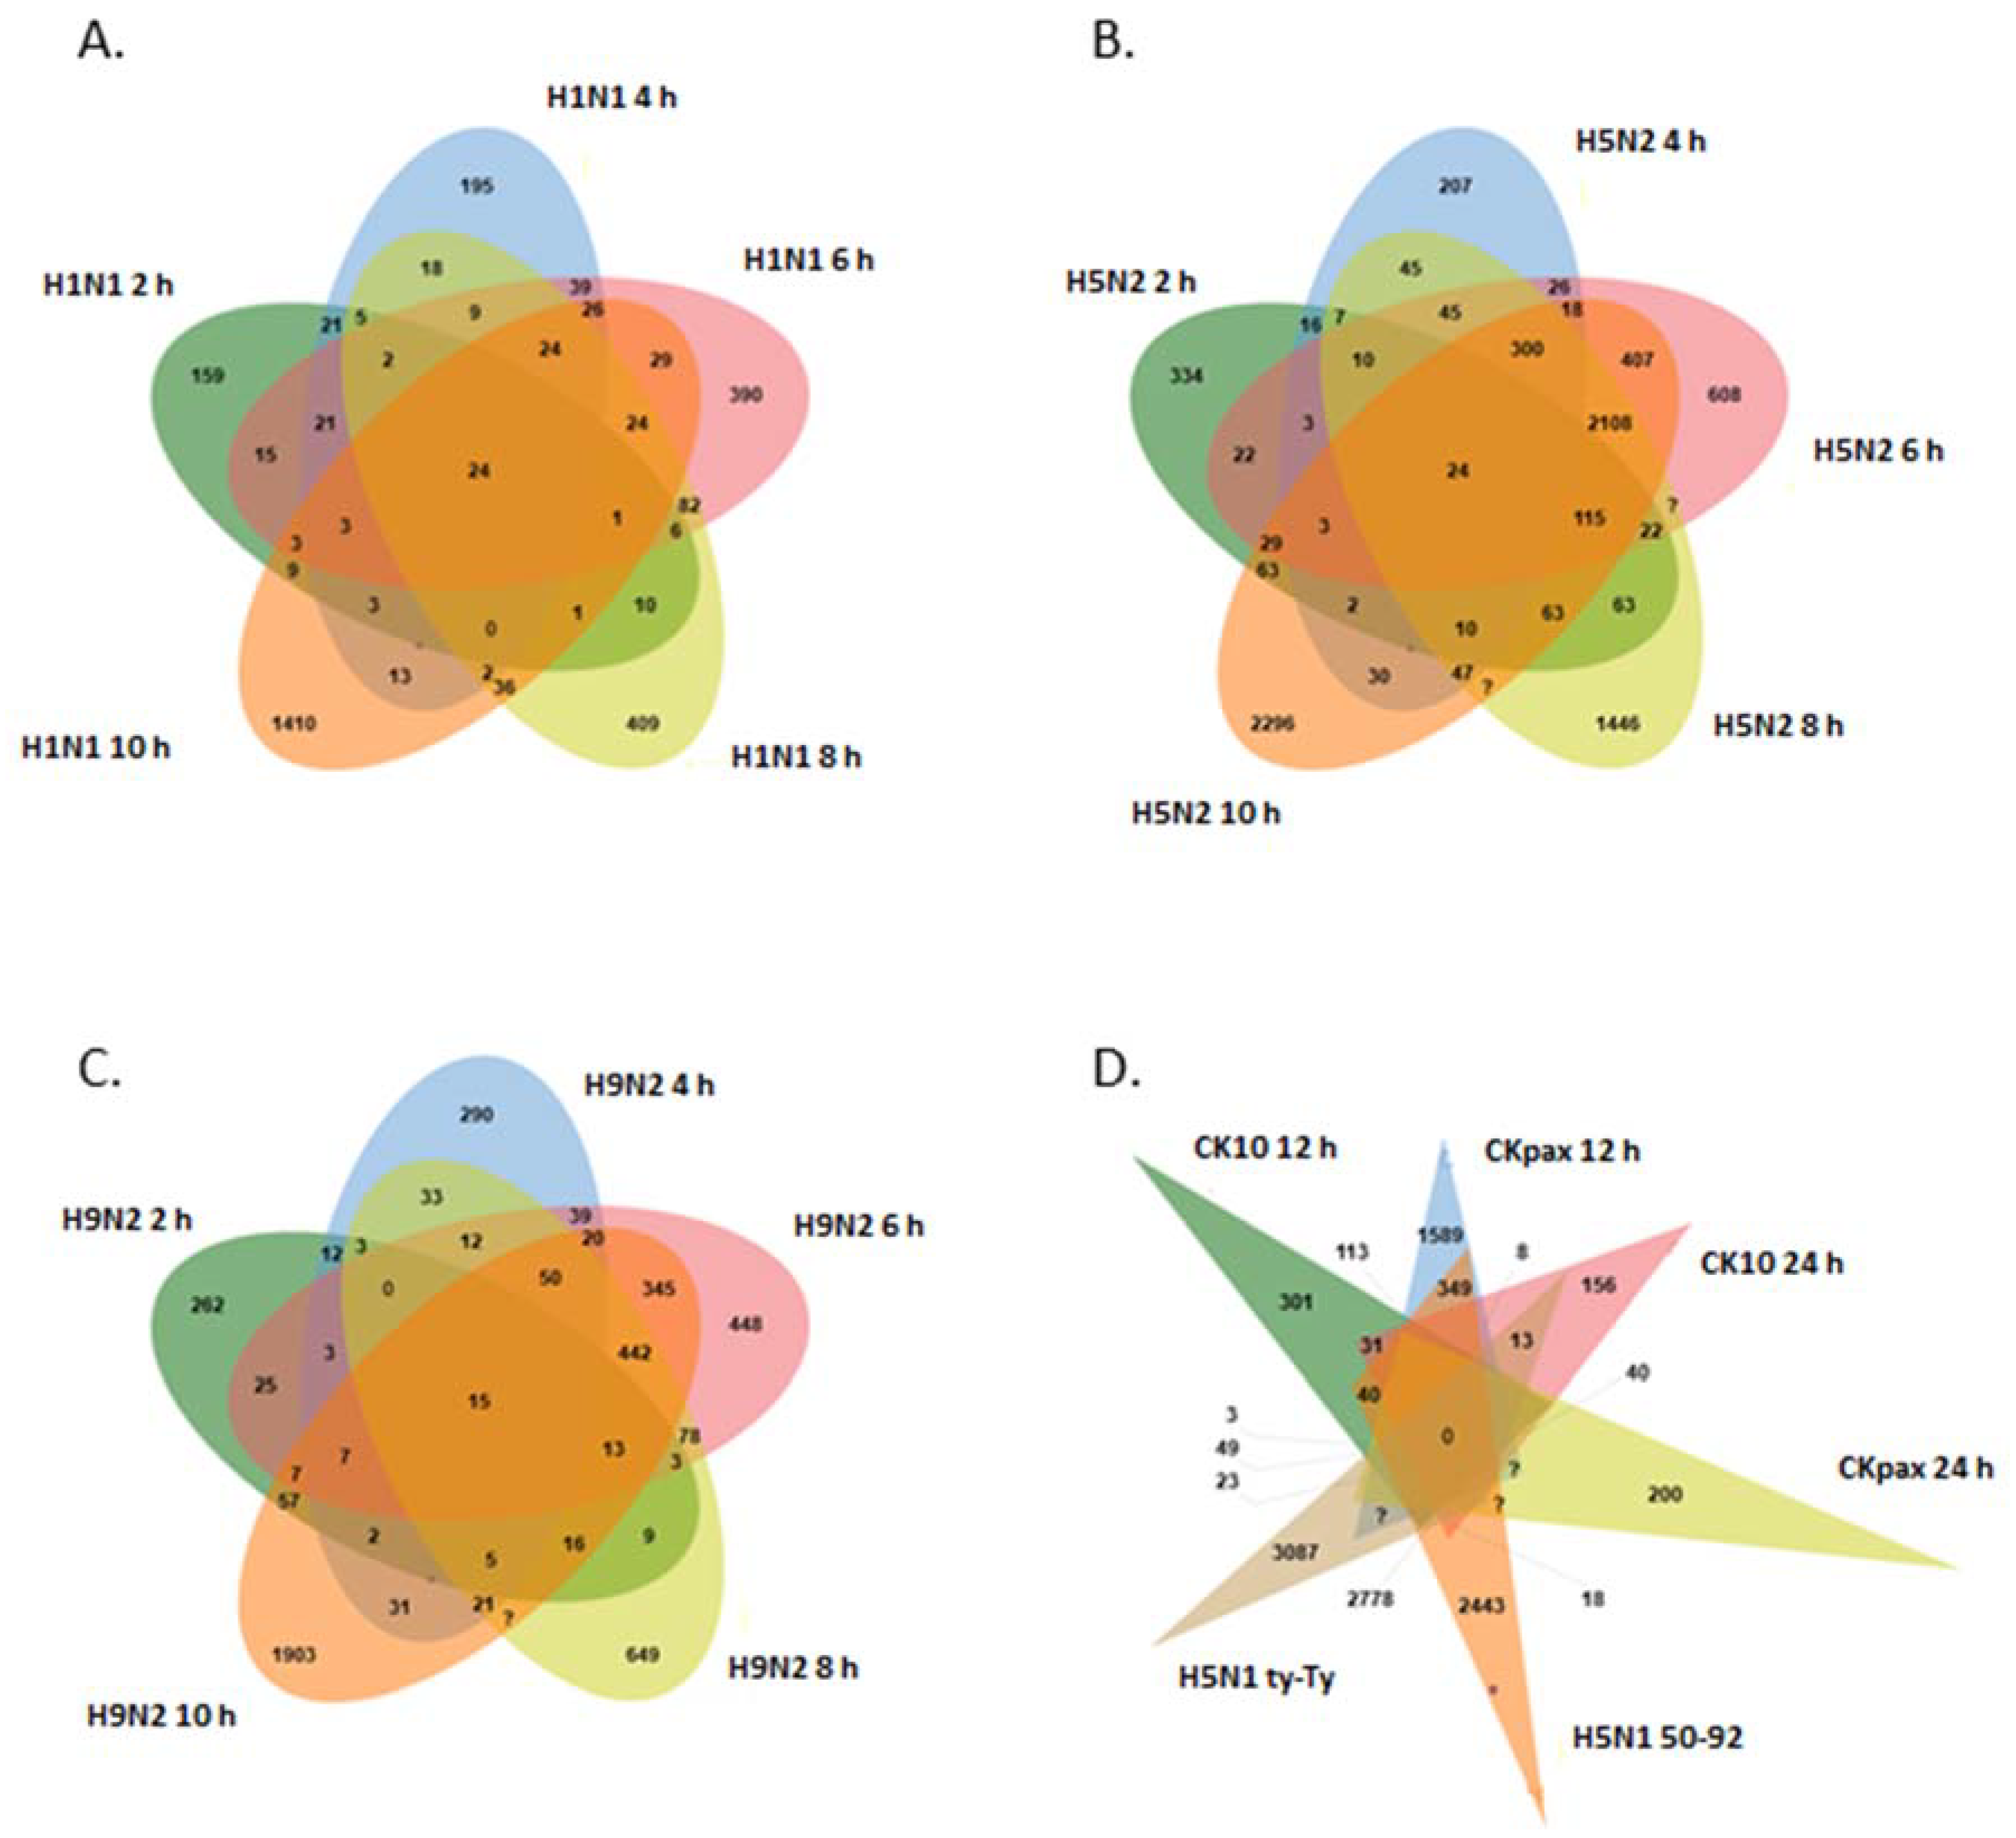
3.1. Analysis of LPAI Datasets

In the LPAI datasets, 6004 probes (3535 genes) were differentially expressed (p < 0.05) with 31% of DEGs being up-regulated and 69% of DEGs down-regulated. For the H1N1 strain there were 9 common probes between 2 h and 10 h after viral infection (Figure 4A). For H5N2 there were 24 probes expressed at all times and there were 64 common probes expressed between 2 h and 10 h after viral infection (Figure 4B). For H9N2, there were 15 probes expressed across all times and there were 57 common probes between 2 h and 10 h after viral infection (Figure 4C). In terms of probes commonly expressed between different viral sub-types, we see 1520 common probes between H5N2 and H9N2, 271 probes between H5N2 and H1N1, 102 probes between H1N1 and H9N2, 294 probes between H5N2 and H5N3, 171 probes between H5N2, H9N2 and H1N1 and 210 probes between H5N2, H9N2 and H5N3. All LPAI DEGs (FC > +/−1.5) are shown in Supplementary Table S3.

3.2. Analysis of HPAI Datasets

The Venn diagram in Figure 4D shows that for H5N1 infections, there were 31 commonly expressed probes between Ck10 12 h and Ck10 24 h datasets; 23 between Ck-pax 12 h and Ck-pax 24 h and 2778 between H5N1 ty-Ty and H5N1 50–92. The largest set of common probes was found between Ck-pax 24 h, 50–92 and ty-Ty datasets, with 550 probes shared (Figure 4D). The result of the meta-analysis for chicken influenza microarray data showed that in the HPAI datasets examined, 390 probes (265 genes) were differentially expressed (p < 0.05). For DEGs, 29% were found to be up-regulated while 71% were down-regulated. A list of all significant differentially expressed genes is shown in Supplementary Table S4.

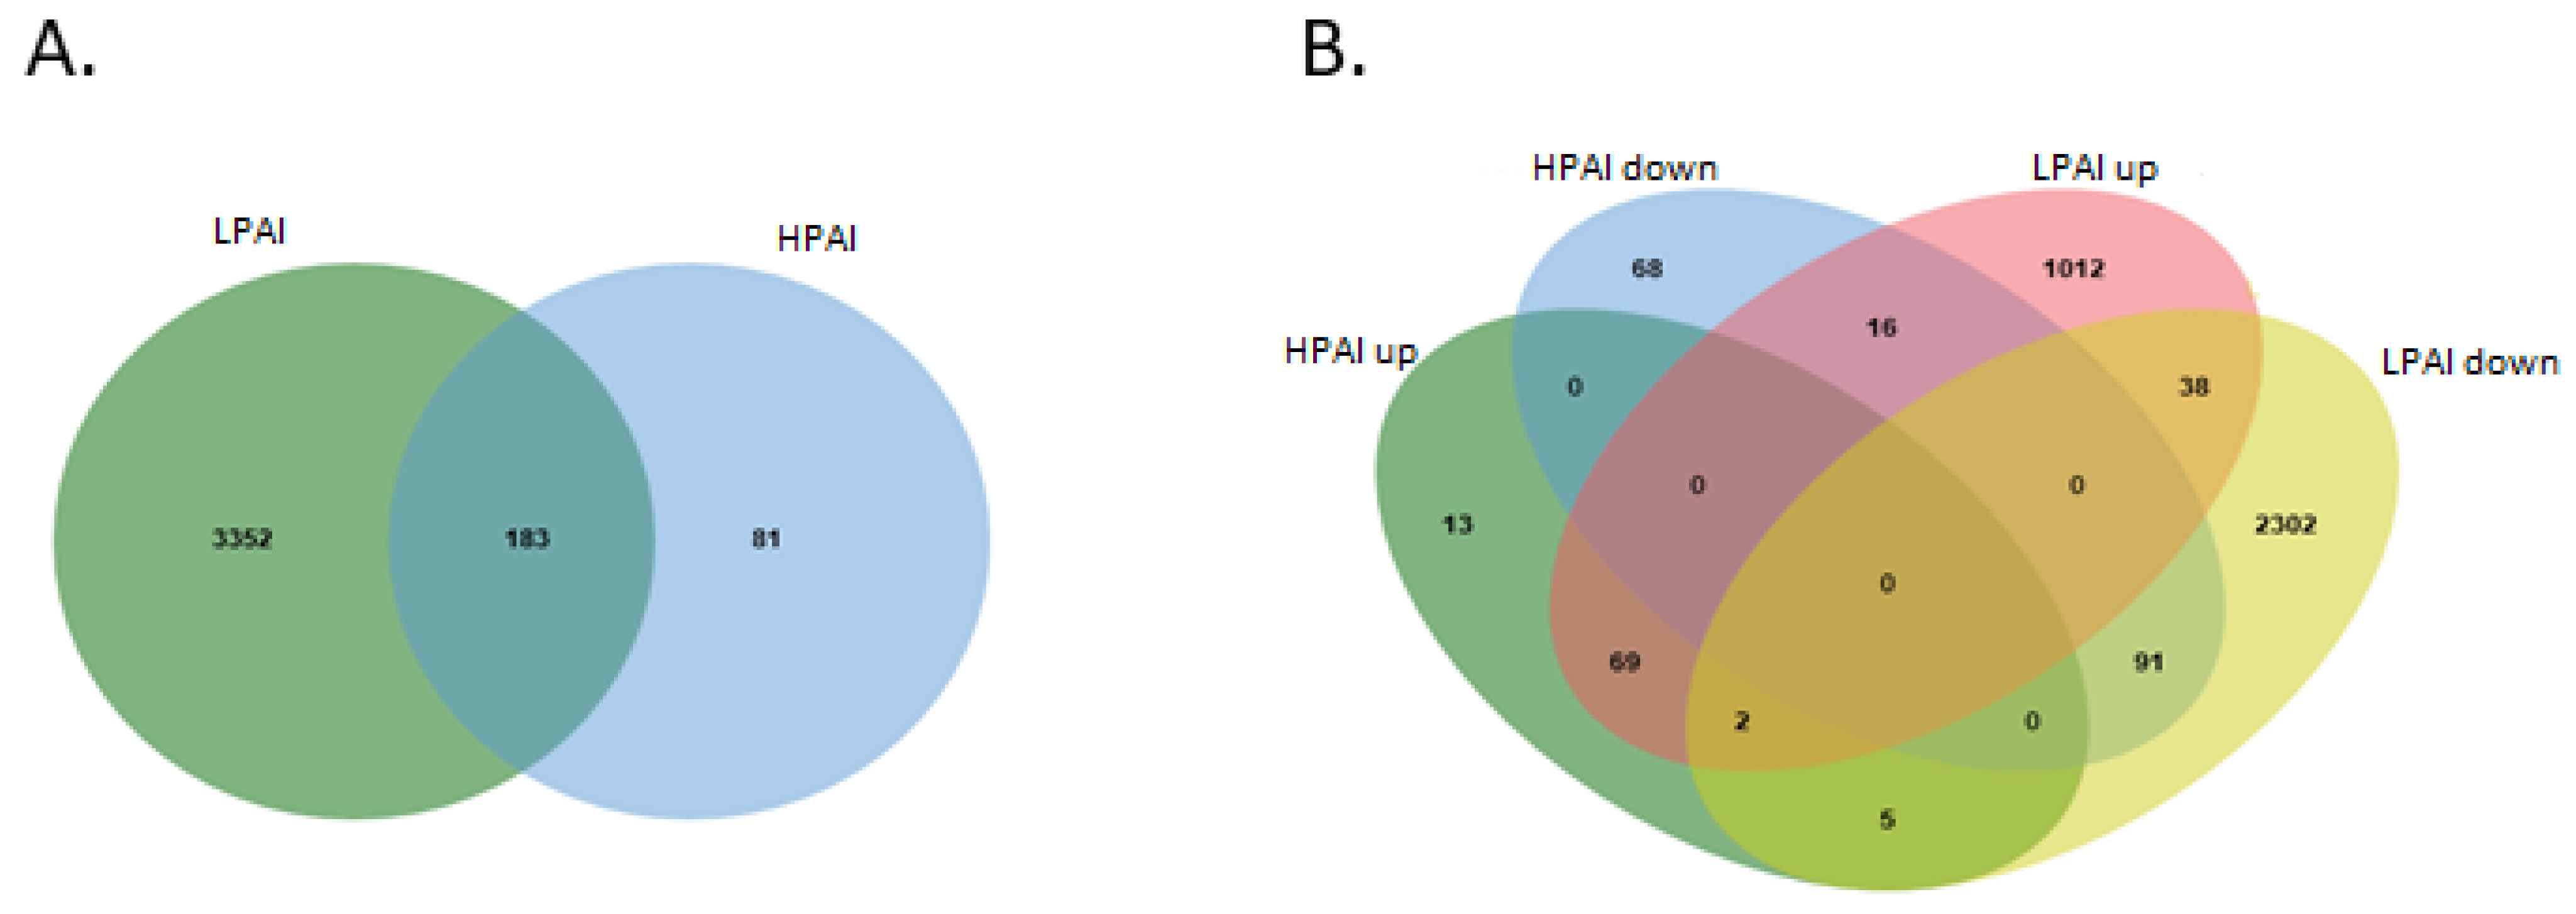
3.3. Comparison of LPAI and HPAI Datasets

In order to shed some light on the differential gene expression between HPAI and LPAI challenge, Venn diagrams were used to identify overlapping DEGs between both the up-regulated and down-regulated gene sets (Figure 5). Collectively, this analysis, based on direct comparison of gene expression across the two influenza groups, demonstrated that there are 91 genes in common between down-regulated HPAI and LPAI datasets—the largest number of common genes. When up-regulated data are compared, there are seen to be 69 genes differentially expressed after both LPAI and HPAI challenge.
The purpose of this study was to identify the most important genes involved in the avian flu response, based on the location of these genes in a gene network. Meta-analysis was performed individually on LPAI and HPAI datasets for genes up-regulated and for those down-regulated. Table 1 shows the information relating to the Python networks generated for each challenge group. The nodes represent genes and edges represent interactions in the gene network. For LPAI data, the up-regulated network includes 1842 nodes and 60,606 edges, while the down-regulated network contains 4162 nodes and 243,604 edges. With the HPAI data, we see an up-regulated network including 305 nodes and 114 edges and a down-regulated network that includes 1813 nodes and 276 edges. Results from our network analyses are summarized in Table 2, which describes the hub genes identified in each of the up- or down-regulated groups.
As the centrality measure of the genes in the networks reduces, the proportion of the genes remaining in the network also reduces. Genes with high ‘centrality’, ‘harmonic’, ‘degree’, ‘closeness’, ‘Eigenvector’ and ‘Subgraph’ metrics achieve similar performance, whereas ‘betweenness centrality’ and ‘load centrality’ have a lower performance. Results from the ‘core number’ and ‘cluster’ criteria were not appropriate for finding modules. The ‘degree centrality’ metric in gene networks defines the importance of a gene in a graph as being measured based on its degree; the higher the degree of a gene, the more important it is in a graph. According to the results of the present study, the ‘degree centrality’ criterion obtained more accurate results than other criteria, as the results from this criterion are consistent with the results of the gene network based on the correlation between the genes. Centrality criteria for different DEGs are as shown in Table 2.
The networks created are too large to present pictorially, but as an example, we show a section of the HPAI networks as depicted using Cytoscape software. Figure 6A shows a section of the up-regulated network and Figure 6B part of the down-regulated gene network.
Examining genes differentially expressed between the HPAI and LPAI data sets identified the genes summarized in Table 3. CMTR1, HERC4L, IFIT5, LY96, RNF213 and EPSTI1 were all more highly expressed after HPAI challenge compared to LPAI challenge. It is interesting to note that several of these genes (IFIT5, LY96, RNF213 and EPST1) were previously identified in a study examining LPAI and HPAI infection in ducks and chickens [32]. However, RBM18, NDUFB1, DCTN3, COX7C, IMMP2 and LZDHHC9 all showed higher expression during the host response to LPAI.

3.4. Analysis of All Up- and All Down-Regulated Genes

We also performed a general analysis across all up- (Table 4) and all down-regulated (Table 5) genes from both HPAI and LPAI datasets and identified significant genes. In general, we see a fairly unique response to LPAI and HPAI infections. However, from our network analysis, some genes were identified as important hub genes across both types of challenge. Amongst genes up-regulated, SELENOK, NDUFA1, PPP1R7, SMDT1, COX7C, PRELID3B, CIB1, OST4 and NDUFB2 were highlighted. Some of these (SELENOK, SMDT1, CIB1) are involved in calcium signaling, while others (NDUFA1, COX7C, NDUFB2) play a role in the mitochondrial respiratory chain. Ca2+- dependent signaling plays a crucial role in influenza viral internalization and infection, as well as being implicated in apoptosis of viral-infected cells [33]. An increase in activity of the mitochondrial respiratory chain is also known to occur after influenza infection [34]. Significant down-regulated genes included PUS10, ERBIN, SYDE2, PCGF6, FZD6, ROR1, LRIG2, SUPT7L, EXOC8, KIF1C and PCM1. These genes have a variety of functions including miRNA processing (PUS10), RNA polymerase II-specific transcription repressor activity (PCGF6), and negative regulation of biological processes including cell proliferation and apoptosis (FZD6) and chromatin modification (SUPT7L). Many of these genes are thus seen to have a role in how other genes are regulated.

3.5. Gene Ontology

Analysis of functional ontologies associated with the genes being differentially expressed in response to influenza infection was carried out. Supplementary Tables S5–S8 show the biological processes, molecular functions and cellular components associated with DEGs identified as being up-regulated in response to HPAI (Supplementary Table S5), down-regulated in response to HPAI (Supplementary Table S6), up-regulated in response to LPAI (Supplementary Table S7) and down-regulated in response to LPAI (Supplementary Table S8). Based on KEGG analysis, important pathways affected during response to HPAI include those of Influenza A, Cytokine-cytokine receptor interaction, NOD-like receptor signaling and Toll-like receptor signaling, whereas after LPAI challenge cell adhesion molecules, MAPK signaling, ErbB signaling and phagosome activity are modified.

3.6. Pathway Analysis

In order to explore the biological pathways and functional processes associated with differentially expressed genes, Ingenuity Pathway Analysis software was used. Figure 7 shows a comparison of some of the most significant biological activities related to the DEGs with respect to LPAI challenge compared to HPAI disease. Viral infection and replication is lower after LPAI challenge and apoptosis higher. This higher level of cell death is mirrored by the lower levels of cell survival indicated. This reflects the host ability to kill AI-infected cells and ultimately overcome LPAI infection—a situation not enabled when chickens succumb to HPAI virus. Upon investigation of the gene networks being modified upon HPAI challenge, we see that IFNG and IFNB are two of the main activators of gene expression. Conversely, genes such as IL4, IL10 and STAT6 are inhibited, restricting a Th2-type immune response (Supplementary Table S9), directing the host toward an antiviral Th1 response. Supplementary Figure S1 shows the interferon-stimulated inflammatory response that is initiated after the H5N1 HPAI infection investigated in this study.

4. Discussion

Here we present a network analysis of a variety of microarray datasets representing avian influenza challenge in chicken. These datasets represent both lowly pathogenic and highly pathogenic infections. Our network modelling identifies core genes central to the response to both kinds of challenge, whether that be through up- or down-regulation of gene expression.
We observed that degree, harmonic and closeness centrality methods generate highly significant results. These methods are reliable applicants for use in practice to identify the hub genes related to a particular disease [35]. Load and betweenness centrality methods do not have a higher statistical significance than the baseline method [34] in highlighting known avian influenza genes. However, degree, harmonic and closeness centrality parameters can identify the previously unknown genes which are involved in the disease response of interest. These methods can be used to generate new hypotheses on host-virus interaction, and highlight candidates for experimental validation. Gene networks were used to identify the functional relevance of a gene interacting with communicating nodes in a biological network. The higher the value, the higher the relevance of the gene in connecting the regulatory molecules [36]. One can easily read basic features of the graph (degree, hierarchical structure, etc.) as well as more nuanced features, e.g., the relationship between a vertex and the hierarchical position of its neighbors. The present visualization strategy is a useful tool in discriminating between networks with different topological properties and structural arrangement, and may be also used for comparison of models with real data, providing an additional tool for model validation [37].
For each type of challenge (LPAI and HPAI), unique and common host response genes were identified. During LPAI infection, genes involved in the process of apoptosis are activated, compared with the HPAI response. This may be one of the reasons why birds are able to overcome lowly pathogenic strain infections but not that of the highly pathogenic variety. On the other hand, immune stimulation and an interferon response is seen after HPAI challenge. However, as chickens are unable to survive the HPAI challenge, this response is either (1) inadequate in overcoming the viral infection or (2) too extreme and causes the so-called ‘cytokine storm’ often responsible for mortality in the face of HPAI infection. The levels of cytokine expression that are seen here do not appear to be excessive however, so it is likely that the response that is being initiated, in this instance, is insufficient. Indeed, only 96 genes are seen to be significantly up-regulated in response to HPAI (with 4.9-fold maximum expression change). A strong down-regulation of several genes is however seen. These include immune genes such as BLB1, CXCR4, IRF2BP2, TLR5 and TNFRSF1B. So it may be that HPAI infection causes an overall down-regulation of the immune system, thus rendering the host incapable of mounting a sufficient response to the virus.
Most of the up-regulated LPAI DEGs are involved in functions associated with the mitochondria or Golgi apparatus. Flu infection is known to lead to alterations in mitochondria morphology, release of pro-apoptotic proteins, loss of mitochondrial membrane potential, and eventually cell death [38]. When we look at the up-regulated HPAI DEGs on the other hand, we see that several are involved in the innate immune response, with CMTR1 and IFIT5 being well-known interferon-stimulated genes, LY96 enhancing TLR4-dependent activation of NF-kappa-B [39] and EPSTI1 mediating RELA/p65 and STAT1 phosphorylation and nuclear localization upon activation of macrophages [40].
Looking at core genes identified across all viral challenges, genes up-regulated in both highly and lowly pathogenic infections include those involved in calcium signaling –a process central to biological activity after viral infection. Various viruses enter host cells via endocytosis, but the underlying molecular mechanisms are unknown. The influenza A viruses (IAVs) enter cells via redundant pathways of clathrin-mediated and clathrin-independent endocytosis, with intracellular calcium having a central role in regulation of both pathways, by activating a signaling axis comprising RhoA, Rho-kinase, phosphatidylinositol 4-phosphate 5-kinase (PIP5K) and phospholipase C (PLC). IAV infection induces oscillations in the cytosolic Ca2+ concentration of host cells, the prevention of which markedly attenuates virus internalization and infection. The small GTPase RhoA is found both to function downstream of the virus-induced Ca2+ response and to induce Ca2+ oscillations in a manner dependent on Rho-kinase and subsequent PIP5K-PLC signaling. This signaling circuit regulates both clathrin-mediated and clathrin-independent endocytosis during virus infection and seems to constitute a key mechanism for regulation of IAV internalization and infection [33].
Other genes with a role in the mitochondrial respiratory chain were also identified. Genes commonly down-regulated encompass a variety of functions, but many were involved in gene regulation. The Cap Methyltransferase 1 (CMTR1) gene was identified as a core up-regulated gene in the HPAI gene expression network. This gene has been identified as a host dependency factor, vital for efficient viral cap-snatching and regulating cell autonomous immune response. It also provides synergistic protection with the influenza endonuclease inhibitor Xofluza [41]. CMTR1 also has a potential role in the pathogenesis of asthma exacerbations [42]. Also in the HPAI gene expression network, the PARD6G gene (Par-6 Family Cell Polarity Regulator Gamma) was seen to be down-regulated. It is thought to play a role in the formation of epithelial tight junctions [43]. The expression changes occurring in these genes could help explain the differences in mortality seen between LPAI and HPAI infection in chickens.

5. Conclusions

We have used network analysis methods to predict hub gene associations from a collection of microarray datasets known to be related to the avian response to influenza infection, and created gene-interaction networks by correlation amongst differentially regulated genes. Next, we used degree, eigenvector, closeness, betweenness, subgraph, harmonic centrality, clustering and core number metrics to rank the genes in the network according to their relevance in the system. Our method has enabled the identification of core genes involved in the general host response to influenza infection in chicken e.g., SELENOK, NDUFA1, PPP1R7, SMDT1, COX7C, PRELID3B, CIB1, OST4 and NDUFB2 amongst up-regulated data and PUS10, ERBIN, SYDE2, PCGF6, FZD6, ROR1, LRIG2, SUPT7L, EXOC8, KIF1C and PCM1 from down-regulated data. Comparison between different pathogenic strains identifies up-regulation of CMTR1, HERC4L, IFIT5, LY96, RNF213 and EPSTI1 as being significant during HPAI challenge, with RBM18, NDUFB1, DCTN3, COX7C, IMMP2 and LZDHHC9 being central to the LPAI expression network.

Supplementary Materials

The following supporting information can be downloaded at: https://www.mdpi.com/article/10.3390/genes13030435/s1, Table S1: Previous network based studies in chicken [44,45,46,47,48,49,50,51,52,53,54,55,56,57,58,59,60], Table S2: Network metrics used in this study [61,62,63,64,65,66,67], Table S3: Differentially expressed genes from LPAI data analysis, Table S4: Differentially expressed genes from HPAI data analysis, Table S5: Gene Ontology of up-regulated HPAI DEGs, Table S6: Gene Ontology of down-regulated HPAI DEGs, Table S7: Gene Ontology of up-regulated LPAI DEGs, Table S8: Gene Ontology of down-regulated LPAI DEGs, Table S9: HPAI upstream activators.

Author Contributions

Conceptualization, M.G.-Z.; methodology, M.G.-Z., J.S. and A.M.P.; validation, M.G.-Z., H.M. and A.O.; formal analysis, A.M.P., R.R. and J.S.; writing—original draft preparation, M.G.-Z. and A.M.P.; writing—review and editing, H.M., R.R., A.O., S.K. and J.S.; supervision, M.G.-Z.; funding acquisition, M.G.-Z. All authors have read and agreed to the published version of the manuscript.

Funding

This project was partially supported by the Ryan Zist Fanavary Hermes company, Iran.

Institutional Review Board Statement

Not applicable.

Informed Consent Statement

Not applicable.

Data Availability Statement

All data examined in this study are as outlined in Figure 2 along with relevant accession numbers.

Conflicts of Interest

The authors declare no conflict of interest, but would like to state that J.S. is a member of the Genes Editorial Board.

References

  1. Reperant, L.A.; Kuiken, T.; Osterhaus, A.D. Adaptive pathways of zoonotic influenza viruses: From exposure to establishment in humans. Vaccine 2012, 30, 4419–4434. [Google Scholar] [CrossRef] [Green Version]
  2. Katz, J.M.; Veguilla, V.; Belser, J.A.; Maines, T.R.; Van Hoeven, N.; Pappas, C.; Hancock, K.; Tumpey, T.M. The public health impact of avian influenza viruses. Poult. Sci. 2009, 88, 872–879. [Google Scholar] [CrossRef] [PubMed]
  3. Tong, S.; Zhu, X.; Li, Y.; Shi, M.; Zhang, J.; Bourgeois, M.; Yang, H.; Chen, X.; Recuenco, S.; Gomez, J.; et al. New world bats harbor diverse influenza A viruses. PLoS Pathog. 2013, 9, e1003657. [Google Scholar] [CrossRef] [Green Version]
  4. Gibbs, A.J.; Armstrong, J.S.; Downie, J.C. From where did the 2009 ‘swine-origin’ influenza A virus (H1N1) emerge? Virol. J. 2009, 6, 207. [Google Scholar] [CrossRef] [PubMed] [Green Version]
  5. Tong, S.; Li, Y.; Rivailler, P.; Conrardy, C.; Castillo, D.A.; Chen, L.M.; Recuenco, S.; Ellison, J.A.; Davis, C.T.; York, I.A.; et al. A distinct lineage of influenza A virus from bats. Proc. Natl. Acad. Sci. USA 2012, 109, 4269–4274. [Google Scholar] [CrossRef] [PubMed] [Green Version]
  6. Taye, B.; Yeo, D.; Lee, R.T.C.; Tan, B.H.; Sugrue, R.J.; Maurer-Stroh, S. Inter-Species Host Gene Expression Differences in Response to Human and Avian Influenza A Virus Strains. Int. J. Mol. Sci. 2017, 18, 2295. [Google Scholar] [CrossRef] [Green Version]
  7. Zamperin, G.; Bianco, A.; Smith, J.; Bortolami, A.; Vervelde, L.; Schivo, A.; Fortin, A.; Marciano, S.; Panzarin, V.; Mazzetto, E.; et al. Heterogeneity of Early Host Response to Infection with Four Low-Pathogenic H7 Viruses with a Different Evolutionary History in the Field. Viruses 2021, 13, 2323. [Google Scholar] [CrossRef] [PubMed]
  8. Hancock, K.; Veguilla, V.; Lu, X.; Zhong, W.; Butler, E.N.; Sun, H.; Liu, F.; Dong, L.; DeVos, J.R.; Gargiullo, P.M.; et al. Cross-reactive antibody responses to the 2009 pandemic H1N1 influenza virus. N. Engl. J. Med. 2009, 361, 1945–1952. [Google Scholar] [CrossRef] [Green Version]
  9. Itoh, Y.; Shinya, K.; Kiso, M.; Watanabe, T.; Sakoda, Y.; Hatta, M.; Muramoto, Y.; Tamura, D.; Sakai-Tagawa, Y.; Noda, T.; et al. In vitro and in vivo characterization of new swine-origin H1N1 influenza viruses. Nature 2009, 460, 1021–1025. [Google Scholar] [CrossRef] [PubMed]
  10. Belshe, R.B. The origins of pandemic influenza-lessons from the 1918 virus. N. Engl. J. Med. 2005, 353, 2209–2211. [Google Scholar] [CrossRef] [PubMed]
  11. Munster, V.J.; de Wit, E.; van den Brand, J.M.; Herfst, S.; Schrauwen, E.J.; Bestebroer, T.M.; van de Vijver, D.; Boucher, C.A.; Koopmans, M.; Rimmelzwaan, G.F.; et al. Pathogenesis and transmission of swine-origin 2009 A(H1N1) influenza virus in ferrets. Science 2009, 325, 481–483. [Google Scholar] [CrossRef] [PubMed] [Green Version]
  12. Kuchipudi, S.V.; Tellabati, M.; Sebastian, S.; Londt, B.Z.; Jansen, C.; Vervelde, L.; Brookes, S.M.; Brown, I.H.; Dunham, S.P.; Chang, K.C. Highly pathogenic avian influenza virus infection in chickens but not ducks is associated with elevated host immune and pro-inflammatory responses. Vet. Res. 2014, 45, 118. [Google Scholar] [CrossRef] [Green Version]
  13. Thitithanyanont, A.; Engering, A.; Uiprasertkul, M.; Ekchariyawat, P.; Wiboon-Ut, S.; Kraivong, R.; Limsalakpetch, A.; Kum-Arb, U.; Yongvanitchit, K.; Sa-Ard-Iam, N.; et al. Antiviral immune responses in H5N1-infected human lung tissue and possible mechanisms underlying the hyperproduction of interferon-inducible protein IP-10. Biochem. Biophys. Res. Commun. 2010, 398, 752–758. [Google Scholar] [CrossRef] [PubMed] [Green Version]
  14. Sharp, G.B.; Kawaoka, Y.; Jones, D.J.; Bean, W.J.; Pryor, S.P.; Hinshaw, V.; Webster, R.G. Coinfection of wild ducks by influenza A viruses: Distribution patterns and biological significance. J. Virol. 1997, 71, 6128–6135. [Google Scholar] [CrossRef] [PubMed] [Green Version]
  15. Isoda, N.; Sakoda, Y.; Kishida, N.; Bai, G.R.; Matsuda, K.; Umemura, T.; Kida, H. Pathogenicity of a highly pathogenic avian influenza virus, A/chicken/Yamaguchi/7/04 (H5N1) in different species of birds and mammals. Arch. Virol. 2006, 151, 1267–1279. [Google Scholar] [CrossRef] [PubMed]
  16. Perkins, L.E.; Swayne, D.E. Pathogenicity of a Hong Kong-origin H5N1 highly pathogenic avian influenza virus for emus, geese, ducks, and pigeons. Avian Dis. 2002, 46, 53–63. [Google Scholar] [CrossRef]
  17. Jeong, O.M.; Kim, M.C.; Kim, M.J.; Kang, H.M.; Kim, H.R.; Kim, Y.J.; Joh, S.J.; Kwon, J.H.; Lee, Y.J. Experimental infection of chickens, ducks and quails with the highly pathogenic H5N1 avian influenza virus. J. Vet. Sci. 2009, 10, 53–60. [Google Scholar] [CrossRef] [PubMed] [Green Version]
  18. Saito, T.; Watanabe, C.; Takemae, N.; Chaisingh, A.; Uchida, Y.; Buranathai, C.; Suzuki, H.; Okamatsu, M.; Imada, T.; Parchariyanon, S.; et al. Pathogenicity of highly pathogenic avian influenza viruses of H5N1 subtype isolated in Thailand for different poultry species. Vet. Microbiol. 2009, 133, 65–74. [Google Scholar] [CrossRef] [PubMed]
  19. Chen, H.Y.; Shang, Y.H.; Yao, H.X.; Cui, B.A.; Zhang, H.Y.; Wang, Z.X.; Wang, Y.D.; Chao, A.J.; Duan, T.Y. Immune responses of chickens inoculated with a recombinant fowlpox vaccine coexpressing HA of H9N2 avain influenza virus and chicken IL-18. Antivir. Res. 2011, 91, 50–56. [Google Scholar] [CrossRef]
  20. Wibawa, H.; Henning, J.; Wong, F.; Selleck, P.; Junaidi, A.; Bingham, J.; Daniels, P.; Meers, J. A molecular and antigenic survey of H5N1 highly pathogenic avian influenza virus isolates from smallholder duck farms in Central Java, Indonesia during 2007–2008. Virol. J. 2011, 8, 425. [Google Scholar] [CrossRef] [PubMed] [Green Version]
  21. Hayashi, T.; MacDonald, L.A.; Takimoto, T. Influenza A Virus Protein PA-X Contributes to Viral Growth and Suppression of the Host Antiviral and Immune Responses. J. Virol. 2015, 89, 6442–6452. [Google Scholar] [CrossRef] [Green Version]
  22. Jagger, B.W.; Wise, H.M.; Kash, J.C.; Walters, K.A.; Wills, N.M.; Xiao, Y.L.; Dunfee, R.L.; Schwartzman, L.M.; Ozinsky, A.; Bell, G.L.; et al. An overlapping protein-coding region in influenza A virus segment 3 modulates the host response. Science 2012, 337, 199–204. [Google Scholar] [CrossRef] [PubMed] [Green Version]
  23. Hu, J.; Mo, Y.; Wang, X.; Gu, M.; Hu, Z.; Zhong, L.; Wu, Q.; Hao, X.; Hu, S.; Liu, W.; et al. PA-X decreases the pathogenicity of highly pathogenic H5N1 influenza A virus in avian species by inhibiting virus replication and host response. J. Virol. 2015, 89, 4126–4142. [Google Scholar] [CrossRef] [PubMed] [Green Version]
  24. Gaucherand, L.; Porter, B.K.; Levene, R.E.; Price, E.L.; Schmaling, S.K.; Rycroft, C.H.; Kevorkian, Y.; McCormick, C.; Khaperskyy, D.A.; Gaglia, M.M. The Influenza A Virus Endoribonuclease PA-X Usurps Host mRNA Processing Machinery to Limit Host Gene Expression. Cell Rep. 2019, 27, 776–792.e7. [Google Scholar] [CrossRef] [PubMed] [Green Version]
  25. Townsend, M.B.; Dawson, E.D.; Mehlmann, M.; Smagala, J.A.; Dankbar, D.M.; Moore, C.L.; Smith, C.B.; Cox, N.J.; Kuchta, R.D.; Rowlen, K.L. Experimental evaluation of the FluChip diagnostic microarray for influenza virus surveillance. J. Clin. Microbiol. 2006, 44, 2863–2871. [Google Scholar] [CrossRef] [PubMed] [Green Version]
  26. Albert, R.; Barabási, A.-L. Statistical mechanics of complex networks. Rev. Mod. Phys. 2002, 74, 47. [Google Scholar] [CrossRef] [Green Version]
  27. Schnitzler, A.; Gross, J. Normal and pathological oscillatory communication in the brain. Nat. Rev. Neurosci. 2005, 6, 285–296. [Google Scholar] [CrossRef] [PubMed]
  28. Andersen, C.L.; Jensen, J.L.; Ørntoft, T.F. Normalization of real-time quantitative reverse transcription-PCR data: A model-based variance estimation approach to identify genes suited for normalization, applied to bladder and colon cancer data sets. Cancer Res. 2004, 64, 5245–5250. [Google Scholar] [CrossRef] [PubMed] [Green Version]
  29. Breitling, R.; Armengaud, P.; Amtmann, A.; Herzyk, P. Rank products: A simple, yet powerful, new method to detect differentially regulated genes in replicated microarray experiments. FEBS Lett. 2004, 573, 83–92. [Google Scholar] [CrossRef] [PubMed]
  30. Hong, F.; Breitling, R.; McEntee, C.W.; Wittner, B.S.; Nemhauser, J.L.; Chory, J. RankProd: A bioconductor package for detecting differentially expressed genes in meta-analysis. Bioinformatics 2006, 22, 2825–2827. [Google Scholar] [CrossRef] [PubMed] [Green Version]
  31. Mi, H.; Huang, X.; Muruganujan, A.; Tang, H.; Mills, C.; Kang, D.; Thomas, P.D. PANTHER version 11: Expanded annotation data from Gene Ontology and Reactome pathways, and data analysis tool enhancements. Nucleic Acids Res. 2017, 45, D183–D189. [Google Scholar] [CrossRef] [Green Version]
  32. Smith, J.; Smith, N.; Yu, L.; Paton, I.R.; Gutowska, M.W.; Forrest, H.L.; Danner, A.F.; Seiler, J.P.; Digard, P.; Webster, R.G.; et al. A comparative analysis of host responses to avian influenza infection in ducks and chickens highlights a role for the interferon-induced transmembrane proteins in viral resistance. BMC Genom. 2015, 16, 574. [Google Scholar] [CrossRef] [PubMed] [Green Version]
  33. Fujioka, Y.; Tsuda, M.; Nanbo, A.; Hattori, T.; Sasaki, J.; Sasaki, T.; Miyazaki, T.; Ohba, Y. A Ca2+-dependent signalling circuit regulates influenza A virus internalization and infection. Nat. Commun. 2013, 4, 2763. [Google Scholar] [CrossRef] [PubMed] [Green Version]
  34. Meyer, L.; Leymarie, O.; Chevalier, C.; Esnault, E.; Moroldo, M.; Da Costa, B.; Georgeault, S.; Roingeard, P.; Delmas, B.; Quéré, P.; et al. Transcriptomic profiling of a chicken lung epithelial cell line (CLEC213) reveals a mitochondrial respiratory chain activity boost during influenza virus infection. PLoS ONE 2017, 12, e0176355. [Google Scholar] [CrossRef] [PubMed]
  35. Ozgür, A.; Vu, T.; Erkan, G.; Radev, D.R. Identifying gene-disease associations using centrality on a literature mined gene-interaction network. Bioinformatics 2008, 24, 277–285. [Google Scholar] [CrossRef]
  36. Zhuang, D.Y.; Jiang, L.; He, Q.Q.; Zhou, P.; Yue, T. Identification of hub subnetwork based on topological features of genes in breast cancer. Int. J. Mol. Med. 2015, 35, 664–674. [Google Scholar] [CrossRef] [PubMed]
  37. Alvarez-Hamelin, J.I.; Dall’Asta, L.; Barrat, A.; Vespignani, A. K-core decomposition of internet graphs: Hierarchies, self-similarity and measurement biases. Netw. Heterog. Media 2008, 3, 371–393. [Google Scholar] [CrossRef]
  38. Tiku, V.; Tan, M.W.; Dikic, I. Mitochondrial Functions in Infection and Immunity. Trends Cell Biol. 2020, 30, 263–275. [Google Scholar] [CrossRef] [PubMed] [Green Version]
  39. Shimazu, R.; Akashi, S.; Ogata, H.; Nagai, Y.; Fukudome, K.; Miyake, K.; Kimoto, M. MD-2, a molecule that confers lipopolysaccharide responsiveness on Toll-like receptor 4. J. Exp. Med. 1999, 189, 1777–1782. [Google Scholar] [CrossRef] [PubMed]
  40. Kim, Y.H.; Lee, J.R.; Hahn, M.J. Regulation of inflammatory gene expression in macrophages by epithelial-stromal interaction 1 (Epsti1). Biochem. Biophys. Res. Commun. 2018, 496, 778–783. [Google Scholar] [CrossRef] [PubMed]
  41. Li, B.; Clohisey, S.M.; Chia, B.S.; Wang, B.; Cui, A.; Eisenhaure, T.; Schweitzer, L.D.; Hoover, P.; Parkinson, N.J.; Nachshon, A.; et al. Genome-wide CRISPR screen identifies host dependency factors for influenza A virus infection. Nat. Commun. 2020, 11, 164. [Google Scholar] [CrossRef] [Green Version]
  42. Dahlin, A.; Denny, J.; Roden, D.M.; Brilliant, M.H.; Ingram, C.; Kitchner, T.E.; Linneman, J.G.; Shaffer, C.M.; Weeke, P.; Xu, H.; et al. CMTR1 is associated with increased asthma exacerbations in patients taking inhaled corticosteroids. Immun. Inflamm. Dis. 2015, 3, 350–359. [Google Scholar] [CrossRef] [PubMed]
  43. Louer, E.M.M.; Günzel, D.; Rosenthal, R.; Carmone, C.; Yi, G.; Stunnenberg, H.G.; den Hollander, A.I.; Deen, P.M.T. Differential day-night expression of tight junction components in murine retinal pigment epithelium. Exp. Eye Res. 2020, 193, 107985. [Google Scholar] [CrossRef] [PubMed]
  44. Higgins, S.E.; Ellestad, L.E.; Trakooljul, N.; McCarthy, F.; Saliba, J.; Cogburn, L.A.; Porter, T.E. Transcriptional and pathway analysis in the hypothalamus of newly hatched chicks during fasting and delayed feeding. BMC Genom. 2010, 11, 162. [Google Scholar] [CrossRef] [PubMed] [Green Version]
  45. Cong, F.; Liu, X.; Han, Z.; Shao, Y.; Kong, X.; Liu, S. Transcriptome analysis of chicken kidney tissues following coronavirus avian infectious bronchitis virus infection. BMC Genom. 2013, 14, 743. [Google Scholar] [CrossRef] [PubMed] [Green Version]
  46. Hong, Y.H.; Dinh, H.; Lillehoj, H.S.; Song, K.D.; Oh, J.D. Differential regulation of microRNA transcriptome in chicken lines resistant and susceptible to necrotic enteritis disease. Poult. Sci. 2014, 93, 1383–1395. [Google Scholar] [CrossRef] [PubMed]
  47. Luo, J.; Carrillo, J.A.; Menendez, K.R.; Tablante, N.L.; Song, J. Transcriptome analysis reveals an activation of major histocompatibility complex 1 and 2 pathways in chicken trachea immunized with infectious laryngotracheitis virus vaccine. Poult. Sci. 2014, 93, 848–855. [Google Scholar] [CrossRef]
  48. Coble, D.J.; Fleming, D.; Persia, M.E.; Ashwell, C.M.; Rothschild, M.F.; Schmidt, C.J.; Lamont, S.J. RNA-seq analysis of broiler liver transcriptome reveals novel responses to high ambient temperature. BMC Genom. 2014, 15, 1084. [Google Scholar] [CrossRef] [PubMed] [Green Version]
  49. Kim, D.K.; Lillehoj, H.S.; Jang, S.I.; Lee, S.H.; Hong, Y.H.; Cheng, H.H. Transcriptional profiles of host-pathogen responses to necrotic enteritis and differential regulation of immune genes in two inbreed chicken lines showing disparate disease susceptibility. PLoS ONE 2014, 9, e114960. [Google Scholar] [CrossRef] [PubMed]
  50. Sun, H.; Liu, P.; Nolan, L.K.; Lamont, S.J. Thymus transcriptome reveals novel pathways in response to avian pathogenic Escherichia coli infection. Poult. Sci. 2016, 95, 2803–2814. [Google Scholar] [CrossRef] [PubMed]
  51. Chen, B.; Xu, J.; He, X.; Xu, H.; Li, G.; Du, H.; Nie, Q.; Zhang, X. A Genome-Wide mRNA Screen and Functional Analysis Reveal FOXO3 as a Candidate Gene for Chicken Growth. PLoS ONE 2015, 10, e0137087. [Google Scholar] [CrossRef]
  52. Tariq, M.; Chen, R.; Yuan, H.; Liu, Y.; Wu, Y.; Wang, J.; Xia, C. De novo transcriptomic analysis of peripheral blood lymphocytes from the Chinese goose: Gene discovery and immune system pathway description. PLoS ONE 2015, 10, e0121015. [Google Scholar] [CrossRef] [PubMed] [Green Version]
  53. Naraballobh, W.; Trakooljul, N.; Muráni, E.; Brunner, R.; Krischek, C.; Janisch, S.; Wicke, M.; Ponsuksili, S.; Wimmers, K. Immediate and long-term transcriptional response of hind muscle tissue to transient variation of incubation temperature in broilers. BMC Genom. 2016, 17, 323. [Google Scholar] [CrossRef] [PubMed] [Green Version]
  54. Lan, X.; Hsieh, J.C.; Schmidt, C.J.; Zhu, Q.; Lamont, S.J. Liver transcriptome response to hyperthermic stress in three distinct chicken lines. BMC Genom. 2016, 17, 955. [Google Scholar] [CrossRef] [Green Version]
  55. Liu, H.; Yang, X.; Zhang, Z.; Li, J.; Zou, W.; Zeng, F.; Wang, H. Comparative transcriptome analysis reveals induction of apoptosis in chicken kidney cells associated with the virulence of nephropathogenic infectious bronchitis virus. Microb. Pathog. 2017, 113, 451–459. [Google Scholar] [CrossRef] [PubMed]
  56. Ma, T.; Xu, L.; Wang, H.; Guo, X.; Li, Z.; Wan, F.; Chen, J.; Liu, L.; Liu, X.; Chang, G.; et al. Identification of the crucial genes in the elimination and survival process of Salmonella enterica ser. Pullorum in the chicken spleen. Anim. Genet. 2017, 48, 303–314. [Google Scholar] [CrossRef] [PubMed]
  57. Wang, Y.; Chen, Q.; Liu, Z.; Guo, X.; Du, Y.; Yuan, Z.; Guo, M.; Kang, L.; Sun, Y.; Jiang, Y. Transcriptome Analysis on Single Small Yellow Follicles Reveals That Wnt4 Is Involved in Chicken Follicle Selection. Front. Endocrinol. 2017, 8, 317. [Google Scholar] [CrossRef] [Green Version]
  58. Xie, S.; Yang, X.; Wang, D.; Zhu, F.; Yang, N.; Hou, Z.; Ning, Z. Thyroid transcriptome analysis reveals different adaptive responses to cold environmental conditions between two chicken breeds. PLoS ONE 2018, 13, e0191096. [Google Scholar] [CrossRef] [PubMed] [Green Version]
  59. Wu, P.; Dai, G.; Chen, F.; Chen, L.; Zhang, T.; Xie, K.; Wang, J.; Zhang, G. Transcriptome profile analysis of leg muscle tissues between slow- and fast-growing chickens. PLoS ONE 2018, 13, e0206131. [Google Scholar] [CrossRef] [PubMed] [Green Version]
  60. Qiu, L.; Chang, G.; Li, Z.; Bi, Y.; Liu, X.; Chen, G. Comprehensive Transcriptome Analysis Reveals Competing Endogenous RNA Networks During Avian Leukosis Virus, Subgroup J-Induced Tumorigenesis in Chickens. Front. Physiol. 2018, 9, 996. [Google Scholar] [CrossRef]
  61. Freeman, L.C. A set of measures of centrality based on betweenness. Sociometry 1977, 40, 35–41. [Google Scholar] [CrossRef]
  62. Freeman, L.C. Centrality in social networks conceptual clarification. Soc. Netw. 1978, 1, 215–239. [Google Scholar] [CrossRef] [Green Version]
  63. Newman, M.E. The structure and function of complex networks. SIAM Rev. 2003, 45, 167–256. [Google Scholar] [CrossRef] [Green Version]
  64. Rochat, Y. Closeness Centrality Extended to Unconnected Graphs: The Harmonic Centrality Index; ASNA: Zurich, Switzerland, 2009; pp. 26–28. [Google Scholar]
  65. Maccari, L.; Ghiro, L.; Guerrieri, A.; Montresor, A.; Cigno, R.L. On the Distributed Computation of Load Centrality and its Application to DV Routing. In Proceedings of the IEEE INFOCOM 2018—IEEE Conference on Computer Communications, Honolulu, HI, USA, 15–19 April 2018; pp. 2582–2590. [Google Scholar] [CrossRef] [Green Version]
  66. Estrada, E.; Rodríguez-Velázquez, J.A. Subgraph centrality in complex networks. Phys. Rev. E 2005, 71, 056103. [Google Scholar] [CrossRef] [PubMed] [Green Version]
  67. Saramäki, J.; Kivelä, M.; Onnela, J.P.; Kaski, K.; Kertész, J. Generalizations of the clustering coefficient to weighted complex networks. Phys. Rev. E 2007, 75, 027105. [Google Scholar] [CrossRef] [PubMed] [Green Version]
Figure 1. An indication of directed and undirected graphs showing their adjacency matrices.
Genes 13 00435 g001
Figure 2. The datasets used and their corresponding viruses and sample collection times (post-infection). All samples are derived from lung tissue. H5N1-50-92 is a classical HPAI virus H5N1 strain (A/turkey/England/50-92/91) and H5N1-ty-Ty is a contemporary Eurasian lineage clade 2.2.1 H5N1 virus (A/turkey/Turkey/1/05).
Genes 13 00435 g002
Figure 3. Analysis pipeline used in this study (Arrows indicate where results from one software were used as input for another program). MEV = multiple experiment viewer.
Genes 13 00435 g003
Figure 4. Venn diagram showing common genes across datasets and viral strains. (A) H1N1 across 2, 4, 6, 8 and 10 h, (B) H5N2 across 2, 4, 6, 8 and 10 h, (C) H9N2 across 2, 4, 6, 8 and 10 h, (D) H5N1.
Genes 13 00435 g004
Figure 5. Intersected analysis was used for the identification of common DEGs from all ten datasets. (A) Total differentially expressed genes between HPAI and LPAI from across all possible group comparisons. (B) Venn diagram showing up- and down-regulated genes in HPAI and LPAI experiments. Different coloured regions represent different datasets, and the intersecting area denotes the common DEGs. (DEGs, differentially expressed genes; HPAI, highly pathogenic avian influenza; LPAI, lowly pathogenic avian influenza).
Genes 13 00435 g005
Figure 6. Cytoscape gene networks of the up-regulated HPAI dataset (A) and down-regulated HPAI dataset (B).
Genes 13 00435 g006
Figure 7. A comparison of biological activities differentially regulated upon LPAI or HPAI challenge. Comparison as determined by IPA software. DEGs with p < 0.05 and FC > 1.5 were used in the analysis. Shades of blue indicate down-regulation and shades of orange up-regulation.
Genes 13 00435 g007
Table 1. Python Networks.
Python Network for LPAI Microarray Data
RegulationNumber of NodesNumber of Edges
up-regulation184260,606
down-regulation4162243,604
Python Network for HPAI Microarray Data
RegulationNumber of NodesNumber of Edges
up-regulation305114
down-regulation1813276
LPAI—lowly pathogenic avian influenza; HPAI—highly pathogenic avian influenza; nodes = genes; edges = interactions.
Table 2. Top 6 hub genes identified from each network analysis.
LPAI: Up-Regulated Genes
GeneNumber of ConnectionsDegreeHarmonicClosenessEigenvectorSubgraph
RBM183840.37647.810.50.071.21 × 10103
NDUFB13750.36639.530.490.071.17 × 10103
DCTN33720.36641.190.50.071.16 × 10103
COX7C3700.36639.550.490.061.03 × 10103
IMMP2L3680.36638.380.490.071.16 × 10103
ZDHHC93680.36639.430.50.071.11 × 10103
LPAI: Down-Regulated Genes
GeneNumber of ConnectionsDegreeHarmonicClosenessEigenvectorSubgraph
GTF3C58490.361491.630.520.068.47 × 10184
RFWD28400.361493.430.520.058.04 × 10184
MED238280.351486.050.520.057.78 × 10184
SEC23B7980.341469.680.520.057.52 × 10184
ATRX7960.341450.850.50.056.77 × 10184
DROSHA7940.341456.030.50.057.31 × 10184
HPAI: Up-Regulated Genes
GeneNumber of ConnectionsDegreeHarmonicClosenessEigenvectorSubgraph
CMTR1270.5237.080.610.262.23 × 106
HERC4L240.4735.580.580.241.91 × 106
IFIT5230.4534.110.530.241.84 × 106
LY96230.4534.030.520.211.45 × 106
RNF213220.4333.610.520.241.78 × 106
EPSTI1220.4333.530.520.221.56 × 106
HPAI: Down-Regulated Genes
GeneNumber of ConnectionsDegreeHarmonicClosenessEigenvectorSubgraph
PEX14600.4581.70.50.165.62 × 1017
HMG20A590.4481.20.50.165.53 × 1017
TLK1L590.4481.20.50.165.52 × 1017
RNF151590.4481.780.510.165.43 × 1017
PARD6G580.4380.780.50.155.01 × 1017
CAV2550.4179.20.490.154.88 × 1017
Table 3. Comparison of differential gene expression found between HPAI and LPAI datasets.
Gene SymbolGene NameEntrez Gene IDHPAIPAI
Log2 Fold ChangeRegulationLog2 Fold ChangeExpression
CMTR1cap methyltransferase 1143062.10UP
HERC4Lhect domain and RLD 4-like42972.05UP
IFIT5interferon induced protein with tetratricopeptide repeats 5336352.64UP
LY96lymphocyte antigen 9655081.91UP
RNF213ring finger protein 213109722.06UP
EPSTI1epithelial stromal interaction 1112412.01UP
RBM18RNA binding motif protein 187150 1.30UP
NDUFB1NADH:ubiquinone oxidoreductase subunit B14970 1.27UP
DCTN3dynactin subunit 34824 1.29UP
COX7Ccytochrome c oxidase subunit 7C4726 1.32UP
IMMP2Linner mitochondrial membrane peptidase subunit 29006 1.27UP
ZDHHC9zinc finger DHHC-type containing 92532 1.19UP
PEX14peroxisomal biogenesis factor 146768−0.34down
HMG20Ahigh mobility group 20A20936−0.34down
TLK1Ltousled like kinase 1 like6751−0.27down
RNF151ring finger protein 1519782−0.36down
PARD6Gpar-6 family cell polarity regulator gamma9912−0.42down
CAV2caveolin 29078−0.36down
GTF3C5general transcription factor IIIC subunit 521008 −0.70down
RFWD2ring finger and WD repeat domain 237706 −0.64down
MED23mediator complex subunit 238401 −0.68down
SEC23BSec23 homolog B, coat complex II component21262 −0.76down
ATRXalpha thalassemia/mental retardation syndrome X-linked7476 −0.68down
DROSHAdrosha ribonuclease III20908 −0.70down
Table 4. Hub genes for all up-regulated data.
Gene SymbolGene NameProbe IDNumber of Connections
SELENOKselenoprotein KGga.1058.1.S1_at209
NDUFA1NADH:ubiquinone oxidoreductase subunit A1Gga.5918.1.A1_a_at207
PPP1R7protein phosphatase 1 regulatory subunit 7Gga.5583.1.S1_a_at202
SMDT1 single-pass membrane protein with aspartate rich tail 1 Gga.9946.1.S1_at200
COX7Ccytochrome c oxidase subunit 7CGga.6171.1.S1_a_at200
PRELID3BPRELI domain containing 3BGga.9900.2.S1_at199
CIB1calcium and integrin binding 1Gga.5965.2.S1_a_at198
OST4 oligosaccharyltransferase complex subunit 4, non-catalytic Gga.6184.1.S1_at196
NDUFB2NADH:ubiquinone oxidoreductase subunit B2Gga.17299.1.S1_a_at196
Table 5. Hub genes for all down-regulated data.
Gene SymbolGene NameProbe IDNumber of Connections
PUS10pseudouridylate synthase 10GgaAffx.4897.1.S1_at509
ERBINerbb2 interacting proteinGga.17560.1.S1_at496
SYDE2synapse defective Rho GTPase homolog 2Gga.11842.1.S1_s_at492
PCGF6polycomb group ring finger 6Gga.16959.1.S1_at490
FZD6frizzled class receptor 6Gga.2690.1.S1_at489
ROR1receptor tyrosine kinase like orphan receptor 1Gga.9476.1.S1_at485
LRIG2 leucine rich repeats and immunoglobulin like domains 2 Gga.17165.1.S1_at479
SUPT7LSPT7 like, STAGA complex gamma subunitGga.16763.1.S1_at475
EXOC8exocyst complex component 8Gga.14199.1.S1_at470
KIF1Ckinesin family member 1CGga.15878.1.S1_s_at469
PCM1pericentriolar material 1Gga.3449.1.S1_at468
Publisher’s Note: MDPI stays neutral with regard to jurisdictional claims in published maps and institutional affiliations.

