Abstract
A range of several psychiatric medications targeting the activity of solute carrier (SLC) transporters have proved effective for treatment. Therefore, further research is needed to elucidate the expression profiles of the Slc genes, which may serve as markers of altered brain metabolic processes and neurotransmitter activities in psychoneurological disorders. We studied the Slc differentially expressed genes (DEGs) using transcriptomic profiles in the ventral tegmental area (VTA), nucleus accumbens (NAcc), and prefrontal cortex (PFC) of control and aggressive male mice with psychosis-like behavior induced by repeated experience of aggression accompanied with wins in daily agonistic interactions. The majority of the Slc DEGs were shown to have brain region-specific expression profiles. Most of these genes in the VTA and NAcc (12 of 17 and 25 of 26, respectively) were downregulated, which was not the case in the PFC (6 and 5, up- and downregulated, respectively). In the VTA and NAcc, altered expression was observed for the genes encoding the transporters of neurotransmitters as well as inorganic and organic ions, amino acids, metals, glucose, etc. This indicates an alteration in transport functions for many substrates, which can lead to the downregulation or even disruption of cellular and neurotransmitter processes in the VTA and NAcc, which are attributable to chronic stimulation of the reward systems induced by positive fighting experience. There is not a single Slc DEG common to all three brain regions. Our findings show that in male mice with repeated experience of aggression, altered activity of neurotransmitter systems leads to a restructuring of metabolic and neurotransmitter processes in a way specific for each brain region. We assume that the scoring of Slc DEGs by the largest instances of significant expression co-variation with other genes may outline a candidate for new prognostic drug targets. Thus, we propose that the Slc genes set may be treated as a sensitive genes marker scaffold in brain RNA-Seq studies.
1. Introduction
The solute carrier (SLC) group of membrane transport proteins comprises over 400 human disease-associated genes organized into 65 families [1,2,3,4]. SLCs are responsible for transporting extremely diverse solutes, including neurotransmitters, organic molecules as well as inorganic ions, metals, etc. Most SLC transporters are located in the cell membrane, and some of them are located in the mitochondria or in other intracellular organelles.
Several SLC transporters are targets for well-known drugs [3,5] for the treatment of psychoneurological disorders. As an example, inhibitors of SLC6A transporters (SLC6A2, SLC6A3, and SLC6A4 proteins) are promising agents for depression treatment, which act by reducing monoamines uptake in the synapses, thereby increasing their levels in the synaptic cleft. Inhibitors of the vesicular monoamine SLC18a2 carrier, which transports monoamines into synaptic vesicles, is the treatment option for Huntington’s disease [6] and psychostimulant abuse and addiction [7]. The inhibition of SLC6A9 and SLC6A5 transporters, which regulate extracellular glycine levels in brain tissue by neuronal inhibition and excitation, is used for reducing schizophrenia symptoms, which are hypothesized to be due to a deficiency in glutamatergic signaling, since glycine also binds to excitatory NMDA receptors [8]. Therefore, the altered expression of Slc genes may be indicative of altered metabolic processes and neurotransmitter systems activity in patients at risk of developing psychiatric disorders.
Our previous studies have shown that male mice winning in repeated daily agonistic interactions develop a psychosis-like state, exhibiting symptoms of pathological behaviors: abnormal aggression in any social situation, irritability, high impulsivity, disturbances of social recognition, enhanced anxiety and other symptoms, such as repeated stereotypies, hyperactivity, etc. [9,10,11,12,13,14]. Altered metabolism and neurotransmitter systems activity, as well as changes in the expression of several key genes, were found in several brain regions of chronically aggressive mice [15,16,17,18,19]. Increased expression of dopaminergic genes (Th, Slc6a3, Snca) against the background of activation of brain dopaminergic systems [20], was found in the ventral tegmental area [15,17], which contains the bodies of dopaminergic neurons. The differentially expressed genes (DEGs) encoding proteins involved in the metabolism of the GABAergic and glutamatergic systems were found in the dorsal striatum [13]. It is well known that these brain regions are responsible for the mechanisms of positive reinforcement, in particular, accompanying aggressive behavior.
The goal of this study is to analyze the expression of Slc genes and to identify those with changed expression in brain regions of male mice under repeated experience of aggression accompanied by wins: ventral tegmental area (VTA), ventral striatum (nucleus accumbens: NAcc), and prefrontal cortex (PFC), i.e., the brain regions involved in sex, food, and drug reward systems as well as in aggression and addiction [21,22,23,24,25,26,27]. We assume that Slc DEGs can serve as the markers of altered functions in the brain regions and as possible treatment targets for psychiatric diseases, in particular, psychosis accompanied by aggression.
2. Materials and Methods
Adult male mice C57BL/6 were obtained from the Animal Breeding Facility, Branch of the Institute of Bioorganic Chemistry of the RAS (Pushchino, Moscow region). Animals were housed under standard conditions (12:12 h light/dark regime starting at 8:00 a.m., at a constant temperature of 22 ± 2 °C, with food in pellets and water available ad libitum). Mice were weaned at three weeks of age and housed in groups of 8–10 in standard plastic cages (36 cm × 23 cm × 12 cm). Experiments were performed with 10–12 week old animals. All procedures were in compliance with the European Communities Council Directive 210/63/EU on 22 September 2010. The study was approved by Scientific Council N 9 of the Institute of Cytology and Genetics SB RAS of 24 March 2010, N 613 (Novosibirsk).
2.1. Generation of Repeated Aggression in Male Mice
Repeated negative and positive social experiences in male mice were induced by daily agonistic interactions with use of sensory contact model, which was later renamed as the “model of chronic social conflicts” [11,28]. Pairs of male mice were each placed in a cage (28 cm × 14 cm × 10 cm) bisected by a perforated transparent partition allowing the animals to hear, see, and smell each other, but preventing physical contact. The animals were left undisturbed for two days to adapt to new housing conditions and sensory acquaintance before they were exposed to agonistic interactions. Every afternoon (2:00–5:00 p.m. local time), the cage cover was replaced by a transparent one, and 5 min later (the time it takes for mice to start reacting to a partner in a neighboring compartment), the partition was removed for 10 min to encourage agonistic interactions. The superiority of one of the mice was firmly established within two or three confrontations with the same opponent. The superior mouse (winner) would be attacking, chasing, and biting the other, who would be displaying only defensive behavior (withdrawal, sideways postures, upright postures, freezing, or lying on the back). As a rule, aggressive interactions between males were discontinued by the lowering of the partition if the strong attacks lasted 3 min (in some cases less) to prevent the damage of the defeated mice. Each defeated mouse (loser) was exposed to the same winner for three days, while afterwards each the loser was placed, once a day after the agonistic interactions, in an unfamiliar cage with a strange winner behind the partition. Each winning mouse (aggressive mice, winner) remained in its original cage. Handling was present similarly for all groups of animals, when the litter bedding was changed in the cages every 5–6 days. This procedure was performed for 20 days (once a day) and yielded an equal number of the losers and winners.
In each experiment, we tracked the behavior of all males, making videos of behavior during agonistic interactions, which allowed us to identify the most aggressive mice that demonstrated the daily greatest number and duration of attacks, etc. Winners with the most expressed aggressive phenotypes (long lasting expressed aggression toward any losers every day) were selected for the transcriptome analysis.
Two groups of animals were analyzed in this experiment: (1) controls—mice without a consecutive experience of agonistic interactions; (2) winners—groups of repeatedly aggressive mice. The winners, 24 h after the last agonistic interaction, and the control animals were decapitated simultaneously. The brain regions (VTA, NAcc, and PFC) were dissected by the same experimenter according to the map presented in the Allen Mouse Brain Atlas [29]. All samples were placed in RNAlater solution (Life Technologies, Waltham, MA, USA) and were stored at −70 °C until sequencing.
2.2. Brain Regions
Transcriptomic analysis was performed in the VTA, NAcc, and PFC of male mice. The VTA contains 55–65% of the dopaminergic cell bodies [30,31,32] giving rise to the dopaminergic mesolimbic and mesocortical pathways which project to the NAcc and PFC, respectively: dopamine is a major neurotransmitter that is involved in the integration of afferent signals with inhibitory or excitatory inputs [30,33,34]. It is suggested that the VTA could act as a hub converging and integrating multimodal signals toward dopaminergic systems [35]. GABAergic and glutamatergic neurons are also present in the VTA [36,37]. Most of the neurons in the NAcc are GABAergic medium spiny neurons (MSNs) which express D1-type or D2-type receptors [38,39]; about 1–2% are cholinergic interneurons and another 1–2% are GABAergic interneurons. GABA is the predominant neurotransmitter in the NAcc, and GABA receptors are numerous [40]. These neurons play an important role in processing reward stimuli [41]. The PFC is highly interconnected with other brain regions including through extensive connections with subcortical and other cortical structures [42]. Several neurotransmitter systems are represented in the PFC, in particular dopaminergic, glutamatergic, and cholinergic systems [43,44].
2.3. RNA-Seq Analysis
The collected samples were sent to JSC Genoanalytica (https://genoanalytica.ru/ accessed on 21 November 2017, Moscow, Russia). The mRNA was extracted using a Dynabeads mRNA Purification Kit (Ambion, Thermo Fisher Scientific, Waltham, MA, USA). cDNA libraries were constructed using the NEBNext mRNA Library PrepReagent Set for Illumina (New England Biolabs, Ipswich, MA USA) following the manufacturer’s protocol and were subjected to Illumina sequencing. The resulting “fastq” format files were used to align all reads to the GRCm38.p3 reference genome using the TopHat aligner [45]. The Cuffdiff suite of Cufflinks package was used to elucidate differentially expressed genes: https://www.genepattern.org/modules/docs/Cuffdiff/7, accessed on 11 July 2014. The Cufflinks program was used to estimate the gene expression levels in FPKM units (fragments per kilobase of transcript per million mapped reads) and subsequently identify the differentially expressed genes in the brain regions of male mice from affected and control groups. Each brain area of each mouse was analyzed separately in groups of 3 vs. 3 animals. Only annotated gene sequences were used in the following analysis. The level of significance at p < 0.05 and q < 0.05 were taken into consideration to define genes as differentially expressed.
We have previously conducted studies of gene expression in males in similar experiments using the RT-PCR method with a larger number of samples for each compared experimental group, i.e., winners and losers (>10 animals). The direction and extent of changes in the experimental groups vs. control in the expression of the Tph2, Slc6a4, Bdnf, Creb1, and Gapdh genes in the midbrain raphe nuclei of males as determined by the two methods, RT-PCR [19,46] and RNA-Seq [47], are generally consistent. In the VTA, both methods showed similar changes in the level of transcription of genes Тh, Slc6а3, and Snca [17]. In order to cross-validate the results obtained, we also employed a unique resource from Stanford University, USA [48] and found a significant concordance with our RNA-Seq data pool [49]. These findings suggest that the transcriptome analyses of the data provided by JSC Genoanalytica (http://genoanalytica.ru, Moscow, Russia) have been verified, and that the method reflects the actual processes that occur in the brain under our experimental paradigm.
2.4. Cell-Specific DEG Distribution
The cellular specificity of Slc DEGs was assessed based on the Glia specification patterns of gene expression in different brain cells: neurons, glial cells (astrocytes, oligodendrocyte precursor, newly formed oligodendrocyte, myelinating oligodendrocyte, microglia), and endothelial cells from the Barres Laboratory described in [48]. To assess the degree of the cellular specificity of DEGs, we used the values of gene expression (in FPKM). It was considered that genes predominantly affect the function of glial cells if the total expression in all types of glial cells exceeds 50% of the total expression in all types of cells.
2.5. Statistical Analysis
Agglomerative hierarchical clustering (AHC) was performed using XLStat Version 2016.02 software (www.xlstat.com, accessed on 31 March 2016). The Pearson correlation coefficient has been used as a similarity metric for AHC analysis. The agglomeration method was unweighted pair-group average. Principal component analysis (PCA) was based on the Pearson correlation metric calculated on FPKM value profiles of 48 DEGs across the samples used. RNA-Seq FPKM data were used for PCA biplot analysis to assess the covariance of gene expression profiles.
3. Results
3.1. Ventral Tegmental Area
In the VTA of the winners, decreased expression compared to the controls was found for twelve Slc DEGs: Slc5a11, Slc12a4, Slc12a9, Slc18a3, Slc27a1, Slc28a3, Slc29a4, Slc32a1, Slc35e1, Slc38a10, Slc39a13, and Slco3a1 genes (Figure 1).
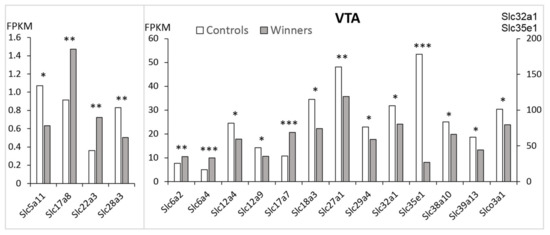
Figure 1.
The Slc DEGs in the VTA of mice. White columns: controls; grey columns: winners. *: p < 0.05; **: p < 0.01; ***: p < 0.001. Additional information is shown in Supplementary Table S1.
Genes Slc6a2, Slc6a4, Slc17a7, Slc17a8, and Slc22a3 were upregulated (hereinafter bold indicates upregulated genes). In the winners, as compared to the control mice, the most statistically significant changes were found in the expression of the Slc6a4, Slc17a7, and Slc35e1 genes.
Differential expression of Slc genes indicates transport impairments for many categories of substrates in the VTA of winning mice (Table 1). The VTA Slc DEGs were clustered using AHC analysis. Figure 2A presents the heatmap analysis based on expression profiles of the Slc DEGs.

Table 1.
Slc DEGs encoding the transporters in different brain regions according to type of substrate category for every gene.
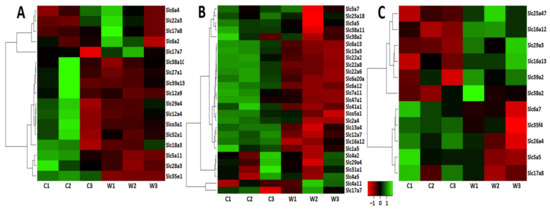
Figure 2.
Heatmap visualization. The heatmap analysis based on expression profiles of the Slc* DEGs in the brain regions of the winners (W1, W2, W3) and control male mice (C1, C2, C3) in the VTA (A), NAcc (B), and PFC (C). The genes were clustered using linkage hierarchical clustering by Euclidean distance. The gene expression levels are shown with red for low, black for middle, and green for high expression levels.
Three distinct clusters have been identified. AHC showed that based on highly coordinated gene expression profiles (Supplementary Table S2, VTA) the upregulated genes constitute separate clusters. One of them includes four genes associated with the regulation of neurotransmitter transport: the Slc6a2 and Slc6a4 genes encoding the noradrenaline and serotonin transporters, which carry out the reuptake of monoamines into the presynaptic terminals; the Slc17a8 gene encoding the protein belonging to vesicular glutamate transporter family, which mediates the uptake of glutamate into synaptic vesicles at presynaptic nerve terminals of excitatory neural cells; and the Slc22a3 gene encoding the protein belonging to organic cation/anion/zwitterion transporter family, which participates in dopamine transport. The second cluster was represented by a single upregulated Slc17a7 gene encoding vesicular glutamate transporter, which demonstrates low association with other transport signaling. Additionally, the upregulation of the Slc6a3 gene encoding dopamine transporter was shown in the VTA in previous experiments with use of RT-PCR methods [15,17]. All 12 downregulated genes were included in a separate large cluster (Figure 2A, Supplementary Table S2).
These data indicate a deficiency in the transmembrane transport of amino acids (Slc38a10), inorganic (Slc12a4, Slc12a9), organic and oligopeptide transporters (Slco3a1), glucose and nucleotide-sugar transporter (Slc5a11, Slc35e1, respectively), fatty acids (Slc27a1), zinc (Slc39a13), the nucleoside transporters which catalyze the reuptake of substrates into presynaptic neurons (Slc28a3, Slc29a4) thereby regulating the intensity and duration of monoamine neural signaling, including serotonin, dopamine, vesicular transporters, which are involved in acetylcholine and monoamine transport (Slc18a3), GABA and glycine (Slc32a1) in the VTA.
Thus, the AHC analysis demonstrated that each cluster corresponds to a putative specific modification of the signal transduction cascade, and a significant number of analyzed DEGs are involved in the regulation of neurotransmitter events. The largest number of positive correlations in the VTA were discovered for the expression of the Slc12a4, Slc29a4, and Slco3a1 genes (Supplementary Table S3), which may indicate the involvement of encoded proteins in all relevant coordinated processes.
3.2. Nucleus Accumbens
In the NAcc (Figure 3, Table S1) 27 Slc DEGs were identified. Only 2 genes (Slc4a11 and Slc17a7) were upregulated, and the remaining 25 genes were downregulated. The heatmap analysis based on expression profiles of the Slc DEGs that were found in the winners in comparison with control mice is presented in Figure 2B.
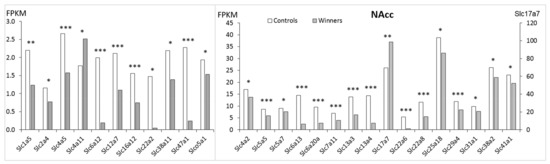
Figure 3.
The Slc DEGs in the NAcc of mice. White columns: controls, grey columns: winners. *: p < 0.05; **: p < 0.01; ***: p < 0.001. Additional information is shown in Supplementary Table S1.
In the NAcc, downregulation of most DEGs indicates disturbances in transport for many substrate categories (Table 1). AHC analysis showed that downregulated genes were assigned to three separate clusters and two upregulated genes were assigned to two different clusters (Table S2, NAcc). The largest cluster was comprised of 16 genes. The genes in this cluster encode the carriers of neurotransmitter GABA (Slc6a12, Slc6a13, Slc6a20a), amino acids (Slc1a5, Slc7a11), transporters of inorganic ions (Slc12a7, Slc13a3, Slc13a4, Slc16a12, Slc41a1) and organic anions and cations (Slc22a2, Slc22a6, Slc22a8, Slco5a1), glucose transporters (Slc2a4) and multisubstrates, such as glucose, sugar, bile salts, organic acids, metal ions and amine compounds (Slc47a1). In the second cluster the downregulated genes encode inorganic ions (Slc4a2, Slc4a5), nucleoside (Slc29a4), and copper (Slc31a1) transporters. The third cluster includes amino acids transporters (Slc38a2, Slc38a11), the Slc5a5 and Slc5a7 genes encoding sodium iodide and choline transporters, and the mitochondrial Slc25a18 gene.
The fourth and fifth clusters each contain one upregulated gene: Slc4a11 gene, which encodes a sodium bicarbonate transporter-like protein, and Slc17a7 gene, which is involved in glutamate signaling, respectively.
In the NAcc the largest number of positive correlations with expression of other genes were found (Table S3) for the Slc6a12 and Slc6a13 genes encoding GABA transporters and the Slc13a3 and Slc22a8 genes encoding sodium-dependent decarboxylase and organic anion transporters, respectively, as well as the Slc38a11 (putative sodium-coupled neutral amino acid transporter), which may indicate that these processes are deeply intertwined.
Since the regulation of gene expression in the NAcc, including the studied Slc transporters, can be regulated by neurotransmitter signals from other regions of the brain, we evaluated the changes in the transcription of DEGs encoding neurotransmitter receptors. Differences were found in the level of transcription of six genes (Table S4). AHC analysis demonstrated that the expression of each of the genes encoding neurotransmitter receptors corresponded to a specific cluster of the Slc DEGs. The data obtained suggest a coordinated functioning of certain SLC transporters with the corresponding neurotransmitters.
3.3. Prefrontal Cortex
In the PFC (Figure 4; Table S1) there are 11 Slc DEGs. Five of these genes were downregulated (Slc5a5, Slc6a7, Slc17a8, Slc26a4, Slc35f4) and six genes (Slc16a12, Slc16a13, Slc25a47, Slc29a3, Slc38a2, Slc39a2) were upregulated (Table 1).
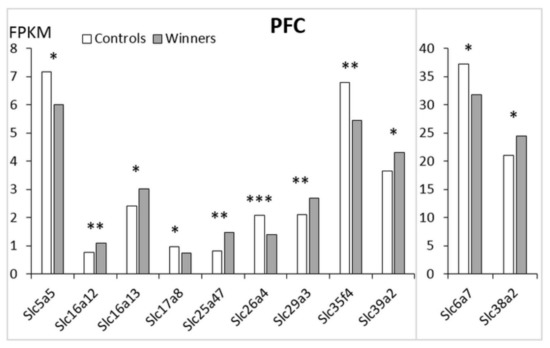
Figure 4.
The Slc DEGs in the PFC of mice. White columns: controls; grey columns: winners. *: p < 0.05; **: p < 0.01; ***: p < 0.001. Additional information are shown in Supplementary Table S1.
The heatmap analysis based on expression profiles of the Slc DEGs in the winners in the PFC is shown in Figure 2C. The AHC grouped the Slc DEGs into three clusters (Table S2). The first cluster combined all genes with reduced PFC expression. These genes encode transporters of sodium iodide and proline transporters (Slc5a5 and Slc6a7); inorganic ions (Slc26a4), a putative nucleotide sugar (Slc35f4), and vesicular glutamate (Slc17a8). The second cluster includes upregulated genes encoding transporters of monocarboxylate (Slc16a12, Slc16a13), mitochondrial and facilitative nucleoside transporters (Slc25a47 and Slc29a3, respectively), and one that transports zinc to the cell (Slc39a2). The third cluster is represented by a single upregulated Slc38a2 gene encoding amino acid transporters.
The upregulated Slc16a13 gene showed the largest number of correlative connections, including positive correlation with the upregulated Slc29a3 gene and negative correlation with all five downregulated genes: Slc5a5, Slc6a7, Slc17a8, Slc26a4, and Slc35f4 (Table S3).
3.4. Overlapping of the Slc DEGs in Three Brain Structures
From the data presented in Table 1, it can be seen that there is not a single Slc DEG common to all three brain regions. Only two genes (Slc29a4 and Slc17a7) altered their expression in the same way in both the VTA and NAcc regions. The Slc17a8 gene was upregulated in the VTA and downregulated in the PFC. Similarly, the Slc38a2 and Slc16a12 gene expression was downregulated in the NAcc and upregulated in the PFC. The Slc5a5 was downregulated in the NAcc and PFC. The other Slc DEGs changed level of transcription in only one of the three brain regions studied.
3.5. PCA of the Slc DEGs
To assess the degree of brain region-specific expression of genes of interest, we performed the PCA based on the covariation of 49 genes using the expression profiles of 18 samples, which comprised RNA-Seq FPKM data for three brain regions (Figure 5).
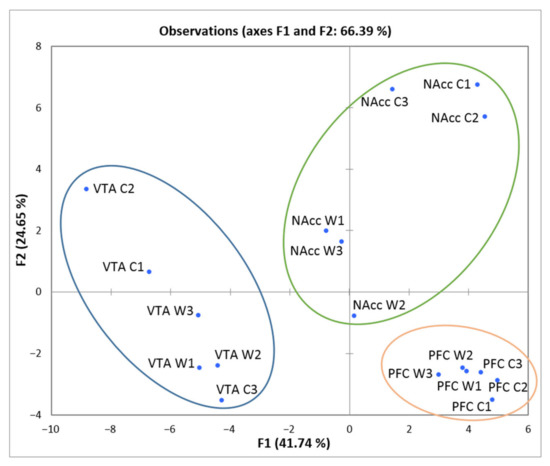
Figure 5.
PCA plot based on covariation of genes using the expression profiles of 48 Slc genes across 18 samples, which comprised RNA-Seq FPKM data for three brain regions. Ovals correspond to brain regions. W1, W2, W3: winners; C1, C2, C3: controls; VTA: ventral tegmental area, NAcc: nucleus accumbens; PFC: prefrontal cortex. The figure shows a distinct clustering of the three brain regions.
We observed compact clustering of samples in the VTA, NAcc, and PFC based on gene expression profiles. Within the circled area one may observe the compact clustering of aggressive vs. control males, especially in the NAcc, where the vast majority of DEGs concordantly changed expression downwards in the winners. Compact clustering of samples underscores the distinct expression patterns of considered genes in each brain region.
The PCA biplot analysis based on covariation of the gene expression profiles of six samples for each brain region (Figure 6) demonstrated distinct intergroup clustering of Slc DEGs. All three graphs represent the correlated clusters of Slc DEGs directed oppositely, which reflects the increased and decreased levels of gene transcription.
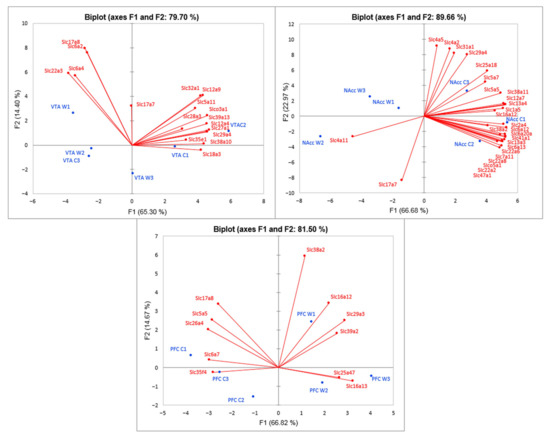
Figure 6.
PCA biplot based on covariation of Slc DEGs using the expression profiles, which comprised RNA-Seq FPKM data for three brain regions. Red points: active variables; Blue points: active observations. W1, W2, W3: winners; C1, C2, C3: controls. Figure demonstrates distinct intergroup clustering of Slc DEGs. VTA: ventral tegmental area, NAcc: nucleus accumbens; PFC: prefrontal cortex.
3.6. Cell-Specific DEGs Distribution
Analysis of cell-specific DEGs distribution based on Glia specification from Barres Laboratory data [48] have demonstrated (Table S5) that in the VTA and NAcc most of the Slc DEGs may participate in glial processes. The most significant changes in the level of transcription of Slc genes were found in NAcc. Here we would like to emphasize that these changes concern primarily the function of glial cells. In PFC, an increase in the level of Slc DEGs transcription is also associated with processes in glial cells, while a decrease in Slc DEGs expression is mainly associated with processes in neurons.
4. Discussion
It is suggested that the altered expression of the Slc genes encoding the transporters can serve as a marker for altered function of substrates, including neurotransmitters [3,5]. Our data confirmed the hypothesis that the expression level of genes encoding transporter proteins can be a measure of the activity of corresponding transmitters [50]. We revealed the positive correlation between the expression of genes encoding monoamine synthesis enzymes and the expression of the Slc6a genes encoding the corresponding transporters in brain regions. For example: the expression of the Slc6a4 gene, encoding the serotonin transporter, significantly correlates with the expression of the Tph2 gene, encoding the rate-limiting enzyme for serotonin synthesis. Expression of the Slc6a2 gene, encoding the noradrenaline transporter, correlates with the expression of the Dbh gene encoding dopamine β-enzyme involved in the synthesis of noradrenaline from dopamine; the expression of the Slc6a3 gene encoding the dopamine transporter was correlated with the expression of the Th gene, encoding the rate-limiting enzyme for dopamine synthesis. In addition, Tph2 gene expression indices correlated with the Slc6a2 and Slc6a3 gene expression [50].
Thus, we can take into consideration that changes in expression of the Slc DEGs have proven to be valuable and sensible markers in RNA-Seq studies, accurately reflecting specific neuroactivity and metabolic processes in the response to chronic social stress and aggression experiences described in previous publications [13,15,17,20].
Here, we assessed changes in the expression of the Slc genes in three specific brain regions (VTA, NAcc, PFC), biochemical processes in which can have a significant impact on the manifestation of behavioral features. When comparing gene expression in the control and aggression experienced male mice, we found a significant decrease in the level of transcription of many Slc genes, which is most pronounced in the VTA and NAcc.
We observed the decrease of neurosignaling and metabolic activity in the NAcc and VTA with sets of the Slc DEGs. The vast majority of the Slc DEGs across three brain regions refer to transmembrane transport. Notably, the genes manifest highly coordinated responses yielding the statistical confidence of non-random expression downturn (Figure 6) in the Slc DEGs set of the NAcc, which is a unique projection for such a complex and multifunctional region featuring multiple neurosignaling processes. Paradoxically, the Slc network signaling was not so unambiguous for the VTA and PFC regions due to a larger variation in species group expression. Still, the major gene networks incorporating Slc DEGs were elucidated there as well.
It is natural to assume that changes in expression profiles of all Slc genes in the VTA, NAcc, and PFC regions can be associated with psychosis-like behavioral pathology developed under long-term positive fighting experience, as shown in our works [10,11,14]. Experiments revealed that the number and set of Slc DEGs clearly indicate the differences in neurochemical processes in each brain region of the winners.
It is known that in the VTA dopaminergic neurons play the most significant role in the mechanisms of positive reinforcement of any forms of learned appetitive and motivational behaviors as well as addiction [26,51]. Disturbances in dopaminergic activity are noted in schizophrenia, Parkinson’s disease, attention deficit hyperactivity disorder [52,53], and depression [26,54]. It has been suggested that cellular and molecular adaptations are responsible for a sensitized dopamine activity in this brain region in response to drug abuse [55,56,57]. In the VTA of addicted individuals, the activity of the dopamine-synthesizing enzyme tyrosine hydroxylase increases, and so does the ability of dopaminergic neurons to respond to excitatory inputs [58]. These changes may be accompanied by changes in the expression of addiction-associated dopaminergic genes. Previous experiments in animals also showed that the dopaminergic systems were activated in the VTA of aggressive rats, as dopamine levels were elevated in the NAcc before, during, and after fights [59,60]. Our results described earlier and presented in this work are in good agreement with these concepts. Earlier in our experiments, we showed that the activation of dopaminergic systems in the brain regions of winners [20] is accompanied by increased dopaminergic Th, Slc6a3, and Snca gene expression in the VTA [15,17] and by the development of psychosis-like behavior and addictive symptoms [14,61,62] under positive fighting experience.
This experiment allowed us to expand the list of involved genes, and we can conclude that the upregulation of the genes encoding monoaminergic (Slc6a2, Slc6a4) together with the Slc6a3 gene [15,17] and glutamatergic vesicular transporters (Slc17a7, Slc17a8) in the VTA may indicate activation of respective neurotransmitter systems in the winners in response to positive fighting experience. We would like to emphasize that the upregulated Slc17a7 gene encodes VGLUT1 protein, which is used as an excitatory synapse marker. Such long-term activation may lead to a deficit of neurotransmitters in the synaptic cleft and be a cause of repetitive aggressive behavior (relapse) in provoking situations. However, downregulation of genes encoding vesicular transporters of acetylcholine (Slc18a3), sodium-coupled nucleoside transporters (Slc28a3, Slc29a4), putative sodium-coupled neutral amino acid transporter (Slc38a10), and inhibitory vesicular amino acid GABA and glycine (Slc32a1) transporter indicates disturbances of the transport of substrates into synaptic vesicles, thereby exposing them to catabolism processes. We found positive correlation between the expression of genes, which may be due to the activation of glutamatergic neurotransmission, and the inhibition of GABA transport to the vesicles.
The longest list of Slc DEGs was found in the NAcc analysis. All Slc DEGs (except Slc4a11 and Slc17a7) were downregulated, suggesting a significant decrease in transport functions for many substrates which are involved in cellular and neurotransmitter processes: glucose and sugar, neurotransmitters, amino acids, inorganic and organic transporters, etc. Our data suggest that the activation of dopaminergic inputs from the VTA, including Slc carriers, modulates (decreases) the activity of GABAergic neurons within the NAcc.
Analysis of cell-specific Slc DEGs distribution based on Glia specification patterns (neurons, glial cells (astrocytes, oligodendrocyte precursor, newly formed oligodendrocyte, myelinating oligodendrocyte, microglia), and endothelial cells) from Barres Laboratory data have demonstrated (Table S5) that in the VTA and NAcc most of the Slc DEGs may participate in glial processes. In the PFC, a decrease in the level of Slc DEGs transcription is associated with processes in glial cells, while an increase in Slc DEGs expression is associated with processes in neurons. Overall, the downregulation of the Slc DEGs is mainly associated with glial effects influenced by the experience of aggression in mice. Thus, in the PFC, VTA, and NAcc most of the Slc DEGs refer predominantly to glial cells (4, 10, and 13 correspondingly; Table S5). While the neural specific DEGs were overall quite a few, in PFC there is a distinct cluster of five neurospecific transporters (Figure 6; Table S5) behaving in a coordinated manner and downregulated in aggressive mice. All of them manifest transmembrane transporter activity. Two are encoding neurotransmitters: (a) proline transporter (Slc6a7) involved in GABA neurotransmission cascade and at the same time very distinct in pharmacological specificity, and (b) (Slc17a8) glutamate vesicular transporter. As both are downregulated, we may speculate that at least glutamate transmission in the PFC in aggressive species is reduced along with GABA intensity. Notably, two others genes (Slc26a4 and Slc5a5), are involved in iodide transport which is also linked to glutamate/GABA expression alterations in the PFC.
Converging evidence from earlier [59,63,64,65,66,67,68] and more recent [27,69,70] studies have supposed that aggression is rewarding. Positive fighting experience in daily agonistic interactions leads to the activation of dopaminergic systems, in particular in the NAcc, dorsal striatum, and amygdala, as shown earlier [20,59,60]. Our research demonstrates upregulation of the Slc6a2, Slc6a3, Slc6a4, Slc17a7, and Slc17a8 neurotransmitter genes, which may be a consequence of the co-activation of monoaminergic and glutamatergic systems in the VTA, a core region in aggression and addiction circuits. As for inorganic and organic or other carriers, changes in Slc gene expression may be a consequence rather than a cause of changes in the activity of neurotransmitters in brain regions.
5. Conclusions
Our findings show that in male mice with repeated experience of aggression, altered activity of neurotransmitter systems, especially the dopaminergic one, leads to a restructuring of metabolic and neurotransmitter processes in a way specific for each brain region. It can be assumed that an overall decrease in the expression of Slc genes may be ascribed to the chronic stimulation of the reward systems [14,61].
When analyzing these findings, it was natural to ask: what processes lead to the downregulation of most Slc genes encoding different types of substrate-specific transporter proteins in the VTA and NAcc? It is very important to glean knowledge about this phenomenon because transporters are considered to be promising therapeutic targets in the treatment of many diseases [5]. It has been shown that natural rewards, such as food (glucose) and sex, as well as pharmacological manipulations are accompanied by the activation of dopaminergic systems and reduce the electrophysiological excitability of GABA-containing MSNs in the NAcc [71,72]. In our model, aggression is developed against the background of positive reinforcement, and a decrease in the expression of the Slc genes may indicate the inactivation of the NAcc, which is consistent with literature data that rewarding stimuli reduce the activity of NAcc MSNs, whereas aversive stimuli increase the activity of these neurons through inhibitory functions of the NAcc D2 receptor, which plays a critical role in the reward mechanism [71]. If so, then the key genes may rather be the genes that are responsible for electrical impulse conduction, i.e., genes encoding inorganic substrate transporters. These data should be taken into consideration to explain the overall decrease in the expression of most Slc genes in the VTA and NAcc.
Thus, the psychosis-like state developed under repeated positive fighting experience and accompanied by addiction-like symptoms shown in our winners [10,14,61], similar to chronic drug use [39,73], involves alterations in gene expression in the mesocorticolimbic systems. Dopamine-dependent rewarding attenuates the overall excitability of GABAergic neurons, and these processes are exhibited in the decreased expression of many Slc* genes encoding transporters of amino acids, glucose, nucleoside sugars, neurotransmitters, vesicular transporters, and inorganic and organic ions, which leads to changes in signaling cascades through reduced activation of GABAergic MSNs in the NAcc, and thereby to decreased inhibitory control of aggression [71].
We should stress that the Slc gene family vector space manifests resolution high enough to accurately separate both brain regions and contrast groups in virtually all gene regions, which renders its application as a highly specific marker system outlined in this and other publications. Although the interpretation of these findings warrants further investigation with the inclusion of other correlated / relevant genes, altered expression of Slc genes set may be treated as primary marker scaffold in brain RNA-Seq studies.
However, according to available data, no contemporary drugs have been developed specifically to activate SLC transporters. It is very important to find new targets for correction of metabolic and neurotransmitter processes implicated in the pathological states. Altered expression of the Slc genes characterized by the largest number of correlations with other gene expression may serve as a prognostic target and a tool to search for new drug generation.
The Innovative Medicines Initiative Consortium RESOLUTE [74] has begun developing tools and producing datasets to develop new approaches to studying the SLC superfamily as a possible drug target class. We very much hope that the results of our study will be a useful contribution to this research.
6. Limitations
One of the limitations of whole transcriptome analysis is the high cost of research, which does not allow for the taking of a large number of samples, in our case, in comparative analysis of transcriptomes of control and experimental samples for statistical analysis. Nevertheless, a number of studies have demonstrated that the results of the RNA-Seq analysis show high levels of reproducibility for both technical and biological replicas [75,76]. Comparison of the RNA-Seq results with the qPCR data show a high correlation (r = 0.98), which was obtained by various authors, including in our previous studies [75,77]. Therefore, the small number of repetitions that are commonly used in this analysis is usually not considered a critical limitation of this method.
Additionally, we would like to point out the fact, as second limitation, that genes that are only slightly outside the accepted threshold of a statistically significant value of q < 5% fall out of the field of view of researchers. However, we believe that even small changes in the level of gene expression can have physiologically important consequences. This is indicated by the fact that cellular signaling can be dose-dependent [78]. Considering that a small number of samples were used in our work in order not to lose functionally important genes, which for random reasons were not included in the list of differentially expressed genes in accordance with the q criterion, we present data in the article taking into account not only the q value, but also the p value.
Supplementary Materials
The following are available online at https://www.mdpi.com/article/10.3390/genes12071099/s1: Table S1: Expression level (FPKM) of the Slc DEGs in the VTA, Nacc, and PFC; Table S2: AHС based on expression profiles of the Slc DEGs in the VTA, NAcc, and PFC; Table S3: Correlation coefficients between the Slc DEGs in the VTA, NAcc, and PFC; Table S4: Agglomerative hierarchical clustering (AHC) genes encoding Slc transporters and neurotransmitter receptors in the NAcc in winners and control mice; Table S5: Cell-specific DEGs distribution based on Glia specification from (Zhang et al., 2014) data.
Author Contributions
Conceptualization, V.N.B., O.E.R., and N.N.K.; Data curation, D.A.S., V.N.B., O.E.R., and N.N.K.; Formal analysis, D.A.S., V.N.B., and O.E.R.; Funding acquisition, N.N.K.; Investigation, D.A.S., I.L.K., and A.G.G.; Methodology, N.N.K.; Project administration, N.N.K.; Resources, D.A.S., I.L.K., and A.G.G.; Supervision, N.N.K.; Visualization, D.A.S., V.N.B., and O.E.R.; Writing—original draft, D.A.S., V.N.B., O.E.R., and N.N.K.; Writing—review & editing, D.A.S., V.N.B., O.E.R., and N.N.K. All authors gave final approval of the text of the manuscript. All authors have read and agreed to the published version of the manuscript. Informed consent was obtained from all co-authors involved in the study.
Funding
This research was funded by the Russian Science Foundation, grant No 19-15-00026 and FRC ICG SB RAS—BP No 0259-2021-0016.
Institutional Review Board Statement
All procedures were in compliance with the European Communities Council Directive 210/63/EU on 22 September 2010. The study was approved by the Bioethical Commission (Scientific Council No 9) at the Institute of Cytology and Genetics SD RAS of 24 March 2010, No 613 (Novosibirsk).
Informed Consent Statement
Not applicable.
Data Availability Statement
The additional statistics of data obtained used to support the findings of this study are available from Supplementary Table S1: differentially expressed Slc genes in FPKM units and are cited at relevant places within the text. The other datasets generated during the current study are available from the corresponding author on reasonable request.
Acknowledgments
We thank O.A. Kharlamova for stylistic assistance in writing the manuscript. Preparation and maintenance of experimental animals was carried out in the vivarium of the Institute of Cytology and Genetics SB RAS and was funded under ICG SB RAS—BP No 0259-2021-0016. This work was supported by the Russian Science Foundation (grant No 19-15-00026 to N.N.K.). There is no role of the funding body in the design of the study and collection, analysis, and interpretation of data, and in the writing the manuscript.
Conflicts of Interest
The authors declare no conflict of interest. The funders had no role in the design of the study; in the collection, analyses, or interpretation of data; in the writing of the manuscript, or in the decision to publish the results.
Abbreviations
| MSN | medium spiny neurons |
| Slc | solute carrier family |
| PCA | principal component analysis |
| AHC | agglomerative hierarchical clustering |
| FPKM | fragments per kilobase of transcript per million mapped reads |
| VTA | ventral tegmental area |
| NAcc | nucleus accumbens |
| PFC | prefrontal cortex |
| W | winners |
| C | controls |
References
- SLC Tables. Available online: http://slc.bioparadigms.org/ (accessed on 11 May 2021).
- He, L.; Vasiliou, K.; Nebert, D.W. Analysis and update of the human solute carrier (SLC) gene superfamily. Hum. Genom. 2009, 3, 195–206. [Google Scholar] [CrossRef] [Green Version]
- Cesar-Razquin, A.; Snijder, B.; Frappier-Brinton, T.; Isserlin, R.; Gyimesi, G.; Bai, X.; Reithmeier, R.A.; Hepworth, D.; Hediger, M.A.; Edwards, A.M.; et al. A Call for systematic research on solute carriers. Cell 2015, 162, 478–487. [Google Scholar] [CrossRef] [Green Version]
- Saier, M.H., Jr.; Reddy, V.S.; Tsu, B.V.; Ahmed, M.S.; Li, C.; Moreno-Hagelsieb, G. The Transporter Classification Database (TCDB): Recent advances. Nucleic Acids Res. 2016, 44, D372–D379. [Google Scholar] [CrossRef] [Green Version]
- Lin, L.; Yee, S.W.; Kim, R.B.; Giacomini, K.M. SLC transporters as therapeutic targets: Emerging opportunities. Nat. Rev. Drug Discov. 2015, 14, 543–560. [Google Scholar] [CrossRef] [Green Version]
- Jankovic, J.; Clarence-Smith, K. Tetrabenazine for the treatment of chorea and other hyperkinetic movement disorders. Expert Rev. Neurother. 2011, 11, 1509–1523. [Google Scholar] [CrossRef] [PubMed]
- Nickell, J.R.; Siripurapu, K.B.; Vartak, A.; Crooks, P.A.; Dwoskin, L.P. The vesicular monoamine transporter-2: An important pharmacological target for the discovery of novel therapeutics to treat methamphetamine abuse. Adv. Pharmacol. 2014, 69, 71–106. [Google Scholar] [CrossRef] [Green Version]
- Harvey, R.J.; Yee, B.K. Glycine transporters as novel therapeutic targets in schizophrenia, alcohol dependence and pain. Nat. Rev. Drug Discov. 2013, 12, 866–885. [Google Scholar] [CrossRef] [PubMed]
- Kudryavtseva, N.N.; Bondar, N.P.; Avgustinovich, D.F. Association between experience of aggression and anxiety in male mice. Behav. Brain Res. 2002, 133, 83–93. [Google Scholar] [CrossRef]
- Kudryavtseva, N.N. Psychopathology of repeated aggression: A neurobiological aspect. In Perspectives on the Psychology of Aggression; Morgan, J.P., Ed.; NOVA Science Publishers: New York, NY, USA, 2006; pp. 35–64. [Google Scholar]
- Kudryavtseva, N.N.; Smagin, D.A.; Kovalenko, I.L.; Vishnivetskaya, G.B. Repeated positive fighting experience in male inbred mice. Nat. Protoc. 2014, 9, 2705–2717. [Google Scholar] [CrossRef] [PubMed]
- Kovalenko, I.L.; Smagin, D.A.; Galyamina, A.G.; Kudryavtseva, N.N. Hyperactivity and abnormal exploratory activity developing in the CD-1 male mice under chronic experience of aggression and social defeats in daily agonistic interactions. J. Behav. Brain Sci. 2015, 5, 478–490. [Google Scholar] [CrossRef] [Green Version]
- Smagin, D.A.; Galyamina, A.G.; Kovalenko, I.L.; Babenko, V.N.; Tamkovich, N.V.; Borisov, S.A.; Tolstikova, T.G.; Kudryavtseva, N.N. Differentially expressed neurotransmitter genes in the dorsal striatum of male mice with psychomotor disturbances. Zhurnal Vyss. Nervn. Deyatelnosti Im. IP Pavlov. 2018, 68, 227–249. [Google Scholar]
- Kudryavtseva, N.N. Positive fighting experience, addiction-like state, and relapse: Retrospective analysis of experimental studies. Aggress. Violent Behav. 2020, 52. [Google Scholar] [CrossRef]
- Filipenko, M.L.; Alekseyenko, O.V.; Beilina, A.G.; Kamynina, T.P.; Kudryavtseva, N.N. Increase of tyrosine hydroxylase and dopamine transporter mRNA levels in ventral tegmental area of male mice under influence of repeated aggression experience. Mol. Brain Res. 2001, 96, 77–81. [Google Scholar] [CrossRef]
- Filipenko, M.L.; Beylina, A.G.; Alekseyenko, O.V.; Timofeeva, O.A.; Avgustinovich, D.F.; Kudryavtseva, N.N. Association between brain COMT gene expression and aggressive experience in daily agonistic confrontations in male mice. In Stress: Neural, Endocrine and Molecular Studies; McCarty, R., Aguilera, G., Sabban, E., Kvetnyansky, R., Eds.; Taylor & Francis: New York, NY, USA, 2002; pp. 157–161. [Google Scholar]
- Bondar, N.P.; Boyarskikh, U.A.; Kovalenko, I.L.; Filipenko, M.L.; Kudryavtseva, N.N. Molecular implications of repeated aggression: Th, Dat1, Snca and Bdnf gene expression in the VTA of victorious male mice. PLoS ONE 2009, 4, e4190. [Google Scholar] [CrossRef] [PubMed]
- Kudriavtseva, N.N.; Filipenko, M.L.; Bakshtanovskaia, I.V.; Avgustinovich, D.F.; Alekseenko, O.V.; Beilina, A.G. Changes in the expression of monoaminergic genes under the influence of repeated experience of agonistic interactions: From behavior to gene. Russ. J. Genet. 2004, 40, 732–748. [Google Scholar] [CrossRef]
- Smagin, D.A.; Boyarskikh, U.A.; Bondar, N.P.; Filipenko, M.L.; Kudryavtseva, N.N. Reduction of serotonergic gene expression in the midbrain raphe nuclei under positive fighting experience. Adv. Biosci. Biotechnol. 2013, 4, 36–44. [Google Scholar] [CrossRef] [Green Version]
- Kudriavtseva, N.N.; Bakshtanovskaia, I.V. The neurochemical control of aggression and submission. Zhurnal Vyss. Nervn. Deiatelnosti Im. IP Pavlov. 1991, 41, 459–466. [Google Scholar]
- Schultz, W. Predictive reward signal of dopamine neurons. J. Neurophysiol. 1998, 80, 1–27. [Google Scholar] [CrossRef] [PubMed]
- Dayan, P.; Balleine, B.W. Reward, motivation, and reinforcement learning. Neuron 2002, 36, 285–298. [Google Scholar] [CrossRef] [Green Version]
- Wise, R.A. Dopamine, learning and motivation. Nat. Rev. Neurosci. 2004, 5, 483–494. [Google Scholar] [CrossRef]
- Berridge, K.C. The debate over dopamine’s role in reward: The case for incentive salience. Psychopharmacology 2007, 191, 391–431. [Google Scholar] [CrossRef] [PubMed]
- Ikemoto, S. Dopamine reward circuitry: Two projection systems from the ventral midbrain to the nucleus accumbens-olfactory tubercle complex. Brain Res. Rev. 2007, 56, 27–78. [Google Scholar] [CrossRef] [PubMed] [Green Version]
- Russo, S.J.; Nestler, E.J. The brain reward circuitry in mood disorders. Nat. Rev. Neurosci. 2013, 14, 609–625. [Google Scholar] [CrossRef] [Green Version]
- Aleyasin, H.; Flanigan, M.E.; Russo, S.J. Neurocircuitry of aggression and aggression seeking behavior: Nose poking into brain circuitry controlling aggression. Curr. Opin. Neurobiol. 2018, 49, 184–191. [Google Scholar] [CrossRef] [PubMed]
- Kudryavtseva, N.N. A sensory contact model for the study of aggressive and submissive behavior in male-mice. Aggress. Behav. 1991, 17, 285–291. [Google Scholar] [CrossRef]
- The Allen Mouse Brain Atlas. Available online: http://mouse.brain-map.org/static/atlas (accessed on 24 April 2005).
- Margolis, E.B.; Lock, H.; Hjelmstad, G.O.; Fields, H.L. The ventral tegmental area revisited: Is there an electrophysiological marker for dopaminergic neurons? J. Physiol. 2006, 577, 907–924. [Google Scholar] [CrossRef]
- Sesack, S.R.; Grace, A.A. Cortico-Basal Ganglia reward network: Microcircuitry. Neuropsychopharmacology 2010, 35, 27–47. [Google Scholar] [CrossRef]
- Trutti, A.C.; Mulder, M.J.; Hommel, B.; Forstmann, B.U. Functional neuroanatomical review of the ventral tegmental area. Neuroimage 2019, 191, 258–268. [Google Scholar] [CrossRef] [Green Version]
- Walsh, J.J.; Han, M.H. The heterogeneity of ventral tegmental area neurons: Projection functions in a mood-related context. Neuroscience 2014, 282, 101–108. [Google Scholar] [CrossRef] [Green Version]
- Morales, M.; Margolis, E.B. Ventral tegmental area: Cellular heterogeneity, connectivity and behaviour. Nat. Rev. Neurosci. 2017, 18, 73–85. [Google Scholar] [CrossRef]
- Bourdy, R.; Barrot, M. A new control center for dopaminergic systems: Pulling the VTA by the tail. Trends Neurosci. 2012, 35, 681–690. [Google Scholar] [CrossRef] [PubMed]
- Nair-Roberts, R.G.; Chatelain-Badie, S.D.; Benson, E.; White-Cooper, H.; Bolam, J.P.; Ungless, M.A. Stereological estimates of dopaminergic, GABAergic and glutamatergic neurons in the ventral tegmental area, substantia nigra and retrorubral field in the rat. Neuroscience 2008, 152, 1024–1031. [Google Scholar] [CrossRef] [Green Version]
- Yamaguchi, T.; Sheen, W.; Morales, M. Glutamatergic neurons are present in the rat ventral tegmental area. Eur. J. Neurosci. 2007, 25, 106–118. [Google Scholar] [CrossRef] [PubMed] [Green Version]
- The Nucleus Accumbens. Available online: https://en.wikipedia.org/wiki/Nucleus_accumbens (accessed on 11 May 2021).
- Robison, A.J.; Nestler, E.J. Transcriptional and epigenetic mechanisms of addiction. Nat. Rev. Neurosci. 2011, 12, 623–637. [Google Scholar] [CrossRef] [PubMed] [Green Version]
- Meredith, G.E.; Pennartz, C.M.; Groenewegen, H.J. The cellular framework for chemical signalling in the nucleus accumbens. Prog. Brain Res. 1993, 99, 3–24. [Google Scholar] [CrossRef]
- Olsen, C.M. Natural rewards, neuroplasticity, and non-drug addictions. Neuropharmacology 2011, 61, 1109–1122. [Google Scholar] [CrossRef] [Green Version]
- Alvarez, J.A.; Emory, E. Executive function and the frontal lobes: A meta-analytic review. Neuropsychol. Rev. 2006, 16, 17–42. [Google Scholar] [CrossRef]
- Steketee, J.D. Neurotransmitter systems of the medial prefrontal cortex: Potential role in sensitization to psychostimulants. Brain Res. Rev. 2003, 41, 203–228. [Google Scholar] [CrossRef]
- Del Arco, A.; Mora, F. Neurotransmitters and prefrontal cortex-limbic system interactions: Implications for plasticity and psychiatric disorders. J. Neural Transm. 2009, 116, 941–952. [Google Scholar] [CrossRef] [PubMed]
- Trapnell, C.; Hendrickson, D.G.; Sauvageau, M.; Goff, L.; Rinn, J.L.; Pachter, L. Differential analysis of gene regulation at transcript resolution with RNA-seq. Nat. Biotechnol. 2013, 31, 46–53. [Google Scholar] [CrossRef]
- Boyarskikh, U.A.; Bondar, N.P.; Filipenko, M.L.; Kudryavtseva, N.N. Downregulation of serotonergic gene expression in the Raphe nuclei of the midbrain under chronic social defeat stress in male mice. Mol. Neurobiol. 2013, 48, 13–21. [Google Scholar] [CrossRef]
- Kudryavtseva, N.N.; Smagin, D.A.; Kovalenko, I.L.; Galyamina, A.G.; Vishnivetskaya, G.B.; Babenko, V.N.; Orlov, Y.L. Serotonergic genes in the development of anxiety/depression-like state and pathology of aggressive behavior in male mice: RNA-seq data. Mol. Biol. 2017, 51, 251–262. [Google Scholar] [CrossRef]
- Zhang, Y.; Chen, K.; Sloan, S.A.; Bennett, M.L.; Scholze, A.R.; O’Keeffe, S.; Phatnani, H.P.; Guarnieri, P.; Caneda, C.; Ruderisch, N.; et al. An RNA-sequencing transcriptome and splicing database of glia, neurons, and vascular cells of the cerebral cortex. J. Neurosci. 2014, 34, 11929–11947. [Google Scholar] [CrossRef]
- Babenko, V.N.; Smagin, D.A.; Kudryavtseva, N.N. RNA-Seq Mouse Brain Regions Expression Data Analysis: Focus on ApoE Functional Network. J. Integr. Bioinform. 2017, 14. [Google Scholar] [CrossRef]
- Babenko, V.N.; Smagin, D.A.; Kovalenko, I.L.; Galyamina, A.G.; Kudryavtseva, N.N. Differentially expressed genes of the Slc6a family as markers of altered brain neurotransmitter system function in pathological states in mice. Neurosci. Behav. Physiol. 2020, 50, 199–209. [Google Scholar] [CrossRef]
- Fields, H.L.; Hjelmstad, G.O.; Margolis, E.B.; Nicola, S.M. Ventral tegmental area neurons in learned appetitive behavior and positive reinforcement. Annu. Rev. Neurosci. 2007, 30, 289–316. [Google Scholar] [CrossRef] [PubMed] [Green Version]
- Grace, A.A. Phasic versus tonic dopamine release and the modulation of dopamine system responsivity: A hypothesis for the etiology of schizophrenia. Neuroscience 1991, 41, 1–24. [Google Scholar] [CrossRef]
- Tomasi, D.; Volkow, N.D. Functional connectivity of substantia nigra and ventral tegmental area: Maturation during adolescence and effects of ADHD. Cereb. Cortex 2014, 24, 935–944. [Google Scholar] [CrossRef] [Green Version]
- Polter, A.M.; Kauer, J.A. Stress and VTA synapses: Implications for addiction and depression. Eur. J. Neurosci. 2014, 39, 1179–1188. [Google Scholar] [CrossRef] [PubMed]
- Adinoff, B. Neurobiologic processes in drug reward and addiction. Harv. Rev. Psychiatry 2004, 12, 305–320. [Google Scholar] [CrossRef]
- Juarez, B.; Han, M.H. Diversity of Dopaminergic Neural Circuits in Response to Drug Exposure. Neuropsychopharmacology 2016, 41, 2424–2446. [Google Scholar] [CrossRef] [Green Version]
- Niehaus, J.L.; Cruz-Bermudez, N.D.; Kauer, J.A. Plasticity of addiction: A mesolimbic dopamine short-circuit? Am. J. Addict. 2009, 18, 259–271. [Google Scholar] [CrossRef] [Green Version]
- Tyrosine Hydroxylase. Available online: https://en.wikipedia.org/wiki/Tyrosine_hydroxylase (accessed on 11 May 2021).
- Miczek, K.A.; Faccidomo, S.P.; Fish, E.W.; DeBold, J.F. Neurochemistry and molecular neurobiology of aggressive behavior. In Handbook of Neurochemistry and Molecular Neurobiology: Behavioral Neurochemistry; Lajtha, A., Blaustein, J.D., Eds.; Springer: Berlin/Heidelberg, Germany, 2007; pp. 285–336. [Google Scholar]
- Van Erp, A.M.; Miczek, K.A. Aggressive behavior, increased accumbal dopamine, and decreased cortical serotonin in rats. J. Neurosci. 2000, 20, 9320–9325. [Google Scholar] [CrossRef] [Green Version]
- Kudryavtseva, N.N. Straub tail, the deprivation effect and addiction to aggression. In Motivation of Health Behavior; O’Neal, P.W., Ed.; NOVA Science Publishers: New York, NY, USA, 2007; pp. 97–110. [Google Scholar]
- Kudryavtseva, N.N.; Smagin, D.A.; Bondar, N.P. Modeling fighting deprivation effect in mouse repeated aggression paradigm. Prog. Neuro-Psychopharmacol. Biol. Psychiatry 2011, 35, 1472–1478. [Google Scholar] [CrossRef]
- Moyer, K.E. Violence and Aggression; Paragon House: New York, NY, USA, 1987. [Google Scholar]
- Scott, J.P. Agonistic behavior of mice and rats: A review. Am. Zool. 1966, 6, 683–701. [Google Scholar] [CrossRef] [PubMed]
- Scott, J.P. Theoretical issues concerning the origin and causes of fighting. In The Physiology of Aggression and Defeat; Eleftheriou, B.E., Scott, J.P., Eds.; Plenum: New York, NY, USA, 1971; pp. 11–42. [Google Scholar]
- Brain, P.F. The adaptiveness of house mouse aggression. In House Mouse Aggression. A Model for Understanding the Evolution of Social Behavior; Brain, P.F., Mainardi, D., Parmigiani, S., Eds.; Harwood Academic Publishers: Chur, Switzerland, 1979; pp. 1–21. [Google Scholar]
- Ramirez, J.M.; Bonniot-Cabanac, M.C.; Cabanac, M. Can aggression provide pleasure? Eur. Psychol. 2005, 10, 136–145. [Google Scholar] [CrossRef] [Green Version]
- Kudryavtseva, N.N. An experimental approach to the study of learned aggression. Aggress. Behav. 2000, 26, 241–256. [Google Scholar] [CrossRef]
- Golden, S.A.; Shaham, Y. Aggression addiction and relapse: A new frontier in psychiatry. Neuropsychopharmacology 2018, 43, 224–225. [Google Scholar] [CrossRef] [PubMed] [Green Version]
- Golden, S.A.; Jin, M.; Shaham, Y. Animal Models of (or for) Aggression reward, addiction, and relapse: Behavior and circuits. J. Neurosci. 2019, 39, 3996–4008. [Google Scholar] [CrossRef] [PubMed] [Green Version]
- Carlezon, W.A., Jr.; Thomas, M.J. Biological substrates of reward and aversion: A nucleus accumbens activity hypothesis. Neuropharmacology 2009, 56 (Suppl. 1), 122–132. [Google Scholar] [CrossRef] [Green Version]
- Day, J.J.; Carelli, R.M. The nucleus accumbens and Pavlovian reward learning. Neuroscientist 2007, 13, 148–159. [Google Scholar] [CrossRef]
- Steiner, H.; Van Waes, V. Addiction-related gene regulation: Risks of exposure to cognitive enhancers vs. other psychostimulants. Prog. Neurobiol. 2013, 100, 60–80. [Google Scholar] [CrossRef] [Green Version]
- Superti-Furga, G.; Lackner, D.; Wiedmer, T.; Ingles-Prieto, A.; Barbosa, B.; Girardi, E.; Goldmann, U.; Gurtl, B.; Klavins, K.; Klimek, C.; et al. The RESOLUTE consortium: Unlocking SLC transporters for drug discovery. Nat. Rev. Drug Discov. 2020, 19, 429–430. [Google Scholar] [CrossRef] [PubMed]
- Nagalakshmi, U.; Wang, Z.; Waern, K.; Shou, C.; Raha, D.; Gerstein, M.; Snyder, M. The transcriptional landscape of the yeast genome defined by RNA sequencing. Science 2008, 320, 1344–1349. [Google Scholar] [CrossRef] [PubMed] [Green Version]
- Cloonan, N.; Forrest, A.R.; Kolle, G.; Gardiner, B.B.; Faulkner, G.J.; Brown, M.K.; Taylor, D.F.; Steptoe, A.L.; Wani, S.; Bethel, G.; et al. Stem cell transcriptome profiling via massive-scale mRNA sequencing. Nat. Methods 2008, 5, 613–619. [Google Scholar] [CrossRef] [PubMed]
- Fedoseeva, L.A.; Klimov, L.O.; Ershov, N.I.; Efimov, V.M.; Markel, A.L.; Orlov, Y.L.; Redina, O.E. The differences in brain stem transcriptional profiling in hypertensive ISIAH and normotensive WAG rats. BMC Genom. 2019, 20, 297. [Google Scholar] [CrossRef] [PubMed]
- Hammack, S.E.; Pepin, J.L.; DesMarteau, J.S.; Watkins, L.R.; Maier, S.F. Low doses of corticotropin-releasing hormone injected into the dorsal raphe nucleus block the behavioral consequences of uncontrollable stress. Behav. Brain Res. 2003, 147, 55–64. [Google Scholar] [CrossRef]
Publisher’s Note: MDPI stays neutral with regard to jurisdictional claims in published maps and institutional affiliations. |
© 2021 by the authors. Licensee MDPI, Basel, Switzerland. This article is an open access article distributed under the terms and conditions of the Creative Commons Attribution (CC BY) license (https://creativecommons.org/licenses/by/4.0/).