Article

Folate Receptor β (FRβ) Expression in Tissue-Resident and Tumor-Associated Macrophages Associates with and Depends on the Expression of PU.1

by
Rafael Samaniego
1,*,
Ángeles Domínguez-Soto
2,*,
Manohar Ratnam
3,
Takami Matsuyama
4,
Paloma Sánchez-Mateos
5,
Ángel L. Corbí
2,† and
Amaya Puig-Kröger
6,†
1
Unidad de Microscopia Confocal, Instituto de Investigación Sanitaria Gregorio Marañón, Hospital General Universitario Gregorio Marañón, 28007 Madrid, Spain
2
Centro de Investigaciones Biológicas, CSIC, 28007 Madrid, Spain
3
Barbara Ann Karmanos Cancer Institute and Department of Oncology, Wayne State University, Detroit, MI 48202, USA
4
Department of Immunology, Graduate School of Medical and Dental Sciences, Kagoshima University, Kagoshima 890-8544, Japan
5
Laboratorio de Inmuno-Oncología, Instituto de Investigación Sanitaria Gregorio Marañón, Hospital General Universitario Gregorio Marañón, 28007 Madrid, Spain
6
Unidad de InmunoMetabolismo e Inflamación, Instituto de Investigación Sanitaria Gregorio Marañón, Hospital General Universitario Gregorio Marañón, 28007 Madrid, Spain
*
Authors to whom correspondence should be addressed.
Both authors contributed equally, and the order of authors should be considered arbitrary.
Cells 2020, 9(6), 1445; https://doi.org/10.3390/cells9061445
Submission received: 4 May 2020 / Revised: 2 June 2020 / Accepted: 8 June 2020 / Published: 10 June 2020
(This article belongs to the Special Issue Molecular and Cellular Basis of Autoimmune Diseases)

Abstract

:
As macrophages exhibit a huge functional plasticity under homeostasis and pathological conditions, they have become a therapeutic target for chronic inflammatory diseases. Hence, the identification of macrophage subset-specific markers is a requisite for the development of macrophage-directed therapeutic interventions. In this regard, the macrophage-specific Folate Receptor β (FRβ, encoded by the FOLR2 gene) has been already validated as a target for molecular delivery in cancer as well as in macrophage-targeting therapeutic strategies for chronic inflammatory pathologies. We now show that the transcriptome of human macrophages from healthy and inflamed tissues (tumor; rheumatoid arthritis, RA) share a significant over-representation of the “anti-inflammatory gene set”, which defines the gene profile of M-CSF-dependent IL-10-producing human macrophages (M-MØ). More specifically, FOLR2 expression has been found to strongly correlate with the expression of M-MØ-specific genes in tissue-resident macrophages, tumor-associated macrophages (TAM) and macrophages from inflamed synovium, and also correlates with the presence of the PU.1 transcription factor. In fact, PU.1-binding elements are found upstream of the first exon of FOLR2 and most M-MØ-specific- and TAM-specific genes. The functional relevance of PU.1 binding was demonstrated through analysis of the proximal regulatory region of the FOLR2 gene, whose activity was dependent on a cluster of PU.1-binding sequences. Further, siRNA-mediated knockdown established the importance of PU.1 for FOLR2 gene expression in myeloid cells. Therefore, we provide evidence that FRβ marks tissue-resident macrophages as well as macrophages within inflamed tissues, and its expression is dependent on PU.1.

1. Introduction

Macrophages are phagocytic cells present in all tissues, whose huge functional plasticity allows them to drive promotion and resolution of inflammatory responses. Regardless of their origin, tissue-resident macrophages perform essential functions for maintenance of homeostasis [1], and usually exhibit more reparative and anti-inflammatory tasks than newly recruited blood-borne tissue-infiltrating macrophages [2] during inflammatory responses in numerous tissues [3,4,5,6,7,8,9]. As a representative example, tissue-resident macrophages in the lining layer of inflamed joints express higher levels of IL-10 than infiltrating macrophages during rheumatoid arthritis [10,11]. Macrophage Colony-Stimulating Factor (M-CSF), constitutively present in serum, promotes the differentiation and survival of tissue-resident and monocyte-derived macrophages (M-MØ) [12,13,14,15], and drives the acquisition of their anti-inflammatory and immunosuppressive functions (IL10high TNFlow IL23low IL6low) [16,17,18,19,20]. As a representative example, M-CSF determines the development and maturation of Kupffer cells [21], which have been implicated in both immunogenic and tolerogenic functions [22,23]. M-CSF triggers the acquisition of a characteristic gene expression profile that includes an “anti-inflammatory gene set” [19,24,25,26,27], whose presence characterizes human-tissue-resident macrophages [27,28,29,30] as well as tumor-associated macrophages (TAM) in vivo [16]. In fact, targeting the M-CSF/M-CSF receptor axis has been shown to reduce the presence of anti-inflammatory TAM in various tumors [31,32,33].
The “anti-inflammatory gene set” includes 170 genes whose expression is associated with the potent production of IL-10 after M-MØ stimulation. The expression of the “anti-inflammatory gene set” is critically dependent on the MAFB transcription factor in vitro [34,35] and might be also under the control of MAF in vivo [36,37]. The FOLR2 gene is a member of the “anti-inflammatory gene set” that codes for the Folate Receptor β, a GPI-linked cell surface receptor with a high affinity for binding of folic acid (vitamin B9), whose physiologically reduced form (5-methyltetrahydrofolate) is a co-factor in one-carbon transfer reactions required for DNA and RNA synthesis, epigenetic processes, cellular proliferation and survival [38]. FRβ is a member of a family of reduced folate and folic acid receptors that also includes FRα, FRδ and FRγ, which differ in their respective cellular distribution and ligand selectivity [39]. While FRα is primarily expressed on the apical surface of epithelial cells and various tumors of epithelial origin [39,40,41], FRδ marks regulatory T cells and oocytes [42], and FRβ appears to be myeloid-restricted [43,44,45], although the molecular basis for its tissue-restricted expression remains unknown.
Macrophage reprogramming has been proposed as a therapeutic strategy for chronic inflammatory diseases [46]. Consequently, the identification of macrophage subset-specific markers is a requisite for the development of macrophage-directed therapeutic interventions for human pathologies. Because of its high affinity for folate binding and endocytosis, FRβ has been successfully used as a molecular target in therapeutic strategies for drug delivery and immune recognition in cancer and inflammatory pathologies [47,48]. In the present manuscript, we explore expression of FOLR2-encoded FRβ by tissue-resident macrophages in non-inflamed tissues and in TAM of various origins, and its correlation with the presence of genes commonly associated with the anti-inflammatory capacity of macrophages. Further, we investigate the dependence of the macrophage-specific expression of FOLR2 on the ETS-domain transcription factor PU.1, which is essential for terminal myeloid cell differentiation [49,50] and control of expression of the M-CSF receptor [51]. Our results indicate that FRβ is a useful marker for tissue-resident macrophages and macrophages within inflamed tissues, and that its expression correlates with and depends on the expression of the PU.1 transcription factor.

2. Materials and Methods

2.1. Cell Culture and Flow Cytometry

The human cell lines K562, THP-1 and HeLa were obtained from the Centro de Investigaciones Biológicas Cell line repository. The cell lines K562 and THP-1 were cultured in RPMI supplemented with 10% fetal calf serum (FCS) at 37 °C in a humidified atmosphere with 5% CO2. HeLa cells were maintained in DMEM supplemented with 10% FCS. Monocyte-derived macrophages M-MØ were generated in the presence of M-CSF, as previously described [34]. Phenotypic analysis was carried out by indirect immunofluorescence using a mouse anti-human-FRβ antibody [52] and using isotype-matched monoclonal antibody as a negative control. Folate-FITC endocytosis assays were done as previously reported [45].

2.2. Transfections, Plasmids, and Site-Directed Mutagenesis

In reporter gene experiments, the FOLR2-based reporter gene construct pFOLR2-200Luc [19] was transfected in HeLa cells using Superfect (Qiagen, Hilden, Germany) and in THP-1 cells through the use of the Cell Line Nucleofector Kit V (Amaxa, Cologne, Germany). The amount of DNA in each transfection was normalized by using the corresponding insertless expression vector (CMV-Ø) as a carrier. Each transfection experiment was performed at least three times with different DNA preparations. Transfection efficiencies were normalized by co-transfection with the pCMV-ßgal plasmid, and β-galactosidase levels were determined using the Galacto-Light kit (Tropix, Bedford, MA 01730, USA). The PU.1 expression plasmid has been previously described [53]. Site-directed mutagenesis on the pFOLR2-200Luc promoter construct was done using the QuikChange System (Stratagene, La Jolla, CA 92037, USA). For mutation of the PU.1-64 and PU.1-60 elements, the oligonucleotides PU.1-64mutS (5′CCTTGAAGAGGGTGGGGTGACGATCCGATGGAAGAGAGGAAGGAGAATAG-3′) and PU.1-64mutAS (5′-CTATTCTCCTTCCTCTCTTCCATCGGATCGTCACCCCACCCTCTTCAAGG-3′) were used, and the resulting plasmid was termed pFOLR2-200PUmut2Luc. Generation of the pFOLR2-200PUmut4Luc plasmid, where the PU.1-binding sequences PU.1-64, PU.1-60, PU.1-55 and PU.1-47 are mutated, was accomplished by site-directed mutagenesis on the pFOLR2-200PUmut3Luc plasmid, using the oligonucleotides PU.1-47S (5′-GGTGACGATCCGATCGATGACTCGATGGAGAATAGCTAAGTAGGG-3′) and PU.1-47AS (5′-CCCTACTTAGCTATTCTCCATCGAGTCATCGATCGGATCGTCACC-3′). DNA constructs and mutations were confirmed by DNA sequencing. DNA sequencing was performed at the Genomics Unit of the Hospital General Universitario Gregorio Marañón.

2.3. Melanoma Xenograft Model

Immunodeficient NOD-scid-IL2Rgnull (NSG) mice (The Jackson Laboratory, Bar Harbor, ME 04609, USA) were maintained under specific pathogen-free conditions. Male mice (4–6 weeks of age) were subcutaneously inoculated with 106 BLM melanoma cells. When tumors reached approximately 1 cm in width (approximately at day 14th), mice were euthanized and tumors were resected and frozen for histologic analyses. This procedure was approved by the IiSGM animal care/use and Comunidad de Madrid committees (PROEX-084/18).

2.4. Confocal Microscopy and Immunohistochemistry

Normal skin samples were obtained from abdominoplasty. Normal colon and muscle samples were localized adjacent to tumor and obtained from colon adenocarcinoma and melanoma patients. Informed consent was obtained, and all the procedures were performed following Medical Ethics Committee (Hospital General Universitario Gregorio Marañón) guidance. Thick sections (4 μm in depth) of cryopreserved tissue were first blocked for 10 min with 1% human immunoglobulins and then incubated for 1 h with either a mouse monoclonal antibody against human FRβ [52], a rat monoclonal antibody against murine FRβ [48], an anti-CD163 monoclonal antibody (clone Ber-Mac3, MBL International Corp., Woburn, MA 01801, USA), an anti-Von Willebrand factor (rabbit polyclonal, Dako, Santa Clara, CA 95051, USA), an anti-F4/80 (clone BM8, labeled with Alexa Fluor 647, Biolegend, San Diego, CA 92121, USA), or isotype-matched control antibodies. All primary antibodies were used at 1–5 μg/mL, followed by incubation with Cy3-labeled anti-mouse and Cy5-labeled anti-rabbit secondary antibodies. Tissues were imaged with the 20X PL-APO NA 0.7 immersion objective of a confocal scanning inverted AOBS/SP2-microscope (Leica Microsystems, Wetzlar, 35578 Germany). Image processing was assessed with the Leica Confocal Software LCS-15.37. Tissue microarrays (SuperBio Chips AC1 Human, Clinisciences, 92000 Nanterre, France) were processed according to manufacturer´s recommendations and stained with a mouse monoclonal antibody against CD68 (PG-M1; Dako, Santa Clara, CA 95051, USA) and a rabbit polyclonal antibody against FRβ [54].

2.5. Quantitative Real Time RT-PCR

Oligonucleotides for selected genes were designed according to the Roche software for quantitative real-time PCR, and RNA was amplified using the Universal Human Probe Roche Library (Roche Diagnostics, Indianapolis, IN 46256, USA). Assays were made in triplicate and results normalized according to the expression levels of GAPDH. In all cases, the results were expressed using the ΔΔCT method for quantitation.

2.6. siRNA-Mediated Knockdown

THP-1 cells (2 × 10⁶ cells) were nucleofected with 3 μg of siRNA for PU.1 (sc-36330 PU.1 siRNA gene silencer; Santa Cruz Biotechnology, Dallas, Texas 75220 USA) or a negative control siRNA (sc-37007 Control siRNA-A; Santa Cruz Biotechnology, Dallas, Texas 75220 USA) using the Cell Line Nucleofector Kit V (Amaxa, Cologne, Germany). After nucleofection, cells were kept in culture for 24 h, and one-fifth of the cells were lysed and subjected to Western Blot for PU.1 detection. Total RNA was isolated from the remaining nucleofected cells and subjected to real time-PCR.

2.7. Bioinformatic Analysis

The genes selectively expressed by monocytes and macrophages from human gut were obtained from [55] and used to identify those genes contained within the “Pro-inflammatory gene set” and “Anti-inflammatory gene set” previously defined [19,29]. A list of genes specifically expressed by macrophages within melanoma [56] and head and neck squamous carcinoma [57] was derived using Cibersortx [58], and their expression in breast carcinoma determined using the METABRIC (Molecular Taxonomy of Breast Cancer International Consortium) study cohort [59,60] on the cBioPortal for Cancer Genomics [61] and using the TIMER resource [62,63,64] on data generated by The Cancer Genome Atlas Program Research Network [65]. Identification of genes co-expressed with FOLR2 in various tissues was done using Genevestigator® [66]. Gene ontology analysis of the defined gene sets was performed using the online tool ENRICHR [67,68]. Chip-seq data were derived from the Cistrome data browser [69] and processed using the WashU Epigenome Browser [70].

2.8. Statistical Analysis

Statistical analysis was performed using a paired Student´s t-test and a p value < 0.05 was considered significant.

3. Results

3.1. Folate Receptor Beta (FRβ) is Co-Expressed with other Genes of the “Anti-Inflammatory Gene Set” and Marks Human Tissue-Resident Macrophages

We have previously reported the existence of transcriptional overlaps between the variety of macrophage subsets that make up Tumor-Associated Macrophages (TAM) and M-CSF dependent macrophages, as both are enriched in the expression of the 170-gene “anti-inflammatory gene set” [19,29], which includes the FRβ-encoding FOLR2 gene [45]. Assessment of the genes significantly co-expressed with FOLR2 in 431 anatomical locations identified various genes of the “anti-inflammatory gene set”, including CD209, C1QC, CD163, LILRB5, F13A1, STAB1, RNASE1 and IGF1, with Pearson´s correlation coefficients ranging from 0.77 to 0.65 (Figure 1A). In line with these findings, analysis of monocytes or macrophages from human colon, whose transcriptomes have been extensively analyzed [55], also revealed an enrichment of the “anti-inflammatory gene set” (Figure 1B), also including the expression of CD209, C1QC, CD163, LILRB5, F13A1 and IGF1 from the “anti-inflammatory gene set” (Figure 1C). Given these results, FOLR2-encoded FRβ expression was evaluated in colon and other tissue macrophages under homeostatic conditions. In agreement with the transcriptional data, and using tissue arrays, an FRβ-specific antiserum [54] stained numerous cells in the lamina propria of the colon, where CD68+ macrophages were also detected (Figure 1D). Besides, FRβ+ cells were found in the paracortical area of the tonsil and, to a lesser extent, in skeletal muscle (Figure 1D). Further, multicolor immunofluorescence revealed that FRβ is co-expressed with the hemoglobin/haptoglobin scavenger receptor CD163 in lamina propria macrophages, as well as in tonsil and in skeletal muscle, thus indicating that FRβ marks tissue-resident macrophages (Figure 1E). In addition, FRβ was co-expressed with CD163 in the dermis (Figure 1F), where most FRβ+/CD163+ macrophages exhibited a perivascular distribution (Figure 1F), as well as in placenta [71] (Figure 1G). Therefore, FRβ is broadly expressed in vivo by tissue-resident macrophages, where its expression positively correlates with the macrophage marker CD163 and other genes of the “anti-inflammatory gene set”.

3.2. FOLR2/FRβ Expression Marks Human Tumor-Associated Macrophages and Correlates with the Expression of CD163 and Regulators of Macrophage Differentiation

To determine whether the macrophage-restricted expression of FRβ also applies to pathological settings, we next assessed FOLR2 expression in TAM from various tumor types. To this end, we initially searched for macrophage-specific gene expression in melanoma [57] and head and neck squamous cell carcinoma (HNSC) [58] (Figure 2A) and identified a set of 21 M-MØ-specific genes whose expression is also restricted to melanoma and HNSC TAM (Figure 2B). Interestingly, FOLR2, CD163, LILRB5, CD209 and C1QC were identified as genes of the “anti-inflammatory gene set”, whose expression is also seen in tissue-resident macrophages and tumor-associated macrophages (Figure 2B). Analysis of breast cancer transcriptomes (METABRIC cohort) also evidenced a very good correlation between the expression of FOLR2 and those of genes of the “anti-inflammatory gene set”, which reached statistical significance in most cases (Figure 2C), and was highly significant for CD163 (Pearson: 0.72; p = 1.71 × 10−308) and even CD68 (Pearson: 0.59; p = 1.25 × 10−176), another widely used marker for macrophage identification (Figure 2C). Further, a significant correlation was found between the expression of FOLR2 and CD163 using the TCGA cohorts for breast carcinoma, melanoma and HNSC (Figure 2D and not shown), whereas no correlation was seen between FOLR2 and the epithelial-specific EPCAM gene in any of the analyzed tumors (data not shown). In fact, and at the protein level, FRβ expression was observed in CD163+ cells in melanoma (Figure 2E) and in areas enriched in CD68+ cells in colon adenocarcinoma (Figure 2F). Interestingly, and since FRβ+ macrophages are prominent in the tumor-invasive front of pancreatic cancer and associate with poor prognosis [72], it is worth noting that FRβ+ macrophages were mostly detected in the peritumoral area both in human melanoma and in a melanoma xenograft mouse model (Figure 2E). Altogether, this set of results indicates that FOLR2 expression correlates with the expression of CD163 and other macrophage-specific genes in TAM, and that FRβ expression in TAM overlaps with the expression of the commonly used macrophage markers CD163 and CD68.
To identify potential regulators of FOLR2 gene expression, gene ontology analysis was done using Enrichr [64], and results revealed a positive enrichment of genes regulated by MAF, SPI1 (PU.1) and NR1H3 (LXRα) in the TAM-specific genes of the “anti-inflammatory gene set” (Figure 2G). Indeed, FOLR2 expression was found to correlate with the expression of genes coding for transcription factors that determine macrophage differentiation and specification (SPI1 and MAF) in breast carcinoma (METABRIC cohort, Figure 2H), thus suggesting their involvement in expression of the FRβ-encoding FOLR2 gene. Further analysis of a large variety of tumor types using TIMER2.0 revealed that the positive correlation between FOLR2 and SPI1 expression was highest in colon adenocarcinoma, HNSC and sarcoma (Figure 2I), and that the FOLR2SPI1 correlation was more significant than the FOLR2MAF correlation in almost every tumor type (Figure 2J). Conversely, no significant correlation was found between FOLR2 or SPI1 expression and the epithelial-specific EPCAM gene expression (data not shown). Altogether, these results established a link between the FOLR2 gene and the expression of the PU.1-encoding SPI1 gene in tumor-associated macrophages.

3.3. FOLR2/FRβ Expression also Marks Human Synovial Macrophages

Next, we address the macrophage-restricted expression of FOLR2 in a pathology where macrophages preferentially exhibit a pro-inflammatory polarization, rheumatoid arthritis (RA). Initial assessment of FOLR2 expression in RA indicated an extremely close correlation with the expression of the “anti-inflammatory gene set” (Figure 3A). In fact, 13 genes of the “anti-inflammatory gene set” were found within the 50 genes more closely correlating with FOLR2 expression in RA (Figure 3A). Single-cell RNA sequencing (scRNA-seq) on samples from patients with rheumatoid arthritis (RA) or osteoarthritis (OA) has identified 18 unique cell populations in synovial tissue, including four transcriptionally different monocyte subsets [73]: IL1B+ pro-inflammatory monocytes, IFN-activated SPP1+ monocytes, NUPR1+ monocytes and C1QA+ monocytes (Figure 3B), with the latter two subsets under-represented in RA and thought to exert homeostatic functions [73]. Analysis of the four subsets revealed the presence of genes of the “anti-inflammatory gene set” in IL1B+, NUPR1+ and C1QA+ monocytes, and that the expression of FOLR2 is a specific marker for the NUPR1+ monocyte subset (Figure 3B) [73]. Indeed, although the expression of FOLR2 diminishes in macrophages from synovial membranes [74] (Figure 3C) and from synovial fluid [75] (Figure 3D) in RA, FRβ is still detectable in the lining layer of the synovial membrane of RA patients (Figure 3E).

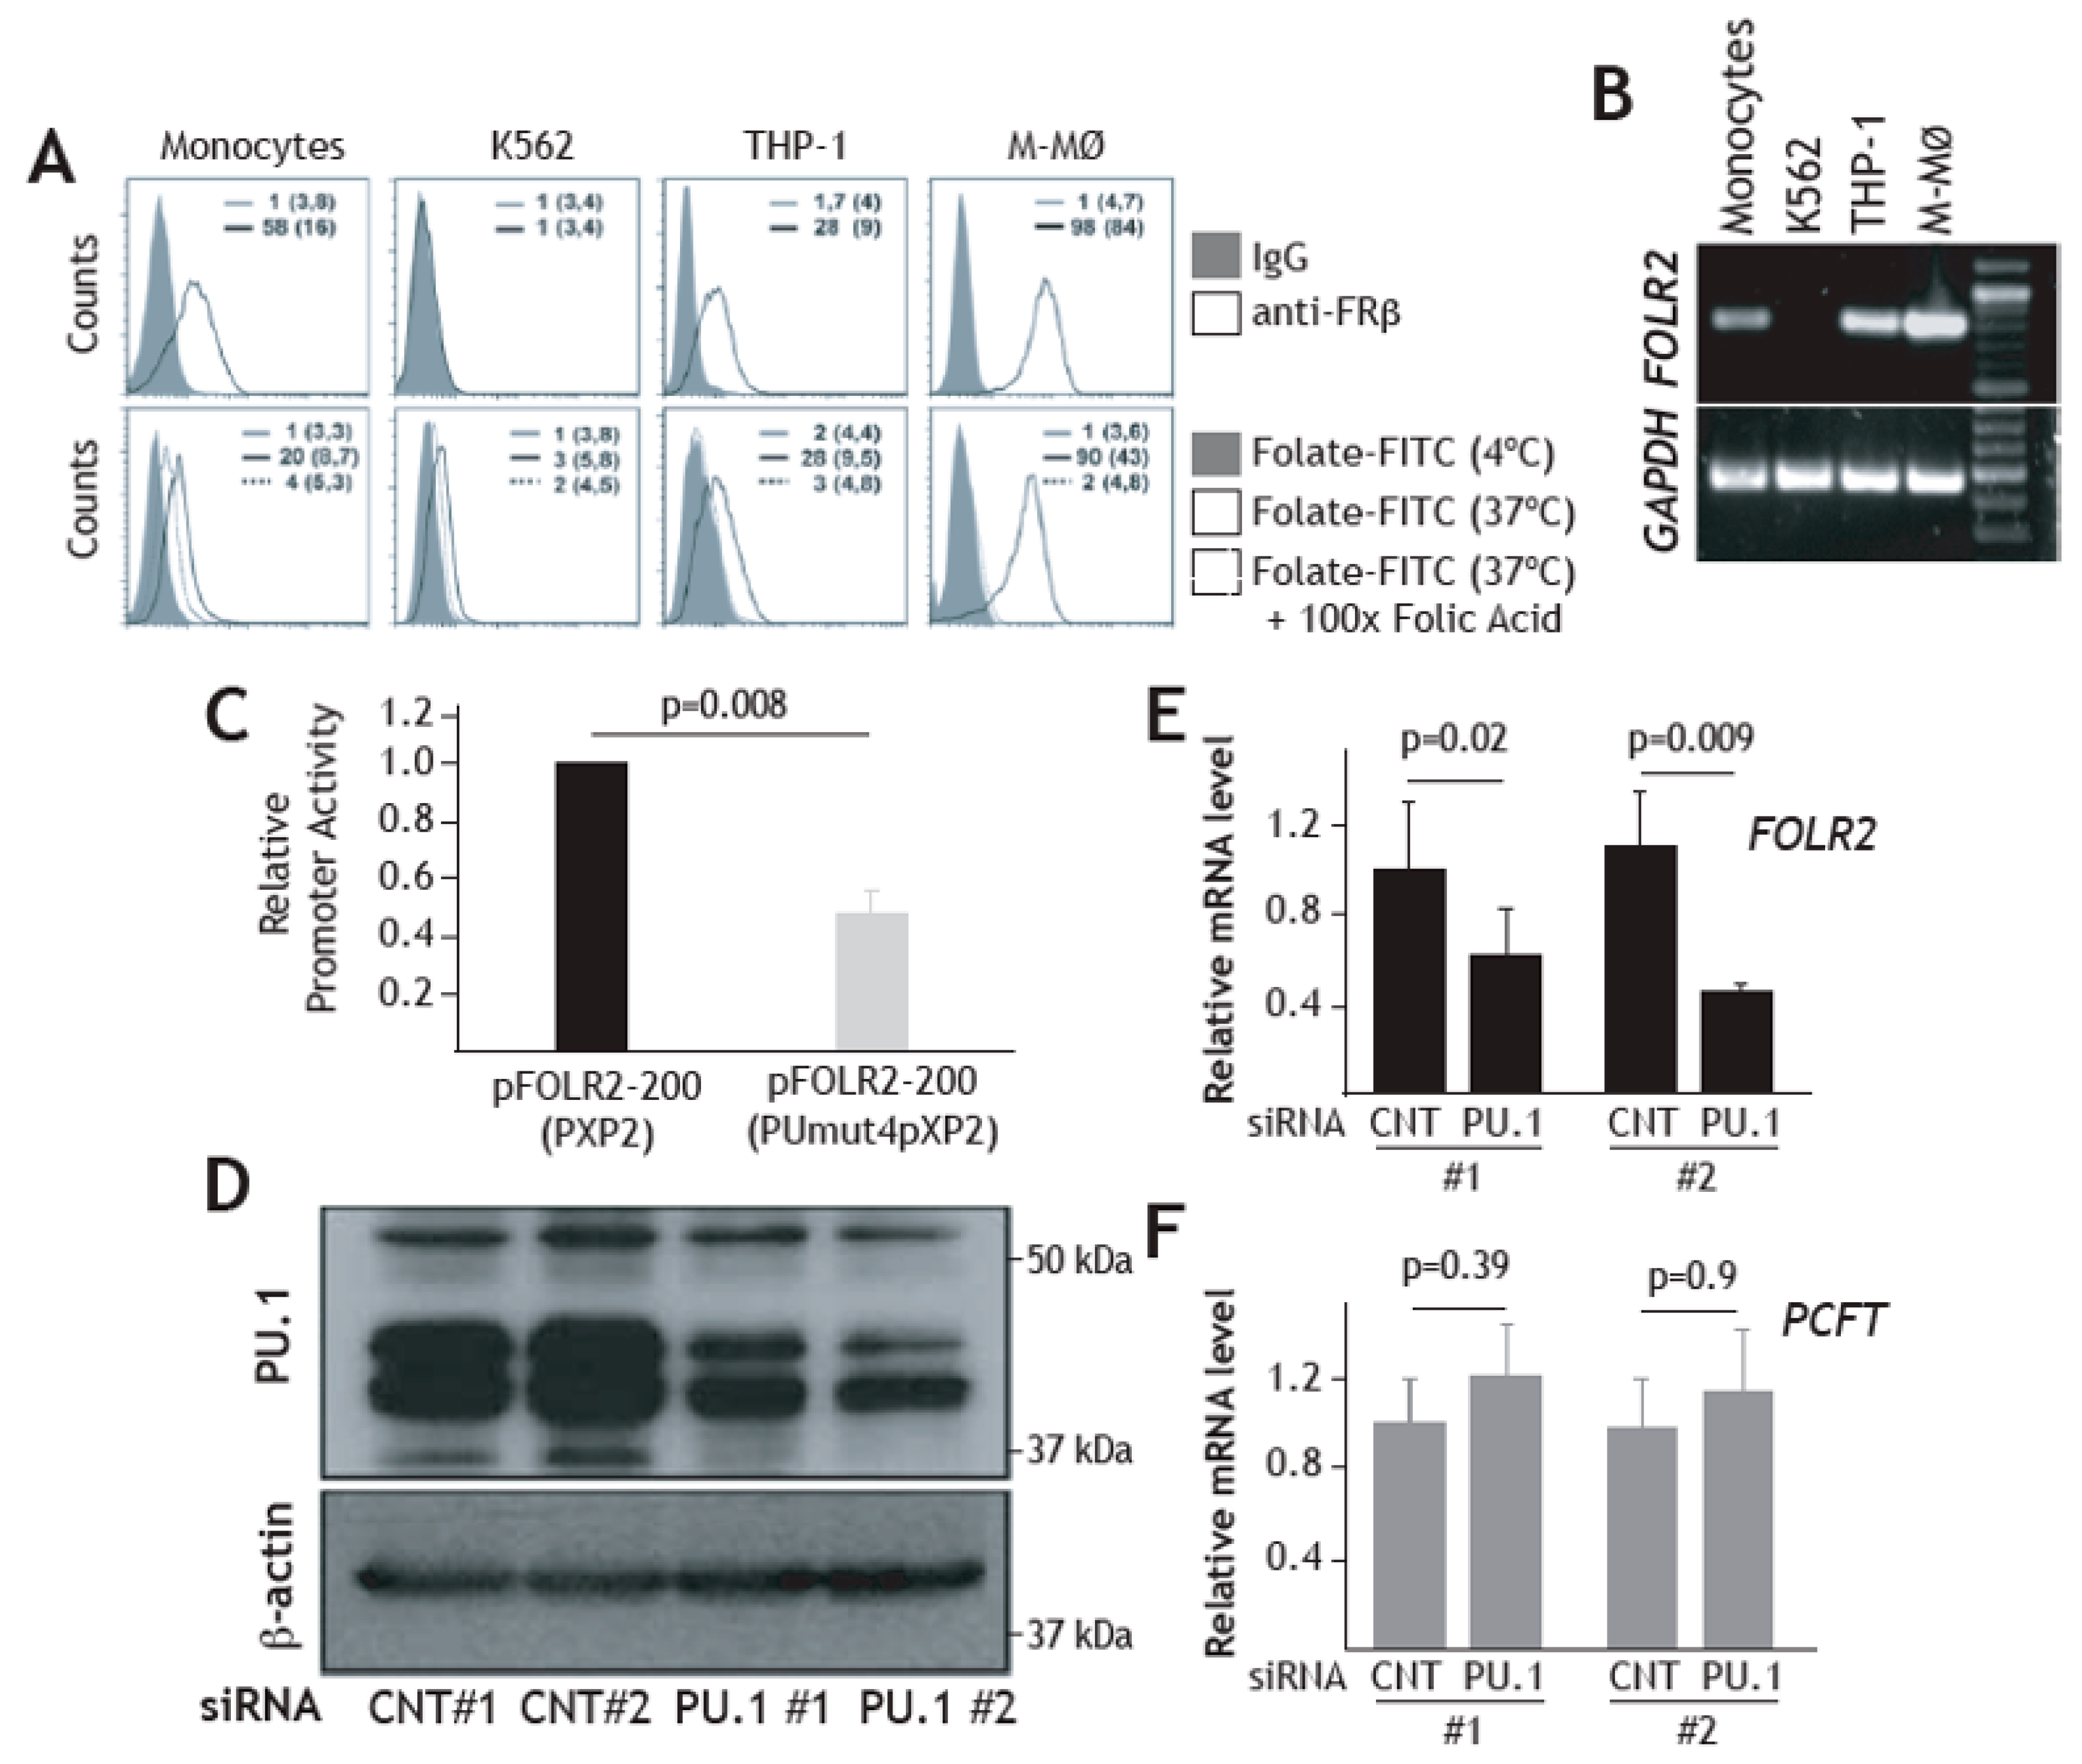
3.4. Expression of FRβ in Myeloid Cells is Dependent on the PU.1 Transcription Factor

To obtain support for the potential involvement of PU.1 in FOLR2 gene expression, we revised the available ChIP-Seq information on the genes of the “anti-inflammatory gene set”, which had been found to be significantly expressed in tissue-resident macrophages (Figure 1) and TAM (Figure 2), and identified validated PU.1-binding sites immediately upstream of the first exon of most genes (Figure 4A and not shown) [76], including FOLR2 as well as PU.1-binding sites within most genes of the “anti-inflammatory gene set” (Figure 4B) [77]. The presence of 3–4 major peaks in ChIP-seq data for PU.1 binding within the FOLR2 gene [74,76,77], with one of them localized within exon 1, close to a potential FOS-binding site [78] (Figure 4C,D) and overlapping a sequence containing four evolutionary conserved potential Ets-binding sequences (5′-GGAAGGGAAGGAAGAGAGGAA-3′) [79,80] (Figure 4D,E), led us to address the control of FOLR2 expression by PU.1. To analyze the functional significance of this cluster of PU.1-binding elements, we initially evaluated its contribution to the transcriptional activity of the FOLR2 proximal promoter. In HeLa cells devoid of PU.1 [81,82], transfected with the pFOLR2-200Luc construct, which contains the fragment -214 to -34 and includes the PU.1-binding elements, overexpression of PU.1 resulted in 10-fold enhancement of the activity of the promoter (Figure 4F). Further, mutation of the two distal Ets elements (pFOLR2-200PUmut2pXP2, Figure 4F) reduced PU.1-dependent transactivation to 50% (p = 0.008), while mutation of the four Ets-sequences (pFOLR2-200PUmut4pXP2, Figure 4F) reduced PU.1 transactivation by 86% (p = 0.009), thus implying that PU.1 exerts a positive regulatory action on the FOLR2 proximal regulatory region through interaction with a cluster of Ets-cognate sequences within exon 1 of the FOLR2 gene.
Having demonstrated a direct effect of PU.1 on the FOLR2 proximal regulatory region, we then assayed the role of PU.1 on the activity of the FOLR2 promoter in the FRβ-expressing human THP-1 myeloid cell line, where the receptor is expressed in a functional state (Figure 5A,B). As shown in Figure 5C, the pFOLR2-200PUmut4pXP2 construct exhibited significantly lower activity than the wild-type pFOLR2-200pXP2 construct (p = 0.008) in THP-1 cells, thus indicating that the activity of the FOLR2 gene regulatory region in myeloid cells is partly dependent on the integrity of the cluster of PU-1-binding elements located within exon 1. To definitively prove the direct involvement of PU.1 on FRβ expression, FOLR2 mRNA expression level was assessed after knocking down PU.1 expression in FRβ+ THP-1 cells. Nucleofection of a PU.1-specific siRNA in THP-1 cells reduced the expression of PU.1 by more than 50% (Figure 5D). More importantly, siRNA-mediated knockdown of PU.1 led to a significant down-modulation of FOLR2 mRNA levels (p = 0.02 for experiment #1 and p = 0.009 for experiment #2) without affecting the expression of the functionally related PCFT gene (Figure 5E). Therefore, PU.1 regulates FOLR2 gene expression in THP-1 cells, further confirming PU.1 dependence on the myeloid-restricted expression of the FOLR2 gene.

4. Discussion

In the present manuscript, we show that the FOLR2 gene is expressed by human CD163+ tissue-resident and tumor-associated macrophages (TAM) from various sources, and that its restricted cellular distribution is shared by a limited number of genes, including the commonly used macrophage-specific marker CD163. CD163 is a bona fide macrophage-specific marker [78] that, however, is expressed at higher levels in macrophages polarized toward the anti-inflammatory and reparative side [18,19], a property also shared by FRβ [45]. Indeed, FOLR2 expression parallels that of CD163 in tissue-resident macrophages, TAM from various tumor types and inflamed synovium. Therefore, FRβ can be considered a macrophage-specific marker, in line with previous reports on its expression in distinct macrophage subsets in human and mouse tissues [44,45,48,72,83,84]. Further stressing its cell-restricted expression, the expression of CD163 and FOLR2 in TAM significantly correlates with the presence of the PU.1 transcription factor. Thus, we have found that the PU.1 transcription factor, which is preferentially expressed in myeloid cells, enhances the transcriptional activity of the proximal regulatory region of the FOLR2 gene and directly influences FOLR2 gene expression. The demonstration of the PU.1-dependent expression of FOLR2 is the first evidence of a transcription factor directly controlling FOLR2 expression and suggests that PU.1 contributes to the myeloid-specific expression of FRβ.
Macrophage reprogramming now appears a feasible therapeutic strategy for chronic inflammatory diseases [46]. Accordingly, the identification of macrophage subset-specific markers is a requisite for the development of macrophage-directed therapeutic interventions for human pathologies. The identification of FRβ as a macrophage-specific marker in homeostatic and pathological states has relevant translational implications, because FRβ has already been used as a target for imaging and delivery of therapeutic agents in inflammation-related diseases like rheumatoid arthritis [83,84,85,86]. Therefore, it is tempting to hypothesize that FRβ might also be a useful tool for delivery of agents with ability to shift the macrophage polarization state. Such an approach would benefit from the constitutive FRβ recycling ability [87,88,89] as well as by its huge capacity to transfer ligands towards the macrophage endocytic machinery [89,90]. This strategy would be particularly well suited in the case of tumors, as FRβ is highly expressed in TAM (this report and [45]). TAM promotes malignancy by stimulating angiogenesis, tumor-cell migration and invasion, and TAM accrual correlates with a worse prognosis in numerous tumors (85). Thus, FRβ constitutes an ideal target for delivery of macrophage-repolarizing agents into TAM, and, in line with the results here presented, the characterization of the factors that regulate FRβ expression constitutes relevant information for the development of FRβ-based macrophage targeting strategies.
Besides the involvement of PU.1 in the myeloid expression of FRβ, bioinformatics analysis also indicates that FOLR2 gene expression closely correlates with the expression of the MAF transcription factor in TAM from various sources. In fact, FOLR2 exhibits the highest level of correlation with MAF expression in breast carcinoma, a finding that agrees with the considerable decrease in FOLR2 expression that is seen upon MAF knockdown in human macrophages [74]. However, ChIP-Seq has not provided evidence for any interaction of MAF with the FOLR2 gene. Considering the ability of MAF to heterodimerize with members of the JUN/FOS family of transcription factors [91], and given the existence of FOS-binding sites in exon 1 [78] and additional AP-1-binding elements nearby [79], it is conceivable that MAF might indirectly affect FOLR2 expression by altering the levels of available JUN/FOS family proteins.
The comparison of tissue-resident macrophage-specific genes and TAM-specific genes has resulted in the identification of a group of six genes (MS4A6A, LILRB5, CD209, CD163, FOLR2, C1QC) which are also preferentially/exclusively expressed by macrophages with an anti-inflammatory/reparative polarization (included within the “anti-inflammatory” gene set). The proteins encoded by these six genes participate in either pathogen recognition (CD209, CD163, C1QC) or in modulation of inflammatory responses (MS4A6A, LILRB5). By contrast, and apart from its folate-binding ability, FRβ does not appear to fit within any of these two classes, although it modulates macrophage adhesion to collagen through association to the CD11b/CD18 integrin [92]. As a glycosyl phosphatidylinositol (GPI)-anchored protein, FRβ’s potential to exert immunoregulatory actions would be indirect. By contrast, the cellular distribution, structure and recycling behavior of FRβ [85] somewhat resembles that of CD14, a crucial regulator of TLR4 ligand binding, endocytosis and TLR4-initiated signaling from endosomes [93,94]. We speculate that FRβ might exhibit a function similar to CD14, which acts both as a pattern-recognition receptor that binds directly to LPS and a co-receptor for several TLRs [95]. FRβ has a very high affinity for folic acid and folates (Kd ~ 0.1–1nM), but mammals do not synthesize folate and are dependent on other sources. Diet or dietary supplements are not the only sources of folate, as several bacteria in the gastrointestinal tract can synthesize B vitamins, including folates (e.g., Lactococcus lactis, Bifidobacterium adolescentis) [96,97]. The macrophage-specific expression of FRβ described in this report, and the fact that folic acid is produced by numerous bacterial species [96,97], have led us to hypothesize that FRβ acts as a receptor or co-receptor for recognition of bacterial microbiota. If so, gut macrophages could detect high concentrations of folate through FRβ as a mechanism to control bacterial overgrowth through signaling or by phagocytosis, which would allow the microbiota homeostasis to be restored/maintained by a folate-dependent quorum sensing-like mechanism. Whether this mechanism contributes to the interplay between TAM and human microbiota in cancer [98] deserves further investigation. In any event, the hypothesis that FRβ is a sensor for adjusting macrophage effector functions to extracellular folic acid levels is fully compatible with the findings reported in the present manuscript, namely, that FRβ marks tissue-resident macrophages and macrophages within inflamed tissues, and that its expression correlates and is dependent on the expression of the PU.1 transcription factor.

Author Contributions

A.P.-K. and Á.L.C. designed the research. R.S., Á.D.-S., P.S.-M. and A.P.-K. performed experiments and analyzed the data. M.R. and T.M. contributed essential reagents and discussed the results. A.P.-K. and Á.L.C. wrote the manuscript. All authors have read and agreed to the published version of the manuscript.

Funding

This research was funded by Instituto de Salud Carlos III/FEDER (PI17/00037, PI17/01324 and RD16/0012/0007), Instituto de Investigación Sanitaria Gregorio Marañón (II-PI-1-2019), Ministerio de Economía y Competitividad (SAF2017-83785-R) and Fundación La Marató/TV3 (201619.31). FEDER: Fondo Europeo de Desarrollo Regional: una manera de hacer Europa.

Acknowledgments

The authors very gratefully acknowledge Isabel Treviño and Julia Villarejo for help with immunofluorescence sample processing and Cecilia Muñoz for providing tissues.

Conflicts of Interest

The authors report no conflict of interest.

References

  1. Hoeffel, G.; Ginhoux, F. Fetal monocytes and the origins of tissue-resident macrophages. Cell Immunol. 2018, 330, 5–15. [Google Scholar] [CrossRef] [PubMed]
  2. Liao, X.; Shen, Y.; Zhang, R.; Sugi, K.; Vasudevan, N.T.; Alaiti, M.A.; Sweet, D.R.; Zhou, L.; Qing, Y.; Gerson, S.L.; et al. Distinct roles of resident and nonresident macrophages in nonischemic cardiomyopathy. Proc. Natl. Acad. Sci. USA 2018, 115, E4661–E4669. [Google Scholar] [CrossRef] [PubMed] [Green Version]
  3. Bain, C.C.; Bravo-Blas, A.; Scott, C.L.; Perdiguero, E.G.; Geissmann, F.; Henri, S.; Malissen, B.; Osborne, L.C.; Artis, D.; Mowat, A.M. Constant replenishment from circulating monocytes maintains the macrophage pool in the intestine of adult mice. Nat. Immunol. 2014, 15, 929–937. [Google Scholar] [CrossRef] [PubMed] [Green Version]
  4. Puranik, A.S.; Leaf, I.A.; Jensen, M.A.; Hedayat, A.F.; Saad, A.; Kim, K.W.; Saadalla, A.M.; Woollard, J.R.; Kashyap, S.; Textor, S.C.; et al. Kidney-resident macrophages promote a proangiogenic environment in the normal and chronically ischemic mouse kidney. Sci. Rep. 2018, 8, 13948. [Google Scholar] [CrossRef] [PubMed] [Green Version]
  5. Misharin, A.V.; Morales-Nebreda, L.; Reyfman, P.A.; Cuda, C.M.; Walter, J.M.; McQuattie-Pimentel, A.C.; Chen, C.I.; Anekalla, K.R.; Joshi, N.; Williams, K.J.; et al. Monocyte-derived alveolar macrophages drive lung fibrosis and persist in the lung over the life span. J. Exp. Med. 2017, 214, 2387–2404. [Google Scholar] [CrossRef] [PubMed] [Green Version]
  6. Zasłona, Z.; Przybranowski, S.; Wilke, C.; van Rooijen, N.; Teitz-Tennenbaum, S.; Osterholzer, J.J.; Wilkinson, J.E.; Moore, B.B.; Peters-Golden, M. Resident alveolar macrophages suppress, whereas recruited monocytes promote, allergic lung inflammation in murine models of asthma. J. Immunol. 2014, 193, 4245–4253. [Google Scholar] [CrossRef] [Green Version]
  7. Lavine, K.J.; Epelman, S.; Uchida, K.; Weber, K.J.; Nichols, C.G.; Schilling, J.D.; Ornitz, D.M.; Randolph, G.J.; Mann, D.L. Distinct macrophage lineages contribute to disparate patterns of cardiac recovery and remodeling in the neonatal and adult heart. Proc. Natl. Acad. Sci. USA 2014, 111, 16029–16034. [Google Scholar] [CrossRef] [Green Version]
  8. Sager, H.B.; Hulsmans, M.; Lavine, K.J.; Moreira, M.B.; Heidt, T.; Courties, G.; Sun, Y.; Iwamoto, Y.; Tricot, B.; Khan, O.F.; et al. Proliferation and Recruitment Contribute to Myocardial Macrophage Expansion in Chronic Heart Failure. Circ. Res. 2016, 119, 853–864. [Google Scholar] [CrossRef] [Green Version]
  9. Xu, J.; Chi, F.; Guo, T.; Punj, V.; Lee, W.P.; French, S.W.; Tsukamoto, H. NOTCH reprograms mitochondrial metabolism for proinflammatory macrophage activation. J. Clin. Investig. 2015, 125, 1579–1590. [Google Scholar] [CrossRef] [Green Version]
  10. Udalova, I.A.; Mantovani, A.; Feldmann, M. Macrophage heterogeneity in the context of rheumatoid arthritis. Nat. Rev. Rheumatol. 2016, 12, 472–485. [Google Scholar] [CrossRef]
  11. Cauli, A.; Yanni, G.; Panayi, G.S. Interleukin-1, interleukin-1 receptor antagonist and macrophage populations in rheumatoid arthritis synovial membrane. Br. J. Rheumatol. 1997, 36, 935–940. [Google Scholar] [CrossRef] [PubMed] [Green Version]
  12. Hamilton, J.A. Colony-stimulating factors in inflammation and autoimmunity. Nat. Rev Immunol. 2008, 8, 533–544. [Google Scholar] [CrossRef] [PubMed]
  13. Ushach, I.; Zlotnik, A. Biological role of granulocyte macrophage colony-stimulating factor (GM-CSF) and macrophage colony-stimulating factor (M-CSF) on cells of the myeloid lineage. J. Leukoc. Biol. 2016, 100, 481–489. [Google Scholar] [CrossRef] [PubMed]
  14. Yamamoto, T.; Kaizu, C.; Kawasaki, T.; Hasegawa, G.; Umezu, H.; Ohashi, R.; Sakurada, J.; Jiang, S.; Shultz, L.; Naito, M. Macrophage colony-stimulating factor is indispensable for repopulation and differentiation of Kupffer cells but not for splenic red pulp macrophages in osteopetrotic (op/op) mice after macrophage depletion. Cell Tissue Res. 2008, 332, 245–256. [Google Scholar] [CrossRef] [PubMed]
  15. Wynn, T.A.; Chawla, A.; Pollard, J.W. Macrophage biology in development, homeostasis and disease. Nature 2013, 496, 445–455. [Google Scholar] [CrossRef]
  16. Van Overmeire, E.; Stijlemans, B.; Heymann, F.; Keirsse, J.; Morias, Y.; Elkrim, Y.; Brys, L.; Abels, C.; Lahmar, Q.; Ergen, C.; et al. M-CSF and GM-CSF Receptor Signaling Differentially Regulate Monocyte Maturation and Macrophage Polarization in the Tumor Microenvironment. Cancer Res. 2016, 76, 35–42. [Google Scholar] [CrossRef] [PubMed] [Green Version]
  17. Nowicki, A.; Szenajch, J.; Ostrowska, G.; Wojtowicz, A.; Wojtowicz, K.; Kruszewski, A.A.; Maruszynski, M.; Aukerman, S.L.; Wiktor-Jedrzejczak, W. Impaired tumor growth in colony-stimulating factor 1 (CSF-1)-deficient, macrophage-deficient op/op mouse: Evidence for a role of CSF-1-dependent macrophages in formation of tumor stroma. Int. J. Cancer. 1996, 65, 112–119. [Google Scholar] [CrossRef]
  18. Verreck, F.A.; de Boer, T.; Langenberg, D.M.; Hoeve, M.A.; Kramer, M.; Vaisberg, E.; Kastelein, R.; Kolk, A.; de Waal-Malefyt, R.; Ottenhoff, T.H. Human IL-23-producing type 1 macrophages promote but IL-10-producing type 2 macrophages subvert immunity to (myco)bacteria. Proc. Natl. Acad. Sci. USA 2004, 101, 4560–4565. [Google Scholar] [CrossRef] [Green Version]
  19. Sierra-Filardi, E.; Puig-Kröger, A.; Blanco, F.J.; Nieto, C.; Bragado, R.; Palomero, M.I.; Bernabéu, C.; Vega, M.A.; Corbí, A.L. Activin A skews macrophage polarization by promoting a proinflammatory phenotype and inhibiting the acquisition of anti-inflammatory macrophage markers. Blood 2011, 117, 5092–5101. [Google Scholar] [CrossRef] [Green Version]
  20. Pyonteck, S.M.; Akkari, L.; Schuhmacher, A.J.; Bowman, R.L.; Sevenich, L.; Quail, D.F.; Olson, O.C.; Quick, M.L.; Huse, J.T.; Teijeiro, V.; et al. CSF-1R inhibition alters macrophage polarization and blocks glioma progression. Nat. Med. 2013, 19, 1264–1272. [Google Scholar] [CrossRef] [PubMed] [Green Version]
  21. Naito, M.; Hasegawa, G.; Ebe, Y.; Yamamoto, T. Differentiation and function of Kupffer cells. Med. Electron. Microsc. 2004, 37, 16–28. [Google Scholar] [CrossRef] [PubMed]
  22. Seki, S.; Habu, Y.; Kawamura, T.; Takeda, K.; Dobashi, H.; Ohkawa, T.; Hiraide, H. The liver as a crucial organ in the first line of host defense: The roles of Kupffer cells, natural killer (NK) cells and NK1.1 Ag+ T cells in T helper 1 immune responses. Immunol. Rev. 2000, 174, 35–46. [Google Scholar] [CrossRef] [PubMed]
  23. Zhang, M.; Xu, S.; Han, Y.; Cao, X. Apoptotic cells attenuate fulminant hepatitis by priming Kupffer cells to produce interleukin-10 through membrane-bound TGF-β. Hepatology 2011, 53, 306–316. [Google Scholar] [CrossRef] [PubMed]
  24. Fleetwood, A.J.; Dinh, H.; Cook, A.D.; Hertzog, P.J.; Hamilton, J.A. GM-CSF- and M-CSF-dependent macrophage phenotypes display differential dependence on type I interferon signaling. J. Leukoc Biol. 2009, 86, 411–421. [Google Scholar] [CrossRef]
  25. Fleetwood, A.J.; Lawrence, T.; Hamilton, J.A.; Cook, A.D. Granulocyte-macrophage colony-stimulating factor (CSF) and macrophage CSF-dependent macrophage phenotypes display differences in cytokine profiles and transcription factor activities: Implications for CSF blockade in inflammation. J. Immunol. 2007, 178, 5245–5252. [Google Scholar] [CrossRef] [PubMed] [Green Version]
  26. Lacey, D.C.; Achuthan, A.; Fleetwood, A.J.; Dinh, H.; Roiniotis, J.; Scholz, G.M.; Chang, M.W.; Beckman, S.K.; Cook, A.D.; Hamilton, J.A. Defining GM-CSF- and Macrophage-CSF-Dependent Macrophage Responses by In Vitro Models. J. Immunol. 2012, 188, 5752–5765. [Google Scholar] [CrossRef]
  27. González-Domínguez, É.; Domínguez-Soto, Á.; Nieto, C.; Flores-Sevilla, J.L.; Pacheco-Blanco, M.; Campos-Peña, V.; Meraz-Ríos, M.A.; Vega, M.A.; Corbí, Á.L.; Sánchez-Torres, C. Atypical Activin A and IL-10 Production Impairs Human CD16 + Monocyte Differentiation into Anti-Inflammatory Macrophages. J. Immunol. 2016, 196, 1327–1337. [Google Scholar] [CrossRef] [Green Version]
  28. González-Domínguez, É.; Samaniego, R.; Flores-Sevilla, J.L.; Campos-Campos, S.F.; Gómez-Campos, G.; Salas, A.; Campos-Peña, V.; Corbí, Á.L.; Sánchez-Mateos, P.; Sánchez-Torres, C. CD163L1 and CLEC5A discriminate subsets of human resident and inflammatory macrophages in vivo. J. Leukoc Biol. 2015, 98, 453–466. [Google Scholar] [CrossRef]
  29. Soler Palacios, B.; Estrada-Capetillo, L.; Izquierdo, E.; Criado, G.; Nieto, C.; Municio, C.; González-Alvaro, I.; Sánchez-Mateos, P.; Pablos, J.L.; Corbí, A.L.; et al. Macrophages from the synovium of active rheumatoid arthritis exhibit an activin a-dependent pro-inflammatory profile. J. Pathol. 2015, 235, 515–526. [Google Scholar] [CrossRef]
  30. de las Casas-Engel, M.; Domínguez-Soto, A.; Sierra-Filardi, E.; Bragado, R.; Nieto, C.; Puig-Kroger, A.; Samaniego, R.; Loza, M.; Corcuera, M.T.; Gómez-Aguado, F.; et al. Serotonin Skews Human Macrophage Polarization through HTR2B and HTR7. J. Immunol. 2013, 190, 2301–2310. [Google Scholar] [CrossRef] [Green Version]
  31. Neubert, N.J.; Schmittnaegel, M.; Bordry, N.; Nassiri, S.; Wald, N.; Martignier, C.; Tillé, L.; Homicsko, K.; Damsky, W.; Maby-El Hajjami, H.; et al. T cell-induced CSF1 promotes melanoma resistance to PD1 blockade. Sci. Transl. Med. 2018, 10. [Google Scholar] [CrossRef] [PubMed] [Green Version]
  32. Ries, C.H.; Cannarile, M.A.; Hoves, S.; Benz, J.; Wartha, K.; Runza, V.; Rey-Giraud, F.; Pradel, L.P.; Feuerhake, F.; Klaman, I.; et al. Targeting tumor-associated macrophages with anti-CSF-1R antibody reveals a strategy for cancer therapy. Cancer Cell. 2014, 25, 846–859. [Google Scholar] [CrossRef] [PubMed] [Green Version]
  33. Cassier, P.A.; Italiano, A.; Gomez-Roca, C.A.; Le Tourneau, C.; Toulmonde, M.; Cannarile, M.A.; Ries, C.; Brillouet, A.; Müller, C.; Jegg, A.M.; et al. CSF1R inhibition with emactuzumab in locally advanced diffuse-type tenosynovial giant cell tumours of the soft tissue: A dose-escalation and dose-expansion phase 1 study. Lancet Oncol. 2015, 16, 949–956. [Google Scholar] [CrossRef]
  34. Cuevas, V.D.; Anta, L.; Samaniego, R.; Orta-Zavalza, E.; de la Rosa, J.V.; Baujat, G.; Domínguez-Soto, Á.; Sánchez-Mateos, P.; Escribese, M.M.; Castrillo, A.; et al. MAFB Determines Human Macrophage Anti-Inflammatory Polarization: Relevance for the Pathogenic Mechanisms Operating in Multicentric Carpotarsal Osteolysis. J. Immunol. 2017, 198, 2070–2081. [Google Scholar] [CrossRef]
  35. Kim, H. The transcription factor MafB promotes anti-inflammatory M2 polarization and cholesterol efflux in macrophages. Sci. Rep. 2017, 7, 7591. [Google Scholar] [CrossRef] [PubMed]
  36. Liu, M.; Tong, Z.; Ding, C.; Luo, F.; Wu, S.; Wu, C.; Albeituni, S.; He, L.; Hu, X.; Tieri, D.; et al. Transcription factor c-Maf is a checkpoint that programs macrophages in lung cancer. J. Clin. Invest. 2020, 130, 2081–2096. [Google Scholar] [CrossRef] [PubMed] [Green Version]
  37. Kikuchi, K.; Iida, M.; Ikeda, N.; Moriyama, S.; Hamada, M.; Takahashi, S.; Kitamura, H.; Watanabe, T.; Hasegawa, Y.; Hase, K.; et al. Macrophages Switch Their Phenotype by Regulating Maf Expression during Different Phases of Inflammation. J. Immunol. 2018, 201, 635–651. [Google Scholar] [CrossRef] [PubMed] [Green Version]
  38. Stover, P.J. Physiology of Folate and Vitamin B12 in Health and Disease. Nutr. Rev. 2006, 62, 3–12. [Google Scholar] [CrossRef]
  39. Ross, J.F.; Chaudhuri, P.K.; Ratnam, M. Differential regulation of folate receptor isoforms in normal and malignant tissues in vivo and in established cell lines. Physiologic and clinical implications. Cancer 1994, 73, 2432–2443. [Google Scholar] [CrossRef]
  40. Kalli, K.R.; Oberg, A.L.; Keeney, G.L.; Christianson, T.J.; Low, P.S.; Knutson, K.L.; Hartmann, L.C. Folate receptor alpha as a tumor target in epithelial ovarian cancer. Gynecol. Oncol. 2008, 108, 619–626. [Google Scholar] [CrossRef] [Green Version]
  41. Boogerd, L.S.; Boonstra, M.C.; Beck, A.J.; Charehbili, A.; Hoogstins, C.E.; Prevoo, H.A.; Singhal, S.; Low, P.S.; van de Velde, C.J.; Vahrmeijer, A.L. Concordance of folate receptor-α expression between biopsy, primary tumor and metastasis in breast cancer and lung cancer patients. Oncotarget. 2016, 7, 17442–17454. [Google Scholar] [CrossRef] [PubMed] [Green Version]
  42. Bianchi, E.; Doe, B.; Goulding, D.; Wright, G.J. Juno is the egg Izumo receptor and is essential for mammalian fertilization. Nature 2014, 508, 483–487. [Google Scholar] [CrossRef] [PubMed]
  43. Elnakat, H.; Ratnam, M. Distribution, functionality and gene regulation of folate receptor isoforms: Implications in targeted therapy. Adv. Drug Deliv. Rev. 2004, 56, 1067–1084. [Google Scholar] [CrossRef] [PubMed]
  44. Nakashima-Matsushita, N.; Homma, T.; Yu, S.; Matsuda, T.; Sunahara, N.; Nakamura, T.; Tsukano, M.; Ratnam, M.; Matsuyama, T. Selective expression of folate receptor β and its possible role in methotrexate transport in synovial macrophages from patients with rheumatoid arthritis. Arthritis Rheum. 1999, 42, 1609–1616. [Google Scholar] [CrossRef]
  45. Puig-Kröger, A.; Sierra-Filardi, E.; Domínguez-Soto, A.; Samaniego, R.; Corcuera, M.T.; Gómez-Aguado, F.; Ratnam, M.; Sánchez-Mateos, P.; Corbí, A.L. Folate Receptor beta Is Expressed by Tumor-Associated Macrophages and Constitutes a Marker for M2 Anti-inflammatory/Regulatory Macrophages. Cancer Res. 2009, 69, 9395–9403. [Google Scholar] [CrossRef] [Green Version]
  46. Schultze, J.L. Reprogramming of macrophages - New opportunities for therapeutic targeting. Curr. Opin. Pharmacol. 2016, 26, 10–15. [Google Scholar] [CrossRef]
  47. Xia, W.; Hilgenbrink, A.R.; Matteson, E.L.; Lockwood, M.B.; Cheng, J.X.; Low, P.S. A functional folate receptor is induced during macrophage activation and can be used to target drugs to activated macrophages. Blood 2009, 113, 438–446. [Google Scholar] [CrossRef] [Green Version]
  48. Nagai, T.; Tanaka, M.; Tsuneyoshi, Y.; Xu, B.; Michie, S.A.; Hasui, K.; Hirano, H.; Arita, K.; Matsuyama, T. Targeting tumor-associated macrophages in an experimental glioma model with a recombinant immunotoxin to folate receptor beta. Cancer Immunol. Immunother. 2009, 58, 1577–1586. [Google Scholar] [CrossRef]
  49. Anderson, K.L.; Smith, K.A.; Conners, K.; McKercher, S.R.; Maki, R.A.; Torbett, B.E. Myeloid development is selectively disrupted in PU.1 null mice. Blood 1998, 91, 3702–3710. [Google Scholar] [CrossRef]
  50. Tenen, D.G. Disruption of differentiation in human cancer: AML shows the way. Nat. Rev. Cancer 2003, 3, 89–101. [Google Scholar] [CrossRef]
  51. Zhang, D.E.; Hetherington, C.J.; Chen, H.M.; Tenen, D.G. The macrophage transcription factor PU.1 directs tissue-specific expression of the macrophage colony-stimulating factor receptor. Mol. Cell. Biol. 1994, 14, 373–381. [Google Scholar] [CrossRef] [PubMed] [Green Version]
  52. Nagayoshi, R.; Nagai, T.; Matsushita, K.; Sato, K.; Sunahara, N.; Matsuda, T.; Nakamura, T.; Komiya, S.; Onda, M.; Matsuyama, T. Effectiveness of anti-folate receptor β antibody conjugated with truncated Pseudomonas exotoxin in the targeting of rheumatoid arthritis synovial macrophages. Arthritis Rheum. 2005, 52, 2666–2675. [Google Scholar] [CrossRef] [PubMed]
  53. Domínguez-Soto, Á.; Puig-Kröger, A.; Vega, M.A.; Corbí, A.L. PU. 1 regulates the tissue-specific expression of dendritic cell-specific intercellular adhesion molecule (ICAM)-3-grabbing nonintegrin. J. Biol. Chem. 2005, 280, 33123–33131. [Google Scholar] [CrossRef] [PubMed] [Green Version]
  54. Ross, J.F.; Wang, H.; Behm, F.G.; Mathew, P.; Wu, M.; Booth, R.; Ratnam, M. Folate receptor type beta is a neutrophilic lineage marker and is differentially expressed in myeloid leukemia. Cancer. 1999, 85, 348–357. [Google Scholar] [CrossRef]
  55. Smillie, C.S.; Biton, M.; Ordovas-Montanes, J.; Sullivan, K.M.; Burgin, G.; Graham, D.B.; Herbst, R.H.; Rogel, N.; Slyper, M.; Waldman, J.; et al. Intra- and Inter-cellular Rewiring of the Human Colon during Ulcerative Colitis. Cell 2019, 178, 714–730.e22. [Google Scholar] [CrossRef]
  56. Tirosh, I.; Izar, B.; Prakadan, S.M.; Wadsworth, M.H.; Treacy, D.; Trombetta, J.J.; Rotem, A.; Rodman, C.; Lian, C.; Murphy, G.; et al. Dissecting the multicellular ecosystem of metastatic melanoma by single-cell RNA-seq. Science 2016, 352, 189–196. [Google Scholar] [CrossRef] [Green Version]
  57. Puram, S.V.; Tirosh, I.; Parikh, A.S.; Patel, A.P.; Yizhak, K.; Gillespie, S.; Rodman, C.; Luo, C.L.; Mroz, E.A.; Emerick, K.S.; et al. Single-Cell Transcriptomic Analysis of Primary and Metastatic Tumor Ecosystems in Head and Neck Cancer. Cell 2017, 171, 1611–1624.e24. [Google Scholar] [CrossRef] [Green Version]
  58. Cibersortx. Available online: https://cibersortx.stanford.edu (accessed on 1 May 2020).
  59. Curtis, C.; Shah, S.P.; Chin, S.F.; Turashvili, G.; Rueda, O.M.; Dunning, M.J.; Speed, D.; Lynch, A.G.; Samarajiwa, S.; Yuan, Y.; et al. The genomic and transcriptomic architecture of 2,000 breast tumours reveals novel subgroups. Nature 2012, 486, 346–352. [Google Scholar] [CrossRef]
  60. Pereira, B.; Chin, S.F.; Rueda, O.M.; Vollan, H.K.M.; Provenzano, E.; Bardwell, H.A.; Pugh, M.; Jones, L.; Russell, R.; Sammut, S.J.; et al. The somatic mutation profiles of 2,433 breast cancers refines their genomic and transcriptomic landscapes. Nat. Commun. 2016, 7, 11479. [Google Scholar] [CrossRef] [Green Version]
  61. The cBioPortal for Cancer Genomics. Available online: http://www.cbioportal.org (accessed on 1 May 2020).
  62. TIMER. Available online: http://timer.cistrome.org (accessed on 1 May 2020).
  63. Li, B.; Severson, E.; Pignon, J.C.; Zhao, H.; Li, T.; Novak, J.; Jiang, P.; Shen, H.; Aster, J.C.; Rodig, S.; et al. Comprehensive analyses of tumor immunity: Implications for cancer immunotherapy. Genome Biol. 2016, 17, 174. [Google Scholar] [CrossRef] [Green Version]
  64. Li, T.; Fan, J.; Wang, B.; Traugh, N.; Chen, Q.; Liu, J.S.; Li, B.; Liu, X.S. TIMER: A web server for comprehensive analysis of tumor-infiltrating immune cells. Cancer Res. 2017, 77, e108–e110. [Google Scholar] [CrossRef] [PubMed] [Green Version]
  65. The Cancer Genome Atlas Program. Available online: https://www.cancer.gov/tcga (accessed on 1 May 2020).
  66. Genevestigator®. Available online: https://genevestigator.com (accessed on 1 May 2020).
  67. Chen, E.Y.; Tan, C.M.; Kou, Y.; Duan, Q.; Wang, Z.; Meirelles, G.V.; Clark, N.R.; Ma’ayan, A. Enrichr: Interactive and collaborative HTML5 gene list enrichment analysis tool. BMC Bioinform. 2013, 14, 128. [Google Scholar] [CrossRef] [PubMed] [Green Version]
  68. Kuleshov, M.V.; Jones, M.R.; Rouillard, A.D.; Fernandez, N.F.; Duan, Q.; Wang, Z.; Koplev, S.; Jenkins, S.L.; Jagodnik, K.M.; Lachmann, A.; et al. Enrichr: A comprehensive gene set enrichment analysis web server 2016 update. Nucleic Acids Res. 2016, 44, W90–W97. [Google Scholar] [CrossRef] [PubMed] [Green Version]
  69. Zheng, R.; Wan, C.; Mei, S.; Qin, Q.; Wu, Q.; Sun, H.; Chen, C.H.; Brown, M.; Zhang, X.; Meyer, C.A.; et al. Cistrome Data Browser: Expanded datasets and new tools for gene regulatory analysis. Nucleic Acids Res. 2019, 47, D729–D735. [Google Scholar] [CrossRef]
  70. Li, D.; Hsu, S.; Purushotham, D.; Sears, R.L.; Wang, T. WashU Epigenome Browser update 2019. Nucleic Acids Res. 2019, 47, W158–W165. [Google Scholar] [CrossRef]
  71. Ratnam, M.; Marquardt, H.; Duhring, J.L.; Freisheim, J.H. Homologous Membrane Folate Binding Proteins in Human Placenta: Cloning and Sequence of a cDNA. Biochemistry 1989, 28, 8249–8254. [Google Scholar] [CrossRef]
  72. Kurahara, H.; Takao, S.; Kuwahata, T.; Nagai, T.; Ding, Q.; Maeda, K.; Shinchi, H.; Mataki, Y.; Maemura, K.; Matsuyama, T.; et al. Clinical significance of folate receptor b-expressing tumor-associated macrophages in pancreatic cancer. Ann. Surg. Oncol. 2012, 19, 2264–2271. [Google Scholar] [CrossRef]
  73. Zhang, F.; Wei, K.; Slowikowski, K.; Fonseka, C.Y.; Rao, D.A.; Kelly, S.; Goodman, S.M.; Tabechian, D.; Hughes, L.B.; Salomon-Escoto, K.; et al. Defining inflammatory cell states in rheumatoid arthritis joint synovial tissues by integrating single-cell transcriptomics and mass cytometry. Nat. Immunol. 2019, 20, 928–942. [Google Scholar] [CrossRef]
  74. Kang, K.; Park, S.H.; Chen, J.; Qiao, Y.; Giannopoulou, E.; Berg, K.; Hanidu, A.; Li, J.; Nabozny, G.; Kang, K.; et al. Interferon-γ Represses M2 Gene Expression in Human Macrophages by Disassembling Enhancers Bound by the Transcription Factor MAF. Immunity 2017, 47, 235–250.e4. [Google Scholar] [CrossRef]
  75. Yarilina, A.; Park-Min, K.H.; Antoniv, T.; Hu, X.; Ivashkiv, L.B. TNF activates an IRF1-dependent autocrine loop leading to sustained expression of chemokines and STAT1-dependent type I interferon-response genes. Nat. Immunol. 2008, 9, 378–387. [Google Scholar] [CrossRef]
  76. Heinz, S.; Texari, L.; Hayes, M.G.; Urbanowski, M.; Chang, M.W.; Givarkes, N.; Rialdi, A.; White, K.M.; Albrecht, R.A.; Pache, L.; et al. Transcription Elongation Can Affect Genome 3D Structure. Cell 2018, 174, 1522–1536.e22. [Google Scholar] [CrossRef] [PubMed] [Green Version]
  77. Schmidt, S.V.; Krebs, W.; Ulas, T.; Xue, J.; Baßler, K.; Günther, P.; Hardt, A.L.; Schultze, H.; Sander, J.; Klee, K.; et al. The transcriptional regulator network of human inflammatory macrophages is defined by open chromatin. Cell Res. 2016, 26, 151–170. [Google Scholar] [CrossRef] [PubMed] [Green Version]
  78. Seuter, S.; Neme, A.; Carlberg, C. ETS transcription factor family member GABPA contributes to vitamin D receptor target gene regulation. J. Steroid Biochem. Mol. Biol. 2018, 177, 46–52. [Google Scholar] [CrossRef] [PubMed]
  79. Hao, H.; Qi, H.; Ratnam, M. Modulation of the folate receptor type β gene by coordinate actions of retinoic acid receptors at activator Sp1/ets and repressor AP-1 sites. Blood 2003, 101, 4551–4560. [Google Scholar] [CrossRef] [PubMed] [Green Version]
  80. Sadasivan, E.; Cedeno, M.M.; Rothenberg, S.P. Characterization of the gene encoding a folate-binding protein expressed in human placenta. Identification of promoter activity in a G-rich SP1 site linked with the tandemly repeated GGAAG motif for the ets encoded GA-binding protein. J. Biol. Chem. 1994, 269, 4725–4735. [Google Scholar]
  81. Kwok, J.C.; Perdomo, J.; Chong, B.H. Identification of a monopartite sequence in PU.1 essential for nuclear import, DNA-binding and transcription of myeloid-specific genes. J. Cell. Biochem. 2007, 101, 1456–1474. [Google Scholar] [CrossRef]
  82. Zaba, L.C.; Fuentes-Duculan, J.; Steinman, R.M.; Krueger, J.G.; Lowes, M.A. Normal human dermis contains distinct populations of CD11c +BDCA-1+ dendritic cells and CD163+FXIIIA + macrophages. J. Clin. Invest. 2007, 117, 2517–2525. [Google Scholar] [CrossRef] [Green Version]
  83. Hu, Y.; Wang, B.; Shen, J.; Low, S.A.; Putt, K.S.; Niessen, H.W.; Matteson, E.L.; Murphy, L.; Ruppert, C.; Jansen, G.; et al. Depletion of activated macrophages with a folate receptor-beta-specific antibody improves symptoms in mouse models of rheumatoid arthritis. Arthritis Res. Ther. 2019, 21, 143. [Google Scholar] [CrossRef] [Green Version]
  84. Chandrupatla, D.M.S.H.; Molthoff, C.F.M.; Lammertsma, A.A.; van der Laken, C.J.; Jansen, G. The folate receptor β as a macrophage-mediated imaging and therapeutic target in rheumatoid arthritis. Drug Deliv. Transl. Res. 2019, 9, 366–378. [Google Scholar] [CrossRef] [Green Version]
  85. Verweij, N.J.; Yaqub, M.; Bruijnen, S.T.; Pieplenbosch, S.; Ter Wee, M.M.; Jansen, G.; Chen, Q.; Low, P.S.; Windhorst, A.D.; Lammertsma, A.A.; et al. First in man study of [18F]fluoro-PEG-folate PET: A novel macrophage imaging technique to visualize rheumatoid arthritis. Sci. Rep. 2020, 10, 1047. [Google Scholar] [CrossRef] [Green Version]
  86. Lynn, R.C.; Feng, Y.; Schutsky, K.; Poussin, M.; Kalota, A.; Dimitrov, D.S.; Powell, D.J., Jr. High-affinity FRβ-specific CAR T cells eradicate AML and normal myeloid lineage without HSC toxicity. Leukemia 2016, 30, 1355–1364. [Google Scholar] [CrossRef]
  87. Mayor, S.; Rothberg, K.G.; Maxfield, F.R. Sequestration of GPI-anchored proteins in caveolae triggered by cross-linking. Science 1994, 264, 1948–1951. [Google Scholar] [CrossRef] [PubMed]
  88. Sabharanjak, S.; Sharma, P.; Parton, R.G.; Mayor, S. GPI-anchored proteins are delivered to recycling endosomes via a distinct cdc42-regulated clathrin-independent pinocytic pathway. Dev. Cell. 2002, 2, 411–423. [Google Scholar] [CrossRef] [Green Version]
  89. Chatterjee, S.; Smith, E.R.; Hanada, K.; Stevens, V.L.; Mayor, S. GPI anchoring leads to sphingolipid-dependent retention of endocytosed proteins in the recycling endosomal compartment. EMBO J. 2001, 20, 1583–1592. [Google Scholar] [CrossRef] [Green Version]
  90. Yang, J.; Chen, H.; Vlahov, I.R.; Cheng, J.X.; Low, P.S. Characterization of the pH of folate receptor-containing endosomes and the rate of hydrolysis of internalized acid-labile folate-drug conjugates. J. Pharmacol. Exp. Ther. 2007, 321, 462–468. [Google Scholar] [CrossRef]
  91. Eychene, A.; Rocques, N.; Pouponnot, C. A new MAFia in cancer. Nat. Rev Cancer. 2008, 8, 683–693. [Google Scholar] [CrossRef] [PubMed]
  92. Machacek, C.; Supper, V.; Leksa, V.; Mitulovic, G.; Spittler, A.; Drbal, K.; Suchanek, M.; Ohradanova-Repic, A.; Stockinger, H. Folate Receptor β Regulates Integrin CD11b/CD18 Adhesion of a Macrophage Subset to Collagen. J. Immunol. 2016, 197, 2229–2238. [Google Scholar] [CrossRef] [Green Version]
  93. Zanoni, I.; Ostuni, R.; Marek, L.R.; Barresi, S.; Barbalat, R.; Barton, G.M.; Granucci, F.; Kagan, J.C. CD14 controls the LPS-induced endocytosis of toll-like receptor 4. Cell 2011, 147, 868–880. [Google Scholar] [CrossRef] [Green Version]
  94. Jiang, Z.; Georgel, P.; Du, X.; Shamel, L.; Sovath, S.; Mudd, S.; Huber, M.; Kalis, C.; Keck, S.; Galanos, C.; et al. CD14 is required for MyD88-independent LPS signaling. Nat. Immunol. 2005, 6, 565–570. [Google Scholar] [CrossRef]
  95. Wu, Z.; Zhang, Z.; Lei, Z.; Lei, P. CD14: Biology and role in the pathogenesis of disease. Cytokine Growth Factor Rev. 2019, 48, 24–31. [Google Scholar] [CrossRef]
  96. Kok, D.E.; Steegenga, W.T.; Smid, E.J.; Zoetendal, E.G.; Ulrich, C.M.; Kampman, E. Bacterial folate biosynthesis and colorectal cancer risk: More than just a gut feeling. Crit. Rev. Food Sci. Nutr. 2020, 60, 244–256. [Google Scholar] [CrossRef] [PubMed]
  97. Engevik, M.A.; Morra, C.N.; Röth, D.; Engevik, K.A.; Spinler, J.K.; Devaraj, S.; Crawford, S.E.; Estes, M.K.; Kalkum, M.; Versalovic, J. Microbial Metabolic Capacity for Intestinal Folate Production and Modulation of Host Folate Receptors. Front. Microbiol. 2019, 10, 2305. [Google Scholar] [CrossRef]
  98. Bader, J.E.; Enos, R.T.; Velázquez, K.T.; Carson, M.S.; Nagarkatti, M.; Nagarkatti, P.S.; Chatzistamou, I.; Davis, J.M.; Carson, J.A.; Robinson, C.M.; et al. Macrophage depletion using clodronate liposomes decreases tumorigenesis and alters gut microbiota in the AOM/DSS mouse model of colon cancer. Am. J. Physiol. Gastrointest. Liver Physiol. 2018, 314, G22–G31. [Google Scholar] [CrossRef] [PubMed]
Figure 1. Expression of FOLR2 and FRβ in human tissue-resident macrophages. (A) Identification of genes of the “anti-inflammatory gene set” whose expression most significantly correlate with FOLR2 expression, using Genevestigator® [66]. Pearson´s correlation coefficients are indicated in each case. (B) Overlapping of M-MØ-specific and GM-MØ-specific genes within the lists of monocyte- or macrophage-restricted genes in human colon samples [55]. (C) Identification of M-MØ-specific genes specific within the lists of monocyte- and macrophage-restricted genes in human colon samples. (D) FRβ expression in distinct normal tissues. Light microscopy images of the macrophage marker CD68 and FRβ staining in colon, tonsil and skeletal muscle (magnification, ×20). The right panel indicates a higher magnification (magnification ×40) for FRβ staining. Left, staining yielded by normal rabbit serum, used as a control (pre-immune); (E) Co-expression of FRβ and CD163 in colon, tonsil and skeletal muscle. Confocal images of human colon, tonsil and skeletal muscle tissue sections, as determined by double immunofluorescence analysis of CD163 (green) and FRβ (red) expression. Yellow color indicates the FRβ/CD163 merged colocalizing areas. Right panels show a magnification of a FRβ/CD163 colocalizing area (marked in a box in left panels); (FG) Co-expression of FRβ and CD163 in human dermis (F) and placenta (G). Confocal images of human tissue sections, as determined by triple immunofluorescence analysis of Von Willebrand factor (white), CD163 (green) and FRβ (red) expression. Yellow color indicates the FRβ/CD163 merged co-localizing areas. The area marked by boxes is shown at a higher magnification in the right panel. Nuclei are counterstained with DAPI. Scale bars: 50 μm.
Cells 09 01445 g001
Figure 2. Expression of FOLR2 and FRβ in human tumor-associated macrophages. (A) Overlapping of M-MØ-specific and GM-MØ-specific genes within the lists of macrophage-specific genes in human melanoma [57] or head and neck squamous carcinoma (HNSC) samples [58]. (B) Identification of M-MØ-specific genes specific within the lists of macrophage-specific genes in human melanoma [57] and head and neck squamous carcinoma samples [58]. (C) Correlation of the expression of the FOLR2 gene and the expression of the 21-gene dataset shown in B. The correlation with the expression of MAF, MAFB and SPI1 is also shown. The shaded area indicates the significant positive correlations. (D) Correlation of the expression of the FOLR2 gene with the expression of CD163 in breast carcinoma and HNSC (TCGA Cohort). (E) Co-expression of FRβ and CD163 in human melanoma (upper panels) and a human melanoma xenograft (lower panels) using confocal microscopy after double immunofluorescence analysis of CD163 (red) and FRβ (green) expression. Yellow color indicates the FRβ/CD163 merged colocalizing areas. Right panels show a magnification of the FRβ/CD163 colocalizing area (marked in a box in left panels). (F) FRβ and CD68 expression in a sample of human colon adenocarcinoma. Light microscopy images of the macrophage marker CD68 and FRβ staining (magnification, ×20). (G) Enrichr analysis [67,68] of the genes indicated in panel B. (H) Correlation of the expression of the FOLR2 and SPI1 genes in colon adenocarcinoma and HNSC (TCGA Cohort). (I) Correlation of the expression of the FOLR2 gene with MAF and SPI1 expression in breast carcinoma (METABRIC Cohort). (J) Partial correlation of FOLR2 expression with the expression of MAF or SPI1 in the indicated tumors.
Cells 09 01445 g002
Figure 3. Expression of FOLR2 and FRβ in human synovium. (A) Identification of genes of the “anti-inflammatory gene set” whose expression most significantly correlates with FOLR2 expression in RA, using Genevestigator® [66]. Pearson´s correlation coefficients are indicated in each case. (B) Expression of genes of the “anti-inflammatory gene set” in each of the four monocyte subsets defined in inflamed synovial tissue by scRNA-seq [69]. (C,D) Comparison of the expression of representative M-MØ-specific (“anti-inflammatory gene set”) and GM-MØ-specific genes in control and inflamed synovial membrane (C) and synovial fluid (D). (E) Co-expression of FRβ and CD163 in human synovial membrane from an RA patient using confocal microscopy after double immunofluorescence analysis of CD163 (red) and FRβ (green) expression. Yellow color indicates the FRβ/CD163 merged colocalizing areas.
Cells 09 01445 g003
Figure 4. Structural and functional analysis of the FOLR2 proximal regulatory region. (A) Identification of PU.1-binding sites immediately upstream of the first exon of the indicated genes (data obtained from CistromeDB 92249 [72]). (B) ChIP score of the indicated genes in the PU.1 ChIP-Seq experiment done on human macrophages (data obtained from CistromeDB 67929 [73]). (C) Schematic representation of the first exon of the FOLR2 gene, with indication of predicted transcription factor binding sites [70]. (D) Schematic representation of the ChIP-Seq data on the FOLR2 gene from the indicated experiments. (E) Nucleotide sequence of the first exon of the human FOLR2 gene (uppercase) and flanking sequences (lowercase), with indication of the PU.1-binding elements. (F) HeLa cells were transfected with the indicated FOLR2 promoter-based reporter plasmids in the presence of an empty vector or expression vector for PU.1. For each individual reporter construct, fold induction represents the luciferase activity yielded by PU.1 expression vector relative to the activity produced by an identical amount of empty CMV-0 plasmid. Luciferase activity was determined after 24 h. Data represent the mean ± standard deviation of five independent experiments using two different DNA preparations. The nucleotide sequence of the PU.1-binding elements in the WT and mutant constructs is indicated at the top.
Cells 09 01445 g004
Figure 5. PU.1 enhances FOLR2 gene promoter activity and increases FOLR2 gene expression. (A) Upper histograms, FRβ expression (empty histograms) in monocytes, K-562, THP-1 and M-MØ macrophages, as determined by flow cytometry. Lower histograms, internalization of Folate-FITC by monocytes, THP-1, K-562 and M-MØ macrophages, in the absence (black line) or the presence (dotted line) of a 100-molar excess of folic acid. Filled histograms indicate cell autofluorescence. In each case, the percentage of marker-positive cells and the mean fluorescence intensity (in parenthesis) are indicated. The experiment was performed five times, and one of the experiments is shown. (B) Detection of FOLR2 and GAPDH mRNA by RT-PCR on RNA from CD14+ peripheral blood monocytes, K-562, THP-1 and M-MØ macrophages. Molecular size markers were loaded in lane 5. (C) THP-1 cells were nucleofected with the indicated reporter plasmids and luciferase activity was determined after 24h. Promoter activity is expressed relative to the activity produced by the wild-type pFOLR2-200pXP2, arbitrarily set to 1, after normalization for transfection efficiency (n = 6). (D,E) siRNA-mediated knockdown of PU.1. THP-1 cells were nucleofected with either siRNA for PU.1 (siRNA PU.1) or a control siRNA (siRNA CNT). After 24 h, one third of the cells were lysed and subjected to western blot for PU.1 expression (D), and total RNA was isolated and FOLR2 and PCFT mRNA were determined by quantitative RT-PCR (E). Results are expressed as relative mRNA levels (relative to GAPDH mRNA levels and the corresponding mRNA level in control #1 siRNA-nucleofected cells). The experiment was performed in duplicate, and both experiments are shown.
Cells 09 01445 g005

