Abstract
Human chondrocytes are expanded and used in autologous chondrocyte implantation techniques and are known to rapidly de-differentiate in culture. These chondrocytes, when cultured on tissue culture plastic (TCP), undergo both phenotypical and morphological changes and quickly lose the ability to re-differentiate to produce hyaline-like matrix. Growth on synoviocyte-derived extracellular matrix (SDECM) reduces this de-differentiation, allowing for more than twice the number of population doublings (PD) whilst retaining chondrogenic capacity. The goal of this study was to apply RNA sequencing (RNA-Seq) analysis to examine the differences between TCP-expanded and SDECM-expanded human chondrocytes. Human chondrocytes from three donors were thawed from primary stocks and cultured on TCP flasks or on SDECM-coated flasks at physiological oxygen tension (5%) for 4 passages. During log expansion, RNA was extracted from the cell layer (70–90% confluence) at passages 1 and 4. Total RNA was column-purified and DNAse-treated before quality control analysis and next-generation RNA sequencing. Significant effects on gene expression were observed due to both culture surface and passage number. These results offer insight into the mechanism of how SDECM provides a more chondrogenesis-preserving environment for cell expansion, the transcriptome-wide changes that occur with culture, and potential mechanisms for further enhancement of chondrogenesis-preserving growth.
1. Introduction
Arthritis is not only a debilitating disease, but an expensive one, with total arthritis-attributable medical expenditures and lost earnings surpassing $300 billion USD in 2013 [1]. Tissue engineering methods have been applied as a means to treat osteoarthritic lesions and they hold great potential for joint repair. However, human chondrocytes, expanded and used in autologous chondrocyte implantation techniques, are known to rapidly de-differentiate in culture [2], which has a detrimental impact on their utility for tissue engineering applications. The use of the term de-differentiation is distinct from the use of the term in re-programming or stem cell literature, as it indicates that the cells no longer have the ability to form hyaline-like cartilage tissue. Culture-expanded chondrocytes undergo both morphological and phenotypical changes and, eventually, lose the ability to produce hyaline like matrix. By passage 4, chondrogenic potential is essentially absent when tested in re-differentiation culture. This loss of differentiation potential limits their efficacy in the clinic and seriously impedes our ability to produce clinical-scale tissue engineering of human cartilage with suitable biomechanical properties.
Synoviocyte-derived extracellular matrix has been shown to support enhanced chondrocyte expansion whilst retaining re-differentiation potential in human [3] and porcine cells [4]. Next-generation sequencing offers an opportunity to take a global view of the transcriptional changes that occur during in vitro culture both on tissue culture plastic and on devitalized synoviocyte matrix. Relatively few RNA sequencing (RNA-Seq) studies have been conducted on human chondrocytes partially due to the dense extracellular matrix they form, making RNA isolation problematic in terms of both yield and quality. No RNA-Seq reports on the effect of synoviocyte matrix or the effect of culture de-differentiation were found. This study is an expansion of previous work [3] which showed typical chondrocyte-related gene expression changes by RT-qPCR (COL1A1, COL2A1, SOX9, ACAN, MATN1, MMP13, COL10A1) the levels of which, by fragments per kilobase of exon model per million fragments mapped reads (FPKM), are well correlated. In addition, RNA-Seq has been shown to be well correlated with RT-qPCR data across over 15,300 genes [5]. Preliminary analysis of the effect of passage on the transcriptome of chondrocytes grown on tissue culture plastic (TCP) was presented [6]. The results from this study give us a deeper understanding of chondrocyte biology, thus providing a better foundation for future therapeutic interventions.
2. Materials and Methods
Human chondrocytes (three donors) were thawed from frozen, end of primary culture stocks collected under an institutional review board (IRB)-approved protocol (H-36683) of the IRB for Baylor College of Medicine and Affiliated Hospitals. Chondrocytes were cultured on TCP flasks and synoviocyte-derived extracellular matrix (SDECM) at physiological oxygen tension (5%) for 4 passages (Figure 1) in growth media (DMEM-LG [HyClone, Pittsburgh, PA, USA] supplemented with 10% FBS [Atlanta Biologicals, Flowery Branch, GA, USA] and 1% penicillin/streptomycin [Gibco, Gaithersburg, MD, USA]). At the end of the first and fourth passage, cells were lysed and RNA extracted from the cell layer during the log expansion (70–90% confluence) phase. Cell lysis was performed using a guanidine chloride-based buffer (TRK Lysis buffer; (E.Z.N.A.® Tissue RNA Kit, Omega Bio-Tek, Norcross, GA, USA) and the lysate was frozen on dry ice and stored (−80 °C, 1–6 weeks). Companion flasks that were not lysed were trypsinized (0.25% trypsin/EDTA; Gibco, Gaithersburg, MD, USA) for 5 min at 37 °C, then trypsin-neutralized with an equal volume of growth media. Cells were collected and centrifuged (500× g, 5 min, room temperature). Cell pellets were resuspended and an aliquot counted using a hemocytometer with trypan blue (1:1; Gibco). Cells were seeded at 6000 cells/cm2 and media were exchanged on day 2–3 and the cells cultured for 5–6 days at each passage.

Figure 1.
Experimental outline and comparisons. (A) Experimental setup: human articular chondrocytes were thawed from frozen stocks and seeded onto both synoviocyte-derived extracellular matrix (SDECM) and tissue culture plastic (TCP) flasks, passaged 4 times and RNA collected at passage (P) P1 and P4 for RNA sequencing (RNA-Seq) analysis. (B) Comparisons of gene expression profiles (1) P1 vs. P4 on TCP, (2) P1 vs. P4 on SDECM, (3) TCP vs. SDECM at P1, (4) TCP vs. SDECM at P4. (C) Network and gene enrichment analyses of differentially expressed genes from each comparison.
When all flasks had been lysed, total RNA was isolated from the lysate after thawing on ice using column purification (Direct-zol RNA mini-prep, Zymo Research, Irvine, CA, USA), as per manufacturer’s instructions, with on-column DNA digest (DNase I, Zymo Research). RNA Purity was analyzed by a 260 nm/280 nm ratio (Tecan Nanoquant, Morrisville, NC, USA) and degradation/quality assessed using an Agilent Bioanalyzer (Genomic and RNA Profiling Core at Baylor College of Medicine, Houston, TX, USA). Samples were then submitted for next-generation RNA sequencing. mRNAs were captured by oligo-dT magnetic beads and fragmented. First-strand cDNA was generated using random primers, and second-strand cDNA was synthesized with deoxyuridine triphosphate (dUTP). The library was generated using the ds cDNA as a template. Briefly, templates were end-repaired, and a 3′A was added before Y-shaped adaptors were added to each end. The strand with dUTP was then digested using uracil-DNA glycosylase prior to PCR. Sequencing was carried out on Illumina HiSeq 2000. RNA-Seq reads were mapped to human genome hg19 and splice junction sites with Bowtie (v0.12.7) [7] and Tophat (v2.0.0) [8]. Read counts mapped to each gene were calculated by HTseq [9], and fragments per kilobase of exon model per million fragments mapped reads (FPKM) values were calculated using Cufflinks (version 2.1.1; http://cole-trapnell-lab.github.io/cufflinks/releases/v2.1.1/) [10]. Differential expression was analyzed with R (http://www.R-project.org) [11] and the Bioconductor R package DESeq [12]. Heatmaps were generated from FPKM values with heatmap3. Genes with an adjusted p-value less than 0.01 and greater than a 2log2 (4-fold change) expression were considered to be differentially expressed. Network analysis was performed using STRING (http://string-db.org) [13]. Gene Ontology (GO) term enrichment was queried using a logically accelerated GO term finder (LAGO) [14]. Common genes were determined by combining table queries and uncommon genes by unmatched queries in Microsoft Access (v14.0.7214.5000, Redmond, WA, USA). GO Term lists were downloaded from Jax [15].
RNA-Seq data was deposited in the SRA database under accession number SRP156000.
3. Results
Chondrocytes grown on TCP typically expanded for 1.8 population doublings (PD) in P1 and 1.4 PD at P4, while those grown on SDECM expanded 3.6 PD in P1 and 4.0 PD at P4 [3]. At the end of P4, cells grown on TCP had undergone 7.6 PDs and those on SDECM had undergone 16.0 PDs. RNA was of high quality with RNA integrity numbers (RINs) ≥7.6 (See supplemental data Figure S1 for electropherograms and Table S1 for summary). Principal component analysis showed that donors clustered by both passage (P1 vs. P4) and surface (SDECM vs. TCP; Figure 2).
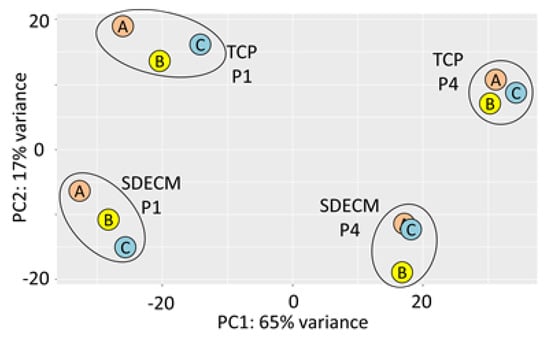
Figure 2.
Principal component analysis. Samples are clearly clustered by their passage (P) in principal component (PC) PC1 and surface in PC2; donors are indicated by the letter within the circle (A, B, C).
Many genes were significantly affected by passage and culture surface, an overview of the up and down regulated genes for each comparison is shown in Table 1. Of the genes that were differentially regulated between P1 and P4, 512 were common between the two comparisons with 228 genes being upregulated at P4 and 283 genes downregulated. Only lipase G (LIPG) switched direction in cells cultured on the two different surfaces, being downregulated at P4 on SDECM and upregulated on TCP. Looking at the genes that were not common between the two surfaces, 175 were upregulated on TCP and 337 were downregulated. The upregulated genes in this subset were enriched for terms such as “tissue development” and “multicellular development”. The downregulated genes were enriched for terms like “skeletal development”, “system development” and “extracellular region”. Of the 251 genes on SDECM that were not common between the two comparisons, 88 genes were upregulated and 163 downregulated. The upregulated genes in this subset were not enriched for any biological process, cellular component or molecular function. The downregulated genes in this subset were enriched for sterol-, cholesterol-, and lipid-related terms.

Table 1.
Summary of differentially expressed genes (Adjusted p-value < 0.01 and log2 fold-change >2).
The top 20 genes for each comparison, in terms of adjusted p-value, are shown in Table 2 and Table 3. Full lists of differentially expressed genes, the gene count output from HTseq, the FPKM output from Cufflinks, and the results of DESeq comparisons are shown in supplemental data (S2).
Table 2.
Top 20 differentially expressed genes in comparisons 1 and 2.
Table 3.
Top 20 differentially expressed genes in comparisons 3 and 4.
In comparisons 1 and 2, the major enriched pathways by GO analysis were cell cycle-associated. This was primarily due to the upregulated genes and resulted in an increase in both the G1/S and G2/M cell cycle checkpoint genes (Figure 3 and Figure 4). Downregulated genes were enriched for GO terms like “system development” and “multicellular organism development”. Genes were tallied from GO terms associated with positive or negative regulation of the cell cycle; there is an increase in the number of genes negatively regulating cell proliferation on TCP (140 genes vs. 51 on SDECM). However, caution should be exercised in using these GO term lists alone, as 44 of the 182 genes were present in both positve and negative terms. There were 35 genes associated only with positive regulation of proliferation on SDECM at P4 and 23 on TCP; 25 genes were only associated with negative regulation of proliferation on SDECM at P4 and 95 on TCP (tabulated data are included in S5).

Figure 3.
TCP cell cycle-associated genes. A summary of some of the cell cycle-associated genes from LAGO analysis which were upregulated in P4 chondrocytes on TCP. Similar cell cycle enrichment was seen in upregulated genes at P4 on SDECM (Figure 4). Red arrows connecting the genes to a term indicate inhibition of that term, blue arrows = promotion and black arrows = association. For the full interaction chart see S3 (TCP) and for the list of Gene Ontology (GO) terms which were significantly enriched see S5.
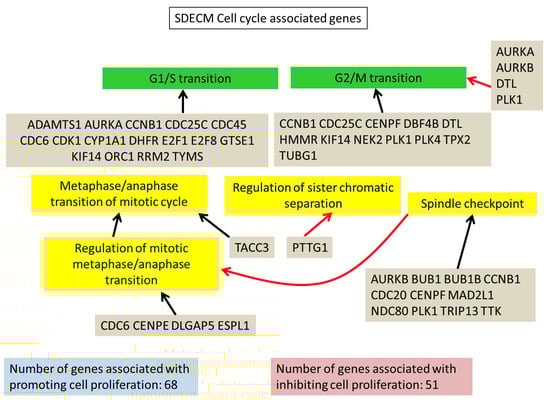
Figure 4.
SDECM cell cycle-associated genes. A summary of some of the cell cycle-associated genes from LAGO analysis which were upregulated in P4 chondrocytes on SDECM. Red arrows connecting the genes to a term indicate inhibition of that term, blue arrows = promotion and black arrows = association. For the full interaction chart see S4 (SDECM) and for the list of GO terms which were significantly enriched see S5.
The GO term for “extracellular matrix organization” (GO: 0030198) is associated with 268 genes. When the differentially expressed genes from comparisons 1, 2, 3, and 4 were queried with this list, 50 genes were identified as being differentially expressed in one or more comparison (Figure 5). Comparison 1 showed differential expression of 30 genes, with eight of those genes being upregulated at P4 on TCP, and 22 downregulated at P4 on TCP. Comparison 2 identified 22 differentially expressed genes, 4 of which were upregulated at P4 on SDECM and 18 downregulated at P4 on SDECM. Extracellular matrix disassembly (GO: 0022617) identified 29 genes, of which only three genes were differentially regulated in any of the comparisons: matrix metalloproteinase 13 (MMP13), semaphorin 5A (SEMA5A) and fibroblast growth factor receptor 4 (FGFR4). MMP13 decreased with passage on both surfaces but was increased at both P1 and P4 by culture on SDECM. SEMA5A was increased at P1 by culture on SDECM. FGFR4 significantly decreased with passage on SDECM but was increased on SDECM in comparison with TCP at P1.

Figure 5.
Differentially expressed extracellular matrix organization genes. This heatmap shows differentially expressed genes from the four comparisons which are associated with the GO term “extracellular matrix organization”. Donor (A, B, C), passage (1, 4) and surface (P = TCP and S = SDECM) are indicated at the top of the heatmap. The gene symbol is to the right of the heatmap. The arrows indicate which comparisons were significantly different at a ≥4-fold change with p < 0.01; no arrow means that the comparison did not meet that threshold (1 = TCP P1 vs. P4, 2 = SDECM P1 vs. P4, 3 = TCP vs. SDECM at P1, 4 = TCP vs. SDECM at P4). A red arrow pointing upwards ( ) indicates that gene expression increased and a blue downward-pointing arrow (
 ) that it decreased.
) indicates that gene expression increased and a blue downward-pointing arrow () that it decreased.
Of the 204 genes that are identified by the gene ontology term “cartilage development” (GO:0051216), 43 genes were differentially expressed in one or more comparisons. At P4 on TCP, 28 genes were significantly decreased vs. 16 on SDECM at P4; only four were upregulated on TCP and three on SDECM (Figure 6).

Figure 6.
Differentially expressed cartilage development genes. Heatmap summary of differentially expressed genes associated with the GO term “cartilage development”. Donor (A, B, C), passage (1, 4), and surface (P = TCP and S = SDECM) are indicated at the top of the heatmap. The gene symbol is to the right of the heatmap. The arrows indicate which comparisons were significantly different at a ≥4-fold change with p < 0.01; no arrow means that the comparison did not meet that threshold (1 = TCP P1 vs. P4, 2 = SDECM P1 vs. P4, 3 = TCP vs. SDECM at P1, 4 = TCP vs. SDECM at P4). A red arrow pointing upwards () indicates that gene expression increased and a blue downward-pointing arrow () that it decreased.
) indicates that gene expression increased and a blue downward-pointing arrow () that it decreased.
Looking at genes associated with the GO Term “cell senescence” (GO:0090398, 63 genes), nine were differentially regulated in comparison 1: BCL6, C2orf40, NOX4, SERPINE1, BRCA2, FBXO5, SUV39H1, CDK1, and FOXM1. Four of these genes were also differentially regulated in comparison 2: NOX4, CDK1, FOXM1, and C2orf40.
COL2A1 is a well-known marker for hyaline cartilage, and since it was decreased in all four comparisons, transcription factors regulating its expression were further investigated. Only BCL6 and PPARG were significantly downregulated ≥4-fold on TCP, and PPARG alone on SDECM. The conversion from type II collagen expression to type I collagen expression is a distinctive marker for fibrocartilage vs. hyaline cartilage [16,17]. While COL1A1 is not one of those genes which met the 4-fold increase selection criterion, it was still increased 2.8-fold on TCP with an adjusted p-value of 1 × 10⁻³⁰; the upregulation on SDECM was 1.2-fold and non-significant. Out of the over 300 transcription factors with an identified (or potential) binding sequence in the COL1A1 gene [18] only five were significantly upregulated on TCP and 4 on SDECM Table 4.
Table 4.
Upregulated 1 transcription factors in the COL1A1 gene promoter/enhancer.
When considering the effect of culture surface, in comparison 3, the most significantly enriched GO terms related to extracellular matrix (14 of 115 GO terms, p < 0.01; S5). Downregulated genes were also significantly enriched for “extracellular matrix” and “cell motility” GO Terms (S6). Upregulated genes were enriched for GO Terms related to development and differentiation (S7).
In comparison 4, the most significantly enriched GO terms related to “development” and “extracellular matrix”. “Extracellular matrix” terms dominated the enriched GO term list for downregulated genes (S8) whilst neuron-related terms predominated in the upregulated GO term list (S5, S9). Of the 339 differentially expressed genes at P4, 107 were common with P1; 52 went up and 55 went down. Two genes switched their direction: angiopoietin-like 7 (ANGPTL7) went from being downregulated on SDECM at P1 to being upregulated on SDECM at P4; laminin subunit gamma 2 (LAMC2) was upregulated on SDECM at P1 and flipped to being downregulated at P4. GO Term analysis of the downregulated genes recapitulated the predominance of terms for “extracellular matrix” as did the upregulated genes for neuronal terms. Differentially expressed genes at P1 that were not common between the two surface comparisons: 224 genes, 99 were upregulated on SDECM and 125 were downregulated. Upregulated genes were enriched in GO terms for extracellular matrix organization and vasculature development. Downregulated genes were enriched in GO terms for “extracellular region”. Differentially expressed genes at P4 that were not common between the two surface comparisons: 232 genes, 110 were upregulated on SDECM and 122 were downregulated. Upregulated genes were enriched in GO terms for “multicellular” and “system development”. Downregulated genes were enriched in cellular component GO terms for “extracellular region”. Selection of genes that were unchanged on SDECM between P1 and P4 (less than a 10% increase or decrease), but that were significantly differentially expressed on TCP gave 15 genes (Table 5).
Table 5.
Stable genes on SDECM (P1 vs. P4) that were differentially expressed on TCP 1.
4. Discussion
The earliest RNA-Seq study on chondrocytes appears to be that by Peffers et al. [19] comparing young and old horse cartilage. Peffers et al. found 396 genes changed more than 2.6-fold with a p-value <0.05; a relatively smaller differential gene expression than that reported in this study. In fact, the large number of differentially expressed genes prompted the more stringent p-value and higher fold-change cut offs. There was a large degree of correlation between comparisons 1 and 2, with half of the top 20 genes being differentially regulated. Overall, half of the genes were common from the TCP comparison and two-thirds of those from the SDECM comparison. The coincidence of the differential regulation of two lipid-related genes—lipase G (LIPG) and peroxisome proliferator activated receptor gamma (PPARG)—is interesting particularly since PPARG stimulation by Rosiglitazone has been shown to be chondroprotective [19]. This chondroprotection potentially acts through a blunting of NF-kappa-B-mediated inflammatory signals [20]. However, in a more recent study, Xu et al. found that PPARG stimulation was detrimental to the expression of COL2A1 and promoted hypertrophy [21]. It is worth noting that the transcription factors SOX9 and SOX6, commonly thought essential for chondrogenesis, were not significantly downregulated on SDECM at P4; this is potentially a major contributor to the perpetuation of chondrogenicity found in cells cultured on synoviocyte matrix. Interestingly, SOX5, another putative essential cartilage transcription factor [22,23], is 3.4-fold downregulated at P4 on TCP (Padj 7.9 × 10⁻¹¹) vs. 1.7-fold downregulated at P4 on SDECM (Padj 6.4 × 10⁻⁴), and SOX5 was upregulated in both comparisons 3 and 4 (1.4-fold and 2.8-fold respectively).
Whilst immortalized hepatocytes have been shown to increase hepatocyte markers when cultured on soft substrates [24], this has not been shown for de-differentiated primary human chondrocytes. An increase in chondrogenic markers is often achieved in cell culture expanded cells [25,26]. However, the expression of these markers is commonly deficient when compared to non-expanded chondrocytes. Also, soft substrates do not promote, but inhibit expansion [27]. In the case of hepatocytes and b-cells, de-differentiation has been linked to epithelial–mesenchymal transition [28]; this would not be the case for chondrocytes, as stimulation of transforming growth factor beta (TGFβ) pathways, rather than inhibition, promotes chondrogenesis.
The increase in cell cycle control genes could be indicative of cell culture adaptation, as this was described by Barta et al. [29] who showed increased cyclin E and cyclin A in human embryonic stem cells cultured for over 240 passages; both cyclins were increased at passage 4 (3.2-fold and 9.1-fold in comparisons 1 and 2, respectively). This potentially futile growth, a conversion from reversible cell cycle arrest to irreversible senescence, could be indicative of geroconversion as described by Blagosklonny [30,31,32]. Interestingly, by blocking mTOR signaling using rapamycin, several studies have shown a positive impact on chondrogenesis and in osteoarthritis [33,34,35]. When we looked at cell senescence-associated genes several were differentially regulated at higher passage on both surfaces. Those genes, NOX4, CDK1, FOXM1, and C2orf40, represent interesting targets for modulation to further enhance the retention of chondrogenic capacity found on synoviocyte matrix. F-box protein 5 (FBXO5) is notable because of its presence in the cells passaged on TCP (comparison 1, Figure 3) and its absence on SDECM (comparison 2, Figure 4). FBXO5 is part of the Skp, Cullin, F-box containing complex that catalyzes the ubiquitination of proteins marking them for degradation. Increased FBXO5 could result in more cells being held at the G1/S and G2/M checkpoints but warrants more study. The increased number of genes promoting proliferation on SDECM vs. TCP (Figure 3 and Figure 4), and perhaps more importantly, the ratio of genes promoting vs. inhibiting proliferation is thought to be partially responsible for the increased proliferation of chondrocytes on SDECM.
Comparisons 3 and 4 resulted in upregulation of development-related genes and down regulation of matrix-associated genes and those involved in motility. It is postulated that, because there is an extracellular matrix already present, the chondrocytes are less invested in laying down a new matrix. Chondrocytes in their native environment are relatively immobile though in vitro motility has been demonstrated by several studies [36]. The potential reduction in movement on SDECM could indicate that the chondrocytes are in a more “native” state and is another interesting avenue for investigation.
Genes that were stable on SDECM but significantly changed on TCP were identified, as this represents the pool of genes that could be targeted for modulation to recapitulate the effects of growth on SDECM (Table 5). Network and gene enrichment analyses of the genes in Table 4 showed no overall connection between them. This is potentially a consequence of the dearth of studies on the musculoskeletal transcriptome, particularly in cartilage, whereas many cancer studies have contributed to the gene ontology terms and their association. It should also be noted that chondrocyte proliferation, studied here, appears to be a somewhat separate process from chondrogenesis or cartilage development in terms of differentiation markers.
5. Conclusions
Chondrocyte growth on devitalized synoviocyte matrix dramatically changes the transcriptomic signature of the cells, predominantly in extracellular matrix-associated genes and those related to cell motility. De-differentiation due to passage of chondrocytes also dramatically alters the transcriptome, predominantly resulting in cell cycle gene expression changes.
Supplementary Materials
The supplementary materials are available online at http://www.mdpi.com/2073-4409/8/2/85/s1.
Author Contributions
Conceptualization, T.J.K. and J.E.D.; Data curation, T.J.K. and Z.G.; Formal analysis, T.J.K. and Z.G.; Funding acquisition, T.J.K., R.C., and J.E.D.; Investigation, T.J.K. and Y.L.; Methodology, T.J.K., Y.L., and R.C.; Project administration, J.E.D.; Resources, R.C. and J.E.D.; Supervision, R.C. and J.E.D.; Visualization, T.J.K.; Writing—original draft, T.J.K.; Writing—review and editing, T.J.K., R.C., and J.E.D.
Funding
This research was funded by Baylor College of Medicine (J.E.D.) and the Bone Disease Program of Texas (T.J.K.). The sequencing was performed at the functional genomics core which is partially supported by the shared instrument grant S10OD023469 to R.C.
Conflicts of Interest
The authors declare no conflict of interest. The funders had no role in the design of the study; in the collection, analyses, or interpretation of data; in the writing of the manuscript, or in the decision to publish the results.
References
- Murphy, L.B.; Cisternas, M.G.; Pasta, D.J.; Helmick, C.G.; Yelin, E.H. Medical Expenditures and Earnings Losses Among US Adults With Arthritis in 2013. Arthritis Care Res. 2018, 70, 869–876. [Google Scholar] [CrossRef] [PubMed]
- Giovannini, S.; Diaz-Romero, J.; Aigner, T.; Mainil-Varlet, P.; Nesic, D. Population doublings and percentage of S100-positive cells as predictors of in vitro chondrogenicity of expanded human articular chondrocytes. J. Cell. Physiol. 2010, 222, 411–420. [Google Scholar] [CrossRef] [PubMed]
- Kean, T.J.; Dennis, J.E. Synoviocyte Derived-Extracellular Matrix Enhances Human Articular Chondrocyte Proliferation and Maintains Re-Differentiation Capacity at Both Low and Atmospheric Oxygen Tensions. PLoS ONE 2015, 10, e0129961. [Google Scholar]
- Pei, M.; He, F. Extracellular matrix deposited by synovium-derived stem cells delays replicative senescent chondrocyte dedifferentiation and enhances redifferentiation. J. Cell. Physiol. 2012, 227, 2163–2174. [Google Scholar] [CrossRef] [PubMed]
- Everaert, C.; Luypaert, M.; Maag, J.L.V.; Cheng, Q.X.; Dinger, M.E.; Hellemans, J.; Mestdagh, P. Benchmarking of RNA-sequencing analysis workflows using whole-transcriptome RT-qPCR expression data. Sci Rep. 2017, 7, 1559. [Google Scholar] [CrossRef] [PubMed]
- Kean, T.J.; Koelewyn, S.; Ge, Z.; Li, Y.; Chen, R.; Dennis, J.E. Transcriptome-Wide Analysis of Human Chondrocyte Dedifferentiation on TC Plastic. In Proceedings of the Orthopedic Research Society Annual Meeting, Orlando, FL, USA, 5–8 March 2016. [Google Scholar]
- Langmead, B.; Trapnell, C.; Pop, M.; Salzberg, S.L. Ultrafast and memory-efficient alignment of short DNA sequences to the human genome. Genome Biol. 2009, 10. [Google Scholar] [CrossRef] [PubMed]
- Trapnell, C.; Pachter, L.; Salzberg, S.L. TopHat: Discovering splice junctions with RNA-Seq. Bioinformatics 2009, 25. [Google Scholar] [CrossRef] [PubMed]
- Anders, S.; Pyl, P.T.; Huber, W. HTSeq—A Python framework to work with high-throughput sequencing data. Bioinformatics 2015, 31, 166–169. [Google Scholar] [CrossRef] [PubMed]
- Trapnell, C.; Williams, B.A.; Pertea, G.; Mortazavi, A.; Kwan, G.; van Baren, M.J.; Salzberg, S.L.; Wold, B.J.; Pachter, L. Transcript assembly and quantification by RNA-Seq reveals unannotated transcripts and isoform switching during cell differentiation. Nat. Biotechnol. 2010, 28, 511–515. [Google Scholar] [CrossRef]
- R Core Team. R: A Language and Environment for Statistical Computing. R Foundation for Statistical Computing: Vienna, Austria, 2018. Available online: https://www.R-project.org/ (accessed on 9 December 2018).
- Love, M.I.; Huber, W.; Anders, S. Moderated estimation of fold change and dispersion for RNA-seq data with DESeq2. Genome Biol. 2014, 15, 550. [Google Scholar] [CrossRef]
- Szklarczyk, D.; Morris, J.H.; Cook, H.; Kuhn, M.; Wyder, S.; Simonovic, M.; Santos, A.; Doncheva, N.T.; Roth, A.; Bork, P.; et al. The STRING database in 2017: quality-controlled protein-protein association networks, made broadly accessible. Nucleic Acids Res. 2017, 45. [Google Scholar] [CrossRef] [PubMed]
- Boyle, E.I.; Weng, S.; Gollub, J.; Jin, H.; Botstein, D.; Cherry, J.M.; Sherlock, G. GO::TermFinder—Open source software for accessing Gene Ontology information and finding significantly enriched Gene Ontology terms associated with a list of genes. Bioinformatics 2004, 20, 3710–3715. [Google Scholar] [CrossRef] [PubMed]
- Jax. Gene Ontology Browser. 2018. Available online: http://www.informatics.jax.org/vocab/gene_ontology/ (accessed on 8 November 2018).
- Marlovits, S.; Hombauer, M.; Truppe, M.; Vecsei, V.; Schlegel, W. Changes in the ratio of type-I and type-II collagen expression during monolayer culture of human chondrocytes. J. Bone Jt. Surg. J. 2004, 86, 286–295. [Google Scholar] [CrossRef] [PubMed]
- Melrose, J.; Smith, S.; Cake, M.; Read, R.; Whitelock, J. Comparative spatial and temporal localisation of perlecan, aggrecan and type I.; II and IV collagen in the ovine meniscus: An ageing study. Histochem. Cell Biol. 2005, 124, 225–235. [Google Scholar] [CrossRef] [PubMed]
- Rosen, N.; Chalifa-Caspi, V.; Shmueli, O.; Adato, A.; Lapidot, M.; Stampnitzky, J.; Safran, M.; Lancet, D. GeneLoc: Exon-based integration of human genome maps. Bioinformatics 2003, 19, i222–i224. [Google Scholar] [CrossRef] [PubMed]
- Peffers, M.; Liu, X.; Clegg, P. Transcriptomic signatures in cartilage ageing. Arthritis Res. Ther. 2013, 15, R98. [Google Scholar] [CrossRef] [PubMed]
- Cuzzocrea, S.; Mazzon, E.; Dugo, L.; Patel, N.S.; Serraino, I.; Di Paola, R.; Genovese, T.; Britti, D.; De Maio, M.; Caputi, A.P.; et al. Reduction in the evolution of murine type II collagen-induced arthritis by treatment with rosiglitazone, a ligand of the peroxisome proliferator-activated receptor gamma. Arthritis Rheum. 2003, 48, 3544–3556. [Google Scholar] [CrossRef]
- Xu, J.; Lv, S.; Hou, Y.; Xu, K.; Sun, D.; Zheng, Y.; Zhang, Z.; Li, X.; Li, Y.; Chi, G. miR-27b promotes type II collagen expression by targetting peroxisome proliferator-activated receptor-gamma2 during rat articular chondrocyte differentiation. Biosci. Rep. 2018, 38. [Google Scholar] [CrossRef]
- Liu, C.F.; Lefebvre, V. The transcription factors SOX9 and SOX5/SOX6 cooperate genome-wide through super-enhancers to drive chondrogenesis. Nucleic Acids Res. 2015, 43, 8183–8203. [Google Scholar] [CrossRef]
- De Crombrugghe, B.; Lefebvre, V.; Behringer, R.R.; Bi, W.; Murakami, S.; Huang, W. Transcriptional mechanisms of chondrocyte differentiation. Matrix Biol. 2000, 19, 389–394. [Google Scholar] [CrossRef]
- Cozzolino, A.M.; Noce, V.; Battistelli, C.; Marchetti, A.; Grassi, G.; Cicchini, C.; Tripodi, M.; Amicone, L. Modulating the Substrate Stiffness to Manipulate Differentiation of Resident Liver Stem Cells and to Improve the Differentiation State of Hepatocytes. Stem Cells Int. 2016, 2016, 5481493. [Google Scholar] [CrossRef] [PubMed]
- Recha-Sancho, L.; Moutos, F.T.; Abella, J.; Guilak, F.; Semino, C.E. Dedifferentiated Human Articular Chondrocytes Redifferentiate to a Cartilage-Like Tissue Phenotype in a Poly(epsilon-Caprolactone)/Self-Assembling Peptide Composite Scaffold. Materials 2016, 9, 472. [Google Scholar] [CrossRef] [PubMed]
- Zhang, T.; Gong, T.; Xie, J.; Lin, S.; Liu, Y.; Zhou, T.; Lin, Y. Softening Substrates Promote Chondrocytes Phenotype via RhoA/ROCK Pathway. ACS Appl. Mater. Interfaces 2016, 8, 22884–22891. [Google Scholar] [CrossRef] [PubMed]
- Callahan, L.A.; Ganios, A.M.; Childers, E.P.; Weiner, S.D.; Becker, M.L. Primary human chondrocyte extracellular matrix formation and phenotype maintenance using RGD-derivatized PEGDM hydrogels possessing a continuous Young’s modulus gradient. Acta Biomater. 2013, 9, 6095–6104. [Google Scholar] [CrossRef] [PubMed]
- Efrat, S. Mechanisms of adult human beta-cell in vitro dedifferentiation and redifferentiation. Diabetes Obes. Metab. 2016, 18 (Suppl. 1), 97–101. [Google Scholar] [CrossRef] [PubMed]
- Barta, T.; Dolezalova, D.; Holubcova, Z.; Hampl, A. Cell cycle regulation in human embryonic stem cells: Links to adaptation to cell culture. Exp. Biol. Med. 2013, 238, 271–275. [Google Scholar] [CrossRef]
- Blagosklonny, M.V. Geroconversion: Irreversible step to cellular senescence. Cell Cycle 2014, 13, 3628–3635. [Google Scholar] [CrossRef]
- Blagosklonny, M.V. Cell cycle arrest is not senescence. Aging 2011, 3, 94–101. [Google Scholar] [CrossRef]
- Leontieva, O.V.; Blagosklonny, M.V. Gerosuppression in confluent cells. Aging 2014, 6, 1010–1018. [Google Scholar] [CrossRef]
- De Luna-Preitschopf, A.; Zwickl, H.; Nehrer, S.; Hengstschlager, M.; Mikula, M. Rapamycin Maintains the Chondrocytic Phenotype and Interferes with Inflammatory Cytokine Induced Processes. Int. J. Mol. Sci. 2017, 18, 1494. [Google Scholar] [CrossRef]
- Yan, B.; Zhang, Z.; Jin, D.; Cai, C.; Jia, C.; Liu, W.; Wang, T.; Li, S.; Zhang, H.; Huang, B.; et al. mTORC1 regulates PTHrP to coordinate chondrocyte growth, proliferation and differentiation. Nat. Commun. 2016, 7, 11151. [Google Scholar] [CrossRef] [PubMed]
- Preitschopf, A.; Schorghofer, D.; Kinslechner, K.; Schutz, B.; Zwickl, H.; Rosner, M.; Joo, J.G.; Nehrer, S.; Hengstschlager, M.; Mikula, M. Rapamycin-Induced Hypoxia Inducible Factor 2A Is Essential for Chondrogenic Differentiation of Amniotic Fluid Stem Cells. Stem Cells Transl. Med. 2016, 5, 580–590. [Google Scholar] [CrossRef] [PubMed]
- Morales, T.I. Chondrocyte moves: Clever strategies? Osteoarthr. Cartil. 2007, 15, 861–871. [Google Scholar] [CrossRef] [PubMed]


© 2019 by the authors. Licensee MDPI, Basel, Switzerland. This article is an open access article distributed under the terms and conditions of the Creative Commons Attribution (CC BY) license (http://creativecommons.org/licenses/by/4.0/).