Abstract
The aggressiveness of pancreatic ductal adenocarcinoma (PDAC) has been linked to cancer stem cells (CSCs) and telomerase activity; however, the mechanism underlying this association remains unclear. In this study, we engineered dual transcriptional reporters (SORE6-GFP and TERT-BFP) to isolate SOX2+OCT4+TERThigh subpopulations from AsPC-1 and BxPC-3 cells. We combined Fluorescence-Activated Cell Sorting with functional assays, RNA-seq, and network analysis. Clinically, tumors co-expressing high SOX2/OCT4/TERT levels were associated with reduced overall survival, whereas single-gene elevations were not prognostic. We identified a minority SOX2+OCT4+TERThigh fraction (~9%) enriched for pluripotency transcripts (SOX2, OCT4, NANOG, and ALDH1A1), which exhibited the highest proliferative, migratory, and invasive capacities. Transcriptomic profiling of SOX2+OCT4+TERThigh cells showed enrichment of KRAS, telomere maintenance, epithelial–mesenchymal transition, and developmental pathways (WNT and Hedgehog). Connectivity profiling highlighted actionable vulnerabilities, including NF-κB, WNT, and telomerase inhibition pathways. Together, these data define an aggressive telomerase-engaged, pluripotency-driven CSC-like state in PDAC and suggest testable therapeutic strategies that target TERThigh dependencies.
1. Introduction
Pancreatic ductal adenocarcinoma (PDAC) is the most frequent and deadliest form of pancreatic cancer, with a 5-year survival rate of approximately 12% [1]. Alarmingly, PDAC is projected to become the second leading cause of cancer-related deaths by 2040 [2]. Despite therapeutic advances, numerous factors drive PDAC lethality, including the inability to detect the disease until late in progression, often after distant metastasis and marked resistance to chemotherapy and radiotherapy [3]. Two combination regimens have emerged as the first-line therapy in metastatic pancreatic ductal adenocarcinoma, FOLFIRINOX and the combination of gemcitabine and nab-paclitaxel. However, significant toxicity and resistance constrain their benefits [4,5]. There is an urgent need to identify efficient therapeutic strategies for patients with PDAC.
PDAC tumors are characterized by pronounced cellular heterogeneity, including cancer stem cell (CSC) populations, which are thought to sustain progression, chemoresistance, and metastasis [6,7]. Pancreatic CSCs are distinguished by their ability to self-renew and generate differentiated cells. Recent studies suggest that CSC properties can be gained and lost depending on the microenvironment, indicating that CSCs are not stable but rather a highly plastic cell population [8]. Several markers, including CD133, CD24, CD44, NANOG, SOX2, and POU5F1 (OCT4), have been proposed for the identification of CSCs in PDAC, indicating high heterogeneity within this population [9,10,11]. SOX2 is aberrantly expressed in aggressive PDAC cells and contributes to cell proliferation and stemness/dedifferentiation by regulating a set of genes controlling G1/S transition and epithelial-to-mesenchymal transition (EMT) phenotype. OCT4 is overexpressed and has been implicated in stemness, carcinogenesis, metastasis, drug resistance, and epithelial–mesenchymal transition (EMT) [10,11].
Telomerase reverse transcriptase (TERT), an RNA-dependent DNA polymerase, synthesizes telomeric DNA and adds it to the linear chromosome ends to maintain telomere length [12]. Beyond its canonical role, TERT has been implicated in non-telomeric functions that influence survival signaling, metastasis, and stem cell self-renewal [13]. Mechanistically, TERT acts as a transcriptional cofactor that potentiates two oncogenic axes. TERT associates with BRG1 to activate the promoters of WNT/β-catenin target genes, such as Myc and CyclinD1 [14]. TERT also binds to the NF-κB p65 subunit and is recruited to NF-κB-responsive promoters, enhancing the expression of genes linked to tumor progression [15]. Telomerase expression is a near-universal feature of cancer [16]. In the pancreas, telomerase is upregulated in invasive PDAC, and polymorphisms in the TERT locus are associated with an increased risk of PDAC [17]. Additionally, TERThigh cells have been proposed to tolerate and maintain oncogenic KRAS, promoting cell expansion and creating fields of aberrant cells that seed tumorigenesis [18]. Nevertheless, whether TERT is expressed in pancreatic CSCs and how TERT-positive cells contribute to progression remain unresolved.
Here, we address this gap using a dual-reporter strategy, SOX2/OCT4-response element-driven Green Fluorescent Protein (GFP) and TERT-promoter-driven Blue Fluorescent Protein (BFP), to isolate SOX2+OCT4+TERThigh and SOX2+OCT4+TERTlow subpopulations from pancreatic cancer cell lines and investigate their molecular, functional, and phenotypic properties. We found that the subpopulation of SOX2+OCT4+TERThigh cells exhibited enhanced proliferation, migration, and invasion, along with a transcriptomic program enriched for telomere maintenance, pluripotency, EMT, and developmental pathways. Causal network analysis supported the coordinated activation of these signaling axes. Finally, we identified compounds specific to the selected molecular targets and mechanisms that may eventually lead to novel treatments for aggressive TERThigh cells.
2. Materials and Methods
2.1. Bioinformatic Analysis
Pearson’s correlation between the cancer stemness index and TERT expression was calculated using the stemness index (mRNAsi) for The Cancer Genome Atlas (TCGA) downloaded from a pan-cancer study [19], and TERT mRNA expression levels in pancreatic cancer were obtained from the TCGA PanCan Atlas.
To evaluate the expression levels of SOX2, POU5F1 (OCT4), and TERT, RNA-seq data from three publicly available sources were used: pancreatic cancer tissues from TCGA PanCan Atlas https://gdc.cancer.gov/node/905/ (accessed on 3 May 2025), healthy pancreatic tissue from the GTEx portal https://www.gtexportal.org/home/ (accessed on 3 May 2025), and the pancreatic cancer cell lines AsPC-1 and BxPC-3 from the Cancer Cell Line Encyclopedia https://sites.broadinstitute.org/ccle (accessed on 3 May 2025).
The prognostic impact of SOX2, OCT4 and TERT expression on overall survival (OS) and relapse-free survival (RFS) in pancreatic ductal adenocarcinoma patients was evaluated using the Kaplan–Meier Plotter https://kmplot.com/analysis/index.php?p=home (accessed on 9 May 2025). Patients were stratified into high- and low-expression groups based on SOX2, OCT4, TERT, and the combined SOX2/OCT4/TERT signature.
2.2. Cell Culture and Reagents
AsPC-1, BxPC-3 pancreatic cancer, and HEK-293T cells were obtained from the American Type Culture Collection (ATCC, Manassas, VA, USA). All cell lines were authenticated by the ATCC. Cells were cultured according to the ATCC recommendations. AsPC-1 and BxPC-3 cells were cultured in RPMI 1640 medium (ATCC 30-2001, Manassas, VA, USA) supplemented with 10% fetal bovine serum (FBS) (Gibco, Cat. No. 16000044; Thermo Fisher Scientific, Waltham, MA, USA) and 1% penicillin–streptomycin (10,000 U/mL; Cat. No. 15140122. Thermo Fisher Scientific, Waltham, MA, USA). HEK-293T cells were maintained in Dulbecco’s Modified Eagle Medium (DMEM; ATCC 30-2002, Manassas, VA, USA) supplemented with 10% FBS and 1% penicillin–streptomycin for lentiviral production. The cell lines were cultured at 37 °C in a 5% CO2 humidified atmosphere. When the cells reached approximately 80% confluency, they were trypsinized, harvested, washed, and used for experiments or passaged for further expansion.
2.3. Generation of Lentiviral Reporter Constructs
To mark pluripotency factor activity, the SORE6-GFP lentiviral reporter (six concatenated SOX2/OCT4 response elements driving GFP) was used [20]. SORE6-GFP lentiviral reporters were kindly provided by Dra. Lalage M. Wakefield (National Cancer Institute (NCI), Bethesda, MD, USA). To mark telomerase transcription, a TERTpromoter driving the BFP lentiviral reporter was generated. The blue fluorescent protein (BFP) sequence was synthesized (Integrated DNA Technologies, IDT, Coralville, IA, USA) and amplified using ClonaAmp HiFi premix (Takara Bio USA, Mountain View, CA, USA). PCR product purification was performed using the QIAquick PCR purification Kit (QIAGEN, Germantown, MD, USA). BFP was cloned into the lentiviral reporter vector pL-mP (Addgene_81225, Watertown, MA, USA), replacing the green fluorescent protein (GFP) sequence with the BFP. The human telomerase promoter region, which originates from the HR-TERT-promoter vector (Addgene_71398, Watertown, MA, USA), was obtained by PCR using ClonaAmp HiFi premix (Takara Bio, Mountain View, CA, USA). PCR product purification was performed using the QIAquick PCR purification Kit (QIAGEN, Germantown, MD, USA). The TERT promoter was cloned into the pL-mP-BFP vector using an In-Fusion cloning kit (Takara Bio, Mountain View, CA, USA). In contrast, to generate the control vector CMV-BFP, the BFP sequence was cloned into the vector pcDNA 3.1 (Invitrogen Thermo Fisher Scientific, Waltham, MA, USA, Cat. No. V790-20). E. coli One Shot Stbl3 electrocompetent cells (Thermo Fisher Scientific, Rockford, IL, USA, Cat. No. C737303) were used for plasmid amplification. The QIAprep Spin Miniprep Kit (QIAGEN, Germantown, MD, USA) and HiSpeed Plasmid Midi Kit were used for all plasmid purification (QIAGEN, Germantown, MD, USA, Cat. No. 12643). All inserts and junctions were verified by Sanger sequencing.
2.4. Generation of Lentiviruses and Infections
To identify SOX2+OCT4+TERThigh cells, TERT-BFP and SORE6-GFP lentiviral reporter vectors were used. Lentiviral particles were produced by co-transfecting HEK-293T cells with a lentiviral packaging system (pCMV-VSV-G_8454 and psPAX_12260, Addgene (Watertown, MA, USA)) and transfer plasmid (Table A1, Appendix B) using LipofectamineTM 2000 (Invitrogen, Waltham, MA, USA) reagent according to the manufacturer’s protocol. Before transfection, plasmid DNA was purified using an endotoxin-free Maxiprep kit (Qiagen Cat. No. 12362, Germantown, MD, USA to ensure optimal transfection efficiency and to prevent cytotoxicity. Viral supernatants were harvested after 48 and 72 h post-transfection and filtered through a 0.45 μm pore size membrane (Millipore Thermo Fisher Scientific, Waltham, MA, USA). The viral pellet was stored at −80 °C in single-use aliquots to avoid repeated freeze-thaw cycles. To generate double-reporter cell lines, human AsPC-1 and BxPC-3 pancreatic tumor cells were infected with TERT-BFP viral supernatants supplemented with 8 μg/mL polybrene (TR-1003-G, Millipore Sigma, Burlington, MA, USA). Subsequently, BFP+ cells were isolated by FACS, returned to culture, and transduced with the second reporter (SORE-6) supplemented with 8 μg/mL polybrene and selected with 2–10 μg/mL puromycin (P9620, Sigma-Aldrich, Millipore Sigma, Burlington, MA, USA) for 15 days to select transfected cells. To generate GFP+, BFP−, and GFP− control cell lines, cells were infected with CMV-GFP (pLJM1-EGFP, Addgene_19319 (Watertown, MA, USA)), mP-BFP, or minCMVp-GFP, respectively, supplemented with 8 μg/mL polybrene, and selected with 2–10 μg/mL puromycin or FACS. The transduction efficiency was typically >80%.
To generate BFP+ control cells, the cells were transfected with the CMV-BFP vector using Lipofectamine 2000TM (Invitrogen, Thermo Fisher Scientific, Waltham, MA, USA) according to the manufacturer’s protocol. After 24 h, transduced cells were selected by the addition of 200 μg/mL of G418 (A1720; Sigma-Aldrich, Millipore Sigma, Burlington, MA, USA) for 30 days to select transfected cells.
2.5. Flow Cytometry and Fluorescence-Activated Cell Sorting (FACS)
Subconfluent double-reporter AsPC-1 and BxPC-3 cell lines were collected by trypsinization, washed with PBS, and resuspended in buffer (PBS with FBS 1%). Flow cytometry and FACS were performed using BD FACSAria II (Becton Dickinson, Franklin Lakes, NJ, USA) for GFP and BFP expression. The sorted cells were harvested and grown under standard culture conditions for 24 h before any further procedures. Cells transduced with minCMVp-GFP or mP-BFP lentivirus were used as matched negative controls for gating. Cells generated with the CMV-GFP or CMV-BFP vectors were used as compensation controls. Sorted fractions were defined as SOX2+OCT4+TERThigh (GFPhighBFPhigh), SOX2+OCT4+TERTlow (GFPhighBFPlow) and SOX2−OCT4−TERT− (GFP−BFP−). Flow cytometry data were analyzed using the FlowJo version 10.8.1 software package (Tree Star, Ashland, OR, USA).
2.6. Analysis of Stemness Markers by Flow Cytometry
For comparative phenotyping, a total of 4 × 10⁵ sorted cells were stained with CD24-PE (clone ML5, 555428, BD Biosciences, San Jose, CA, USA) and EpCAM-APC (347200), or cells were stained with CD133-PE (clone AC133, 130-112-157, Miltenyi Biotec, Bergisch Gladbach, Germany) and EpCAM-APC (clone HEA125, 347200, BD Biosciences, San Jose, CA, USA) for 30 min on ice. The isotypes IgG2a-PE (clone 130-117-787, Miltenyi Biotec, Bergisch Gladbach, Germany), IgG1-PE (clone 130-092-212, Miltenyi Biotec, Bergisch Gladbach, Germany), and IgG1-APC (clone 130-092-214, Miltenyi Biotec, Bergisch Gladbach, Germany) were used as the staining control. Cells were analyzed using a BD FACSAria II instrument (Beckton Dickinson, Franklin Lakes, NJ, USA), and the data were analyzed using the FlowJo software package.
2.7. Fluorescence Microscopy
Sorted cell populations were grown on glass coverslips in a 6-well plate and fixed with 4% paraformaldehyde (Sigma-Aldrich, St. Louis, MO, USA) for 30 min. The cells were washed with PBS, and the slides were mounted in Everbrite mounting medium (Biotium Inc., Hayward, CA, USA) and stored at 4 °C. Images were acquired using a ZEISS-Axio Scope.A1 microscope (Carl-Zeiss, Oberkochen, Germany) and analyzed using ImageJ version 2.16.0 (National Institutes of Health, Bethesda, MD, USA) and Adobe Photoshop version 25.3.1 (Adobe Inc., San Jose, CA, USA).
2.8. RT-PCR and Quantitative Real-Time PCR (qPCR)
Total RNA was isolated from sorted cell populations using TRIzol reagent (Life Technologies, Thermo Fisher Scientific, Waltham, MA, USA) according to the manufacturer’s instructions. RNA concentration and purity were determined using a NanoDropTM2000c (Thermo Fisher Scientific, Waltham, MA, USA) spectrophotometer by measuring the A260/A280 ratio, and integrity was verified by 1% agarose gel electrophoresis. Two micrograms of RNA were reverse transcribed using the Maxima First Strand cDNA Synthesis Kit (Thermo Fisher Scientific, Rockford, IL, USA) with random hexamer primers (Invitrogen). Quantitative real-time PCR was conducted using the SYBR-select Master kit (Thermo Fisher Scientific, Rockford, IL, USA) and amplified on a QuantStudio 7 Real-Time PCR System (Applied Biosystems, Thermo Fisher Scientific, Waltham, MA, USA) using SYBR Green chemistry. Primer sequences provided in Table A2 Appendix B were designed in the Primer 3 plus software. The relative expression level of each gene was normalized to the peptidyl-prolyl cis-trans isomerase (PPIA) gene and calculated using the CT value based on the 2−ΔΔCt method [21].
2.9. Cell Proliferation Assays
Cell proliferation was assessed by the MTS assay using the Cell Titer 96 Aqueous One Solution Cell Proliferation Assay Kit (G5430, Promega Corporation, Madison, WI, USA). Briefly, 5000 sorted cell populations in RPMI-1640 medium without phenol red (Sigma-Aldrich, MilliporeSigma, Burlington, MA, USA) and free of FBS were seeded in 96-well plates and incubated at 37 °C in 5% CO2. Cell proliferation was evaluated at 24, 48, 72, and 96 h. The cells were incubated with the MTS reagent for 3 h at 37 °C in a 5% CO2 humidified atmosphere. The light absorbance of each well was measured using a Beckman Coulter DTX 880 Multimode Detector Spectrophotometer at a wavelength of 450 nm. As a negative control, cells were incubated in the presence of Ara-C 2 mM (C1768, Sigma-Aldrich, MilliporeSigma, Burlington, MA, USA) to inhibit proliferation.
2.10. In Vitro Cell Migration Assays
Cell migration capacity was evaluated using wound-healing assays. Sorted cell populations were suspended in a culture medium at 200,000 cells/mL, and 70 μL cell suspensions were pipetted into each chamber of the cell culture insert (Ibidi® 35 mm Culture Dishes containing Culture-Insert 2 Well systems. Cat. No. 80206; Ibidi GmbH, Gräfelfing, Germany). After the initial 24 h attachment period, the Culture-Insert 2 Well was gently removed using sterile forceps to create a defined cell-free gap (wound) of 500 μm, and the cells were incubated at 37 °C in a 5% CO2 humidified atmosphere. To ensure that wound closure reflected cell migration rather than proliferation, the medium was supplemented with 2 μM cytosine β-D-arabinofuranoside hydrochloride (C1768, Sigma-Aldrich, MilliporeSigma, Burlington, MA, USA) as a DNA synthesis inhibitor. Images were captured at 0 and 72 h at 10× magnification using an Eclipse TS100 microscope (Nikon, Kawasaki, Japan), and the cell-free space was determined using ImageJ software. Cell migration was represented as the percentage of wound closure.
2.11. In Vitro Cell Invasion Assays
The cell invasion capacity was evaluated using Boyden chambers. A 24-well Corning® BioCoat™ Matrigel® Invasion Chamber (354480, Corning Life Sciences, Corning, NY, USA) was used for the assay. The assay was performed according to the manufacturer’s instructions. Briefly, the Matrigel inserts were rehydrated using a medium free of SFB. After rehydration, 50,000 BxPC-3 or 100,000 AsPC-1 sorted cells were seeded in the upper chamber and cultured in serum-free medium. The lower chambers were loaded and filled with 600 μL medium containing 10% FBS as a chemoattractant or without FBS as a negative control. Cells were cultured at 37 °C in a 5% CO2 humidified atmosphere for 24 h. Inserts were then removed from the wells, and the cells on the upper surface of the Transwell membrane were removed. Migrating cells on the lower surface were rinsed with PBS, fixed with 70% ethanol, and stained with 0.1% crystal violet stain. Images were captured using an Eclipse TS100 microscope (Nikon, Kawasaki, Japan), and the migrating cells were quantified using ImageJ software.
2.12. Bulk RNA Sequencing
For RNA-seq analysis of SOX2+OCT4+TERTlow and SOX2+OCT4+TERThigh AsPC-1 cells, total RNA was isolated from sorted cell populations using TRIzol reagent (Life Technologies, Thermo Fisher Scientific, Waltham, MA, USA) according to the manufacturer’s instructions. RNA concentration and integrity were determined using a Qubit RNA Assay (Thermo Fisher Scientific, Waltham, MA, USA) and Bioanalyzer 2100/TapeStation (Santa Clara, CA, USA), respectively. Samples with an RNA integrity number of 10 were considered for transcriptome sequencing. Total RNA sequencing was performed using a NextSeq2000 (Illumina, San Diego, CA, USA) system with a paired-end 2 × 100 bp configuration, following the manufacturer’s standard protocol. Three biological replicates were used for analysis. RNA-seq processing and differential expression analyses were performed using the institute’s standardized workflows with minor modifications. Complete documentation of tools, parameters, and statistical criteria is publicly available online https://github.com/INMEGEN/Pipelines_Inmegen/tree/Principal (accessed on 30 May 2025). Clean reads were aligned to the GRCh 38 version of the human genome using the STAR algorithm and quantified using the FeatureCounts package. Differential expression between groups was determined using the DESeq2 algorithm. Genes with a fold change increment higher than 2 or less than −2, a p-value ≤ 0.05, and adjusted p-values (false discovery rate, FDR) ≤ 0.1 were further considered for subsequent analyses. To validate the RNA-seq data, qPCR was performed on differentially expressed genes. We selected differentially expressed genes with high read counts because the variance in those data is lower and the differences are more reliable. We also checked the expression values of these transcripts across replicates and chose genes with constant read counts between replicates.
2.13. Gene Set Enrichment Analysis (GSEA)
Data obtained from our RNA-seq was imported into the GSEA version 4.3.2 software downloaded from the following website: https://software.broadinstitute.org/gsea/index.jsp (accessed on 3 May 2025). Sets of genes related to different gene ontology processes served as reference genes to determine the biological processes enriched in our data. We only considered the gene set enrichment dataset with an FDR < 0.25.
2.14. Key Pathway Analysis
Ingenuity Pathway Analysis software (IPA-QIAGEN) version Q4 2025 was used to predict the regulatory networks and infer essential cellular pathways in SOX2+OCT4+TERThigh cells. This tool uses a list of differentially expressed genes obtained from RNA-seq.
2.15. Compounds Targeting Cells SOX2+OCT4+TERThigh
To determine which target drugs might be useful against SOX2+OCT4+TERThigh cells, the list of differentially expressed genes obtained from our RNA-seq analysis was analyzed using the Connectivity Map https://clue.io/ (accessed on 5 August 2025) of the Broad Institute to predict compounds that can activate or inhibit gene expression signatures. To further investigate the mechanism of action (MoA) and drug targets, we performed a specific analysis using Connectivity Map tools https://clue.io/query (accessed on 10 August 2025).
2.16. Statistical Analysis
Statistical analysis was performed using GraphPad Prism 7, and a 95% confidence interval was considered. A t-test or one- or two-way ANOVA with Tukey’s post hoc test was used to calculate statistical significance. All experiments were performed at least in triplicate.
3. Results
3.1. SOX2, OCT4, and TERT Are Expressed in Pancreatic Cancer, and Their Expression Affects the Survival Outcomes of Patients
Cancer cells exhibit stem-like characteristics, and active telomerase is a feature of stem cells [19,22]. Therefore, we examined the association between pancreatic cancer stemness and telomerase activity. To address this, we leveraged a pan-cancer stemness index derived from a transcriptional signature of 12,945 genes, originally defined by comparing embryonic stem cells with their differentiated progeny. In the pancreatic cancer cohort, we observed a significant positive correlation between stemness scores and TERT mRNA expression (R = 0.43, p = 3.2 × 10⁻⁹), indicating that tumors with higher telomerase levels exhibit stronger stem-like transcriptional programs (Figure 1a).
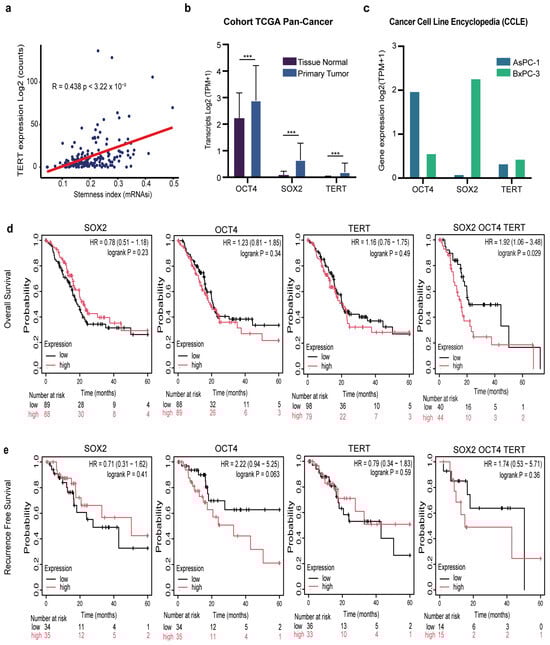
Figure 1.
Clinical and transcriptomic relevance of SOX2, OCT4, and TERT in pancreatic cancer. (a) Correlation between TERT expression (log2 counts) and stemness index (mRNAsi) across pancreatic tumors (Pearson’s r = 0.438, p = 3.22 × 10⁻⁹). (b) Differential expression of SOX2, OCT4, and TERT in the TCGA pan-cancer cohort comparing primary tumors with matched normal tissues (log2 TPM + 1). Data are presented as the mean ± SD *** p < 0.001 Student’s t-test. (c) Expression of SOX2, OCT4, and TERT in pancreatic cancer cell lines AsPC-1 and BxPC-3 from the CCLE database (log2 TPM + 1). (d) Kaplan–Meier overall survival (OS) analysis of patients with PDAC stratified by low (black) versus high (red) expression of SOX2, OCT4, TERT, or the combined SOX2/OCT4/TERT signature. Hazard ratios (HR), 95% confidence intervals (CI), and log-rank p-values are shown. (e) Kaplan–Meier recurrence-free survival (RFS) analysis for the same gene sets as in (d). Hazard ratios (HR), 95% confidence intervals (CIs), log-rank p-values, and numbers at risk are shown in each panel.
Having established the link between telomerase and pancreatic cancer stemness, and because SOX2 and OCT4 are established master regulators of stemness [19], we next analyzed the expression of the canonical pluripotency factors SOX2 and OCT4, together with TERT, in both patient-derived tumors and experimental models. Analysis of TCGA pancreatic cancer samples revealed a significant (*** p < 0.001) upregulation of SOX2, OCT4, and TERT in primary tumors compared to normal tissue (Figure 1b). Importantly, this pattern was recapitulated in established pancreatic cancer cell lines. Both AsPC-1 and BxPC-3 cells showed robust expression of these three genes (Figure 1c). This confirms that their overexpression is not restricted to clinical samples but represents a reproducible hallmark across experimental systems.
Several studies have shown that TERT and cancer stemness are associated with poor prognosis in patients with pancreatic cancer [23,24]. We also examined the prognostic relevance of SOX2, OCT4, and TERT expression in patients with pancreatic cancer. Kaplan–Meier analysis of the TCGA cohort demonstrated that, when considered individually, high expression of SOX2 (p = 0.23), OCT4 (p = 0.34), or TERT (p = 0.49) did not significantly impact overall survival (OS) (Figure 1d). Strikingly, however, patients whose tumors co-expressed high levels of all three genes displayed significantly reduced OS compared with their low-expression counterparts (p = 0.029) (Figure 1d). A similar trend was observed when recurrence-free survival (RFS) was analyzed. High SOX2 or TERT expression alone was not associated with a shorter RFS. However, patients with elevated OCT4 expression exhibited a strong tendency toward early recurrence, although this did not reach statistical significance (HR = 2.21, p = 0.056) (Figure 1e). Notably, combined overexpression of SOX2/OCT4/TERT also predicted poorer RFS, but this was not significant (Figure 1e). Together, these findings reveal that high co-expression of SOX2, OCT4, and TERT predicts worse overall survival, with a non-significant trend toward shorter recurrence-free survival and may be associated with another biological process.
3.2. Identification of a Minority Population SOX2+OCT4+TERThigh of Pancreatic Tumor Cell Population
Next, we investigated whether TERT is expressed in pancreatic CSCs and the functional contribution of TERT-expressing tumor cells and TERT-negative cells. To identify a telomerase-positive cancer stem-like subpopulation within pancreatic cancer cell lines, we established a dual lentiviral reporter strategy to simultaneously monitor SOX2/OCT4 and TERT activity. For telomerase, we engineered a lentiviral reporter construct in which the human TERT promoter was coupled to a minimal promoter driving BFP expression, enabling the identification of TERT cells. To label pancreatic CSCs SOX2+OCT+, we employed the SORE6 reporter, a previously validated system that identifies the CSCs population [20]. The SORE6 reporter contains six tandem repeats of a composite SOX2/OCT4 response element driving GFP expression. Thus, cells co-expressing SOX2/OCT4 and TERT could be visualized through dual GFP and BFP positivity (Figure 2a). To generate double-reporter cell lines, human AsPC-1 and BxPC-3 pancreatic tumor cells were genetically modified by transduction with lentiviral TERT-BFP and SORE6-GFP vectors for stable expression (Figure 2a). Validation of both reporters is shown in Appendix A: minimal promoter constructs yielded no detectable signals, whereas CMV controls were robustly fluorescent (Figure A1 Appendix A). Flow cytometry analyses revealed that dual GFP and BFP positivity (GFP+BFPhigh) defined a SOX2+OCT4+TERThigh minority population, representing approximately 9% of cultured cells in both AsPC-1 and BxPC-3 cells. A comparable frequency of GFP+BFPlow (SOX2+OCT4+TERTlow) cells, ranging from 9–18% depending on the cell line, was detected, indicating that reporter activation was restricted to a subset of tumor cells. Importantly, approximately 50% of the cells were telomerase-positive but negative for the stemness reporter (GFP−BFP+). Cells transduced with minimal promoter constructs lacking either the SORE6 element or TERT promoter served as gating controls and did not exhibit reporter activity (Figure 2b–d). Fluorescence microscopy further validated the reporter activity in the sorted subpopulations. SOX2+OCT4+TERThigh cells exhibited robust dual GFP and BFP fluorescence, whereas SOX2+OCT4+TERTlow and SOX2−OCT4−TERT− fractions showed correspondingly reduced or absent reporter expression (Figure 2e). Collectively, our data revealed an SOX2+OCT4+TERThigh subpopulation in AsPC-1 and BxPC-3 cell lines.
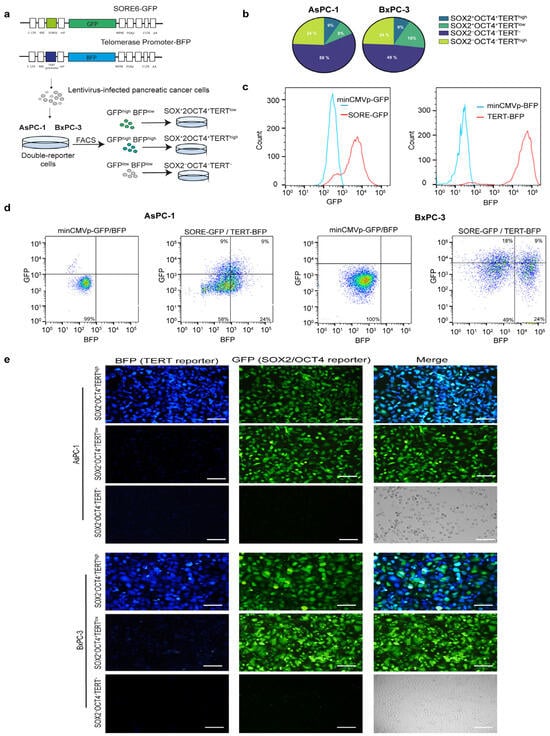
Figure 2.
Generation and validation of dual reporter pancreatic cancer cell lines to identify SOX2+OCT4+TERThigh subpopulations. (a) Schematic representation of lentiviral reporter constructs. TERThigh cells were identified using a vector in which the expression of BFP was controlled by the TERT gene promoter. SOX2+OCT4+ cells were identified using the SORE6 reporter, in which the SOX2/OCT4 composite response element drives the expression of GFP. Pancreatic cancer cells infected with lentiviruses were subjected to FACS and puromycin selection. GFP+BFPhigh, GFP+BFPlow, and GFP−BFP− pancreatic cancer cells were sorted using FACS. (b) Pie charts showing the distribution of reporter-positive populations in AsPC-1 and BxPC-3 cells following double-reporter transduction, quantified from the representative flow cytometry plots shown in (c,d). (c,d) Representative flow cytometry plots illustrating GFP and BFP expression in AsPC-1 and BxPC-3 cells. A minimal CMV control vector lacking SORE6 or TERT promoter elements was used as a gating control. (e) Representative fluorescence microscopy images of sorted SOX2+OCT4+TERThigh, SOX2+OCT4+TERTlow, and SOX2−OCT4−TERT− subpopulations in AsPC-1 and BxPC-3 cell lines. The Green-, Blue-Fluorescent Protein and merged channels are shown. Scale bars = 100 μm.
3.3. The Subpopulation SOX2+OCT4+TERThigh Is Enriched for Stem Cell Transcription Factors
To validate our reporter-defined subpopulations at the expression level, we analyzed the mRNA expression levels of SOX2, OCT4, and TERT. In addition, we measured NANOG and ALDH1A1, two canonical stemness markers, in the FACS-sorted fractions. Using qPCR, we found that the SOX2+OCT4+TERThigh population preferentially expressed CSC-associated markers compared to the negative fraction (Figure 3a). Although SOX2+OCT4+TERTlow cells also showed increased expression of these markers, their levels remained consistently lower than those of the TERThigh fraction (Figure 3a).
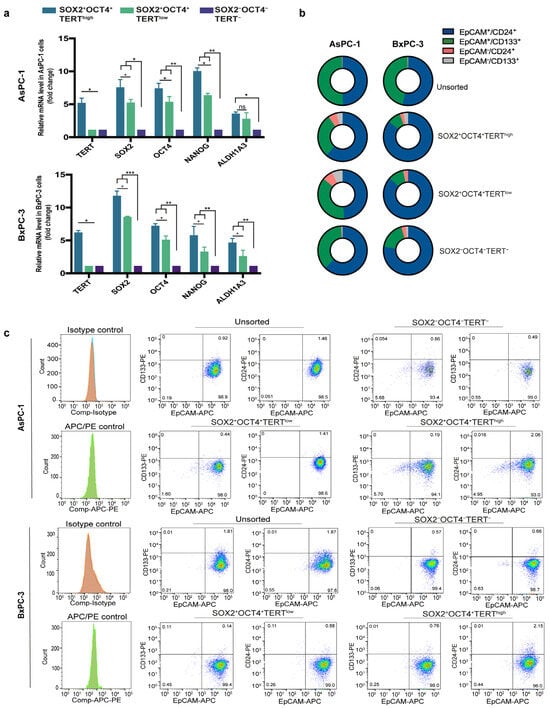
Figure 3.
Stemness validation of SOX2+OCT4+TERThigh subpopulations and comparison with conventional CSC markers. (a) Relative mRNA expression of SOX2, OCT4, TERT, NANOG, and ALDH1A1 in FACS-sorted SOX2+OCT4+TERThigh, SOX2+OCT4+TERTlow, and SOX2−OCT4−TERT− subpopulations from AsPC-1 and BxPC-3 cell lines, measured by qPCR. Gene expression was normalized to PPIA, and the relative levels between samples were calculated using the 2−ΔΔCt method. Data are presented as the mean ± SD; * p < 0.05, ** p < 0.01, *** p < 0.001; one-way ANOVA with Tukey’s post hoc test. (b) Schematic representation of the distribution of classical CSC markers (EpCAM+CD24+ and EpCAM+CD133+) across unsorted, SOX2+OCT4+TERThigh, SOX2+OCT4+TERTlow, and SOX2−OCT4−TERT− fractions from AsPC-1 and BxPC-3 cells. (c) Representative flow cytometry plots showing the experimental data underlying the distributions summarized in panel B. The dot plots are displayed using a pseudocolor (density) scale to visualize the local density of events: blue indicates low event density, whereas green/yellow/red indicate progressively higher event density.
Moreover, because pancreatic CSCs have also been defined by a combination of cell surface markers, most commonly CD44+CD24+EpCAM+ [9] and CD133+ [6], we next asked whether this reporter-defined stem-like subpopulation corresponded to these conventional markers. Surprisingly, flow cytometry analyses revealed that although EpCAM+CD24+ and EpCAM+CD133+ populations are present, their proportions do not show an increase in SOX2+OCT4+TERThigh or SOX2+OCT4+TERTlow (Figure 3b,c).
Together, these findings provide transcriptional validation of the reporter-defined populations and indicate that the SOX2+OCT4+TERThigh population represents a stem-like subset that is molecularly distinct from those identified by conventional surface markers. This observation supports the notion that pancreatic CSCs are heterogeneous and that different identification strategies may capture partially overlapping but biologically distinct subpopulations of cells.
3.4. The Subpopulation SOX2+OCT4+TERThigh Exhibits Elevated Proliferative, Migratory and Invasive Capacities
Telomerase is vital for the ability of malignant cells to replicate, while invasion and migration are key characteristics of cancer stem cells [6,25]. To test whether reporter-defined subpopulations exhibited functional differences, we compared the growth and motility of SOX2+OCT4+TERThigh and SOX2+OCT4+TERTlow AsPC-1 and BxPC-3 cells (Figure 4a). We first assessed the proliferative capacity using the MTS assay. SOX2+OCT4+TERThigh cells displayed the most pronounced proliferative activity, with significantly (p < 0.05) higher growth rates than SOX2+OCT4+TERTlow cells at 72 and 96 h (Figure 4b). Although less pronounced, SOX2+OCT4+TERTlow cells also maintained a measurable growth advantage over TERT− and unsorted populations, which consistently exhibited the lowest proliferation rates in the study. As a negative control, there was no significant change in the proliferation of Ara-C-treated cells.
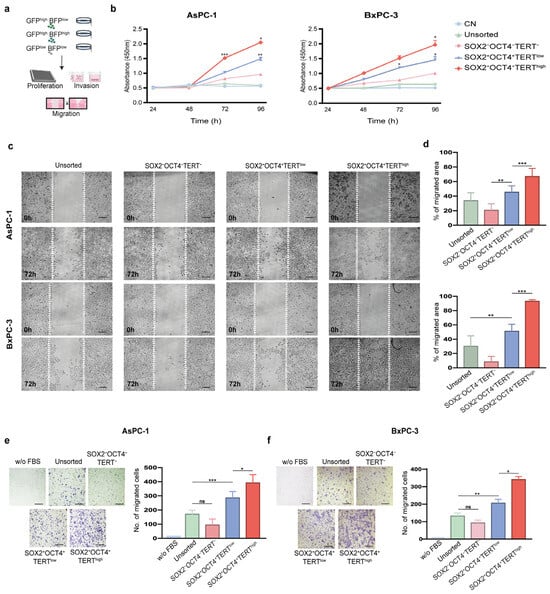
Figure 4.
Functional characterization of SOX2+OCT4+TERThigh subpopulations in pancreatic cancer cell lines. (a) Experimental workflow: FACS isolation of subpopulations from the dual-reporter AsPC-1 and BxPC-3 lines, followed by proliferation, migration, and invasion assays. (b) Cell proliferation assessed by MTS assay in sorted subpopulations (SOX2+OCT4+TERThigh, SOX2+OCT4+TERTlow, SOX2−OCT4−TERT−) and unsorted AsPC-1 and BxPC-3 cells. Ara-C-treated cells were used as negative controls (CN). Wound-healing assay in AsPC-1 and BxPC-3 cells. Representative images at 0 h and 72 h (c) and quantification of wound closure (d) are presented. Invasion assays in AsPC-1 (e) and BxPC-3 (f) subpopulations. Representative images and quantification of the invading cells are shown. Medium without FBS was used as a negative control. (d,e) Data are presented as the mean ± SD; * p< 0.05, ** p < 0.01, *** p < 0.001; one- or two-way ANOVA with Tukey’s post hoc test. Scale bars = 50 μm.
Cell migration allows cells to spread toward distant sites and colonize tissues; therefore, we determined the migration potential of SOX2+OCT4+TERThigh and SOX2+OCT4 TERTlow cells using wound-healing assays. SOX2+OCT4+TERThigh cells exhibited markedly (p < 0.001) accelerated wound closure at 72 h, surpassing SOX2+OCT4+TERTlow cells, which themselves migrated more efficiently than SOX2−OCT4−TERT− and unsorted fractions (Figure 4c,d). Next, we determined the invasive potential of SOX2+OCT4+TERThigh and SOX2+OCT4+TERTlow using Matrigel-coated Boyden chambers. We employed FBS as a chemoattractant and medium without FBS as a negative control. Consistent with the migration assays, a clear hierarchy was observed: SOX2+OCT4+TERThigh cells exhibited significantly (p < 0.001) higher migration abilities than SOX2+OCT4+TERTlow cells, which nevertheless retained higher invasive activity than the negative and unsorted populations (Figure 4e,f).
Collectively, these results establish a functional hierarchy in which SOX2+OCT4+ TERThigh cells represent the most aggressive subpopulation with respect to proliferation, invasion, and migration abilities. SOX2+OCT4+TERTlow cells also retained enhanced functional capacity relative to negative and unsorted cells, underscoring the stepwise contribution of TERT in driving aggressive cancer stem-like cell-associated phenotypes.
3.5. Comparative Transcriptomic Analysis of Pancreatic Cancer Subpopulation SOX2+OCT4+TERThigh
We identified a subpopulation of pancreatic cancer cells characterized by SOX2+OCT4+TERThigh that exhibited increased expression of CSC markers and superior proliferative, invasive, and migratory capacities. To gain molecular insight, we performed bulk RNA-seq on FACS-sorted SOX2+OCT4+TERThigh and SOX2+OCT4+TERTlow subpopulations from the AsPC-1 line (Figure 5a). Principal component analysis (PCA) of transcriptomes enabled the clear classification of these two subpopulations, suggesting different molecular profiles (Figure 5b). Indeed, analysis of differentially expressed genes using DESeq2 revealed that 276 genes were upregulated in SOX2+OCT4+TERhigh cells and 203 genes were downregulated (fold change > 2 or <−2, p-value < 0.05, and FDR < 0.05) (Figure 5c,d). Pathway-level interrogation corroborated a proliferative and transcriptionally active phenotype in TERThigh cells. Gene set enrichment analyses showed significant positive enrichment of KRAS signalling and TNF–NFκB signalling (FDR < 0.001), consistent with oncogenic programmes linked to PDAC aggressiveness (Figure 5e). Concordantly, Gene Ontology enrichment of upregulated genes highlighted categories related to macromolecule and nucleic acid metabolism, RNA biosynthesis/processing, ribosome biogenesis, chromatin organization/remodeling, and gene expression (Figure 5f), collectively indicating an active growth and transcriptional state. Next, we focused on genes enriched in stem cells to understand the transcriptional programs that may functionally maintain the stem cell state. At the module level, curated gene-set heatmaps demonstrated coordinated upregulation of TERThigh telomere-maintenance components, multiple stemness signatures, and signalling axes frequently implicated in cancer stem cell biology—WNT, Hedgehog, and TGF-β—together with a robust EMT program (Figure 5h and Figure A2 Appendix A). Finally, to validate the sequencing data, we employed qPCR to quantify the expression levels of differentially expressed mRNAs (Figure 5g). Our data showed that all transcripts analyzed (CXCL11, LGR5, CCL5, POU5F1, and PDGFB) were successfully validated and exhibited higher expression (p < 0.001) in TERThigh versus TERTlow.
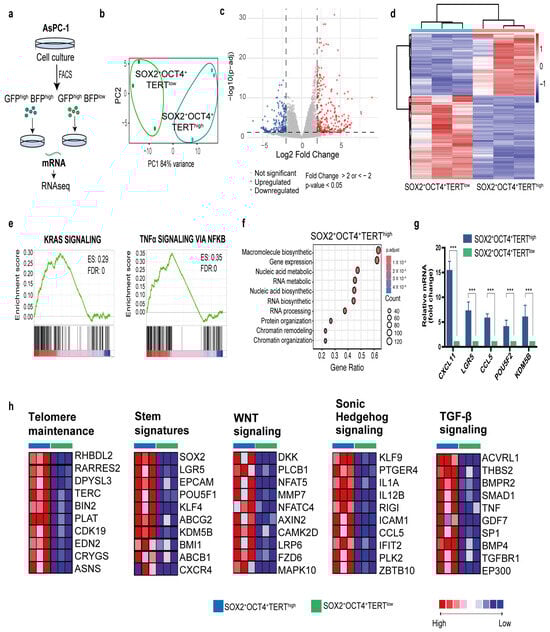
Figure 5.
Transcriptome analysis of reporter-defined subpopulations reveals a stem-like, telomerase-driven program in PDAC. (a) Experimental workflow: FACS isolation of SOX2+OCT4+TERThigh and SOX2+OCT4+TERTlow cells from the dual-reporter AsPC-1 line, followed by bulk RNA-seq. (b) Principal component analysis of gene-expression profiles of SOX2+OCT4+TERThigh and SOX2+OCT4+TERTlow samples (c) The volcano plot showing the differential expression genes (DEGs) between SOX2+OCT4+TERThigh and SOX2+OCT4+TERTlow. Fold change >2 or <−2, p-value < 0.05, and FDR < 0.05. Red and blue dots represent upregulated and downregulated genes, respectively. (d) Heatmap representation of differentially expressed gene grouping samples by SOX2+OCT4+TERThigh and SOX2+OCT4TERTlow. (e) Gene set enrichment analysis (GSEA) comparing SOX2+OCT4+TERThigh and SOX2+OCT4+TERTlow, the enriched gene sets and Enrichment Score (ES) are shown. (f) Gene Ontology analysis revealing biological processes for genes upregulated in TERThigh. (g) Quantification of gene expression by qPCR showing the validation of representative transcripts comparing TERThigh and TERTlow. Gene expression was normalized to PPIA, and the relative level between samples was calculated using the 2−ΔΔCt method. Data are presented as the mean ± SD; *** p < 0.001; one-way ANOVA with Tukey’s post hoc test. (h) GSEA corresponding heatmaps associated with telomere maintenance components, stemness signatures, and pathways linked to CSC biology and invasiveness, WNT, Hedgehog, TGF-β, and EMT. Red, pink, light blue, and dark blue denote high, moderate, low, and lowest expression values, respectively. The complete pathway-focused heatmaps are provided in the Figure A2 Appendix A.
Together, these transcriptomic data mechanistically explain the functional hierarchy established experimentally and support the idea that SOX2+OCT4+TERThigh expression is associated with a stem-like, telomerase-dependent, invasion-competent transcriptional state characterized by the activation of cell cycle/biogenesis programs, KRAS signalling, and EMT.
3.6. Network Analysis and Identification of Potential Therapeutic Compounds Targeting the SOX2+OCT4+TERThigh Subpopulation
IPA software enables the analysis of transcriptomic and other omics data within a biological context. Given that SOX2+OCT4+TERThigh cells exhibit enhanced aggressive properties, their differentially expressed genes were mapped onto a global molecular network curated from the Ingenuity Pathway Knowledge Base. Networks of these genes were algorithmically constructed based on their known and predicted protein-protein interrelationships. This analysis identified subnetworks built around distinct biological pathways, providing a systems-level view of the core programs that may drive pancreatic cancer growth. These programs identified the developmental and EMT pathways. The networks included genes such as TGFB1, FOXA2, PTCH, SHH, NANOG, and FOXP1 (Figure 6a and Figure A3 Appendix A).
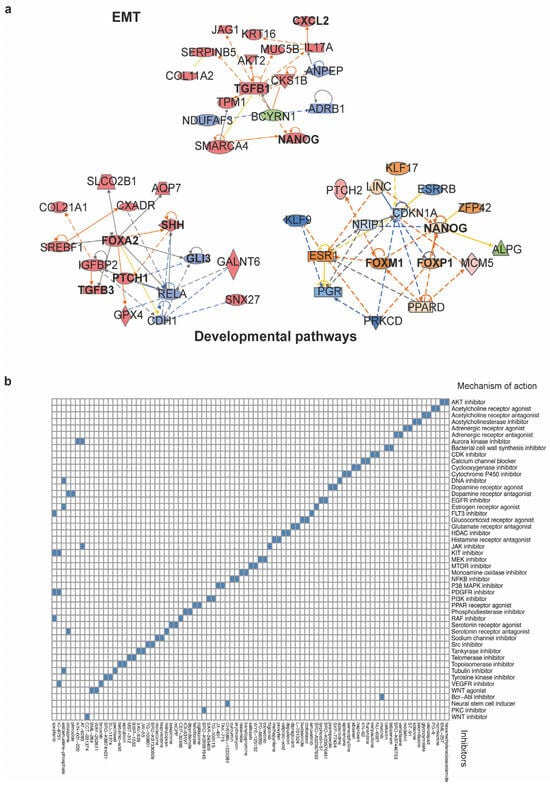
Figure 6.
Network analysis and connectivity mapping nominate therapeutic vulnerabilities of the SOX2+OCT4+TERThigh subpopulation. (a) Top IPA networks generated from differentially expressed genes in the TERThigh subpopulation. The analysis revealed modules linked EMT and developmental pathways, consistent with a stem-like invasive program. Orange and blue edges indicate predicted activation or inhibition, whereas gray edges indicate relationships not predicted. Solid lines denote direct interactions, and dashed lines denote indirect interactions, as curated by IPA. The complete IPA network outputs are provided in Figure A3 Appendix A (b) Heatmap of compounds showing negative connectivity to the TERThigh transcriptional signature. Columns are perturbagens; rows are MoA classes. The full list of compounds and scoring is provided in Table S1.
First, a stemness module grouped pluripotency- and fate–specifying factors (e.g., NANOG, KLF5, and FOXI/FOXI1 family) and Notch ligands/receptors (JAG1). The inferred state of several of these regulators was consistent with activation, supporting the engagement of programs linked to self-renewal and lineage. The EMT network was organized around TGFB1, with connections to EMT-associated effectors and chromatin regulators (e.g., PMEPA1 and SMARCA4). Causal edges predicted an activated TGF-β axis and repression of epithelial features, a configuration concordant with the EMT enrichment observed in TERThigh transcriptomes and their enhanced motile phenotype. The developmental pathway networks highlighted the activation of WNT/β-catenin (CTNNB1), Hedgehog (SHH–PTCH), and additional stemness-linked regulators (FOXA2), indicating the engagement of embryonic programs that support self-renewal and lineage plasticity.
Together, these IPA-inferred causal architectures provide a mechanistic scaffold for the transcriptomic and functional phenotypes: TERThigh cells integrate EMT and developmental circuits, consistent with a telomerase-dependent, cancer stem-like state that underlies the heightened proliferation, migration, and invasion observed experimentally.
Finally, we employed the Connectivity Map (CMap), a data-driven, systematic approach for discovering associations among genes, chemicals, and biological conditions, to further predict potential therapeutic drugs that might target pathways associated with the SOX2+OCT4+TERThigh subpopulation. We found an enrichment of compounds associated with stemness, proliferation, migration, and invasion (Figure 6b). Some of the significantly enriched compounds that inhibit malignancy-related pathways include the AKT inhibitor BML-257, CDK inhibitor kenpaullone, EGFR inhibitor tyrphostin, NFKB inhibitor curcumin, telomerase inhibitor BIBR-1532, tankyrase inhibitor XAV-939, and WNT inhibitor CCT-031374. The CMap mode of action (MoA) analysis of the compounds revealed the top 49 mechanisms of action. Among these, we identified those mentioned above, as well as topoisomerase inhibitors, PI3K inhibitors, mTOR inhibitors, MAPK inhibitors, and tyrosine kinase inhibitors. Together, CMap points to actionable vulnerabilities in SOX2+OCT4+TERThigh cells and prioritizes testable strategies, including single-agent targeting of telomerase or WNT and rational combinations to suppress the stem-like program and its malignant behaviors.
4. Discussion
Our data show that telomerase is correlated with cancer stemness, and SOX2, OCT4, and TERT are expressed in pancreatic cancer, and their expression affects the survival outcomes of patients with pancreatic cancer is consistent with the prior pan-cancer and pluripotency literature [19,22]. We extend prior evidence by identifying and functionally characterizing a SOX2+OCT4+TERThigh subpopulation in PDAC. This coherence between telomerase and stemness signatures is aligned with the positive feedback loop between telomerase and stemness factors (NANOG, OCT4, SOX2, and KLF4), which are essential for pancreatic CSCs [26]. This confirms that telomerase participates in stem-like states beyond its canonical role in telomere maintenance in pancreatic cancer. Clinically, the literature links elements of this axis to adverse biology, suggesting that this transcriptional axis is not only biologically meaningful but also clinically relevant in pancreatic cancer. Telomerase activity and telomere-related gene programs have prognostic relevance in PDAC, and experiments have linked SOX2/OCT4 to therapy resistance and aggressive features [11,27,28]. Notably, our observation that combined high expression of SOX2/OCT4/TERT—rather than any single gene alone—associates with significantly reduced overall survival suggests cooperativity among pluripotency and telomerase programs, which is more prognostically informative than single-gene readouts.
By deploying dual transcriptional reporters for pluripotency (SORE6) and telomerase (TERT promoter), we uncovered a minority of PDAC cells with concurrent SOX2/OCT4/TERT activity in the tumor microenvironment. We observed the subpopulations SOX2+OCT4+TERThigh and SOX2+OCT4TERTlow across pancreatic cancer cell lines, which fits with the long-standing view that CSCs are heterogeneous rather than uniformly distributed. SOX2, OCT4, and TERT are overexpressed in a variety of cancers, including breast [29,30], prostate [31,32], lung [33], colorectal [34,35], and glioblastoma [36] and are associated with CSC subpopulations in these tumors. The SORE6 (SOX2/OCT4) system and TERT-promoter reporter have been tested independently in breast, prostate, and gastric cancers, and cells marked by these reporters have the expected properties of self-renewal, generation of heterogeneous offspring, high tumor- and metastasis-initiating activity, and resistance to chemotherapeutics [20,30,32,37,38]. However, approaches for detecting and targeting cancer stem-like cells expressing TERThigh (SOX2/OCT4/TERT) remain limited. The ability to separate these subpopulations of tumor cells should allow molecular characterization, elucidation of their molecular pathways, and explain several clinical observations in pancreatic cancer patients.
We also found that the SOX2+OCT4+TERThigh and SOX2+OCT4+TERTlow populations partially overlapped with the CSC markers previously reported (e.g., CD44/CD24/EpCAM, CD133) [6,9]. Notably, these discrepancies might be explained by the concept that there is heterogeneity even within stem cell populations, and CSCs are not stable but rather a highly plastic cell population. For example, similar to our results, reporter-positive (SORE6+) breast cancer cells did not express classical surface markers (CD44+CD24−, ALDH). Likewise, the discrepancies observed for CD133 expression may be related to the use of primary cells in other studies versus the cell lines used in our study. Discriminating whether reporter-positive cells represent a distinct CSC hierarchy versus a reversible transcriptional state will require single-cell genomics and imaging technologies to measure SOX2+OCT4+TERThigh cell states across stages.
Unlimited proliferation, together with migration and invasion, is the “hallmark of cancer”, as indicated by Hanahan and Weinberg. These capabilities are crucial for acquiring malignant cell states. Here, we provide evidence that the SOX2+OCT4+TERThigh subpopulation exhibits elevated proliferative, migratory, and invasive capacities, supporting the interpretation that SOX2+OCT4+TERThigh cells exhibit an aggressive phenotype and are not simply a latent ‘reservoir’ of stem-like cells, but instead can drive PDAC progression. Consistent with this view, previous studies have demonstrated that pancreatic CSCs marked by CD133+ CXCR4+, CD24+, CD44+ or OCT4+ NANOG+ have greater metastatic potential [6,11,39]. Telomerase is essential for telomere maintenance and also functions as a transcriptional cofactor that amplifies Wnt/β-catenin signaling and the TGF-β pathway, cooperating with NF-κB to directly regulate genes that converge on networks promoting EMT [14,40,41,42]. This observation suggests that telomerase can support proliferation and invasive competence when TERT and pluripotency circuits coincide.
We develop a comprehensive molecular map of pancreatic cancer stem-like cells by integrating their transcriptomics. Thus, this dataset provides a novel resource for understanding aggressive cell states and discovering new vulnerabilities in pancreatic cancer, leading to more effective therapies. At the gene and module levels, our data reinforce a state that contributes to malignant progression and stemness in SOX2+OCT4+TERThigh cells: enrichment of Kras and TNF-α signalling pathways is consistent with previous reports that inflammation and Kras-mutation define a cell population by chromatin accessibility patterns that drive their progression toward pancreatic neoplastic lesions [43,44]. Additionally, telomere maintenance was enriched, suggesting that telomerase is not only a marker of tumor proliferation but also a marker of pancreatic tumor stemness. In contrast, we identified the upregulation of SOX2, OCT4, NANOG, and other stemness genes, as well as developmental signalling (WNT, Hedgehog, TGF-β), along with a robust EMT signature. These results support previous findings that stemness features are associated with oncogenesis [19,45].
Using our gene expression signatures, we queried the CMap. Despite the dataset being based on a limited number of treated cell lines, the analysis selected drugs that have been shown to affect cancer stem cells with specificity. In particular, BML-257 (Akti-1/2; an AKT inhibitor) suppresses stem-like traits in glioma models, reducing sphere formation and proliferation, consistent with anti-GMT activity [46]. Tyrphostin AG1478 (EGFR inhibitor). Lower sphere formation and self-renewal in prostate and glioma CSC models [47]. BIBR-1532 (telomerase inhibitor) reduces sphere metrics, migration, EMT signatures, and telomerase, thereby supporting stemness across tumors [26]. XAV-939 (tankyrase). Destabilizes β-catenin, limiting stemness, neurospheres, and migration—directly targeting a core EMT/GMT driver [48]. CCT-031374 (β-catenin/TCF antagonist). Downstream Wnt blockade diminishes stem-like fractions, spheres, and clonogenicity [49].
These translational analyses may ultimately pave the way for the implementation of therapies for pancreatic tumors. Our results motivate rational combination therapies. Given the network architecture we observe, a plausible near-term strategy is to test TERT inhibition (pharmacologic or genetic) together with pathway co-blockade aligned with the dominant dependencies of the TERThigh transcriptome, for example, Wnt/β-catenin (porcupine or tankyrase inhibitors) or NF-κB (IKK inhibitors).
From a translational perspective, telomerase represents a potential vulnerability in PDAC because it is reactivated in malignant cells and supports replicative immortality, while also intersecting with stemness programs that our data link to aggressive phenotypes. Preclinical work with the oligonucleotide telomerase inhibitor imetelstat (GRN163L) has shown activity across multiple pancreatic cancer cell lines [50], supporting the feasibility of pharmacologically engaging telomerase in this disease. An additional consideration is that telomerase-directed therapies may not require continuous dosing: in pancreatic cancer models, telomerase inhibition can persist for weeks after drug withdrawal, suggesting that intermittent schedules might preserve on-target activity while mitigating cumulative toxicities [50]. Despite these opportunities, several constraints argue against telomerase inhibition as monotherapy in PDAC and warrant careful consideration. Although anti-telomerase cancer therapies have demonstrated encouraging research prospects, several potential concerns deserve careful consideration. Research findings suggest that the action of telomerase inhibitors on cancer cells may require a certain time frame to effectively shorten telomeres to a critical length, necessitating adequate periods of drug exposure for efficacious treatment, which may be incompatible with the pace of progression in advanced disease [51]. Although telomerase activity is typically low in most somatic tissues, potential on-target effects in telomerase-dependent compartments, including normal stem/progenitor pools, remain a concern, underscoring the importance of therapeutic windows, schedule optimization, and careful toxicity monitoring [52]. Additionally, telomeres serve as protective caps that maintain genomic stability in both normal and neoplastic cells. The suppression of telomerase activity in tumor cells results in telomere erosion, which could precipitate genomic instability within these malignantly transformed cells. This instability may further contribute to their carcinogenic progression.
5. Limitations
Several limitations should be considered when interpreting these findings. First, while the dual-reporter strategy enables prospective identification of a SOX2+OCT4+TERThigh state and links this fraction to aggressive phenotypes, the absence of in vivo validation limits translational inference. Future studies should test tumor-initiating capacity and metastatic competence using xenograft models, including limiting-dilution designs and metastasis assays. Second, although TERThigh status is strongly associated with proliferation, migration, and invasion, we did not directly demonstrate that TERT activity is required for these phenotypes. Establishing causality will require genetic (knockdown/knockout) or pharmacologic perturbation of TERT specifically in sorted SOX2+OCT4+TERThigh cells. Third, our transcriptomic analyses rely on bulk RNA-seq, which cannot fully resolve cellular heterogeneity, state transitions, or the co-occurrence of stemness and EMT-like programs at single-cell resolution; single-cell and/or spatial profiling will be important to dissect plasticity and transcriptional dynamics more rigorously. Fourth, functional assays were performed in two PDAC models (AsPC-1 and BxPC-3), but transcriptomic profiling was conducted only in AsPC-1, anchoring pathway-level inferences to a single model; extending RNA-seq or targeted validation of key signature genes and pathways to BxPC-3 will strengthen generalizability. Fifth, the clinical support for the SOX2/OCT4/TERT co-expression signature is currently derived from publicly available transcriptomic datasets and survival analyses, and we did not validate the signature in an independent cohort or confirm co-expression at the protein level; dedicated PDAC cohorts with clinicopathologic annotation and validation will be necessary to reinforce clinical credibility. Six, the therapeutic candidates nominated by CMap should be interpreted as hypothesis-generating, as we did not perform functional validation. Proof-of-concept testing in TERTlow versus TERThigh fractions will be required to substantiate differential vulnerabilities and therapeutic implications. Finally, we did not stratify PDAC by etiologic background, such as pancreaticobiliary maljunction (PBM). Given the established association of PBM with biliary carcinogenesis and its broader links to pancreaticobiliary pathology [53] future studies leveraging PBM-enriched clinical cohorts could test whether pancreatobiliary reflux contexts preferentially harbor or promote SOX2/OCT4-positive, TERThigh stem-like tumor states.
6. Conclusions
In summary, our study defines a PDAC subpopulation characterized by SOX2/OCT4 activity and high TERT expression as an aggressive state and proposes candidate compounds as potential therapeutic options. This study substantially deepens our understanding of PDAC tumor biology and cancer stem-like cell regulation and could inform improved treatments for patients.
Supplementary Materials
The following supporting information can be downloaded at https://www.mdpi.com/article/10.3390/cells15020129/s1; Table S1. Output from the Connectivity Map, Related to Figure 6b.
Author Contributions
Conceptualization, J.M.-Z., V.M. and E.C.-G.; methodology, E.C.-G., M.R.-D. and D.P.R.-R.; soft-ware, D.P.R.-R. and M.R.-D.; validation, E.C.-G.; formal analysis, E.C.-G.; investigation, E.C.-G. and J.M.-Z.; resources, J.M.-Z. and V.M.; data curation, E.C.-G.; writing—original draft preparation, E.C.-G.; writing—review and editing, M.R.-D., V.M. and J.M.-Z.; visualization, E.C.-G.; supervision, J.M.-Z.; project administration, J.M.-Z. and E.C.-G.; funding acquisition, J.M.-Z. All authors have read and agreed to the published version of the manuscript.
Funding
This research was funded by SECIHTI grant number CBF-2025-1-4446. The APC was funded by the Instituto Nacional de Medicina Genómica. The PhD fellowship of E. C.-G. (CVU.781517) was funded by SECIHTI.
Institutional Review Board Statement
Not applicable.
Informed Consent Statement
Not applicable.
Data Availability Statement
The original contributions presented in this study are included in this article/Supplementary Materials section. Further inquiries should be directed to the corresponding authors.
Acknowledgments
This paper is part of the requirements for obtaining a Doctoral degree at the Posgrado en Ciencias Biológicas, UNAM, for author Erika Curiel-Gomez. We thank the Secretaría de Ciencias, Humanidades, Tecnologías e Innovación (SECIHTI) for supporting this research through a graduate scholarship (CVU No: 781517). We acknowledge the Population Genomics and Bioinformatics Departments of the National Institute of Genomic Medicine for providing workflows that were either partially or completely used as part of the analysis in this study.
Conflicts of Interest
The authors declare no conflicts of interest.
Abbreviations
The following abbreviations are used in this manuscript.
| BFP | Blue Fluorescent Protein |
| CMV | Cytomegalovirus |
| CN | Negative Control |
| CSCs | Cancer Stem Cells |
| EMT | Epithelial-to-Mesenchymal Transition |
| ES | Enrichment Score |
| FACS | Fluorescence-Activated Cell Sorting |
| FBS | Fetal Bovine Serum |
| FDR | False Discovery Rate |
| GFP | Green Fluorescent Protein |
| GSEA | Gene set enrichment analysis |
| HR | Hazard Ratio |
| OCT4 | Octamer-binding transcription factor 4 |
| OS | Overall Survival |
| PBM | Pancreaticobiliary maljunction |
| PCA | Principal Component Analysis |
| PCR | Polymerase Chain Reaction |
| PDAC | Pancreatic Ductal Adenocarcinoma |
| qPCR | quantitative real-time PCR |
| RFS | Relapse-Free Survival |
| SD | Standard Deviation |
| SOX2 | Sex-determining region Y (SRY)-Box2 |
| TCGA | The Cancer Genome Atlas |
| TERT | Telomerase reverse transcriptase |
Appendix A

Figure A1.
Validation of stemness (SORE-GFP) and telomerase (TERT-BFP) reporter activities in cultured cells. The minimal promoter (minCMVp-GFP, minP-BFP; negative control) yielded no detectable fluorescence, whereas the constitutive CMV promoter (CMV-GFP/BFP; positive control) showed robust green or blue expression, respectively (a). SORE-GFP (SOX2/OCT4 response element) labels a CSCs subpopulation, and TERT-BFP (TERT promoter) labels cells with telomerase transcriptional activity. Brightfield images of each condition were used to show the cell morphology and density. Representative live-cell fluorescence micrographs (b). Scale bars = 100 μm.

Figure A2.
Pathway-focused heatmaps of representative gene programs enriched in SOX2+OCT4+TERThigh cells. Heatmaps display scaled expression of selected gene sets related to telomere maintenance, stemness signatures, WNT signaling, Sonic Hedgehog signaling, TGF-β signaling, and epithelial–mesenchymal transition (EMT) in FACS-sorted SOX2+OCT4+TERThigh versus SOX2+OCT4+TERTlow fractions. Red and blue indicate higher and lower relative expression, respectively. Related with Figure 5h.

Figure A3.
Complete IPA networks derived from the SOX2+OCT4+TERThigh differential expression signature. Full Ingenuity Pathway Analysis (IPA) network outputs corresponding to the EMT and developmental-pathway modules shown in Figure 6a, displayed with all nodes and interactions included by IPA.
Appendix B

Table A1.
List of vectors used.
Table A1.
List of vectors used.
| Vector | |||
|---|---|---|---|
| TERT reporter | TERTpromoter-BFP | Reporter vector telomerase | Engineered |
| mP-BFP | Negative BFP vector | Engineered, base Addgene | |
| CMV-BFP | Positive BFP vector | Invitrogen | |
| SOX2/OCT4 reporter | SORE6-GFP | Reporter vector SOX2+/OCT4+ | Gift from Dra. Lalage M. Wakefield, NCI, USA |
| minCMV-GFP | Negative GFP vector | ||
| pLJM1-EGFP | Positive GFP vector | Addgene |
Table A2.
List of primers (forward and reverse) used for qRT-PCR analysis and their melting temperatures (Tm).
Table A2.
List of primers (forward and reverse) used for qRT-PCR analysis and their melting temperatures (Tm).
| Gene | Forward (5′-3′) | Reverse (5′-3′) | Tm (°C) |
|---|---|---|---|
| SOX2 | CCACAGTTACGCGCACATGA | AGCCGTTCATGTAGGTCTGC | 60 |
| OCT4 | CTCCTGGAGGGCCAGGAATC | CCACATCGGCCTGTGTATAT | 60 |
| TERT | CCGATTGTGAACATGGACTACG | CACGCTGAACAGTGCCTTC | 60 |
| NANOG | AGGCAAACAACCCACTTCTG | TCTGCTGGAGGCTGAGGTAT | 60 |
| ALDH1A3 | TGTTAGCTGATGCCGACTTG | TTCTTAGCCCGCTCAACACT | 60 |
| PPIA | ATGCTGGACCCAACACAAAT | TCTTTCACTTTGCCAAACACC | 60 |
| CXCL11 | CAGTTGTTCAAGGCTTCCCC | ACTTGGGTACATTATGGAGGCTT | 60 |
| LGR5 | CTGCCCCACACACTGTCA | ATGTTGTTCATACTGAGGTCTAGGT | 60 |
| CCL5 | CTGCCTCCCCATATTCCTCG | TCGGGTGACAAAGACGACTG | 60 |
| POU5F2 | AGACAGCCCTTCTGGAAAGC | GCTGAGGTCAGTGCCTCTTT | 60 |
| KDM5B | CGGATTGGCAGCCACCAT | TCCCAGTACTTTGCAATCTGGT | 60 |
References
- Siegel, R.L.; Miller, K.D.; Wagle, N.S.; Jemal, A. Cancer statistics, 2023. CA Cancer J. Clin. 2023, 73, 17–48. [Google Scholar]
- Rahib, L.; Wehner, M.R.; Matrisian, L.M.; Nead, K.T. Estimated Projection of US Cancer Incidence and Death to 2040. JAMA Netw. Open 2021, 4, e214708. [Google Scholar] [CrossRef]
- Halbrook, C.J.; Lyssiotis, C.A.; Pasca di Magliano, M.; Maitra, A. Pancreatic Cancer: Advances and Challenges. Cell 2023, 186, 1729–1754. [Google Scholar] [CrossRef]
- Conroy, T.; Desseigne, F.; Ychou, M.; Bouché, O.; Guimbaud, R.; Bécouarn, Y.; Adenis, A.; Raoul, J.-L.; Gourgou-Bourgade, S.; de la Fouchardière, C.; et al. FOLFIRINOX versus Gemcitabine for Metastatic Pancreatic Cancer. N. Engl. J. Med. 2011, 364, 1817–1825. [Google Scholar] [CrossRef] [PubMed]
- Hoff, D.D.V.; Ervin, T.; Arena, F.P.; Chiorean, E.G.; Infante, J.; Moore, M.; Seay, T.; Tjulandin, S.A.; Ma, W.W.; Saleh, M.N.; et al. Increased Survival in Pancreatic Cancer with nab-Paclitaxel plus Gemcitabine. N. Engl. J. Med. 2015, 369, 1691–1703. [Google Scholar] [CrossRef] [PubMed]
- Hermann, P.C.; Huber, S.L.; Herrler, T.; Aicher, A.; Ellwart, J.W.; Guba, M.; Bruns, C.J.; Heeschen, C. Distinct Populations of Cancer Stem Cells Determine Tumor Growth and Metastatic Activity in Human Pancreatic Cancer. Cell Stem Cell 2007, 1, 313–323. [Google Scholar] [CrossRef]
- Cui Zhou, D.; Jayasinghe, R.G.; Chen, S.; Herndon, J.M.; Iglesia, M.D.; Navale, P.; Wendl, M.C.; Caravan, W.; Sato, K.; Storrs, E.; et al. Spatially Restricted Drivers and Transitional Cell Populations Cooperate with the Microenvironment in Untreated and Chemo-Resistant Pancreatic Cancer. Nat. Genet. 2022, 54, 1390–1405. [Google Scholar] [CrossRef]
- Schwitalla, S.; Fingerle, A.A.; Cammareri, P.; Nebelsiek, T.; Göktuna, S.I.; Ziegler, P.K.; Canli, O.; Heijmans, J.; Huels, D.J.; Moreaux, G.; et al. Intestinal Tumorigenesis Initiated by Dedifferentiation and Acquisition of Stem-Cell-like Properties. Cell 2013, 152, 25–38. [Google Scholar] [CrossRef]
- Li, C.; Heidt, D.G.; Dalerba, P.; Burant, C.F.; Zhang, L.; Adsay, V.; Wicha, M.; Clarke, M.F.; Simeone, D.M. Identification of Pancreatic Cancer Stem Cells. Cancer Res. 2007, 67, 1030–1037. [Google Scholar] [CrossRef] [PubMed]
- Herreros-Villanueva, M.; Zhang, J.S.; Koenig, A.; Abel, E.V.; Smyrk, T.C.; Bamlet, W.R.; De Narvajas, A.A.M.; Gomez, T.S.; Simeone, D.M.; Bujanda, L.; et al. SOX2 Promotes Dedifferentiation and Imparts Stem Cell-like Features to Pancreatic Cancer Cells. Oncogenesis 2013, 2, e61. [Google Scholar] [CrossRef]
- Lu, Y.; Zhu, H.; Shan, H.; Lu, J.J.; Chang, X.; Li, X.; Lu, J.J.; Fan, X.; Zhu, S.; Wang, Y.; et al. Knockdown of Oct4 and Nanog Expression Inhibits the Stemness of Pancreatic Cancer Cells. Cancer Lett. 2013, 340, 113–123. [Google Scholar] [CrossRef]
- Collins, K. The Biogenesis and Regulation of Telomerase Holoenzymes. Nat. Rev. Mol. Cell Biol. 2006, 7, 484–494. [Google Scholar] [CrossRef] [PubMed]
- Low, K.C.; Tergaonkar, V. Telomerase: Central Regulator of All of the Hallmarks of Cancer. Trends Biochem. Sci. 2013, 38, 426–434. [Google Scholar] [CrossRef]
- Park, J.I.; Venteicher, A.S.; Hong, J.Y.; Choi, J.; Jun, S.; Shkreli, M.; Chang, W.; Meng, Z.; Cheung, P.; Ji, H.; et al. Telomerase Modulates Wnt Signalling by Association with Target Gene Chromatin. Nature 2009, 460, 66–72. [Google Scholar] [CrossRef] [PubMed]
- Ghosh, A.; Saginc, G.; Leow, S.C.; Khattar, E.; Shin, E.M.; Yan, T.D.; Wong, M.; Zhang, Z.; Li, G.; Sung, W.K.; et al. Telomerase Directly Regulates NF-B-Dependent Transcription. Nat. Cell Biol. 2012, 14, 1270–1281. [Google Scholar] [CrossRef] [PubMed]
- Campbell, P.J.; Getz, G.; Korbel, J.O.; Stuart, J.M.; Jennings, J.L.; Stein, L.D.; Perry, M.D.; Nahal-Bose, H.K.; Ouellette, B.F.F.; Li, C.H.; et al. Pan-Cancer Analysis of Whole Genomes. Nature 2020, 578, 82–93. [Google Scholar] [CrossRef]
- Petersen, G.M.; Amundadottir, L.; Fuchs, C.S.; Kraft, P.; Stolzenberg-Solomon, R.Z.; Jacobs, K.B.; Arslan, A.A.; Bueno-De-Mesquita, H.B.; Gallinger, S.; Gross, M.; et al. A Genome-Wide Association Study Identifies Pancreatic Cancer Susceptibility Loci on Chromosomes 13q22.1, 1q32.1 and 5p15.33. Nat. Genet. 2010, 42, 224–228. [Google Scholar] [CrossRef]
- Neuhöfer, P.; Roake, C.M.; Kim, S.J.; Lu, R.J.; West, R.B.; Charville, G.W.; Artandi, S.E. Acinar Cell Clonal Expansion in Pancreas Homeostasis and Carcinogenesis. Nature 2021, 597, 715–719. [Google Scholar] [CrossRef]
- Malta, T.M.; Sokolov, A.; Gentles, A.J.; Burzykowski, T.; Poisson, L.; Weinstein, J.N.; Kamińska, B.; Huelsken, J.; Omberg, L.; Gevaert, O.; et al. Machine Learning Identifies Stemness Features Associated with Oncogenic Dedifferentiation. Cell 2018, 173, 338–354.e15. [Google Scholar] [CrossRef]
- Tang, B.; Raviv, A.; Esposito, D.; Flanders, K.C.; Daniel, C.; Nghiem, B.T.; Garfield, S.; Lim, L.; Mannan, P.; Robles, A.I.; et al. A Flexible Reporter System for Direct Observation and Isolation of Cancer Stem Cells. Stem Cell Rep. 2015, 4, 155–169. [Google Scholar] [CrossRef]
- Livak, K.J.; Schmittgen, T.D. Analysis of Relative Gene Expression Data Using Real-Time Quantitative PCR and the 2-ΔΔCT Method. Methods 2001, 25, 402–408. [Google Scholar] [CrossRef] [PubMed]
- Noureen, N.; Wu, S.; Lv, Y.; Yang, J.; Alfred Yung, W.K.; Gelfond, J.; Wang, X.; Koul, D.; Ludlow, A.; Zheng, S. Integrated Analysis of Telomerase Enzymatic Activity Unravels an Association with Cancer Stemness and Proliferation. Nat. Commun. 2021, 12, 139. [Google Scholar] [CrossRef]
- Tang, R.; Liu, X.; Wang, W.; Hua, J.; Xu, J.; Liang, C.; Meng, Q.; Liu, J.; Zhang, B.; Yu, X.; et al. Identification of the Roles of a Stemness Index Based on MRNA Expression in the Prognosis and Metabolic Reprograming of Pancreatic Ductal Adenocarcinoma. Front. Oncol. 2021, 11, 643465. [Google Scholar] [CrossRef]
- Matsuda, Y.; Yamashita, T.; Ye, J.; Yasukawa, M.; Yamakawa, K.; Mukai, Y.; Machitani, M.; Daigo, Y.; Miyagi, Y.; Yokose, T.; et al. Phosphorylation of HTERT at Threonine 249 Is a Novel Tumor Biomarker of Aggressive Cancer with Poor Prognosis in Multiple Organs. J. Pathol. 2022, 257, 172–185. [Google Scholar] [CrossRef]
- Damm, K.; Hemmann, U.; Garin-Chesa, P.; Hauel, N.; Kauffmann, I.; Priepke, H.; Niestroj, C.; Daiber, C.; Enenkel, B.; Guilliard, B.; et al. A Highly Selective Telomerase Inhibitor Limiting Human Cancer Cell Proliferation. EMBO J. 2001, 20, 6958–6968. [Google Scholar] [CrossRef] [PubMed]
- Walter, K.; Rodriguez-Aznar, E.; Ventura Ferreira, M.S.; Frappart, P.O.; Dittrich, T.; Tiwary, K.; Meessen, S.; Lerma, L.; Daiss, N.; Schulte, L.A.; et al. Telomerase and Pluripotency Factors Jointly Regulate Stemness in Pancreatic Cancer Stem Cells. Cancers 2021, 13, 3145. [Google Scholar] [CrossRef] [PubMed]
- Jia, Y.; Gu, D.; Wan, J.; Yu, B.; Zhang, X.; Chiorean, E.G.; Wang, Y.; Xie, J. The Role of GLI-SOX2 Signaling Axis for Gemcitabine Resistance in Pancreatic Cancer. Oncogene 2019, 38, 1764–1777. [Google Scholar] [CrossRef]
- Chen, S.; Hu, S.; Zhou, B.; Cheng, B.; Tong, H.; Su, D.; Li, X.; Chen, Y.; Zhang, G. Telomere-Related Prognostic Biomarkers for Survival Assessments in Pancreatic Cancer. Sci. Rep. 2023, 13, 10586. [Google Scholar] [CrossRef]
- Gwak, J.M.; Kim, M.; Kim, H.J.; Jang, M.H.; Park, S.Y.; Moon Gwak, J.; Kim, M.; Jeong Kim, H.; Hye Jang, M.; Yeon Park, S. Expression of Embryonal Stem Cell Transcription Factors in Breast Cancer: Oct4 as an Indicator for Poor Clinical Outcome and Tamoxifen Resistance. Oncotarget 2017, 8, 36305–36318. [Google Scholar] [CrossRef]
- El-Badawy, A.; Ghoneim, N.I.; Nasr, M.A.; Elkhenany, H.; Ahmed, T.A.; Ahmed, S.M.; El-Badri, N. Telomerase Reverse Transcriptase Coordinates with the Epithelial-to-Mesenchymal Transition through a Feedback Loop to Define Properties of Breast Cancer Stem Cells. Biol. Open 2018, 7, bio034181. [Google Scholar] [CrossRef]
- Rybak, A.P.; Tang, D. SOX2 Plays a Critical Role in EGFR-Mediated Self-Renewal of Human Prostate Cancer Stem-like Cells. Cell Signal 2013, 25, 2734–2742. [Google Scholar] [CrossRef]
- Zhang, K.; Guo, Y.; Wang, X.; Zhao, H.; Ji, Z.; Cheng, C.; Li, L.; Fang, Y.; Xu, D.; Zhu, H.H.; et al. WNT/β-Catenin Directs Self-Renewal Symmetric Cell Division of HTERThigh Prostate Cancer Stem Cells. Cancer Res. 2017, 77, 2534–2547. [Google Scholar] [CrossRef]
- Xiang, R.; Liao, D.; Cheng, T.; Zhou, H.; Shi, Q.; Chuang, T.S.; Markowitz, D.; Reisfeld, R.A.; Luo, Y. Downregulation of Transcription Factor SOX2 in Cancer Stem Cells Suppresses Growth and Metastasis of Lung Cancer. Br. J. Cancer 2011, 104, 1410–1417. [Google Scholar] [CrossRef]
- Munro, M.J.; Wickremesekera, S.K.; Peng, L.; Tan, S.T.; Itinteang, T. Cancer Stem Cells in Colorectal Cancer: A Review. J. Clin. Pathol. 2018, 71, 110–116. [Google Scholar] [CrossRef]
- Wang, H.; Gong, P.; Chen, T.; Gao, S.; Wu, Z.; Wang, X.; Li, J.; Marjani, S.L.; Costa, J.; Weissman, S.M.; et al. Colorectal Cancer Stem Cell States Uncovered by Simultaneous Single-Cell Analysis of Transcriptome and Telomeres. Adv. Sci. 2021, 8, 2004320. [Google Scholar] [CrossRef]
- Bradshaw, A.; Wickremsekera, A.; Tan, S.T.; Peng, L.; Davis, P.F.; Itinteang, T. Cancer Stem Cell Hierarchy in Glioblastoma Multiforme. Front. Surg. 2016, 3, 191206. [Google Scholar] [CrossRef]
- Pádua, D.; Barros, R.; Amaral, A.L.; Mesquita, P.; Freire, A.F.; Sousa, M.; Maia, A.F.; Caiado, I.; Fernandes, H.; Pombinho, A.; et al. A SOX2 Reporter System Identifies Gastric Cancer Stem-like Cells Sensitive to Monensin. Cancers 2020, 12, 495. [Google Scholar] [CrossRef] [PubMed]
- Vaddi, P.; Stamnes, M.; Cao, H.; Chen, S. Elimination of SOX2/OCT4-Associated Prostate Cancer Stem Cells Blocks Tumor Development and Enhances Therapeutic Response. Cancers 2019, 11, 1331. [Google Scholar] [CrossRef] [PubMed]
- Rhim, A.D.; Mirek, E.T.; Aiello, N.M.; Maitra, A.; Bailey, J.M.; McAllister, F.; Reichert, M.; Beatty, G.L.; Rustgi, A.K.; Vonderheide, R.H.; et al. EMT and Dissemination Precede Pancreatic Tumor Formation. Cell 2012, 148, 349–361. [Google Scholar] [CrossRef] [PubMed]
- Prasad, R.R.; Mishra, D.K.; Kumar, M.; Yadava, P.K. Human Telomerase Reverse Transcriptase Promotes the Epithelial to Mesenchymal Transition in Lung Cancer Cells by Enhancing C-MET Upregulation. Heliyon 2022, 8, e08673. [Google Scholar] [CrossRef]
- Ding, Z.; Wu, C.J.; Jaskelioff, M.; Ivanova, E.; Kost-Alimova, M.; Protopopov, A.; Chu, G.C.; Wang, G.; Lu, X.; Labrot, E.S.; et al. Telomerase Reactivation Following Telomere Dysfunction Yields Murine Prostate Tumors with Bone Metastases. Cell 2012, 148, 896–907. [Google Scholar] [CrossRef]
- Liu, H.; Liu, Q.; Ge, Y.; Zhao, Q.; Zheng, X.; Zhao, Y. HTERT Promotes Cell Adhesion and Migration Independent of Telomerase Activity. Sci. Rep. 2016, 6, 22886. [Google Scholar] [CrossRef]
- Alonso-Curbelo, D.; Ho, Y.J.; Burdziak, C.; Maag, J.L.V.; Morris, J.P.; Chandwani, R.; Chen, H.A.; Tsanov, K.M.; Barriga, F.M.; Luan, W.; et al. A Gene–Environment-Induced Epigenetic Program Initiates Tumorigenesis. Nature 2021, 590, 642–648. [Google Scholar] [CrossRef] [PubMed]
- Burdziak, C.; Alonso-Curbelo, D.; Walle, T.; Reyes, J.; Barriga, F.M.; Haviv, D.; Xie, Y.; Zhao, Z.; Zhao, C.J.; Chen, H.-A.; et al. Epigenetic Plasticity Cooperates with Cell-Cell Interactions to Direct Pancreatic Tumorigenesis. Science 2023, 380, eadd5327. [Google Scholar] [CrossRef] [PubMed]
- Lytle, N.K.; Ferguson, L.P.; Rajbhandari, N.; Gilroy, K.; Fox, R.G.; Deshpande, A.J.A.; Schürch, C.M.; Hamilton, M.; Robertson, N.; Lin, W.; et al. A Multiscale Map of the Stem Cell State in Pancreatic Adenocarcinoma. Cell 2019, 177, 572–586.e22. [Google Scholar] [CrossRef]
- Zhao, Q.W.; Zhou, Y.W.; Li, W.X.; Kang, B.; Zhang, X.Q.; Yang, Y.; Cheng, J.; Yin, S.Y.; Tong, Y.; He, J.Q.; et al. Akt-Mediated Phosphorylation of Oct4 Is Associated with the Proliferation of Stem-like Cancer Cells. Oncol. Rep. 2015, 33, 1621–1629. [Google Scholar] [CrossRef]
- Rybak, A.P.; Ingram, A.J.; Tang, D. Propagation of Human Prostate Cancer Stem-Like Cells Occurs through EGFR-Mediated ERK Activation. PLoS ONE 2013, 8, e61716. [Google Scholar] [CrossRef] [PubMed]
- Liu, T.; Xu, H.; Huang, M.; Ma, W.; Saxena, D.; Lustig, A.; Alonso-basanta, M.; Zhang, Z.; Rourke, D.M.O.; Zhang, L.; et al. Circulating glioma cells exhibit stem cell-like properties Tianrun. Cancer Res. 2019, 78, 6632–6642. [Google Scholar] [CrossRef]
- Park, J.W.; Park, J.M.; Park, D.M.; Kim, D.Y.; Kim, H.K. Stem Cells Antigen-1 Enriches for a Cancer Stem Cell-Like Subpopulation in Mouse Gastric Cancer. Stem Cells 2016, 34, 1177–1187. [Google Scholar] [CrossRef]
- Burchett, K.M.; Yan, Y.; Ouellette, M.M. Telomerase Inhibitor Imetelstat (GRN163L) Limits the Lifespan of Human Pancreatic Cancer Cells. PLoS ONE 2014, 9, e85155. [Google Scholar] [CrossRef]
- Seimiya, H.; Oh-hara, T.; Suzuki, T.; Naasani, I.; Shimazaki, T.; Tsuchiya, K.; Tsuruo, T. Telomere Shortening and Growth Inhibition of Human Cancer Cells by Novel Synthetic Telomerase Inhibitors MST-312, MST-295, and MST-1991. Mol. Cancer Ther. 2002, 1, 657–665. [Google Scholar] [PubMed]
- Shay, J.W.; Wright, W.E. Telomeres and Telomerase in Normal and Cancer Stem Cells. FEBS Lett. 2010, 584, 3819–3825. [Google Scholar] [CrossRef] [PubMed]
- Rivero-Moreno, Y.; Goyal, A.; Bolívar, V.; Osagwu, N.; Echevarria, S.; Gasca-Insuasti, J.; Pereira-Graterol, F.; von Ahrens, D.; Gaytán Fuentes, O.F.; Suárez-Carreón, L.O.; et al. Pancreaticobiliary Maljunction and Its Relationship with Biliary Cancer: An Updated and Comprehensive Systematic Review and Meta-Analysis on Behalf of TROGSS—The Robotic Global Surgical Society. Cancers 2025, 17, 122. [Google Scholar] [CrossRef] [PubMed]
Disclaimer/Publisher’s Note: The statements, opinions and data contained in all publications are solely those of the individual author(s) and contributor(s) and not of MDPI and/or the editor(s). MDPI and/or the editor(s) disclaim responsibility for any injury to people or property resulting from any ideas, methods, instructions or products referred to in the content. |
© 2026 by the authors. Licensee MDPI, Basel, Switzerland. This article is an open access article distributed under the terms and conditions of the Creative Commons Attribution (CC BY) license.