In the original publication [1], due to figure overlap the Figures 2, 3 and 5 were revised.
Error in Figure 2
There was a mistake in Figure 2C in the white light image.
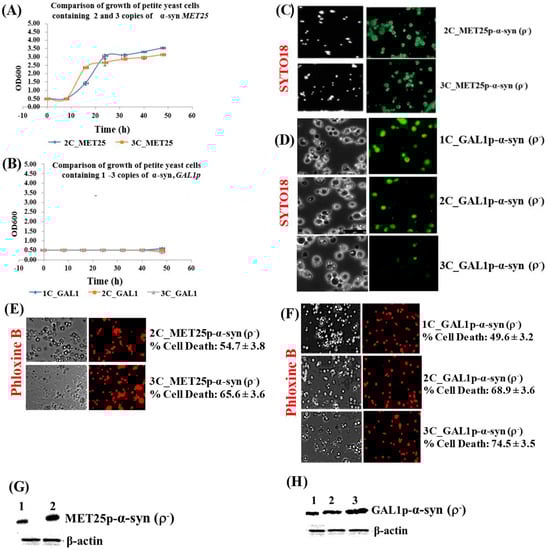
Figure 2.
(A,B) Comparison of the growth curves of ρ− cells expressing 2–3 copies of α-syn from MET25p (A) and 1–3 copies of α-syn from GAL1p (B); cells were grown in YPD (A) and YP-galactose (B). Bonferroni post hoc test after a significant two-way ANOVA indicates no significant difference in growth between yeast petites that contain different copies of the α-syn gene. (C,D) Microscopic images (×400) of petite cells, where expression of 2–3 copies (MET25p) or 1–3 copies (GAL1p) of α-syn gene was induced, stained with the dye SYTO18. (E,F) Microscopic images (×400) of petite cells expressing 2–3 copies of α-syn from the MET25p (E) and 1–3 copies of α-syn from the GAL1p, staining with Phloxine B. (G,H) Western blot analyses of cells expressing 1 to 3-copies of α-syn protein after full induction of the MET25p (G) or GAL1p (H). On lanes, 1, 2 (G) and 1, 2 and 3 (H) were loaded 7.5 µg of total protein obtained after lysis of cells that express 2-copies or 1-copy (lanes 1; G,H), 3-copies or 2-copies (lanes 2; G,H) and 3-copies (lane 3; H) of α-syn, after the growth of cells under conditions that fully induce the MET25 or GAL1 promoter. The upper panel was probed with an antibody that recognizes human α-syn (Proteintech, #10842-1-AP) and the lower panel with a β-actin antibody (Proteintech, 60008-1-Ig); Densitometric quantification of the α-syn bands in (G,H) is shown in Supplementary Materials, Parts 3 and 4. Post Hoc Newman-Keuls test, after a significant one-way ANOVA test, indicated a significant difference in cell death, p < 0.01, between petites expressing α-syn with different copy numbers.
Error in Figure 3
In Figure 3A (3C_Met25p), there is a mistake in the white light image. In Figure 3E, there are mistakes in the white and fluorescent light images. In Figure 3F (1C_GAL1p), there is a mistake in the white light image.
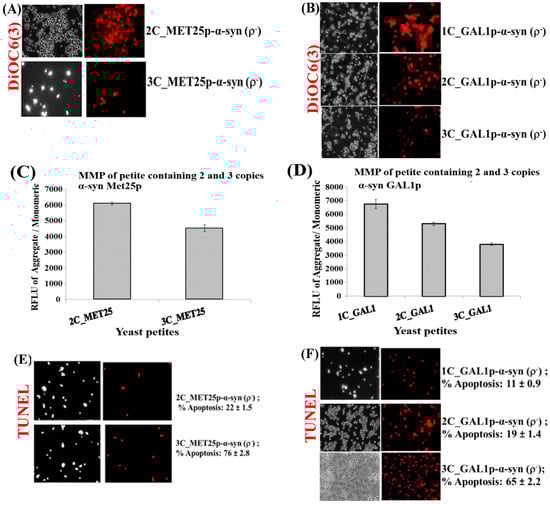
Figure 3.
(A,B) Microscopic images (×400) of staining of 3 copies of α-syn petite transformants with DiOC6(3) dye that detects MMP in live cells. The images are representative images (×400) of cells. (C,D) Quantification of relative MMP of yeast cells expressing 2 and 3-copies of α-syn from MET25p and 1–3-copies of α-syn from GAL1p, using the JC-10 dye (p < 0.1). (E) Microscopic images (×400) of nuclear DNA fragmentation as observed using the TUNEL assay in yeast cells expressing 2 and 3 copies of α-syn from MET25p. (F) Microscopic images (×400) of nuclear DNA fragmentation as observed using the TUNEL assay in yeast cells expressing 1 copy of α-syn from GAL1p. The images are representative images of cells. The data in figures (C,D) represent mean ± S.D. of three independent experiments (p < 0.1; two-tailed t-test). The left-hand side pictures in (A,B,E,F) show phase-contrast microscopy pictures (×400) of yeast cells. Post Hoc Newman-Keuls test, after a significant one-way ANOVA test, indicated a significant difference p < 0.001 between strains expressing 2 and 3-copies of α-syn from MET25p, and between 1 and 2-copies and 3-copies of α-syn from GAL1p.
Error in Figure 5
In Figure 5A (1C_Met25), there is a mistake in the YPD plate image.
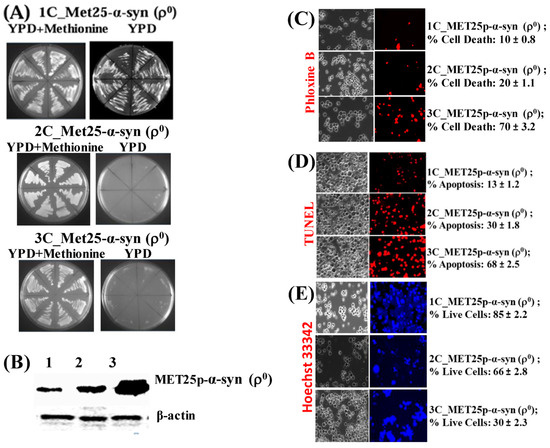
Figure 5.
(A) Image of growth of Ῥ0 yeast cells harboring 1 copy (1C) of the α-syn gene under MET25p control on complete YPD medium agar plates in the presence (YPD + Methionine) or absence of methionine. (B) Western blot analyses of ρ0 cells expressing 1-copy (lane 1), 2-copies (lane 2), and 3-copies (lane 3) of α-syn protein. On lanes 1, 2, and 3 were loaded 7.5 µg of total protein obtained after lysis of cells. The upper panel was probed with an antibody that recognizes the HA epitope (Proteintech, 51064-2-AP) and the lower panel with a β-actin antibody (Proteintech, 60008-1-Ig); levels of β-actin were used as loading controls, β-actin being a housekeeping gene. (C) Microscopic images (×400) of ρ0 cells, stained with Phloxine B, after the expression of 1–3 copies of α-syn from the MET25p. (D) Microscopic images (×400) of nuclear DNA fragmentation, as observed using the TUNEL assay, in ρ0 yeast cells expressing 1–3-copies of α-syn from MET25p. (E) ρ0 cells, bearing 1–3 copies of MET25p-driven α-syn expression cassettes, were stained with Hoechst 33,342 (a blue dye that labels DNA of live cells). Post Hoc Newman-Keuls test after a significant one-way ANOVA test, indicated a significant difference between petites expressing 1–3 copies of α-syn.
The authors state that the scientific conclusions are unaffected. This correction was approved by the Academic Editor. The original publication has also been updated.
Reference
- Akintade, D.D.; Chaudhuri, B. Apoptosis, Induced by Human α-Synuclein in Yeast, Can Occur Independent of Functional Mitochondria. Cells 2020, 9, 2203. [Google Scholar] [CrossRef] [PubMed]
Disclaimer/Publisher’s Note: The statements, opinions and data contained in all publications are solely those of the individual author(s) and contributor(s) and not of MDPI and/or the editor(s). MDPI and/or the editor(s) disclaim responsibility for any injury to people or property resulting from any ideas, methods, instructions or products referred to in the content. |
© 2025 by the authors. Licensee MDPI, Basel, Switzerland. This article is an open access article distributed under the terms and conditions of the Creative Commons Attribution (CC BY) license (https://creativecommons.org/licenses/by/4.0/).