
Quantification of Polystyrene Uptake by Different Cell Lines Using Fluorescence Microscopy and Label-Free Visualization of Intracellular Polystyrene Particles by Raman Microspectroscopic Imaging
 ,
,  , , , , ,
Abstract
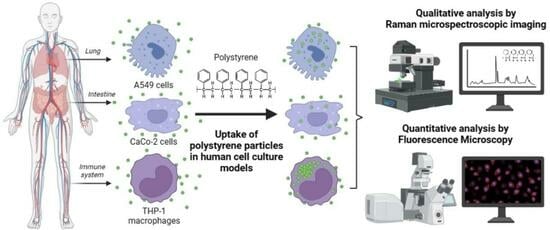
1. Introduction
2. Materials and Methods
2.1. Nanoparticles, Cell Culture, and Incubation
2.2. Fluorescence Labeling
2.3. Fluorescence Measurements
2.4. Analysis of Fluorescence Data
2.5. Raman Measurements
2.6. Analysis of Raman Data
3. Results
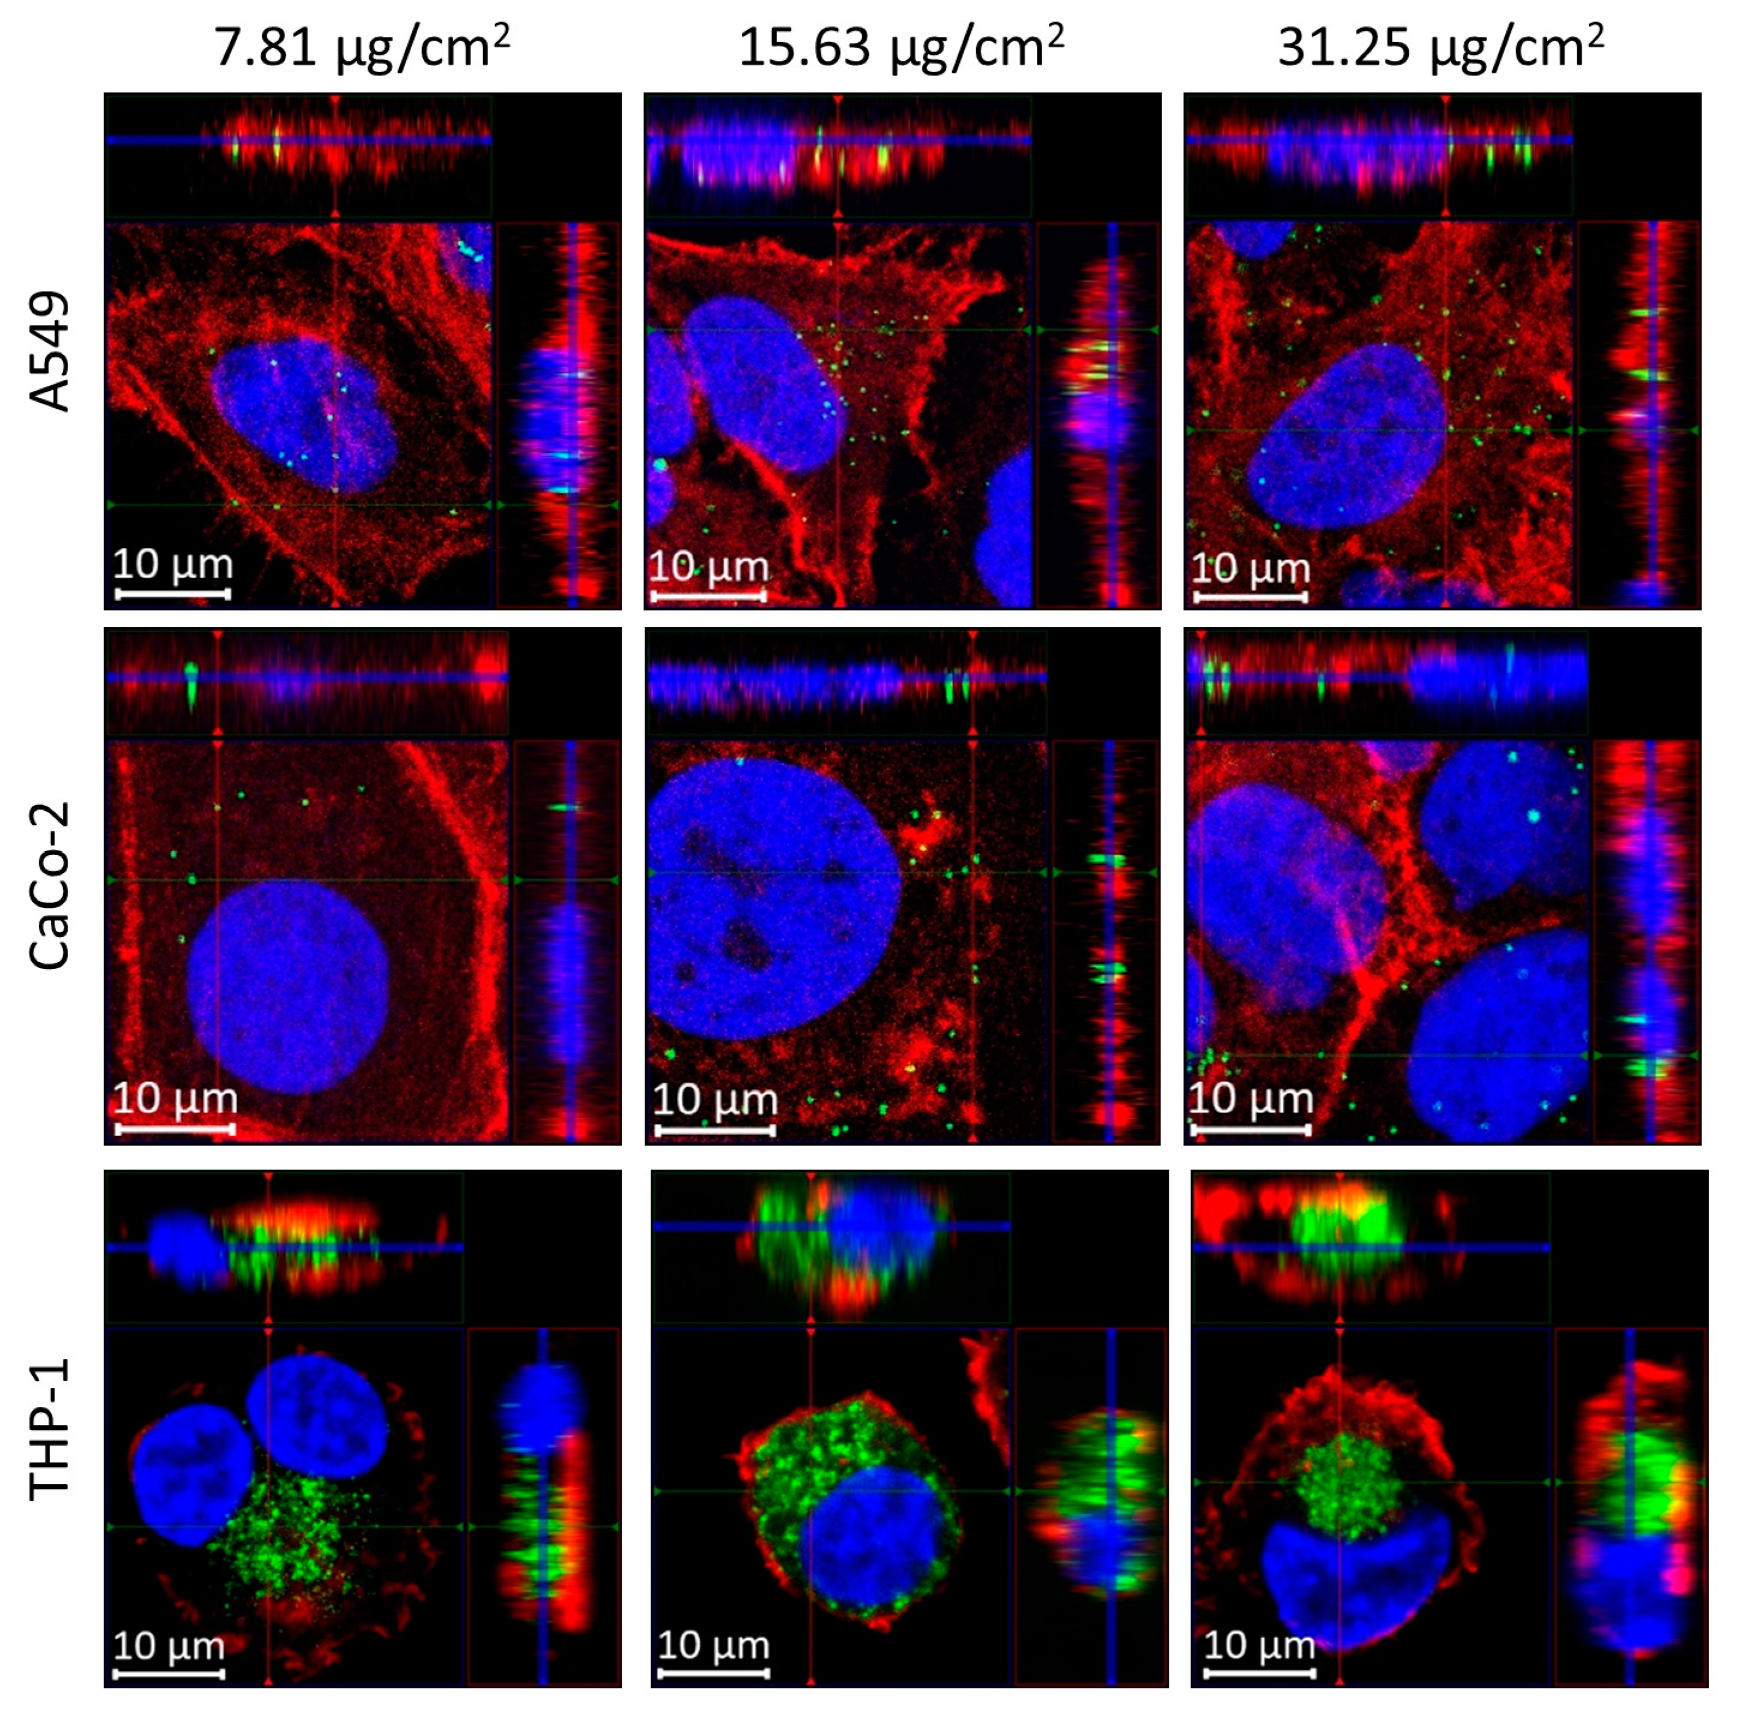
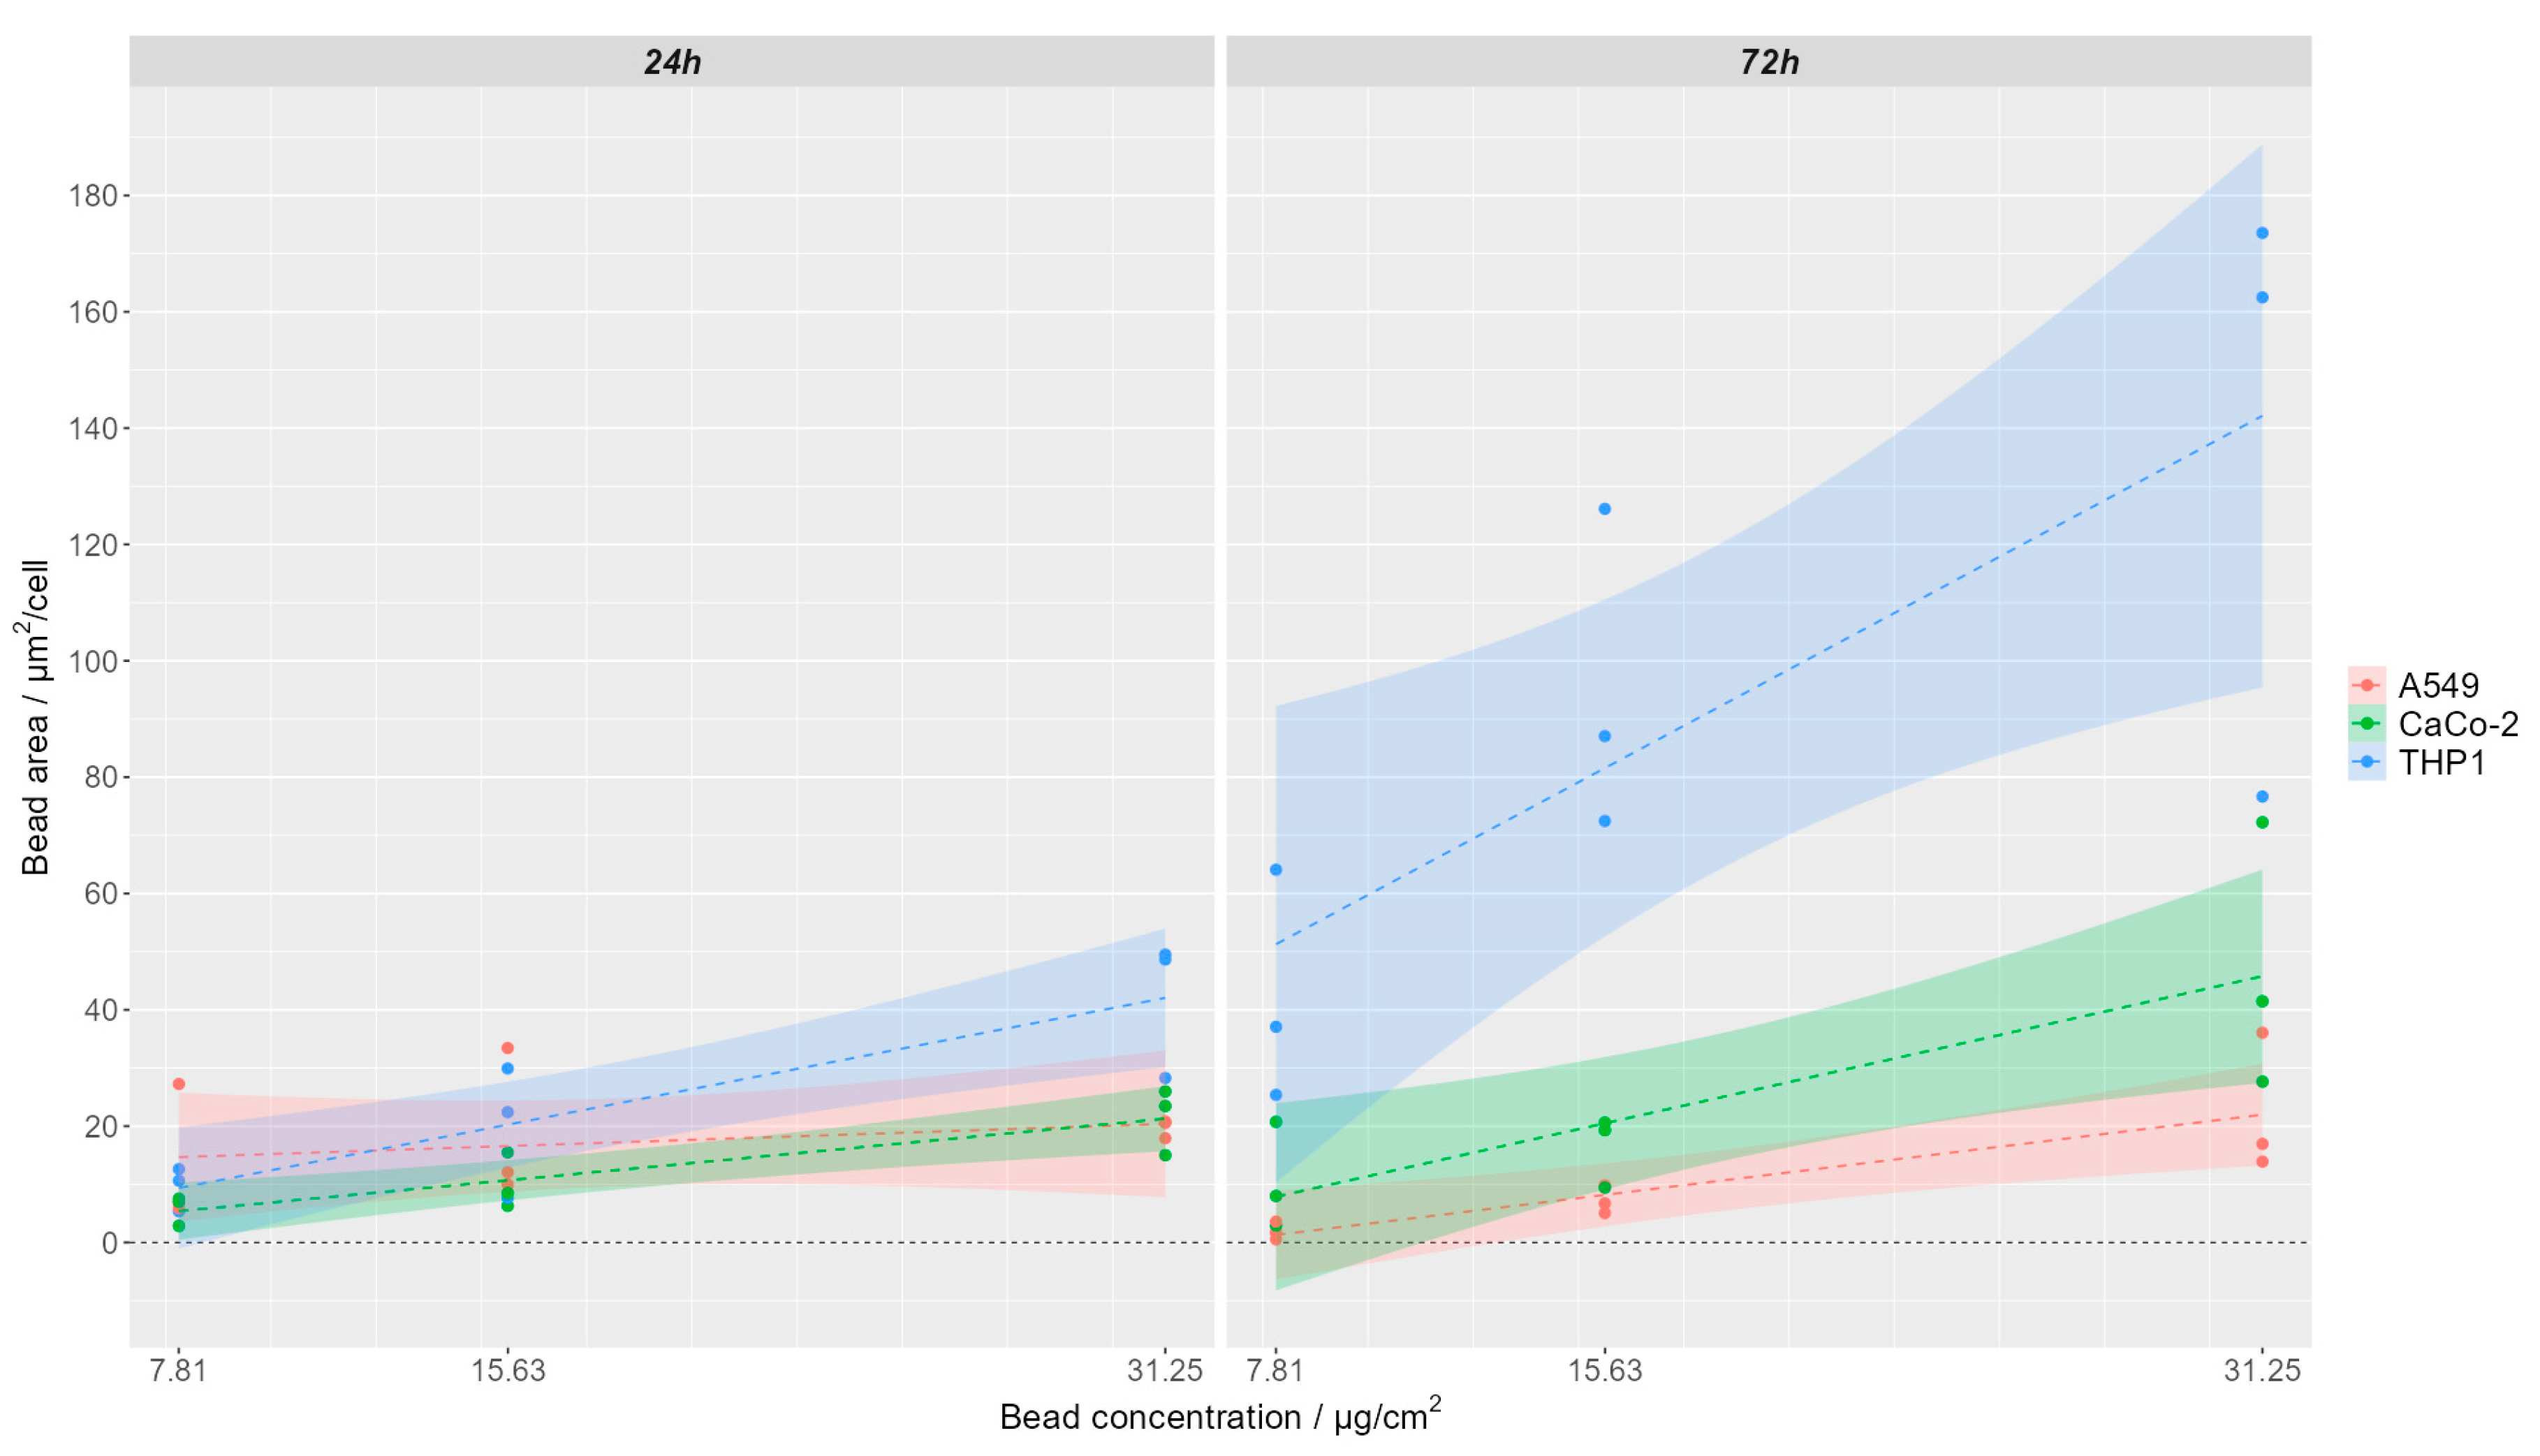
3.1. Quantification of Polystyrene Nanoparticle Uptake by Different Cell Lines
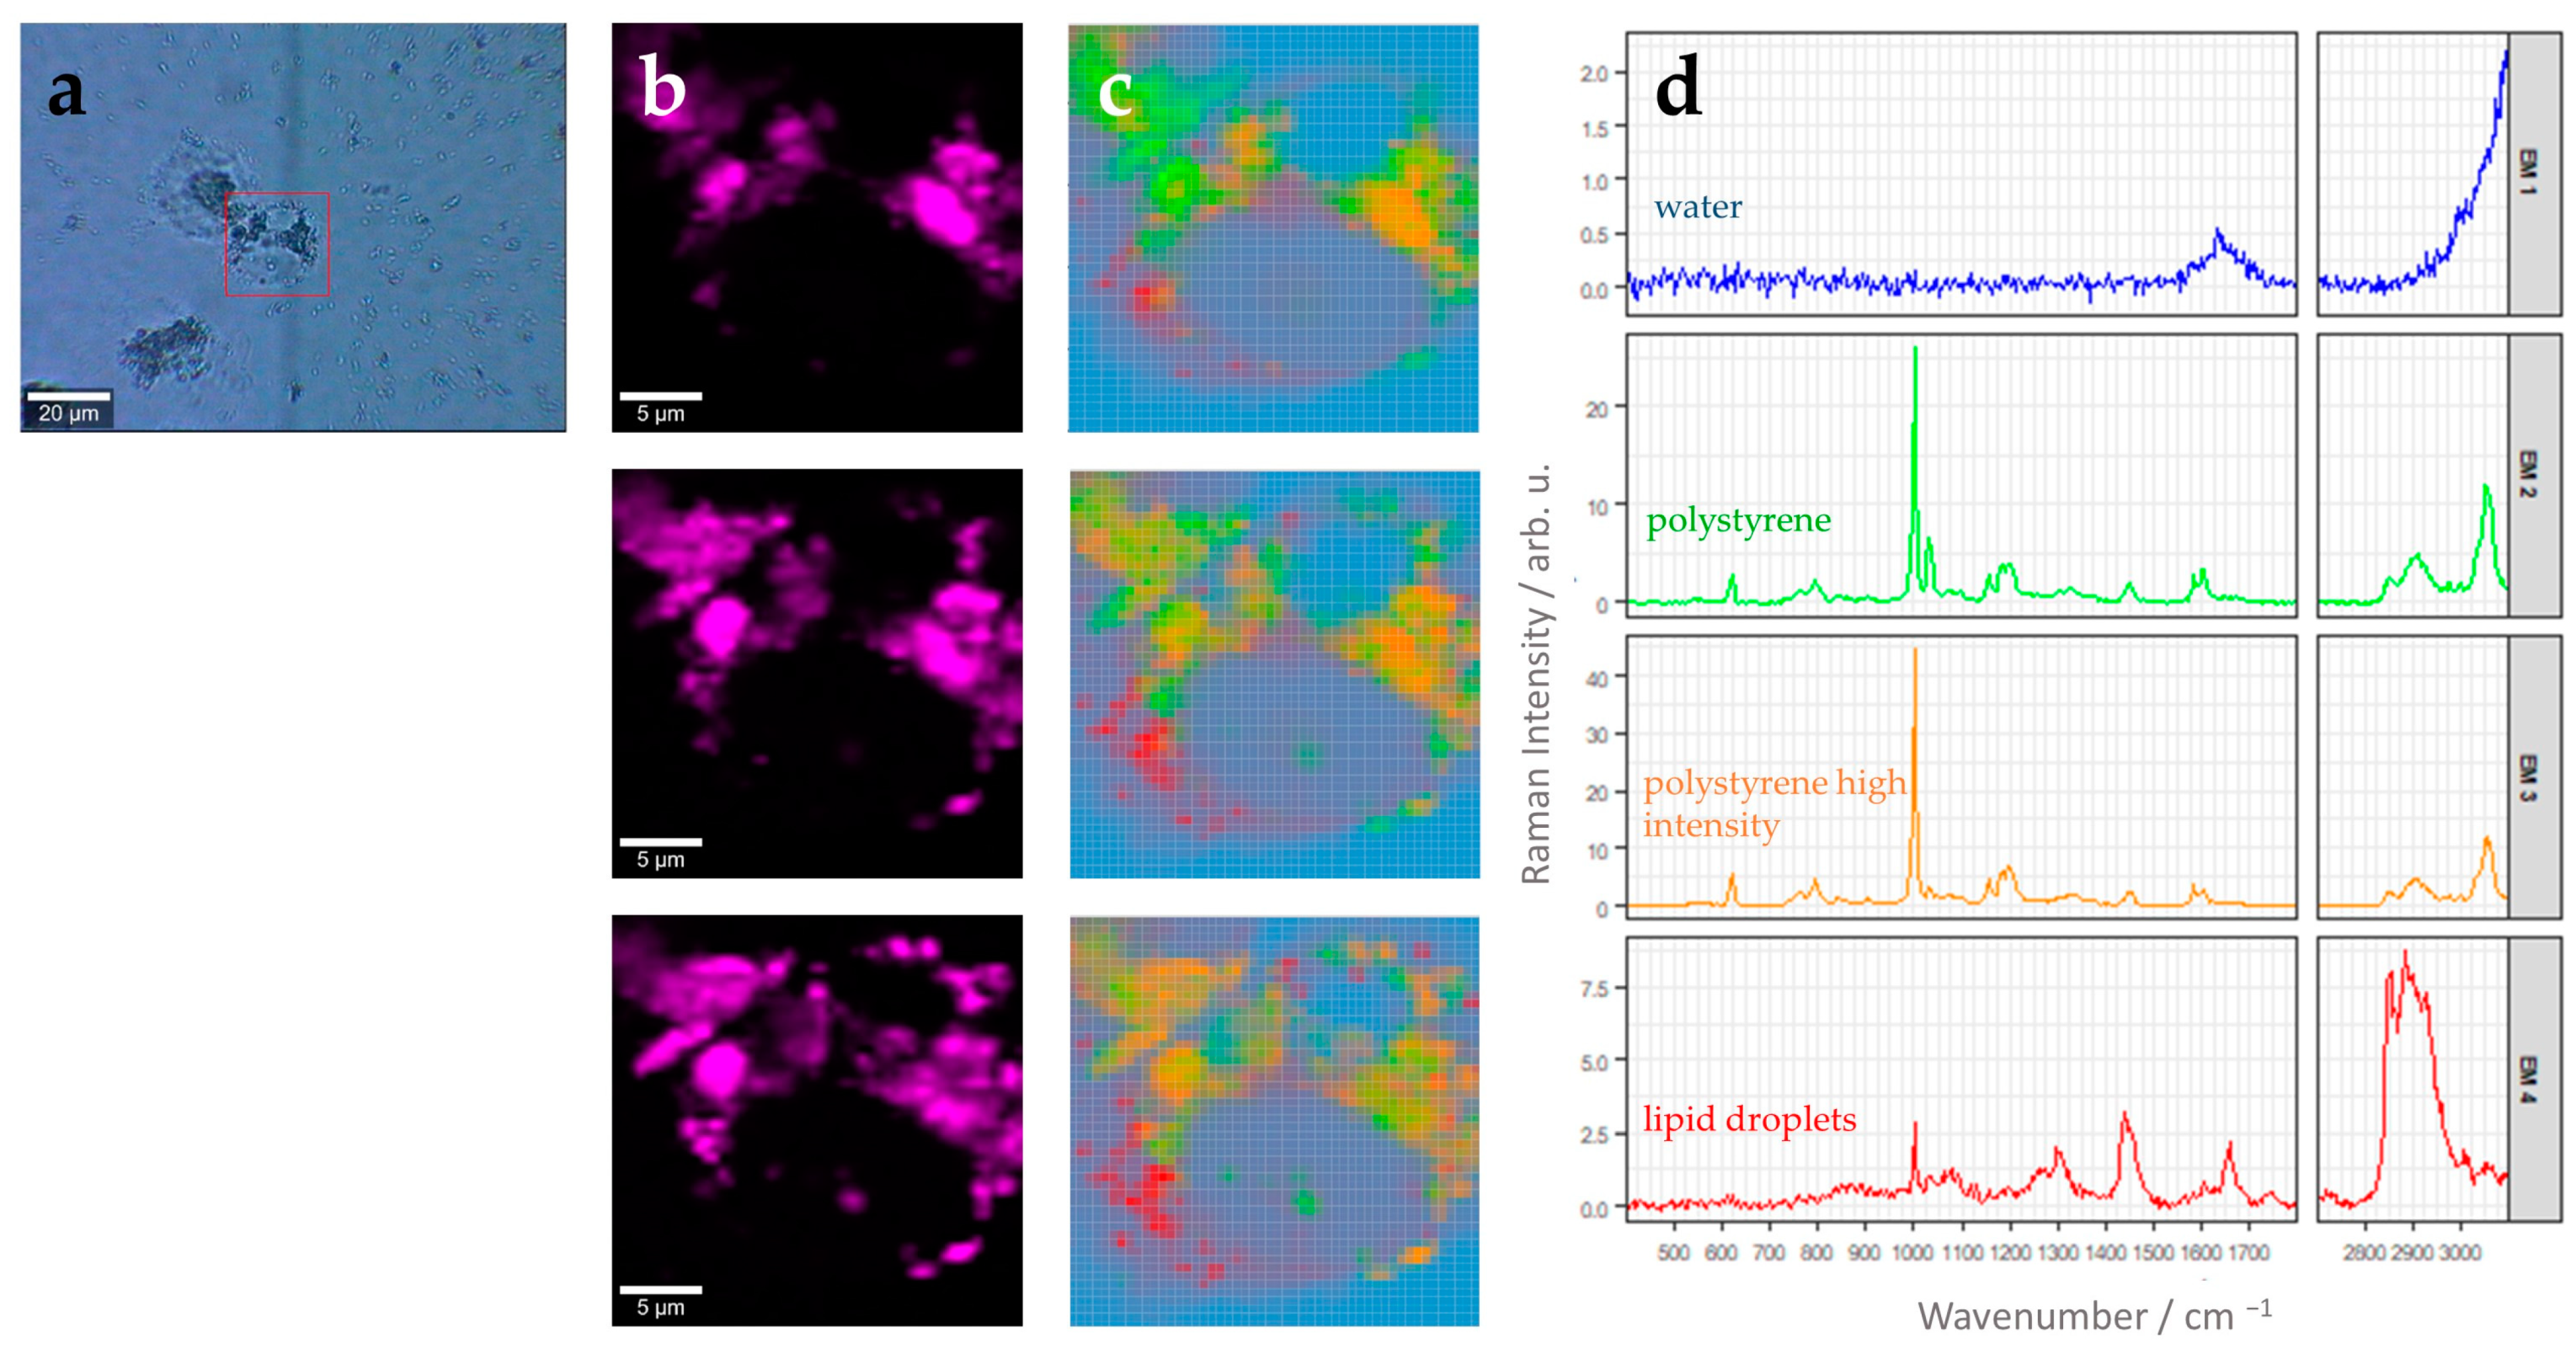
3.2. Label-Free 3D Visualization of Intracellular Nanoparticles Using Raman Imaging
4. Discussion
5. Summary and Conclusions
Supplementary Materials
Author Contributions
Funding
Institutional Review Board Statement
Informed Consent Statement
Data Availability Statement
Conflicts of Interest
References
- Lamichhane, G.; Acharya, A.; Marahatha, R.; Modi, B.; Paudel, R.; Adhikari, A.; Raut, B.K.; Aryal, S.; Parajuli, N. Microplastics in environment: Global concern, challenges, and controlling measures. Int. J. Environ. Sci. Technol. 2023, 20, 4673–4694. [Google Scholar] [CrossRef]
- Barnes, D.K.; Galgani, F.; Thompson, R.C.; Barlaz, M. Accumulation and fragmentation of plastic debris in global environments. Philos. Trans. R. Soc. Lond. Ser. B Biol. Sci. 2009, 364, 1985–1998. [Google Scholar] [CrossRef] [PubMed]
- Andrady, A.L. Microplastics in the marine environment. Mar. Pollut. Bull. 2011, 62, 1596–1605. [Google Scholar] [CrossRef] [PubMed]
- Facciolà, A.; Visalli, G.; Pruiti Ciarello, M.; Di Pietro, A. Newly Emerging Airborne Pollutants: Current Knowledge of Health Impact of Micro and Nanoplastics. Int. J. Environ. Res. Public. Health 2021, 18, 2997. [Google Scholar] [CrossRef]
- Koelmans, A.A.; Redondo-Hasselerharm, P.E.; Nor, N.H.M.; de Ruijter, V.N.; Mintenig, S.M.; Kooi, M. Risk assessment of microplastic particles. Nat. Rev. Mater. 2022, 7, 138–152. [Google Scholar] [CrossRef]
- Rahman, A.; Sarkar, A.; Yadav, O.P.; Achari, G.; Slobodnik, J. Potential human health risks due to environmental exposure to nano- and microplastics and knowledge gaps: A scoping review. Sci. Total Environ. 2021, 757, 143872. [Google Scholar] [CrossRef]
- Wu, P.; Lin, S.; Cao, G.; Wu, J.; Jin, H.; Wang, C.; Wong, M.H.; Yang, Z.; Cai, Z. Absorption, distribution, metabolism, excretion and toxicity of microplastics in the human body and health implications. J. Hazard. Mater. 2022, 437, 129361. [Google Scholar] [CrossRef]
- Trovato, M.C.; Andronico, D.; Sciacchitano, S.; Ruggeri, R.M.; Picerno, I.; Di Pietro, A.; Visalli, G. Nanostructures: Between natural environment and medical practice. Rev. Environ. Health 2018, 33, 295–307. [Google Scholar] [CrossRef]
- Murugan, P.; Sivaperumal, P.; Balu, S.; Arya, S.; Atchudan, R.; Sundramoorthy, A.K. Recent advances on the methods developed for the identification and detection of emerging contaminant microplastics: A review. RSC Adv. 2023, 13, 36223–36241. [Google Scholar] [CrossRef]
- Li, J.; Liu, H.; Paul Chen, J. Microplastics in freshwater systems: A review on occurrence, environmental effects, and methods for microplastics detection. Water Res. 2018, 137, 362–374. [Google Scholar] [CrossRef]
- Wang, W.; Wang, J. Investigation of microplastics in aquatic environments: An overview of the methods used, from field sampling to laboratory analysis. TrAC Trends Anal. Chem. 2018, 108, 195–202. [Google Scholar] [CrossRef]
- Ivleva, N.P. Chemical Analysis of Microplastics and Nanoplastics: Challenges, Advanced Methods, and Perspectives. Chem. Rev. 2021, 121, 11886–11936. [Google Scholar] [CrossRef]
- Soursou, V.; Campo, J.; Picó, Y. A critical review of the novel analytical methods for the determination of microplastics in sand and sediment samples. TrAC Trends Anal. Chem. 2023, 166, 117190. [Google Scholar] [CrossRef]
- Primpke, S.; Christiansen, S.H.; Cowger, W.; De Frond, H.; Deshpande, A.; Fischer, M.; Holland, E.B.; Meyns, M.; O’Donnell, B.A.; Ossmann, B.E.; et al. Critical Assessment of Analytical Methods for the Harmonized and Cost-Efficient Analysis of Microplastics. Appl. Spectrosc. 2020, 74, 1012–1047. [Google Scholar] [CrossRef]
- Pei, W.; Hu, R.; Liu, H.; Wang, L.; Lai, Y. Advanced Raman spectroscopy for nanoplastics analysis: Progress and perspective. TrAC Trends Anal. Chem. 2023, 166, 117188. [Google Scholar] [CrossRef]
- Cabernard, L.; Roscher, L.; Lorenz, C.; Gerdts, G.; Primpke, S. Comparison of Raman and Fourier Transform Infrared Spectroscopy for the Quantification of Microplastics in the Aquatic Environment. Environ. Sci. Technol. 2018, 52, 13279–13288. [Google Scholar] [CrossRef] [PubMed]
- Fang, C.; Luo, Y.; Naidu, R. Advancements in Raman imaging for nanoplastic analysis: Challenges, algorithms and future Perspectives. Anal. Chim. Acta 2023, 1290, 342069. [Google Scholar] [CrossRef]
- Ivask, A.; Mitchell, A.J.; Malysheva, A.; Voelcker, N.H.; Lombi, E. Methodologies and approaches for the analysis of cell-nanoparticle interactions. Wiley Interdiscip. Rev. Nanomed. Nanobiotechnol 2018, 10, e1486. [Google Scholar] [CrossRef]
- Caldwell, J.; Loussert-Fonta, C.; Toullec, G.; Heidelberg Lyndby, N.; Haenni, B.; Taladriz-Blanco, P.; Espiña, B.; Rothen-Rutishauser, B.; Petri-Fink, A. Correlative Light, Electron Microscopy and Raman Spectroscopy Workflow To Detect and Observe Microplastic Interactions with Whole Jellyfish. Environ. Sci. Technol. 2023, 57, 6664–6672. [Google Scholar] [CrossRef]
- Schindelin, J.; Arganda-Carreras, I.; Frise, E.; Kaynig, V.; Longair, M.; Pietzsch, T.; Preibisch, S.; Rueden, C.; Saalfeld, S.; Schmid, B.; et al. Fiji: An open-source platform for biological-image analysis. Nat. Methods 2012, 9, 676–682. [Google Scholar] [CrossRef]
- Čepa, M. Segmentation of Total Cell Area in Brightfield Microscopy Images. Methods Protoc. 2018, 1, 43. [Google Scholar] [CrossRef] [PubMed]
- Wickham, H.; Francois, R.; Henry, L.; Müller, K.; Vaughan, D. Dplyr: A Grammar of Data Manipulation, R package version 1.1.0; 2023; Available online: https://CRAN.R-project.org/package=dplyr (accessed on 21 December 2023).
- Beleites, C.; Sergo, V.; Bonifacio, A.; Dahms, M.; Egert, B.; Fuller, S.; Gegzna, V.; Rustam, R.G.; Hanson, B.A.; Hermes, M.; et al. hyperSpec: Work with Hyperspectral Data, i.e., Spectra + Meta Information (Spatial, Time, Concentration, …); 0.100.0; 2021; Available online: http://hyperspec.r-forge.r-project.org (accessed on 21 December 2023).
- Wickham, H. ggplot2: Elegant Graphics for Data Analysis; Springer-Verlag: New York, NY, USA, 2016. [Google Scholar]
- Belov, A.; McManus, C.; Beleites, C.; Hanson, B.; Fuller, S. unmixR: Hyperspectral Unmixing Methods, R package version 0.2.339; 2016; Available online: https://gitlab.com/chemometrics/unmixR (accessed on 21 December 2023).
- Ryabchykov, O.; Bocklitz, T.; Ramoji, A.; Neugebauer, U.; Foerster, M.; Kroegel, C.; Bauer, M.; Kiehntopf, M.; Popp, J. Automatization of spike correction in Raman spectra of biological samples. Chemom. Intell. Lab. Syst. 2016, 155, 1–6. [Google Scholar] [CrossRef]
- Winter, M. N-FINDR: An Algorithm for Fast Autonomous Spectral End-Member Determination in Hyperspectral Data; SPIE: St Bellingham, WA, USA, 1999; Volume 3753. [Google Scholar]
- Burikov, S.; Dolenko, T.; Patsaeva, S.; Starokurov, Y.; Yuzhakov, V. Raman and IR spectroscopy research on hydrogen bonding in water–ethanol systems. Mol. Phys. 2010, 108, 2427–2436. [Google Scholar] [CrossRef]
- Mazilu, M.; De Luca, A.C.; Riches, A.; Herrington, C.S.; Dholakia, K. Optimal algorithm for fluorescence suppression of modulated Raman spectroscopy. Opt. Express 2010, 18, 11382–11395. [Google Scholar] [CrossRef] [PubMed]
- Bridges, T.E.; Houlne, M.P.; Harris, J.M. Spatially Resolved Analysis of Small Particles by Confocal Raman Microscopy: Depth Profiling and Optical Trapping. Anal. Chem. 2004, 76, 576–584. [Google Scholar] [CrossRef]
- Kellar, E.J.C.; Galiotis, C.; Andrews, E.H. Raman Vibrational Studies of Syndiotactic Polystyrene. 1. Assignments in a Conformational/Crystallinity Sensitive Spectral Region. Macromolecules 1996, 29, 3515–3520. [Google Scholar] [CrossRef]
- Czamara, K.; Majzner, K.; Pacia, M.Z.; Kochan, K.; Kaczor, A.; Baranska, M. Raman spectroscopy of lipids: A review. J. Raman Spectrosc. 2015, 46, 4–20. [Google Scholar] [CrossRef]
- Tsuchiya, S.; Kobayashi, Y.; Goto, Y.; Okumura, H.; Nakae, S.; Konno, T.; Tada, K. Induction of maturation in cultured human monocytic leukemia cells by a phorbol diester. Cancer Res. 1982, 42, 1530–1536. [Google Scholar]
- Kutralam-Muniasamy, G.; Shruti, V.C.; Pérez-Guevara, F.; Roy, P.D. Microplastic diagnostics in humans: “The 3Ps” Progress, problems, and prospects. Sci. Total Environ. 2023, 856, 159164. [Google Scholar] [CrossRef]
- Efeoglu, E.; Keating, M.; McIntyre, J.; Casey, A.; Byrne, H.J. Determination of nanoparticle localisation within subcellular organelles in vitro using Raman spectroscopy. Anal. Methods 2015, 7, 10000–10017. [Google Scholar] [CrossRef]
- Dorney, J.; Bonnier, F.; Garcia, A.; Casey, A.; Chambers, G.; Byrne, H.J. Identifying and localizing intracellular nanoparticles using Raman spectroscopy. Analyst 2012, 137, 1111–1119. [Google Scholar] [CrossRef] [PubMed]
- Byrne, H.J.; Bonnier, F.; Efeoglu, E.; Moore, C.; McIntyre, J. In vitro Label Free Raman Microspectroscopic Analysis to Monitor the Uptake, Fate and Impacts of Nanoparticle Based Materials. Front. Bioeng. Biotechnol. 2020, 8, 544311. [Google Scholar] [CrossRef] [PubMed]
- Böke, J.S.; Popp, J.; Krafft, C. Optical photothermal infrared spectroscopy with simultaneously acquired Raman spectroscopy for two-dimensional microplastic identification. Sci. Rep. 2022, 12, 18785. [Google Scholar] [CrossRef] [PubMed]
Disclaimer/Publisher’s Note: The statements, opinions, and data contained in all publications are solely those of the individual author(s) and contributor(s) and not of MDPI and/or the editor(s). MDPI and/or the editor(s) disclaim responsibility for any injury to people or property resulting from any ideas, methods, instructions, or products referred to in the content. |

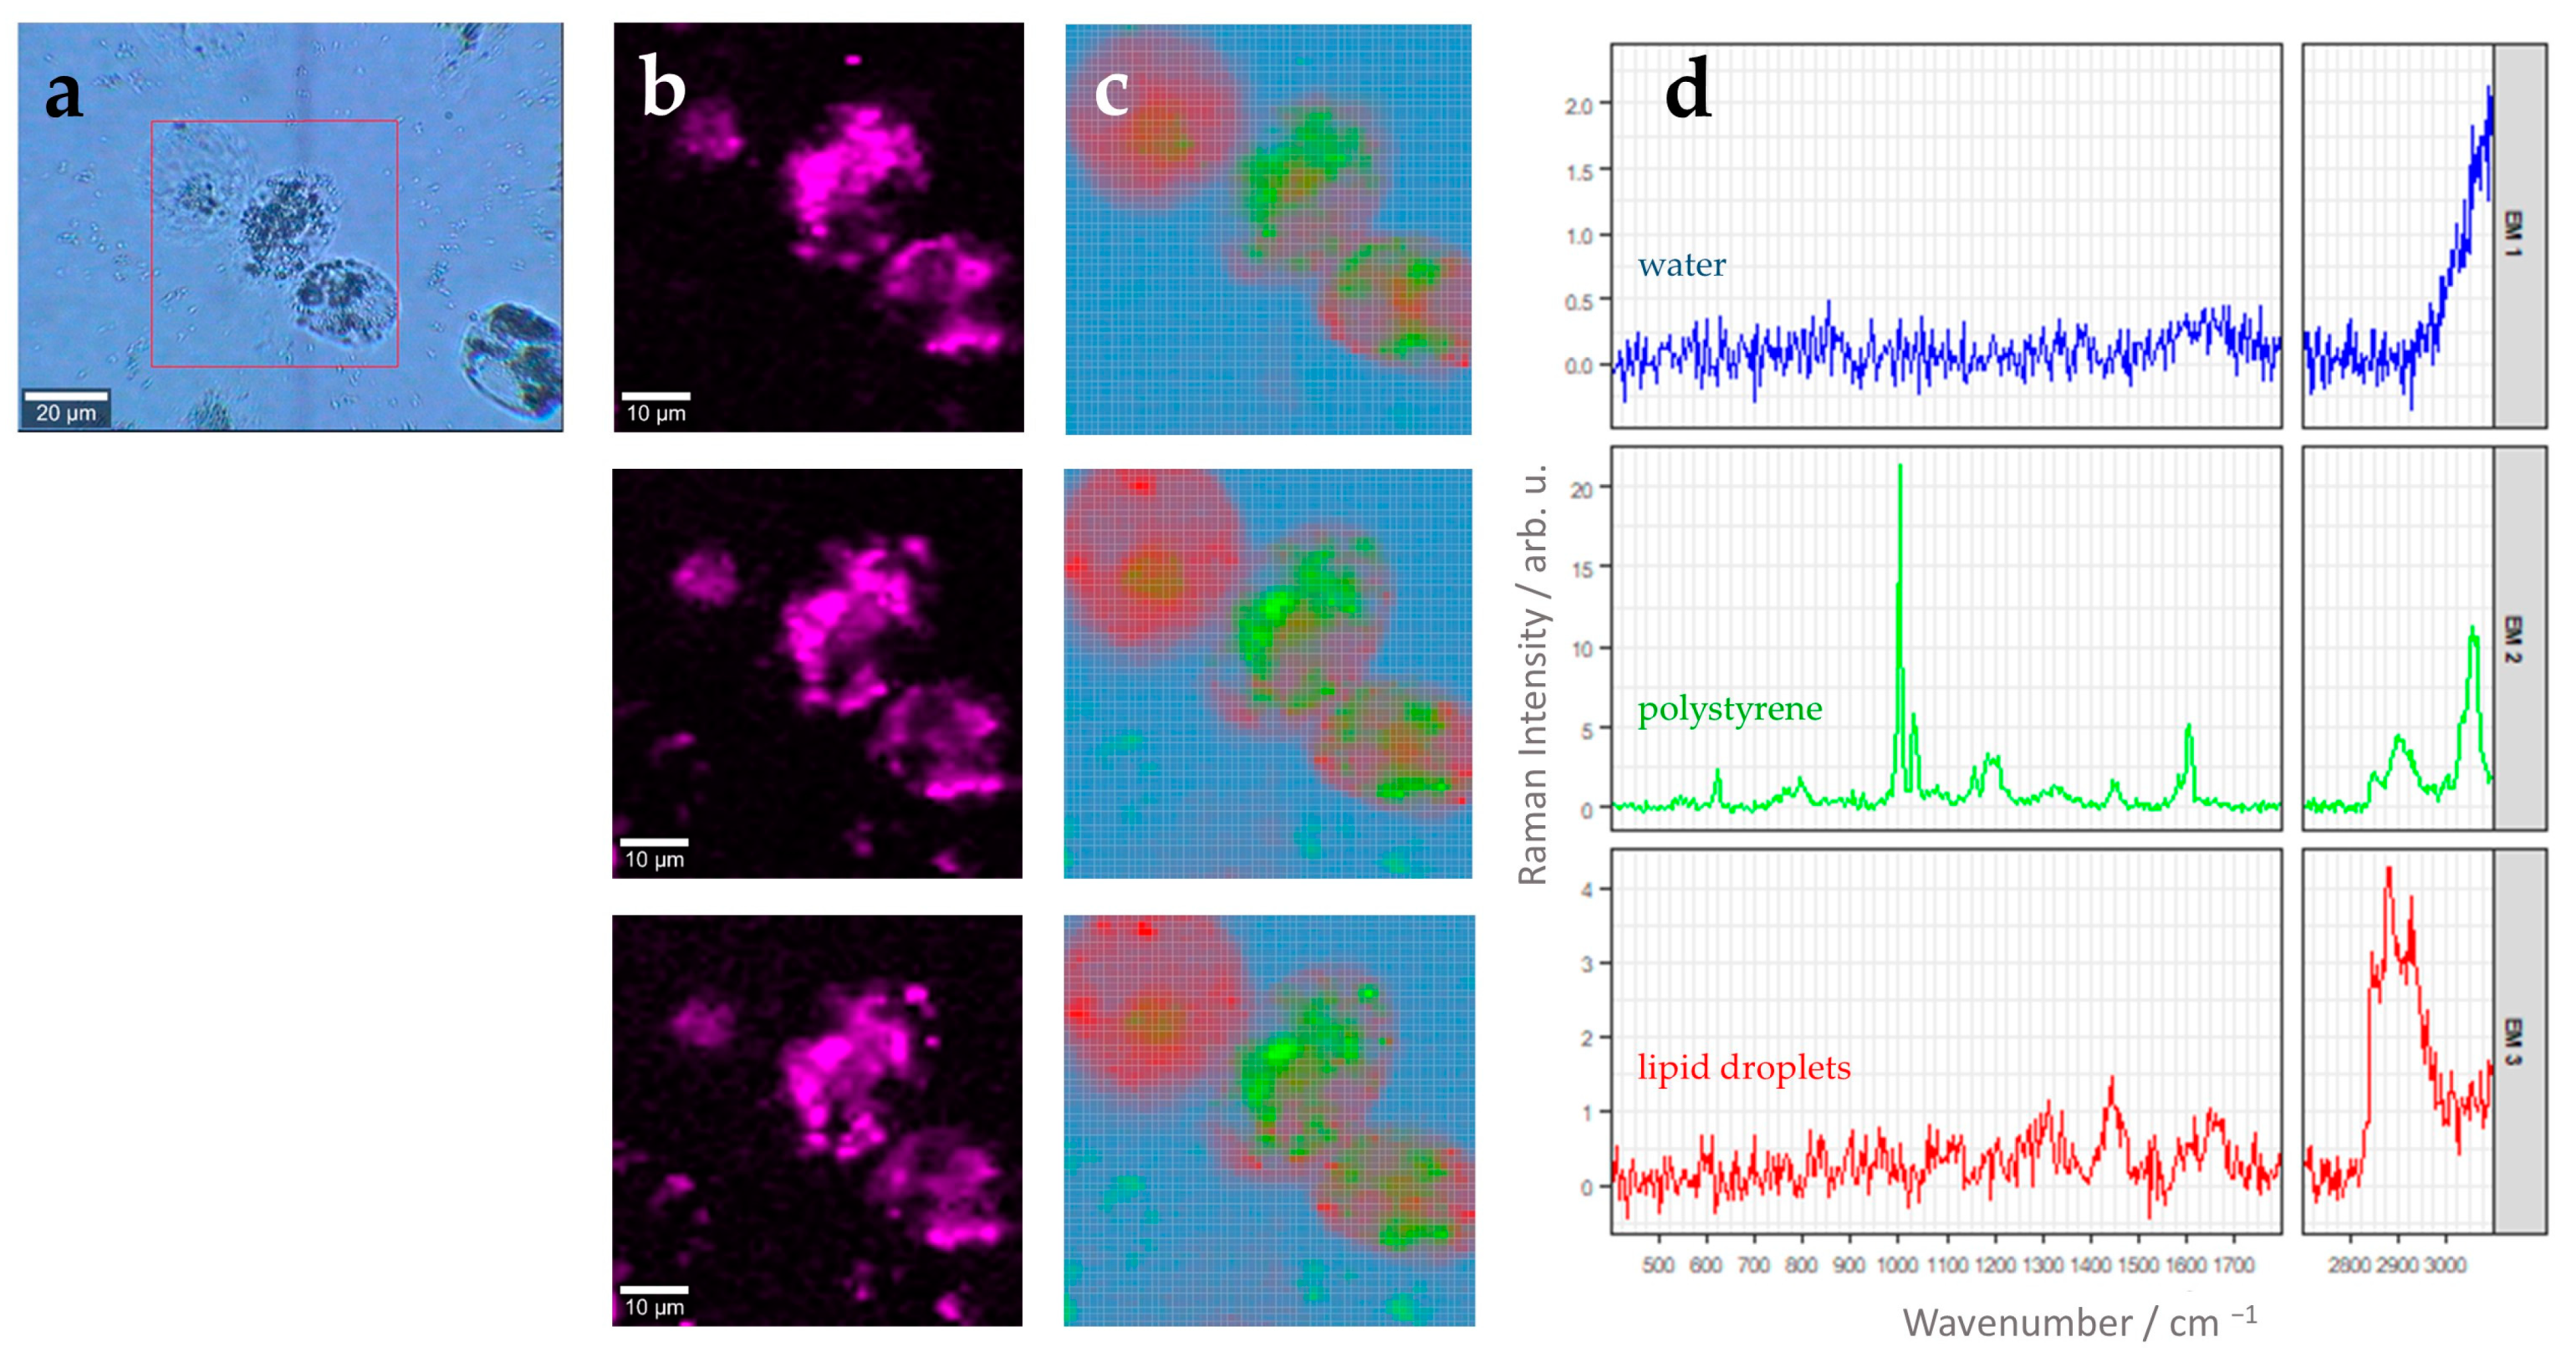
| Endmember Spectrum (Color: Assignment) | Raman Band in cm−1 | Assignment (Based on Literature) |
|---|---|---|
| Blue: Water | 1644 | H-O-H bending vibration [28] |
| Green/Orange: PS Bead | 621 | Aromatic ring deformation [29,30,31] |
| 1001 | Aromatic ring breathing [29,30,31] | |
| 1031 | C-H deformation vibration [29,30,31] | |
| 1201 | C6H5-C vibration [29,30,31] | |
| 1450 | CH2 scissoring [29,30,31] | |
| 1604 | Ring skeletal stretch [29,30,31] | |
| 2913 | Anti-symmetric CH2 stretching [29,30,31] | |
| 3057 | C-H stretch of aromatic ring [29,30,31] | |
| Red: Lipid droplets | 1302 | Twisting vibration of CH2 group [32] |
| 1442 | Scissoring vibration of CH2/CH3 group [32] | |
| 1656 | C=C stretching vibration [32] | |
| 2882 | Antisymmetric =CH2 stretching [32] | |
| 2929 | =CH3 symmetric stretching [32] |
Disclaimer/Publisher’s Note: The statements, opinions and data contained in all publications are solely those of the individual author(s) and contributor(s) and not of MDPI and/or the editor(s). MDPI and/or the editor(s) disclaim responsibility for any injury to people or property resulting from any ideas, methods, instructions or products referred to in the content. |
© 2024 by the authors. Licensee MDPI, Basel, Switzerland. This article is an open access article distributed under the terms and conditions of the Creative Commons Attribution (CC BY) license (https://creativecommons.org/licenses/by/4.0/).
Share and Cite
Roth, A.; Tannert, A.; Ziller, N.; Eiserloh, S.; Göhrig, B.; Guliev, R.R.; Gonzalez Vazquez, M.J.; Naumann, M.; Mosig, A.S.; Stengel, S.; et al. Quantification of Polystyrene Uptake by Different Cell Lines Using Fluorescence Microscopy and Label-Free Visualization of Intracellular Polystyrene Particles by Raman Microspectroscopic Imaging. Cells 2024, 13, 454. https://doi.org/10.3390/cells13050454
Roth A, Tannert A, Ziller N, Eiserloh S, Göhrig B, Guliev RR, Gonzalez Vazquez MJ, Naumann M, Mosig AS, Stengel S, et al. Quantification of Polystyrene Uptake by Different Cell Lines Using Fluorescence Microscopy and Label-Free Visualization of Intracellular Polystyrene Particles by Raman Microspectroscopic Imaging. Cells. 2024; 13(5):454. https://doi.org/10.3390/cells13050454
Chicago/Turabian StyleRoth, Amelie, Astrid Tannert, Nadja Ziller, Simone Eiserloh, Bianca Göhrig, Rustam R. Guliev, María José Gonzalez Vazquez, Max Naumann, Alexander S. Mosig, Sven Stengel, and et al. 2024. "Quantification of Polystyrene Uptake by Different Cell Lines Using Fluorescence Microscopy and Label-Free Visualization of Intracellular Polystyrene Particles by Raman Microspectroscopic Imaging" Cells 13, no. 5: 454. https://doi.org/10.3390/cells13050454
APA StyleRoth, A., Tannert, A., Ziller, N., Eiserloh, S., Göhrig, B., Guliev, R. R., Gonzalez Vazquez, M. J., Naumann, M., Mosig, A. S., Stengel, S., Heutelbeck, A. R. R., & Neugebauer, U. (2024). Quantification of Polystyrene Uptake by Different Cell Lines Using Fluorescence Microscopy and Label-Free Visualization of Intracellular Polystyrene Particles by Raman Microspectroscopic Imaging. Cells, 13(5), 454. https://doi.org/10.3390/cells13050454