1. Introduction
The human genome catalogues a dynamic array of information. Extensive cooperation between protein macromolecules is required to precisely express pertinent genetic information in response to developmental and physiological stimuli. Careful maintenance of gene transcriptional activity—governed in part by unique patterns of DNA modifications and post-translational modifications (PTM)s on chromatin-associated histone proteins—is critical for proper cell growth and development [
1]. Dysregulation of this delicately balanced system often leads to a variety of human diseases [
2].
Epigenetic proteins facilitate gene regulation by modulating chromatin structure, allowing for changes in gene expression without altering the genetic code. Chromatin dynamically exists between two structural states, euchromatin and heterochromatin, which respectively enhance or occlude access to DNA by transcriptional machinery. The specific mechanisms by which facultatively silenced genes are activated upon differentiation or disease progression are not fully understood.
Until the last decade, mammalian epigenetic silencing through histone H3 lysine 9 (H3K9) methylation was thought to be directed solely by the heterochromatin protein 1 (HP1) pathway. HP1 contains several isoforms, α, β, and γ, with HP1α being the most well-characterized at heterochromatin and HP1γ often localizing to euchromatin [
3,
4]. Our study focuses on HP1α, a relatively small chromatin modulator, which contains a chromodomain that recognizes H3K9 di- and trimethylation (H3K9me2/3) and is linked to a chromoshadow domain by a disordered hinge region [
5,
6,
7,
8]. The chromoshadow domain is critical for HP1α engagement in protein-protein interactions with other HP1α monomers and chromatin factors, such as histone methyltransferases Suv39H1/2 and SETDB1 [
9,
10].
In 2015, using forward genetic screening, Tchasovnikarov and Timms et al. identified the human silencing hub (HUSH) as a second mediator of H3K9me3-mediated gene repression in humans [
11]. Dependent on M-phase phosphoprotein 8 (MPP8)’s chromodomain, which selectively recognizes H3K9me3, the HUSH complex core (MPP8, TASOR, and periphilin) assembles at target loci [
12]. HUSH can then recruit histone methyltransferase SETDB1 to propagate the H3K9me3 mark and induce chromatin condensation, which is often accompanied by DNA methylation [
13,
14,
15]. Notably, this mechanism of epigenetic silencing is analogous to that seen in HP1α-mediated repression [
16].
Mechanistic understanding of the events that coordinate the engagement of H3K9me3 readers with chromatin is still an active area of research. To investigate novel proteins involved in heterochromatin regulation, our lab performed a high-throughput small molecule screening in mouse embryonic stem cells (mESC)s to identify inhibitors of HP1α-mediated heterochromatin formation [
17]. Subsequent chemical affinity purification and quantitative proteomics with the lead inhibitor, UNC2524, revealed the binding of known chromatin-interaction proteins, including MPP8, histone chaperone SPT6 (
Supt6H), and transcription elongation factor LAP2 (
Tmpo), as well as lesser characterized hepatoma-derived growth factor-related protein 2 (HRP2,
Hdgfrp2) [
18,
19].
HRP2 has been associated with active gene regions, namely in the context of targeted HIV-1 integration [
20,
21]. HRP2 harbors a highly conserved PWWP (Pro-Trp-Trp-Pro) chromatin-binding domain, which recognizes transcriptionally accessible chromatin through association with the histone modification H3K36me3 [
22]. HRP2′s H3K36 di- and trimethyl (me2/3) reader capability has been attributed to its role in transcriptional regulation, whereby HRP2 is required to promote transcriptional elongation during myoblast differentiation [
23,
24].
Despite strong engagement of HRP2′s PWWP domain with H3K36me2/3, Baude et al. reported that endogenous HRP2 has a high affinity for repressive histone marks, including H3K9me3 and H3K27me3, in U2OS osteosarcoma cells, suggesting that HRP2 activity is not limited to euchromatic regions and genomic location of this protein could be cell-type specific [
25]. HRP2 also associates with the HUSH complex at heterochromatin in 293T human embryonic kidney cells and MDA-MB-231 triple-negative breast cancer (TNBC) cells [
26]. Further, upon HRP2 knockout in LP-1 multiple myeloma cells, Wang et al. found increased levels of H3K27me3 and decreased recruitment of H3K27 demethylase, MINA [
27]. These studies, in addition to our previous work, substantiate HRP2′s engagement with multiple epigenetic repressive complexes and necessitate an investigation of HRP2′s engagement with heterochromatin to advance our understanding of its role as a transcriptional regulator. Here we provide a mechanistic study examining interactions at the interface of HRP2 and H3K9me3-silenced loci.
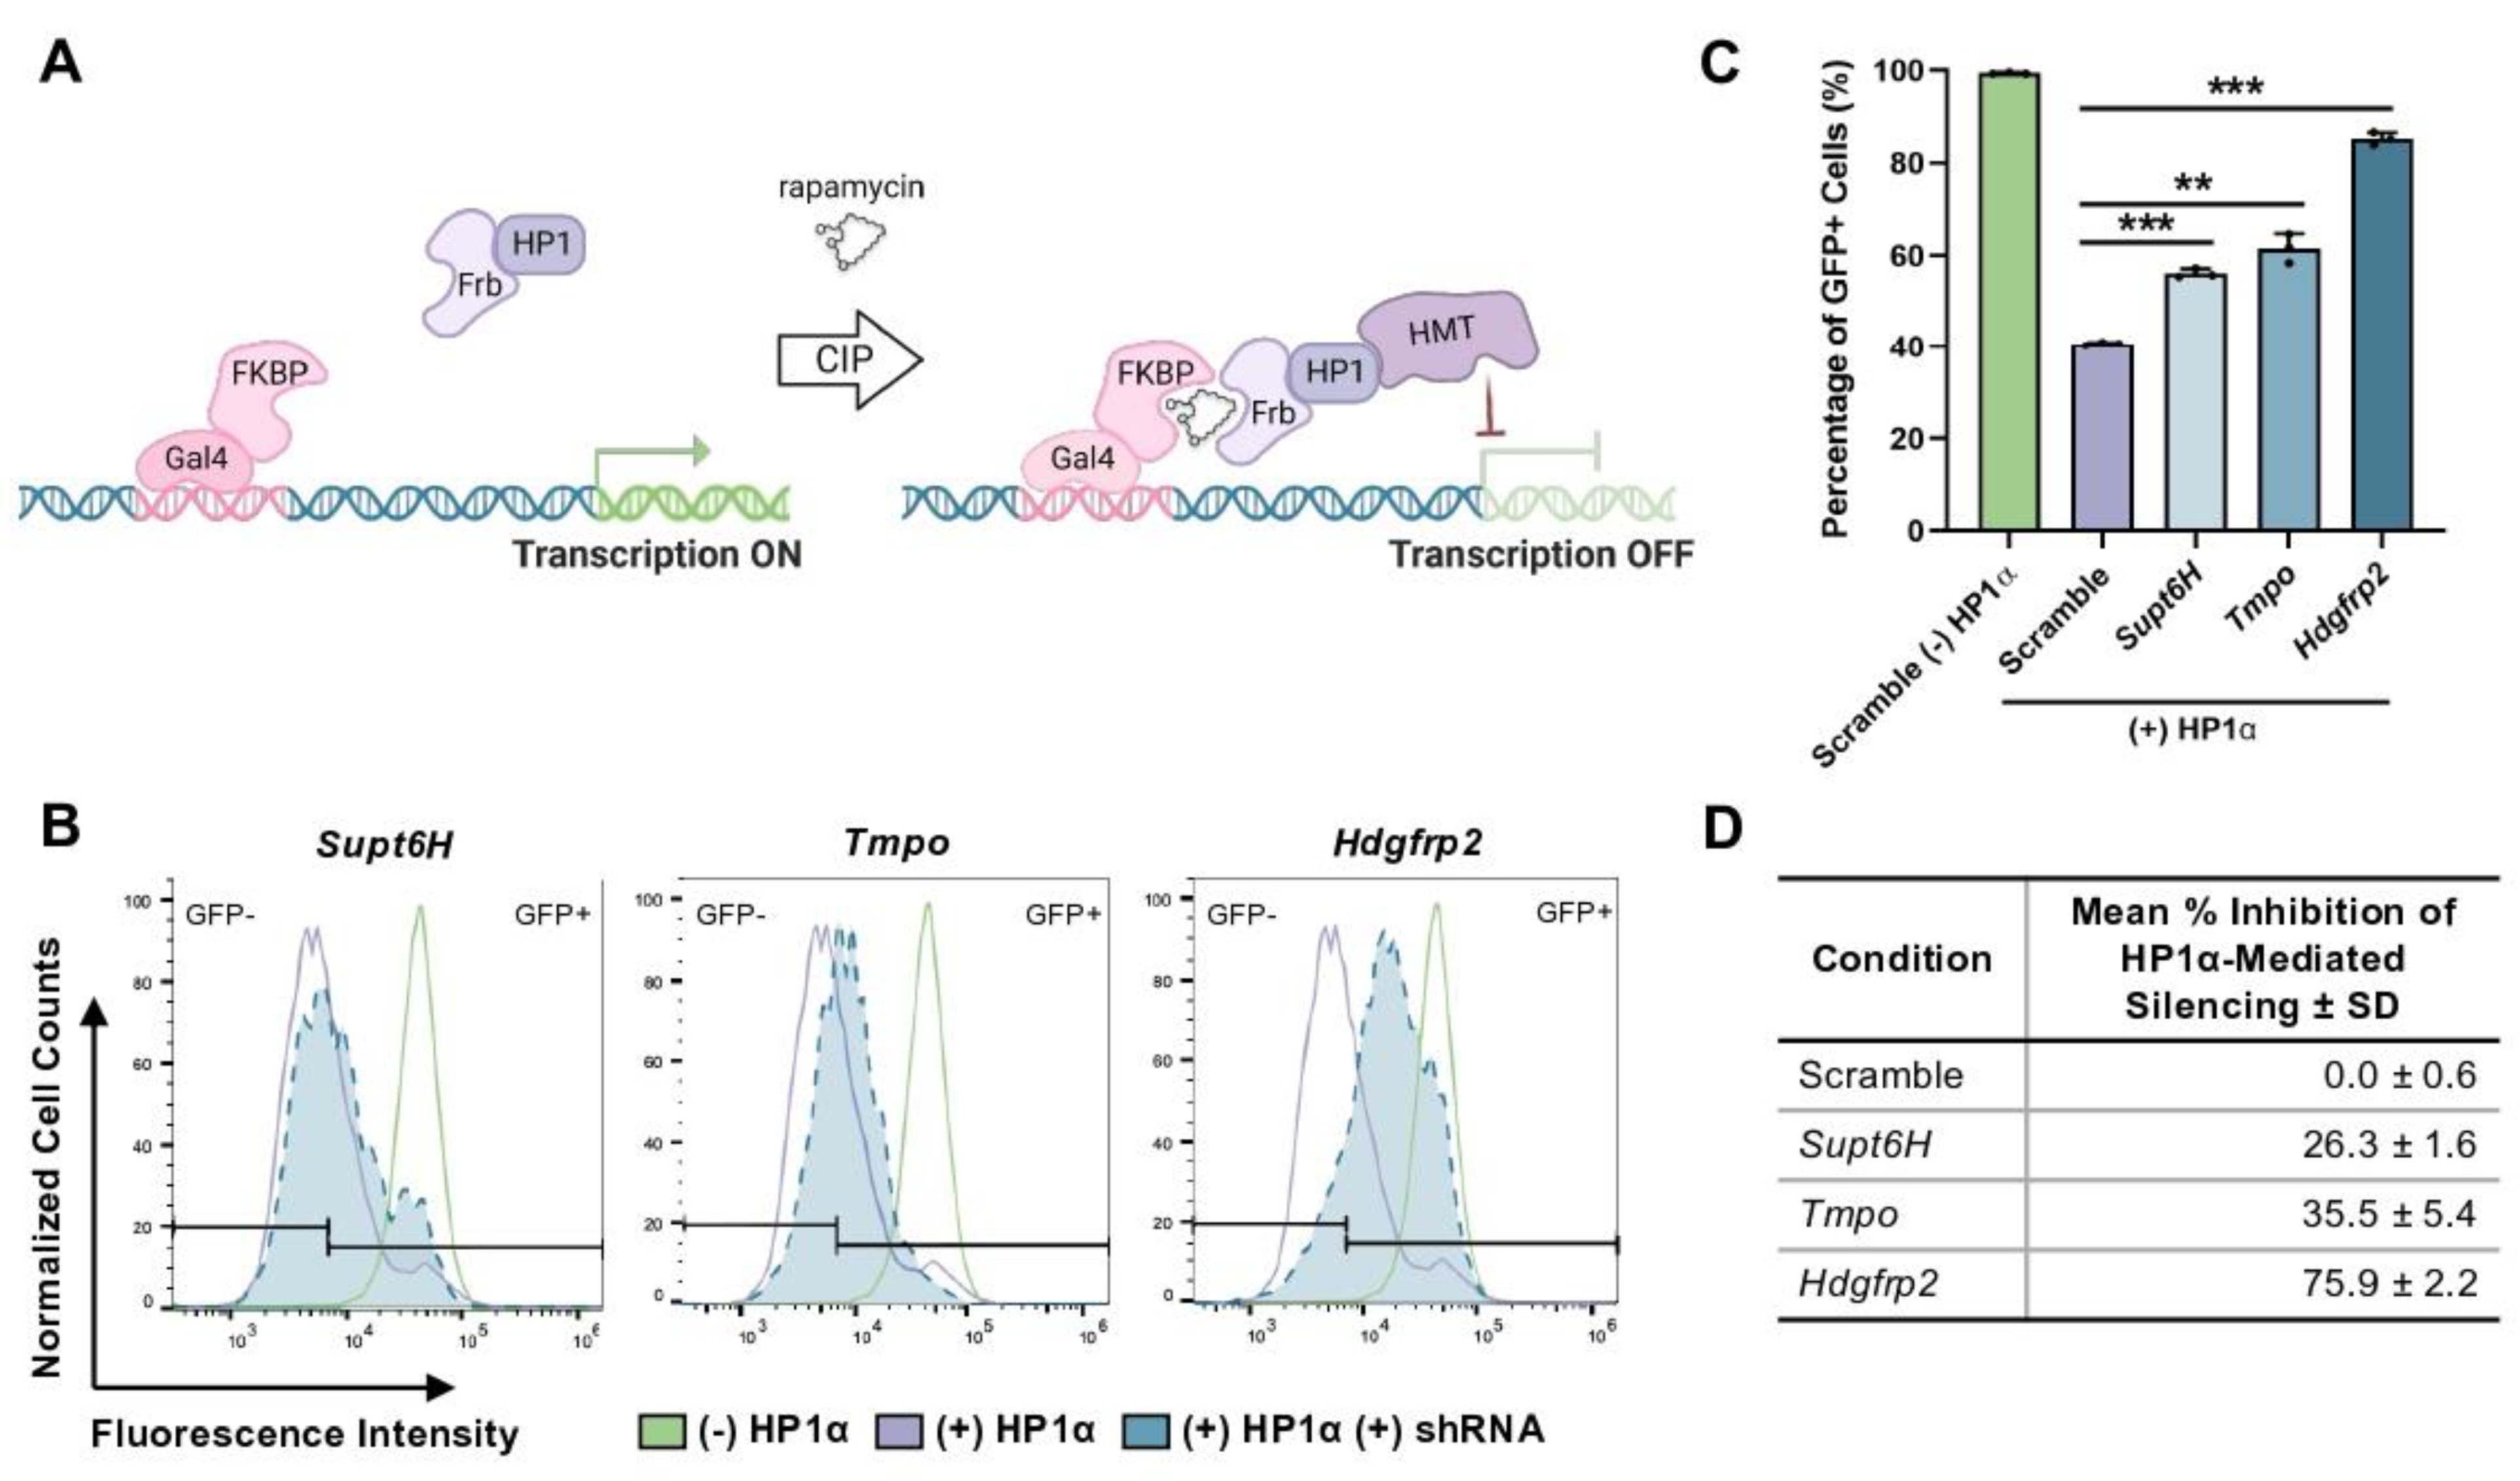
To first validate the putative role of HRP2 in HP1α-mediated gene repression, we used shRNA technology to knockdown
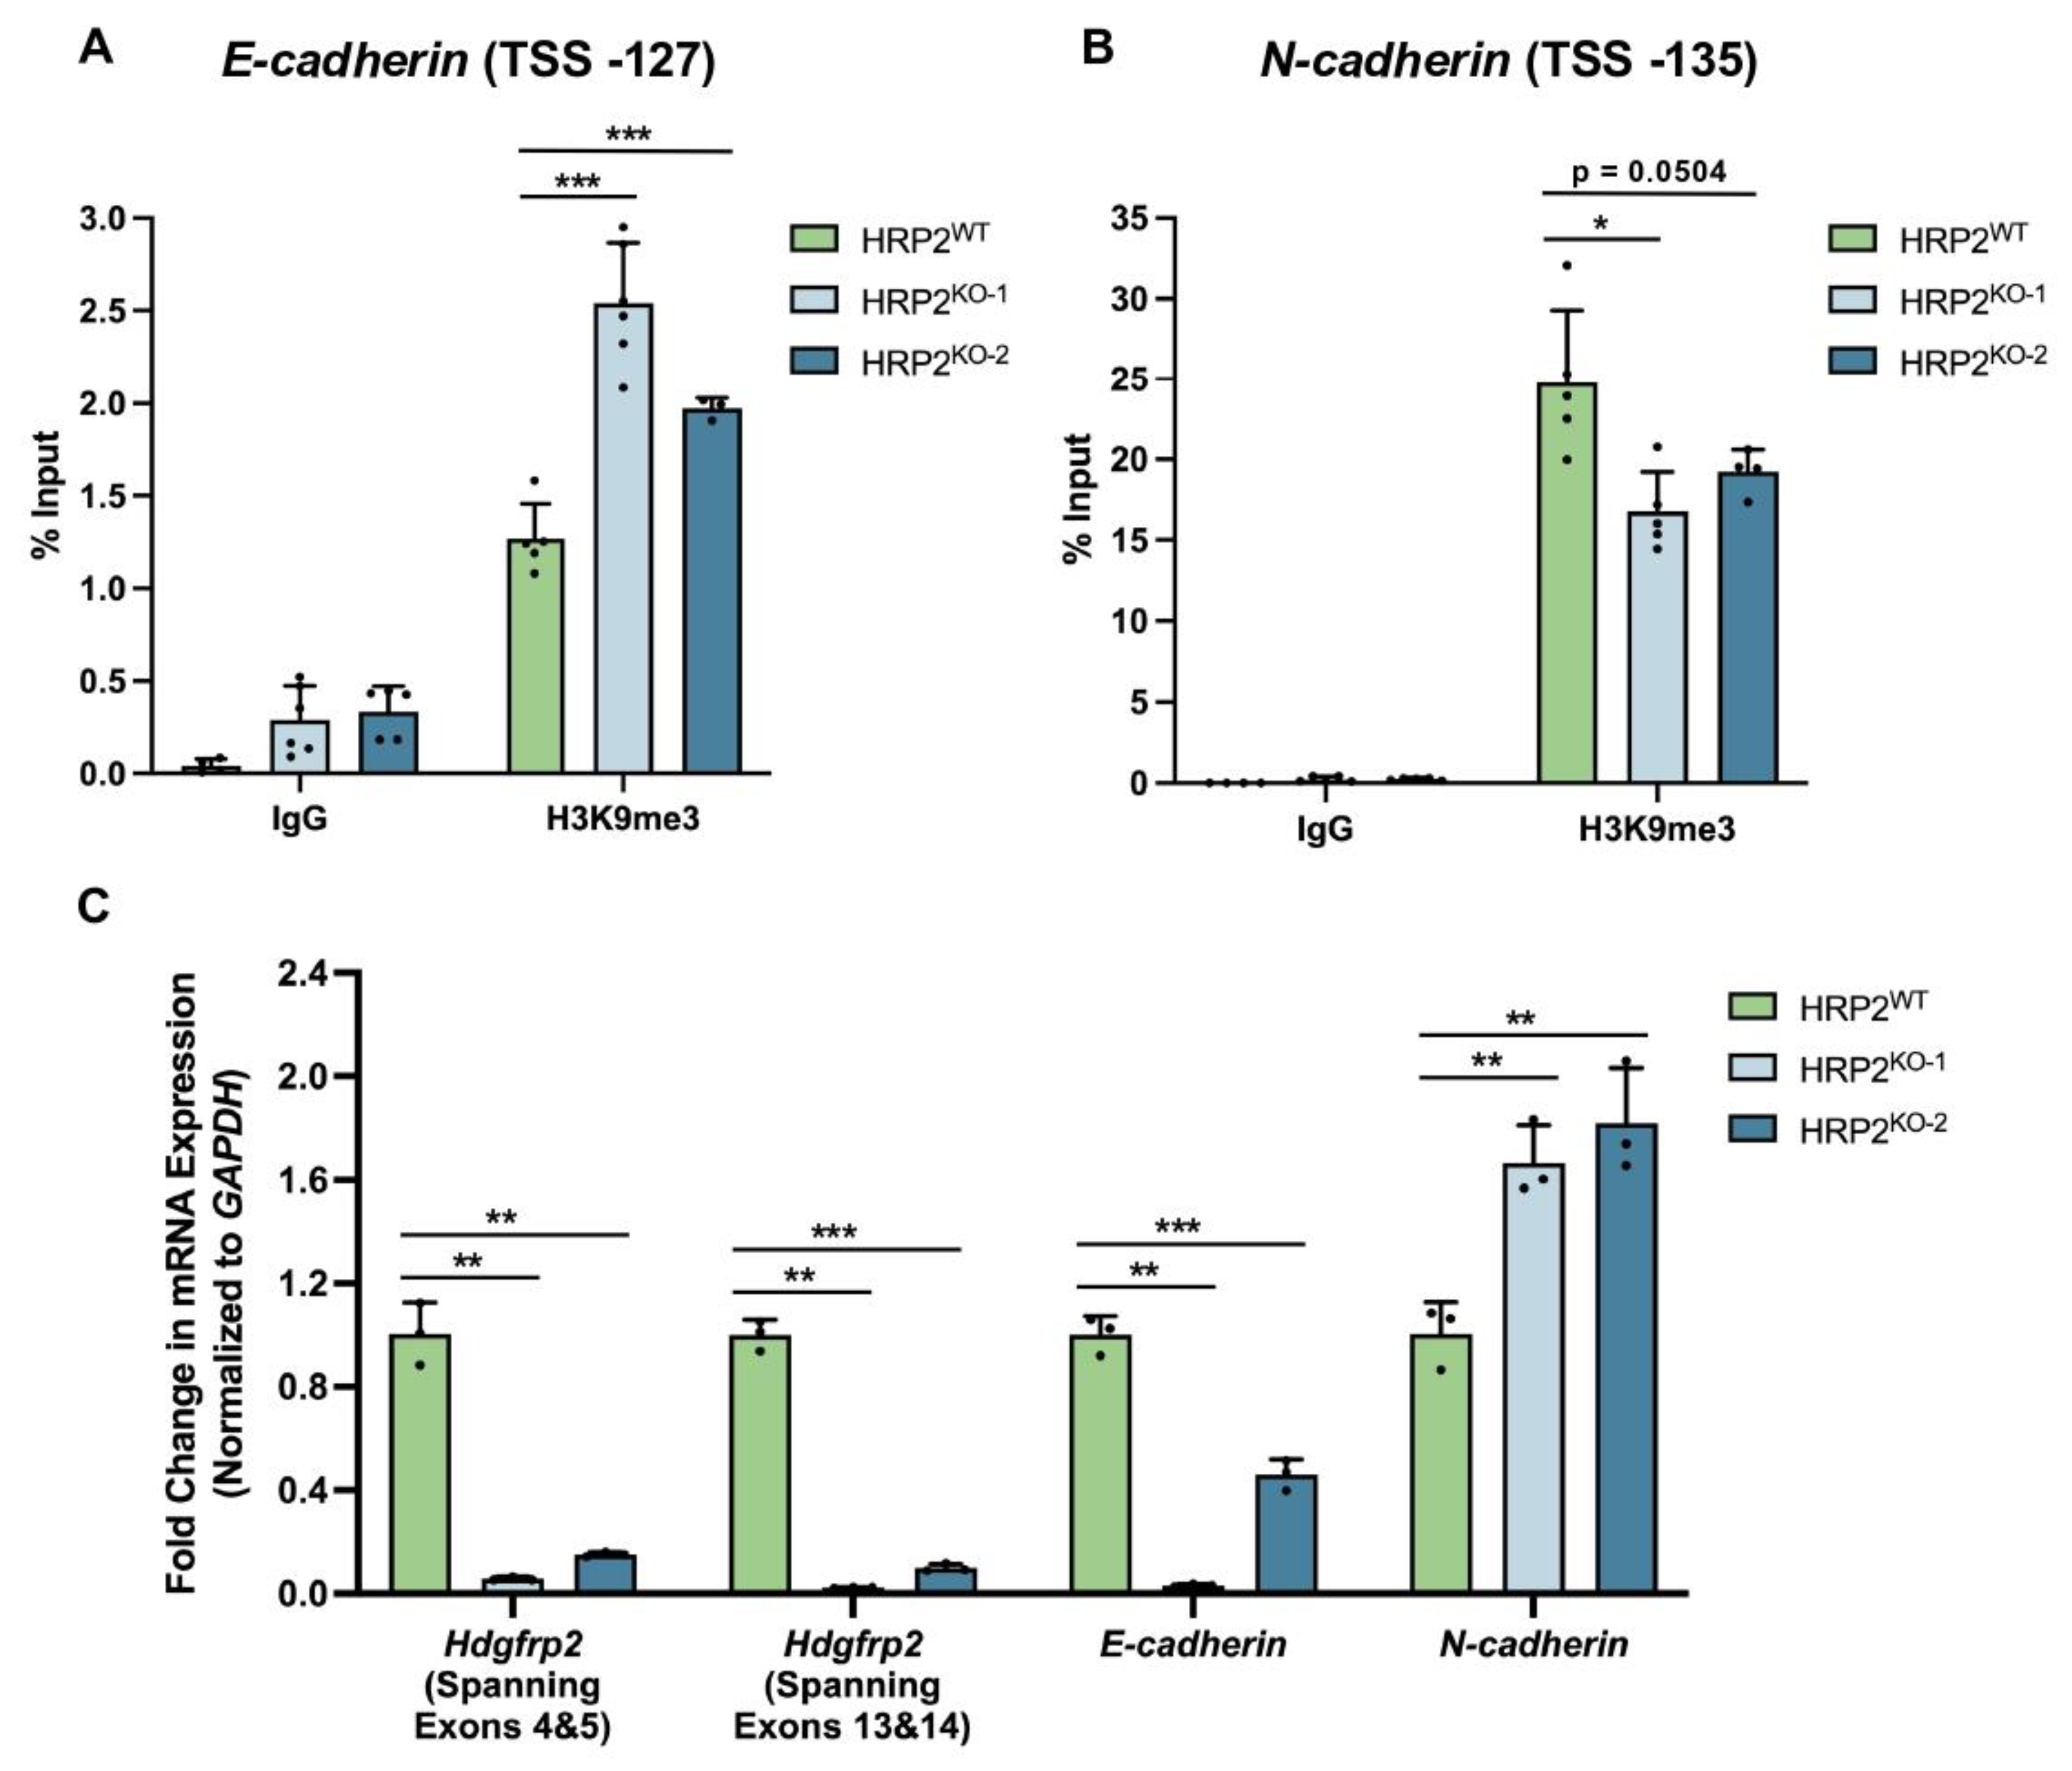
Hdgfrp2 expression in mESCs, revealing that inhibition of HRP2 expression leads to disruption of HP1α activity at a GFP reporter locus. We then biochemically explored the extent to which HRP2 engages with mediators of H3K9me3-marked heterochromatin. We found that HRP2 knockout delays HP1α-mediated gene silencing and impairs the stabilization of the condensed chromatin state. Furthermore, chromatin immunoprecipitation (ChIP)-qPCR revealed that HRP2 knockout impacts H3K9me3 occupancy at
E- and
N-cadherin, loci which are engaged by repressive epigenetic complexes to regulate tumorigenesis in MDA-MB-231 cells [
28,
29]. These epigenetic changes were further reflected in significantly altered patterns of mRNA expression, demonstrating downstream transcriptional consequences of a modified chromatin landscape. Combined with our protein-protein interaction and heterochromatin kinetics studies, these data suggest that HRP2 directly influences heterochromatin assembly and disassembly to regulate gene transcription.
2. Materials and Methods
2.1. Cell Lines and Culture Conditions
The Chromatin in vivo Assay (CiA) recruitment system, in mouse embryonic stem cells (mESC)s (CiA:mESC) contains Gal4 and Zinc Finger DNA-binding arrays and a downstream nuclear eGFP gene in place of a single
Oct4 allele as previously described [
30]. The CiA:mESC line containing the lentiviral construct N205 (N205: nLV EF-1α-ZFHD1-link-FKBP-HA <T2A> HP1αCS-Frbx2-V5-PGK-Blast) was used for shRNA experiments. mESCs were adapted to be grown on gelatin-coated plates without feeder cells in DMEM supplemented with 4.5 g/L glucose, 15% FBS, L-glutamate, sodium pyruvate, HEPES buffer, NEAA, 2-mercaptoethanol, LIF, and penicillin/streptomycin (mESC Media) at 37 °C with 5% CO
2. Media was aspirated and replaced daily.
The CiA recruitment system in HEK293T (CiA:293T) cells were engineered as previously described [
26]. 293T, CiA:293T, and MDA-MB-231 cells were cultured in DMEM supplemented with 4.5 g/L glucose, 10% FBS, HEPES buffer, 2-mecaptoethanol, and penicillin/streptomycin at 37 °C with 5% CO
2. The MDA-MB-231 cell line was obtained from UNC Lineberger Comprehensive Cancer Center’s Tissue Culture Facility.
2.2. shRNA Construction
The doxycycline-inducible lentiviral vector pTRIPZ containing the nonsense (scramble) shRNA was used as the backbone for all subsequent shRNA cloning. The forward and reverse complement of shRNA-containing oligos (
Table S1). were synthesized and slowly annealed together in an annealing buffer (10 mM Tris pH 7.5–8, 1 mM EDTA, 50 mM NaCl) to create dsDNA by raising the sample to 95 °C for 5 min and cooling the samples 1 °C/min until reaching room temperature. pTRIPZ vector and insert were digested using XhoI and EcoRI-HF (NEB, Ipswich, MA) and ligated using T4-ligase according to manufacturer instructions. Ligated constructs were transformed into One Shot Stabl3 Chemically Competent
E. coli cells (ThermoFisher, Waltham, MA, USA) and grown on LB ampicillin agarose plates. Ligation was confirmed by DNA sequencing.
2.3. Lentiviral Transduction
For each viral construct to be packaged, 1.8 × 10⁷ 293T-X cells were seeded three days prior to lentiviral transduction. Two days before transduction, cells were PEI-transfected with 18 μg desired plasmid DNA construct, 4.5 μg N74 plasmid (expressing VSV-G envelope protein; 12259, Addgene, Watertown, MA, USA), 13.5 μg N75 plasmid (expressing Gag-Pol protein; 12260, Addgene,), 108 μL PEI, and 1.8 mL Opti-MEM. Sixteen hours post-transfection, toxic PEI media were removed and replaced with 25 mL of fresh media. Cells were left to produce packaged lentiviral particles for 48 h. The day prior to transduction, target cells were seeded in a 12-well format (appropriate seeding density varied by cell line). On the day of transduction, lentiviral media were carefully transferred to 50 mL conicals and centrifuged at 5000 rpm for 5 min. Without disrupting the pellet, the supernatant was removed and transferred to a 38.5 mL, open-top thin-wall ultra-clear tube, 25 × 89 mm (344058, Beckman Coulter, Brea, CA, USA). Tubes containing lentiviral media were spun at 20,000 rpm for 2.5 h at 4 °C using an SW-32 swinging rotor and buckets. The supernatant was carefully removed, and viral pellets were resuspended in 100 μL 1X PBS and added dropwise (appropriate amount of concentrated virus varied by cell line) to target cells containing 0.5 μg/mL polybrene media (Santa Cruz Biotechnology, Dallas, TX, USA). Cell plates were spun at 1000× g for 25 min at room temperature and then stored at 37 °C. Sixteen hours post-transduction, toxic viral media were removed and replaced with 1 mL of fresh media. Antibiotic selection began 48 h after media change.
2.4. shRNA Knockdown
Day 0, CiA:mESCs containing stably integrated doxycycline-inducible shRNA constructs were seeded into 96- or 24-well tissue culture plates with 10,000 or 50,000 cells per well, respectively. Day 1, media was aspirated and replaced with fresh mESC media +/− 6 nM rapamycin and +/− 1 μg/mL doxycycline to induce both csHP1α recruitment and shRNA induction as appropriate. On day 2, media was aspirated and replaced with fresh ES media +/− 6 nM rapamycin and +/− 1 μg/mL doxycycline. On day 3, media was aspirated and the cells were washed with PBS prior to cell trypsinization and sample preparation. A 96-well plate was used for flow cytometry analysis as described below. Single-cell populations were gated into GFP+ and GFP- populations. The experiment was performed in biological triplicate. Total RNA was isolated from CiA:mESCs grown in 24-well plates, extracted, and analyzed as described in “RNA Extraction and qRT-PCR.”
2.5. RNA Extraction and qRT-PCR
RNA was isolated in biological triplicate using RNeasy Plus Mini Kit according to the manufacturer’s protocol (74034, Qiagen, Hilden, Germany). Each RNA sample was eluted with 30 μL dH
2O. All RNA samples were diluted by the same factor yield concentrations between 5–20 ng. RNA enrichment was quantified by qRT-PCR using Power SYBR Green RNA-to-CT 1-Step Kit (4389986, Applied Biosystems, Waltham, MA, USA) using the primers listed in
Table S2. All RNA experiments were performed in biological triplicate and normalized to
β-actin or
GAPDH.
2.6. Flow Cytometry
For shRNA experiments, cell sorting was performed on a BD FACSAria II cell sorter. Upon doxycycline induction, turboRFP+ cells were sorted to enrich populations that were expressing the inducible pTRIPZ vector used for shRNA knockdown experiments. Flow cytometry was performed using an Intellicyt iQue Screener and analyzed with FlowJo software. Cell populations were gated based on forward and side scatter areas. Single-cell populations were isolated using forward scatter area by forward scatter height gating. Dead or dying cells that equally fluoresced in the GFP and APC channels upon excitation with 488 nm laser were omitted as autofluorescent. Cells were again sorted for RFP+ to include only those highly expressing shRNA constructs, and the remaining cells were gated into GFP- and GFP+ populations. Dot plots and histograms demonstrate representative samples while bar graphs and charts contain all biological replicates. Percent inhibition was calculated using the following formula: % Inhibition = [1 – (x − min)/(max − min)], where min = percentage of GFP+ scramble cells with CIP-HP1α recruitment, max = percentage of GFP+ scramble cells without CIP-HP1α recruitment, and x = percentage of GFP+ target cells with CIP-HP1α recruitment.
For HP1α recruitment and release time-course experiments, flow cytometry was performed using a ThermoFisher Attune NxT Flow Cytometer and analyzed with FlowJo software. Cell populations were gated based on forward and side scatter areas to identify live cells. Single-cell populations were isolated using forward scatter area by forward scatter height gating. The remaining cells were gated into GFP- and GFP+ populations. Dot plots and histograms demonstrate representative samples while bar graphs contain all biological replicates.
2.7. Generation and Validation of CRISPR/Cas9-Mediated HRP2 Knockout Lines
293T and CiA:293T HRP2 knockout lines were generated through transient transfection of 0.86 μg lenti-Cas9 plasmid (52962, Addgene) and 1.67 μg of
Hdgfrp2-targeted CRISPR dual-cut gRNA-1, -2, or -3 plasmid (acquired from Transomic Technologies, Inc., Huntsville, AL, USA) or non-targeting, NT (previously published) [
31]. Of note, each of these CRISPR dual-cut guides cleaves the gene-of-interest at more than one target site to increase knockout efficiency. The day prior to transfection, a 6-well plate was seeded with 5 × 10
5 293T or CiA:293T cells. The following day, 2.5 μg DNA (lenti-Cas9 + gRNA), 3.75 μL PEI, and 62.5 μL Opti-MEM were sterilely added to a microfuge tube, gently agitated, and incubated at room temperature for 15 min. The transfection mix was slowly dripped onto cells (one tube of transfection mix per well), and cells were stored at 37 °C. Sixteen hours after transfection, toxic PEI media were removed and replaced with fresh media. A total of 24 h after media change, 12 ng/μL blasticidin and 0.15 ng/μL puromycin were added to cells to select for those successfully transfected with lenti-Cas9 and
Hdgfrp2-targeted gRNA, respectively. A total of 12 ng/μL blasticidin and 300 ng/μL zeocin were added to cells to select for those successfully transfected with lenti-Cas9 and NT gRNA, respectively. Approximately one week after transfection, 5 × 10
6 of each cell type were harvested for Western blotting and densitometry analysis, whereby HRP2 protein levels were normalized to those of GAPDH and then compared to non-targeting cells to determine which
Hdgfrp2-targeted gRNA was most efficacious at CRISPR/Cas9 gene editing. Cells from the most highly-edited
Hdgfrp2-targeted gRNA-containing cell line were diluted into 96-well plates with a target of one cell per well to grow pure potential HRP2 knockout colonies. Wells containing zero or more than one cell were discarded. Potential HRP2 knockout colonies were then analyzed by Western blot analysis to confirm successful knockout. Successful HRP2 knockout colonies were validated by RNA extraction (see “RNA Extraction and qRT-PCR”) and immunofluorescence microscopy (see “Immunofluorescence Microscopy”).
MDA-MB-231 HRP2 knockout line was generated through stable lentiviral transduction (see “Lentiviral Transduction” above). Briefly, two days prior to transduction, 293T-X cells were PEI-transfected with lenti-Cas9, Hdgfrp2-targeted gRNA-3, or NT gRNA and lentiviral packaging plasmids. Toxic PEI media were removed and replaced with fresh media after 16 h. The day before transduction, a 12-well plate was seeded 1 × 10⁵ MDA-MB-231 cells per well. A total of 10 μL concentrated lenti-Cas9 virus and 20 μL concentrated gRNA virus was added to each well of MDA-MB-231 cells. A total of 48 h after transduction, cells were treated with 12 ng/μL blasticidin and 0.15 ng/μL puromycin to select for those stably transduced with lenti-Cas9 and Hdgfrp2-targeted gRNA, respectively. A total of 12 ng/μL blasticidin and 300 ng/μL zeocin were added to cells to select for those stably transduced with lenti-Cas9 and NT gRNA, respectively. To isolate and validate pure HRP2 knockout lines, the same procedure was used as described for 293T and CiA:293T cells. Of note, immunofluorescence microscopy was only used to validate HRP2 knockout in 293T cells.
2.8. Co-Immunoprecipitation and Western Blot Analysis
In microtubes, approximately 1 × 10⁷ cells per sample were harvested with 0.05% trypsin, pelleted, and washed with 1X PBS. On ice, cell pellets were resuspended in 1 mL M-PER Mammalian Protein Extraction Reagent (78501, ThermoFisher), treated with 1 μL protease inhibitors (100×) and 1 μL benzonase, and mixed by pipetting. Microtubes were incubated at 37 °C for 10 min and then inverted at room temperature for an additional 20 min. Microtubes were spun at max speed for 5 min and resulting supernatants were transferred to clean microtubes on ice. Protein concentrations were measured by Bradford assay.
Protein G Dynabeads (20 μL beads per immunoprecipitation reaction) were washed on a magnet three times with 500 μL PBST and then resuspended in 500 μL PBST. To each bead mixture, 1 μg IP primary antibody (α-HRP2 or α-HP1α) was added and inverted at room temperature for 40 min. Beads were washed on a magnet three times with 500 μL PBST then resuspended in 20 μL PBST. A total of 800 μg of protein was added to each 20 μL bead mixture to a final volume of 500 μL and inverted at 4 °C overnight.
The following day, samples were spun down gently for 30 s and placed on a magnet to remove the remaining lysate. Beads were washed on a magnet three times with wash buffer (50 mM HEPES, 1% NP-40, 150 mM NaCl in dH2O) then resuspended in 10.5 μL PBST. A total of 3.5 μL 4X loading dye was added to each sample (including 20 μg of whole cell lysate input), and samples were boiled at 95 °C for 5 min. Using a magnet for IP samples, all samples were loaded onto 4–20% polyacrylamide gels and run at 200 V for 40 min. Gels were transferred onto 0.45 μm PVDF membranes (IPFL00010, MilliporeSigma, Burlington, MA, USA) at 100 V for 1 h. Membranes were incubated with primary antibodies rocking overnight at 4°C, washed three times with PBST, incubated with secondary antibodies (1:10,000 in PBST, 0.1% SDS) rocking for 1 h at room temperature, then washed three times with PBST (see “Antibodies” below). Membranes were imaged using the LI-COR Odyssey.
2.9. Immunofluorescence Microscopy
Glass coverslips (CLS-1764-1818, Corning, Corning, NY, USA) were laid in 6-well plates and sterilized by UV light for 10 min. Coverslips were coated with 0.1% porcine gelatin for 10 min, aspirated, and allowed to air dry inside the tissue culture hood. A total of 4 × 10⁵ cells were plated in each well and allowed to settle for 48 h. Quickly after removal from the incubator, cells were fixed with 4% paraformaldehyde in 1× PBS for 10 min at room temperature. Coverslips were rinsed 3 times for 5 min each with PBST (0.1% Tween 20; P9416-100ML, Sigma-Aldrich, St. Louis, MO, USA) to remove traces of fixative. Cells were permeabilized in 0.1% Triton X-100 (X100-500ML, Sigma-Aldrich) in 1X PBS for 15–20 min while rocking. Coverslips were rinsed 3 times for 5 min each with PBST. Cells were blocked in 5% BSA + 0.25% Triton X-100 in 1X PBS for 30 min to 1 h, then the blocking buffer was aspirated. The primary antibody (see “Antibodies” below) was diluted in fresh blocking buffer, and 1 mL per well was added to cells and incubated overnight at 4 °C. One well of each cell type was omitted from this step (incubated in blocking buffer only) to control for background staining of secondary antibodies. Coverslips were rinsed 3 times for five minutes each with PBST. The secondary antibody (see “Antibodies” below) was diluted in fresh blocking buffer, and 1 mL per well was added to cells and incubated for 1 h at room temperature, protected from light. Coverslips were rinsed 3 times for 5 min each with PBST. Since the mountant (P36962, Invitrogen, Waltham, MA, USA) contained DAPI, coverslips were simultaneously counterstained and mounted onto microscope slides (12-544-2, ThermoFisher) without creating bubbles. Coverslips were sealed with clear nail polish. Microscope slides were imaged using an Olympus IX71 inverted, fluorescent microscope containing a U-HGLGPS illumination system. Images were processed using ImageJ software.
2.10. Sucrose Density Gradient Ultracentrifugation and Fractionation
Sucrose 20% w/v solution (8590-OP, Sigma-Aldrich) was diluted in sucrose solution buffer (10% 1× PBS, 0.2% 500 mM EDTA, 0.5% Triton X-100 in dH2O). Protease inhibitors (100X) were diluted in both 5% and 20% sucrose solutions and kept on ice. Carefully without mixing layers, each gradient was poured into the bottom of a 14 mL, polypropylene tube, 14 × 95 mm (331374, Beckman Coulter) in the following order: 2.5 mL 20% sucrose solution, 2.5 mL of 2:1 (20% to 5%) sucrose solution, 2.5 mL 1:2 (20% to 5%) sucrose solution, and 2.5 mL 5% sucrose solution. Tubes were plugged with stoppers and slowly tilted until the gradient tubes rested horizontally to diffuse for 2 min, then slowly tilted vertically to diffuse at 4 °C overnight.
An SW Ti-40 rotor and buckets were pre-chilled at 4 °C while cell lysates were prepared. Approximately 1 × 10⁷ cells were harvested per condition (non-targeting or HRP2 knockout) using 0.05% trypsin, and cell pellets were transferred to microtubes and washed with 1X PBS. An amended version of the Abcam Nuclear Fractionation Protocol was used to access nuclear lysates. Briefly, buffers A (10 mM HEPES, 1.5 mM MgCl2, 10 mM KCl, 0.5 mM DTT, 0.05% NP-40) and B (5 mM HEPES, 1.5 mM MgCl2, 0.2 mM EDTA, 0.5 mM DTT, 26% v/v glycerol) were prepared and stored on ice. Fresh protease inhibitors (100X) were added to buffer A before contact with cell pellets. A total of 1 mL buffer A was then added to each cell pellet, mixing thoroughly by pipetting. Microtubes were left on ice for 10 min, then centrifuged at 3000 rpm for 10 min at 4 °C. Supernatant from each microtube was removed, transferred to a clean microtube labeled “cytoplasmic extract,” and kept on ice. On ice, the pellets were resuspended in 376 μL buffer B, and 24 μL of 5 M NaCl and 1 μL benzonase were added and mixed. A total of 10 μL of each sample was set aside to check nuclei before homogenization. Samples were incubated at 37 °C for 30 min to activate the benzonase, then samples were homogenized with a Dounce homogenizer (40 strokes with pestle A, 40 strokes with pestle B). A total of 10 μL of each sample was set aside to check nuclei after homogenization. Microtubes were left on ice for 30 min and vortexed often. Nuclei samples were suspended in Trypan blue to a final concentration of 1X and loaded into microscope slides for examination. After confirmation that nuclei were successfully lysed, microtubes were centrifuged at 21,000× g for 20 min at 4 °C. Supernatant from each microtube was removed, transferred to a clean microtube labeled “nuclear extract,” and kept on ice.
Thyroglobulin (200 μL of 20 mg/mL thyroglobulin in 50 mM Tris-HCl pH 7.5, 100 mM KCl, and dH2O) and Precision-Plus (10 μL Precision-Plus Protein Standards in 190 μL sucrose buffer solution) standards were prepared on ice. Bradford assay was used to determine the protein concentrations of each cytoplasmic and nuclear extract sample. Carefully without disrupting gradient, 1.3 mg of nuclear extract or protein standard (to an equal final volume for all samples and standards to avoid non-experimental differences in gradient migration) was loaded on top of the gradient.
Gradient tubes (unplugged) were loaded into the SW Ti-40 buckets and sealed. If necessary, a small amount of sucrose buffer solution was added to the top of a gradient to balance the buckets. Buckets were then loaded onto the rotor in the ultracentrifuge and spun at 250,000× g for 16 h at 4 °C. Microtubes for fraction collecting were pre-labeled 1–21 and set on ice. Samples were removed from ultracentrifuge without disrupting gradients. One gradient at a time was kept out for fractionation, and all other gradient tubes were kept at 4 °C. Using a p1000, carefully removed 500 μL from the top of the gradient without dipping below the meniscus and without expelling any sample to avoid mixing the gradient. Fraction 1 was transferred to its respective microtube on ice. Fractionation was repeated until the entire gradient was removed from the gradient tube and then until each gradient tube was fractionated. A total of 10.5 μL of each fraction from all samples were transferred to clean microtubes on ice for Western blot analysis or SYPRO Ruby staining. The remaining samples were stored at −80 °C. A total of 3.5 μL of 4X loading dye was added to each 10.5 μL fraction (including 10 μg of cytoplasmic and nuclear inputs), and samples were boiled at 95 °C for 5 min. Inputs and fractions were loaded onto 4–20% polyacrylamide gels and run at 200 V for 40 min.
Gels containing protein standards were transferred into 20 mL fixed solution (50% methanol, 7% acetic acid) and incubated with rocking for 30 min at room temperature. Disposed of fix buffer and repeated with fresh fix buffer. Disposed of fixed buffer and incubated with 40 mL SYPRO Ruby Protein Gel Stain (ThermoFisher) with rocking overnight at room temperature. Disposed of staining buffer, added 20 mL wash buffer (10% methanol, 7% acetic acid), and incubated with rocking for 15 min at room temperature. Disposed of wash buffer and repeated with fresh wash buffer. Disposed of wash buffer, added 20 mL dH2O, and incubated with rocking for 5 min at room temperature. Gels were imaged using an E-Gel Imager (Life Technologies, Carlsbad, CA, USA).
Gels containing nuclear extract fractions were transferred onto 0.45 μm PVDF membranes as described above under “Co-Immunoprecipitation and Western Blot Analysis” and incubated with primary antibodies against HRP2, HP1α, MPP8, GAPDH, and BRD4 (see “Antibodies” below). Following incubation with secondary antibodies, membranes were imaged using the LI-COR Odyssey and aligned in order of fraction for migration analysis.
2.11. Chromatin Immunoprecipitation (ChIP) and qPCR
ChIP was performed as previously described in Waybright et al. 2021 with minor adjustments [
26]. Briefly, 16 × 10
6 MDA-MB-231 non-targeting (HRP2
WT) or HRP2 knockout (HRP2
KO) cells were harvested in biological duplicate to allow for 3.2 × 10
6 cells per antibody during the immunoprecipitation (IP) step. Cells were formaldehyde crosslinked, nuclei were isolated, and chromatin was sonicated to 200–500 bp fragments. Inputs were purified using a Qiagen MinElute PCR Purification Kit while the remaining chromatin was immunoprecipitated with 2 μg antibody (α-IgG or α-H3K9me3) using 20 μL Protein G Dynabeads (ThermoFisher) per IP sample. IP samples were purified using a Qiagen MinElute PCR Purification Kit, and samples were analyzed using the percent input method following qPCR (QuantStudio ViiA 7 System). Primers are listed in
Table S3.
2.12. Antibodies
The following primary antibodies were used for immunoblot analysis: α-HRP2 (0.5 μg/mL; 15134-1-AP, Proteintech, Rosemont, IL, USA), α-HP1α (2 μg/mL; bsm-33377M, Bioss, Woburn, MA, USA), α-MPP8 (1:1000; 16796-1-AP, Proteintech), α-H3K9me3 (1:1000; ab8898, Abcam, Cambridge, United Kingdom), α-GAPDH (1:2000; ab8245, Abcam), α-BRD4 (1:5000; ab128874, Abcam), α-TASOR (1:500; HPA006735, Atlas, Bromma, Sweden).
The following secondary antibodies were used for immunoblot analysis: IRDye 800CW Goat anti-Rabbit IgG (1:10,000; 925-32211, LI-COR, Lincoln, NE, USA), IRDye 680RD Goat anti-Mouse IgG (1:10,000; 925-68070, LI-COR).
The following antibodies were used for immunofluorescence staining: α-HRP2 (1:1000; 15134-1-AP, Proteintech), α-β actin (1:200; ab8226, Abcam), Goat anti-Rabbit IgG AlexaFluor 488 (1 μg/mL; ab150077, Abcam), Goat anti-Mouse IgG AlexaFluor 568 (1 μg/mL; A11004, ThermoFisher).
The following antibodies were used for ChIP at 2 μg per IP: α-IgG (011-000-003, Jackson ImmunoResearch, West Grove, PA, USA), α-H3K9me3 (ab8898, Abcam).


